Article

Preparation and Study of Bright Orange-Yellow Long Persistent Luminescent Ca2LuScGa2Ge2O12:Pr3+ Phosphor

1
State Key Laboratory of Rare Earth Resource Utilization, Changchun Institute of Applied Chemistry, Chinese Academy of Sciences, 5625 Renmin Street, Changchun 130022, China
2
School of Applied Chemistry and Engineering, University of Science and Technology of China, Hefei 230026, China
*
Authors to whom correspondence should be addressed.
Photochem 2025, 5(4), 38; https://doi.org/10.3390/photochem5040038
Submission received: 1 September 2025 / Revised: 11 November 2025 / Accepted: 14 November 2025 / Published: 18 November 2025

Abstract

Long persistent phosphors are widely used in many fields, such as LED, bioimaging, urgent lighting, temperature sensors, etc. Although green and blue long persistent phosphors are well developed, efficient orange-yellow long persistent phosphors are still relatively rare. In this work, a novel orange-yellow long-persistent phosphors Ca2LuScGa2Ge2O12:xPr3+ (CLSGGO:xPr3+, x = 0.003, 0.005, 0.01, 0.02, 0.03, 0.04, 0.05) are prepared and systematically investigated through its crystal structural information, photoluminescence, and persistent luminescence properties. Under ultraviolet light excitation, these phosphors exhibit orange-yellow emission stemming from the 3P0 and 1D2 multiple electron transitions in the 4f level of Pr3+ ion. In addition, the material exhibits bright persistent luminescence. The complex garnet matrix structure of Ca2LuScGa2Ge2O12 provides excellent conditions for the formation of traps. Through the testing of thermoluminescence curve and function fitting, the density and depth of traps are studied; also, the storage and release process of carriers in the material are calculated in detail. A reasonable persistent luminescence mechanism is proposed for CLSGGO:0.01Pr3+. This work enriches the research content of photoluminescence and long persistent luminescence of Pr3+-doped garnet-based phosphors and paves the way for the future research of long persistent luminescent materials doped with rare earth ions.

1. Introduction

Long persistent luminescence (LPL) is a peculiar optical phenomenon suggesting that continuous luminescence exists after ceasing the excitation process. Since Matsuzawa et al. first reported aluminates green LPL materials (SrAl2O4:Eu3+, Dy3+) in 1996, LPL materials have attracted tremendous attention and been widely used in various fields such as night lighting, optical storage, and biomedical sciences [1]. Although significant progress has been achieved in green and blue LPL materials, orange-yellow LPL phosphors emitting at longer wavelength (550–600 nm) are relatively lacking [2,3,4,5]. To date, most orange-yellow LPL materials are based on complex co-doping (e.g., Eu2+/Dy3+, Ce3+/Mn2+) systems, which resulted in problems of poor color purity, higher cost, and more complex preparation process [6,7,8,9,10]. Single-doped system is a potential option, but orange-yellow LPL phosphors based on it are still scarce, and are suffering from defects of short persistent luminescent duration and insufficient thermal stability (quenching severely when temperature > 400 K) [11,12]. Therefore, preparation of orange-yellow LPL phosphors with high performances is still important.
To achieve excellent performance of the LPL phosphors, several key factors should be taken into account, such as dopped activators, hosts, and defects. Many f-f transitions in the Pr3+ ions and wide range of emission peaks could be achieved from the Pr3+ ions, 3P03H5 (green light), 1D23H4 (red light) [13,14]. Potential cross-relaxation processes could also happen in Pr3+-doped phosphors. The emission spectra of the Pr3+-dopped phosphors could be further manipulated via defect engineering methods [15,16]. In the conventional hosts, the emission of Pr3+-dopped phosphors locates predominantly in the red spectral region, while that in the orange-yellow region is relatively rare and highly dependent on energy transfer or host sensitization processes [17,18,19]. Emission peak broadening and chromaticity coordinate deviation (ΔCIE > 0.05) occurs in the Pr3+-based LPL phosphors at high temperatures due to the thermal perturbation of 4f→5d energy levels [20]. Hosts with garnet structures (A3B5O12) are widely applied in the LPL phosphors because of their advantages of controllable crystal field strength [21,22,23]. When it is used as the host of rare earth-dopped system, strong crystal field splitting (~104 cm−1) could be achieved, and correspondingly suppress the non-radiative transitions in the system, leading to higher luminescence performances [24,25,26,27]. Although intensive research works based on the garnets LPL have been reported, most of them focused on the Eu2+/Cr3+ doping systems, and the LPL phosphors based on the Pr3+-dopped garnets are relatively rare [28,29,30]. It still needs to be investigated further how to achieve the orange-yellow sharp peak emission of Pr3+ through the manipulation of garnet lattice and how the defect types (such as oxygen vacancies, cation vacancies, etc.) affect the persistent luminescent duration and color stability.
In this work, a series of Pr3+ single-doped orange-yellow LPL phosphors Ca2LuScGa2Ge2O12:xPr3+ (CLSGGO:xPr3+, x = 0.003, 0.005, 0.01, 0.02, 0.03, 0.04, 0.05) are prepared. The structure and persistent luminescent properties of the phosphors were systematically characterized. The density and depth of traps in the samples with different Pr3+-doping concentrations are studied in detail through thermoluminescence curve tests and first-order kinetic function fitting, revealing the influence of Pr3+-doping concentration on the trap properties in the material. In addition, the thermoluminescence curve results of CLSGGO:0.01Pr3+ under different excitation times, different decay times, and different excitation temperatures revealed the carrier capture and release processes in the material. The relationship between the LPL decay curve and the decay time proved that the carrier energy transfer process between traps and luminescent centers mainly originated from the tunneling effect. Finally, based on the above photoluminescence and persistent luminescence characterizations, an electron capture model is proposed to describe the mechanism of photoluminescence and persistent luminescence phenomena in CLSGGO:xPr3+.

2. Materials and Methods

2.1. Preparation of Ca2LuScGa2Ge2O12:xPr3+ (x = 0.003, 0.005, 0.01, 0.02, 0.03, 0.04, 0.05)

A series of Ca2LuScGa2Ge2O12:xPr3+ (x = 0.003, 0.005, 0.01, 0.02, 0.03, 0.04, 0.05) are prepared through a conventional high-temperature solid-state reaction method. Stoichiometric amounts of the raw materials CaCO3 (99.99%, Shanghai, China, Aladdin), Lu2O3 (99.99%, Shanghai, China, Aladdin), Sc2O3 (99.99%, Shanghai, China, Aladdin), Ga2O3 (99.99%, Shanghai, China, Aladdin), GeO2 (99.99%, Shanghai, China, Aladdin), and Pr6O11 (99.99%, Shanghai, China, Aladdin) are homogeneously mixed in an agate mortar and ground for 30 min. Then, the mixture is put into an alumina crucible and sintered at 1400 °C for 360 min in air. The heating protocol is initiated at a ramp rate of 3 °C/min until reaching 300 °C, followed by an increased heating rate of 5 °C/min up to 1400 °C. The temperature is maintained at 1400 °C for 360 min, subsequently cooled at a controlled rate of 5 °C/min to 800 °C, and finally allowed to cool naturally to ambient temperature. Post-cooling, the samples are ground into fine powders for subsequent characterization analyses.

2.2. Characterizations

The crystalline structures of the phosphor powders are identified by X-ray diffraction (XRD) using a D8 Focus diffractometer (Bruker Corporation, Germany) at 40 kV and 40 mA with graphite-monochromated Cu Kα radiation (λ = 0.15405 nm). Diffusion reflectance (DR) spectra are measured by RG-5000J UV-vis-NIR spectrophotometer (Zhong Tian Rui Guang, Tianjin, China). The morphology, micro-structures, and element mappings of the samples are characterized by using a spherical aberration corrected transmission electron microscope (Cs-TEM, Themis Z, ThermoFisher, Waltham, MA, USA) equipped with high-angle annular dark field scanning transmission electron microscopy (HAADF-STEM, ThermoFisher, Waltham, MA, USA) detector and super-X energy dispersive spectrometer (EDS, ThermoFisher, Waltham, MA, USA). The photoluminescence excitation and photoluminescence spectra are recorded with FLS-920 (Edinburgh Instruments, Livingston, UK). The Photoluminescence Quantum Yield (PLQY) conducted measurements using the Edinburgh FLS1000 (Edinburgh Instruments, Livingston, UK). The TOSL-3D06A type thermoluminescence three-channel spectrometer (Guangzhou Rongfan Technology Co., Ltd, Guangzhou, China) is used to test the thermoluminescence curves of the samples, with the excitation light source being the equipped mercury lamp. Before conducting the thermoluminescence curve tests, the samples are annealed at 300 °C for 2 h to remove the charge carriers stored in the sample traps, and the samples are stored in the dark to avoid the influence of light on the materials.

3. Results

3.1. Crystal Structure

The XRD patterns of CLSGGO:xPr3+ (x = 0.003, 0.005, 0.01, 0.02, 0.03, 0.04, 0.05) are depicted in Figure 1, where all the diffraction peaks of the samples match well with the standard card PDF#77-1888, implying that the CLSGGO:xPr3+ samples are successfully prepared with pure phase, and the Pr3+ ions are incorporated into the host [31].
In the CLSGGO host, Ca and Lu coordinate with O to form an octahedral dodecahedron; Ga, Ge, and Sc coordinate with O to form an octahedral hexahedron; and Ga and Ge coordinate with O to form a tetrahedral tetracoordinate. Based on the ionic valence and coordination number, the occupancy of Pr3+ can be roughly determined. Generally, the radius difference between the doped ion and the host ion can be judged by the following formula [32,33]:
D r   =   R m C N     R d ( C N ) R m ( C N )   ×   100 %
Among them, Dr is the percentage difference in radius between the host ion and the doped ion. When Dr is less than 30%, it indicates that the doped ion can occupy the site of the host ion. Rm represents the host ion, Rd represents the doped ion, and CN is the coordination number. When CN is 8, the ionic radii of Pr3+, Lu3+, and Ca2+ are 1.126 Å, 0.977 Å, and 1.12 Å, respectively. According to the calculation, the Dr values of Lu3+ and Ca2+ with respect to Pr3+ are 13.3% and 0.53%, respectively, which indicates that, theoretically, Pr3+ can occupy the sites of Lu3+ and Ca2+ in the matrix. Additionally, Lu3+ and Pr3+ have the same valence. Therefore, Lu3+ is more likely to be occupied by Pr3+.
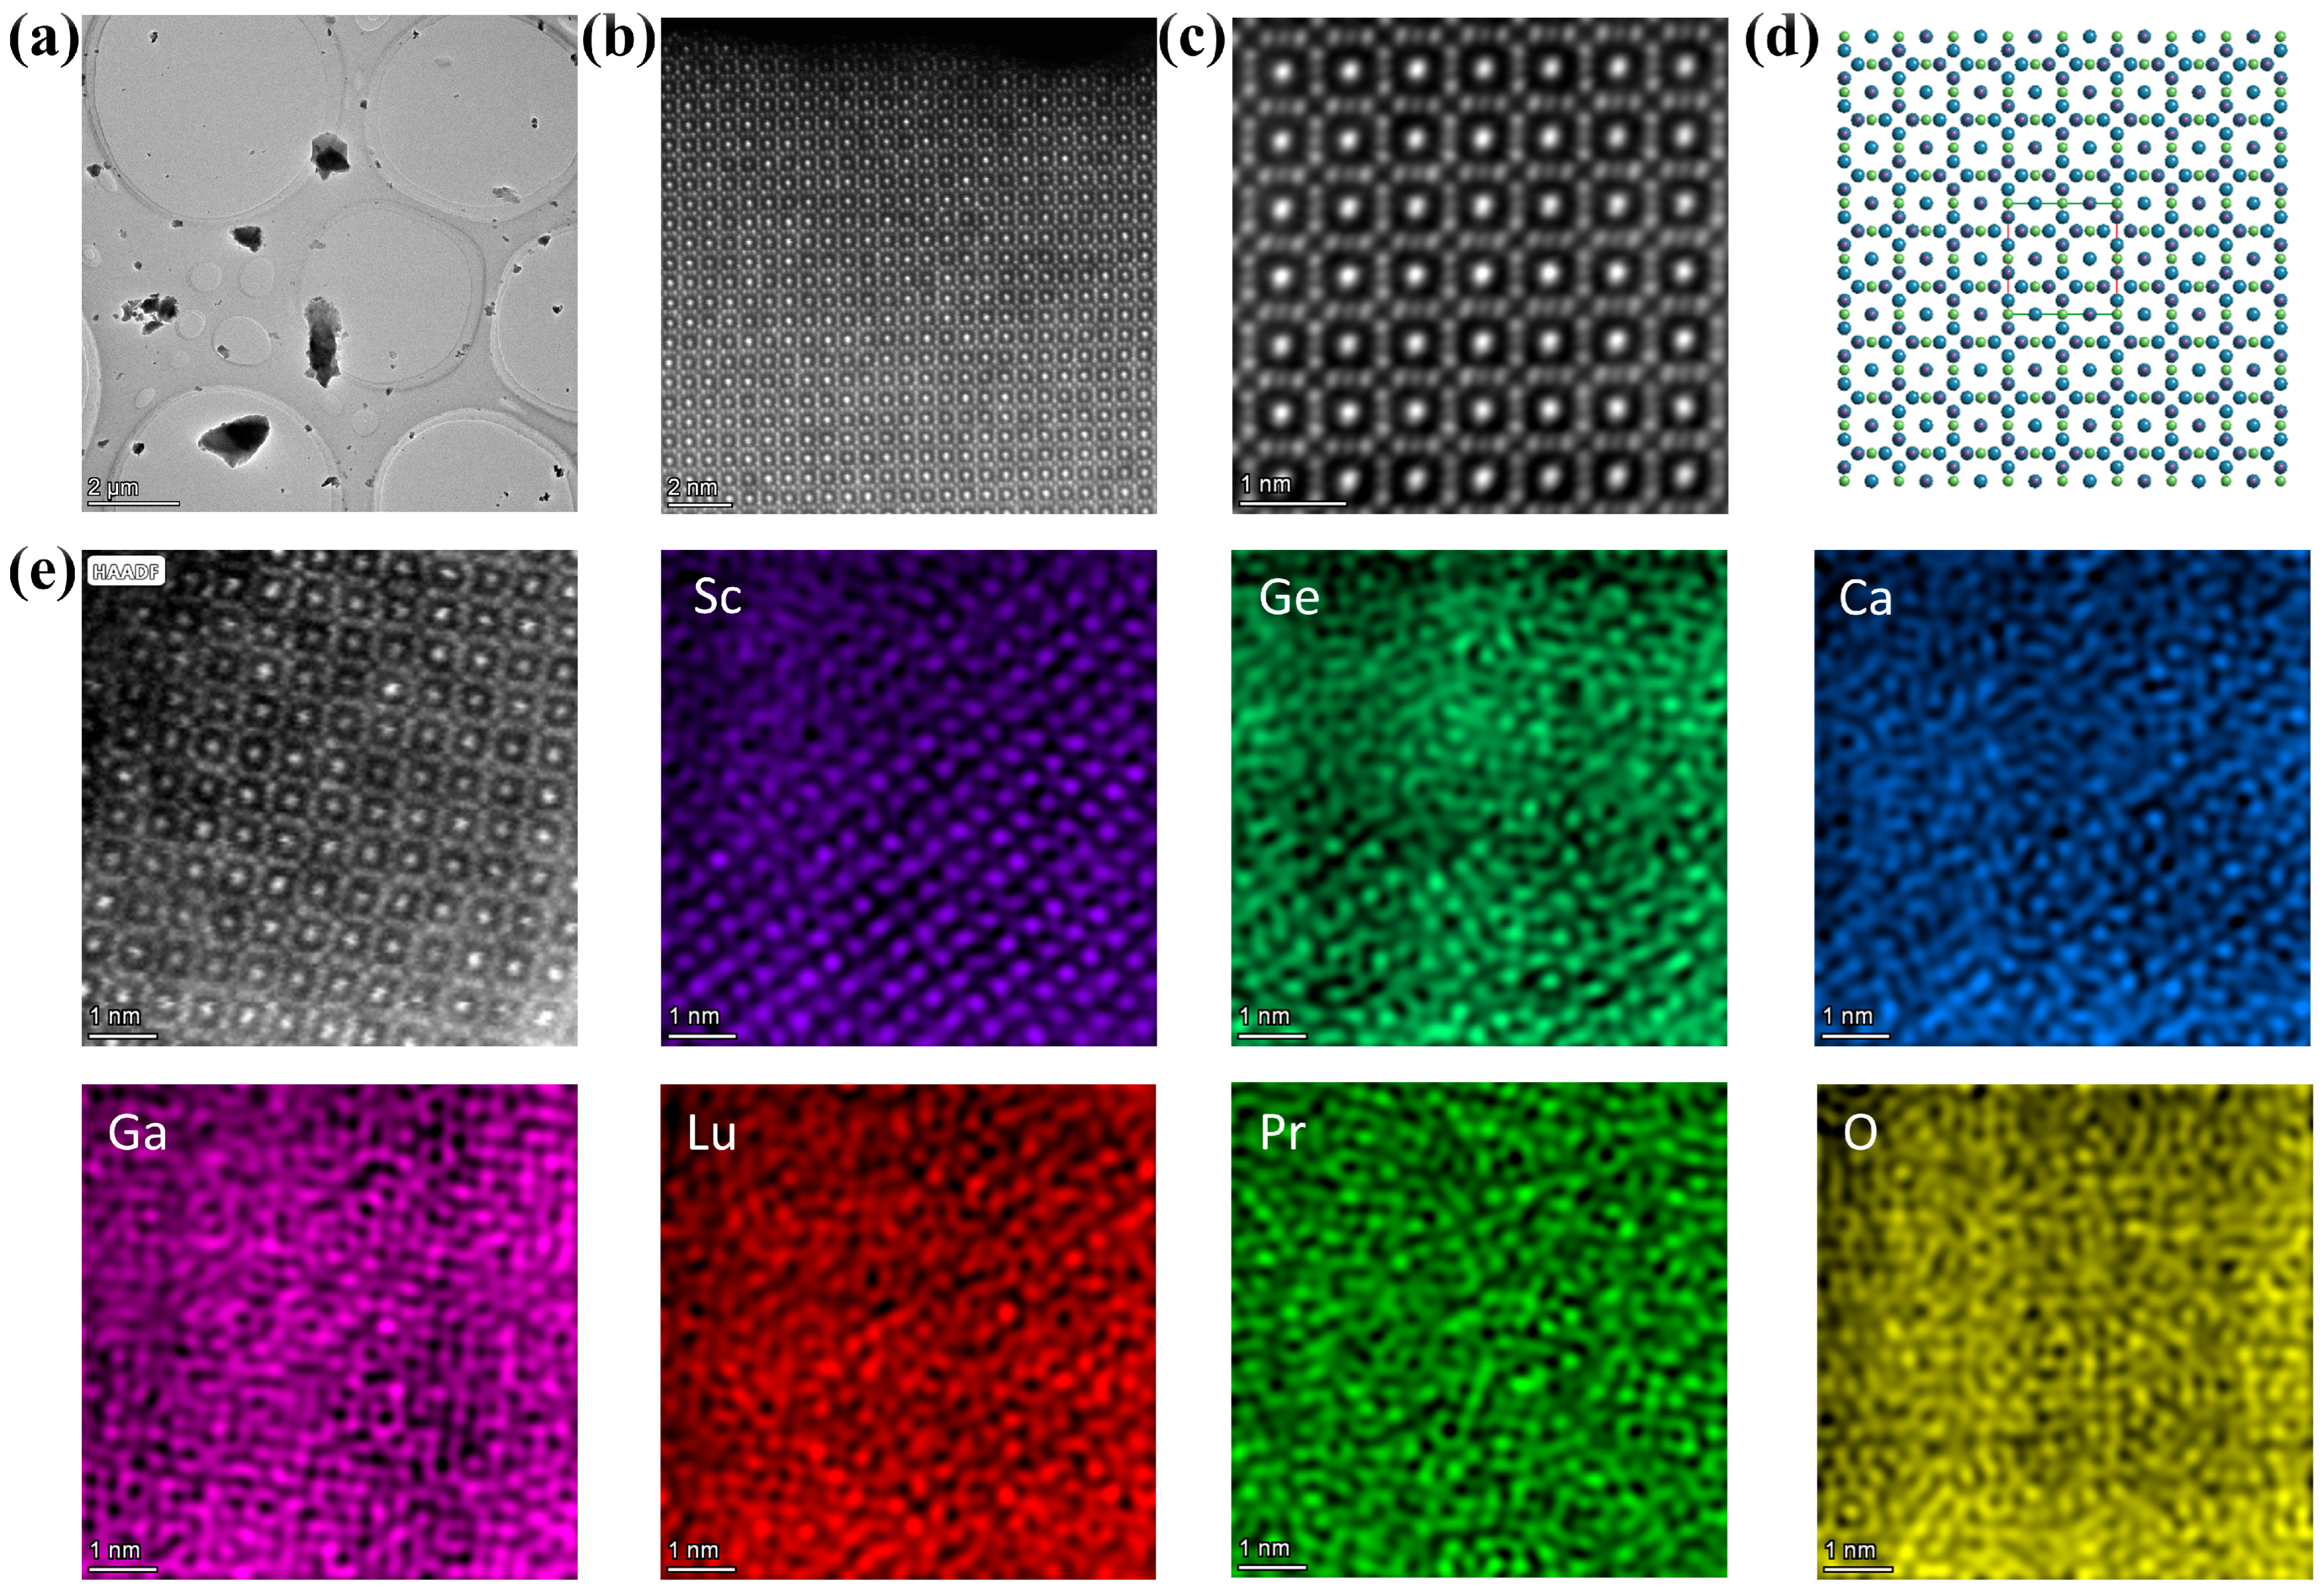
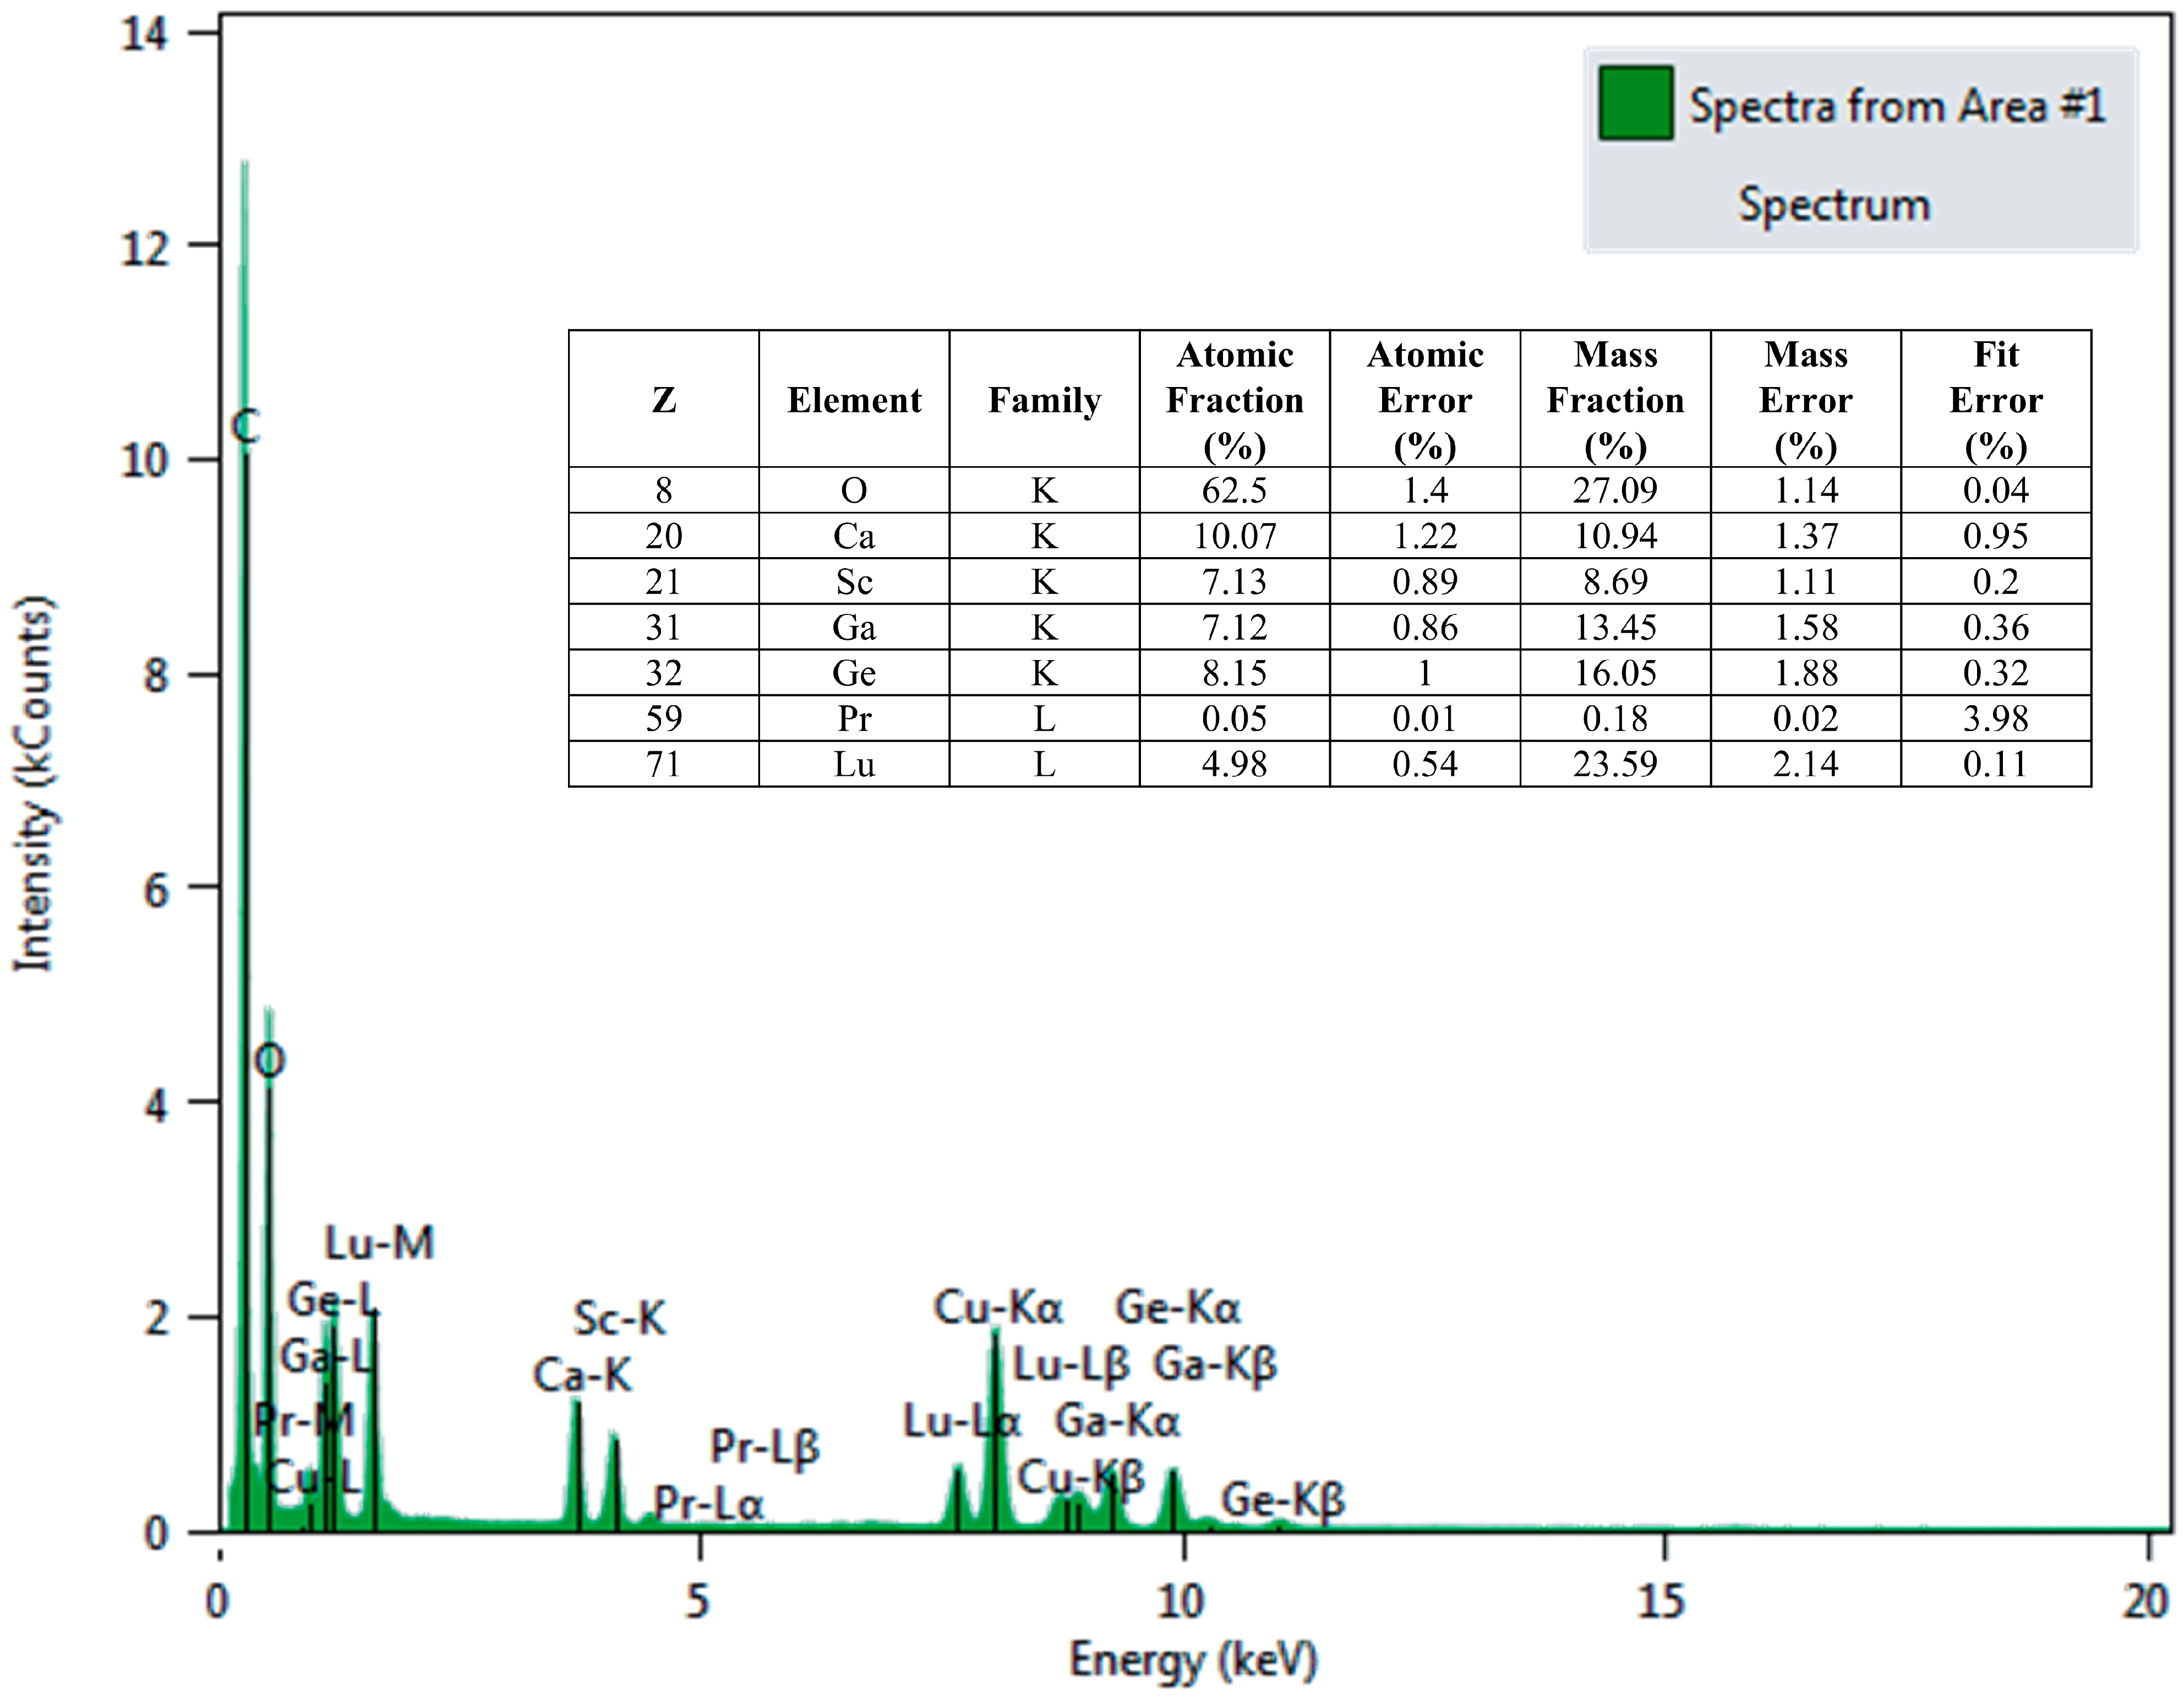
The micro-structures of the sample are characterized further by using Cs-TEM. Figure 2 and Figure 3 show the TEM, HAADF-STEM images, EDS mapping images, EDS spectrum, and elemental compositions of the sample CLSGGO:0.05Pr3+. Particles with different shapes and sizes (Figure 2a) are observed, indicating that the samples have no uniform morphology. Atomic resolution HAADF-STEM images (Figure 2b,c) of the as-prepared sample are taken along the [001] direction, which are well matched with the theoretical structure of the host (Figure 2d), proving the doped Pr3+ ions did not change the phase structure of the host further. Atomic resolution EDS mappings are achieved in Figure 2e. The occupation of Sc, Ca, Ga, Lu, Ge are clearly visible, while that of Pr is not so clear, which is ascribed to the low concentration of the doped Pr3+ ions. The EDS spectrum and the elemental compositions semiquantitative analysis results of the sample are depicted in Figure 3, which gives out the direct proof of the success doping of Pr3+ ion, although its fraction in the sample is low.

3.2. Property of Luminescence

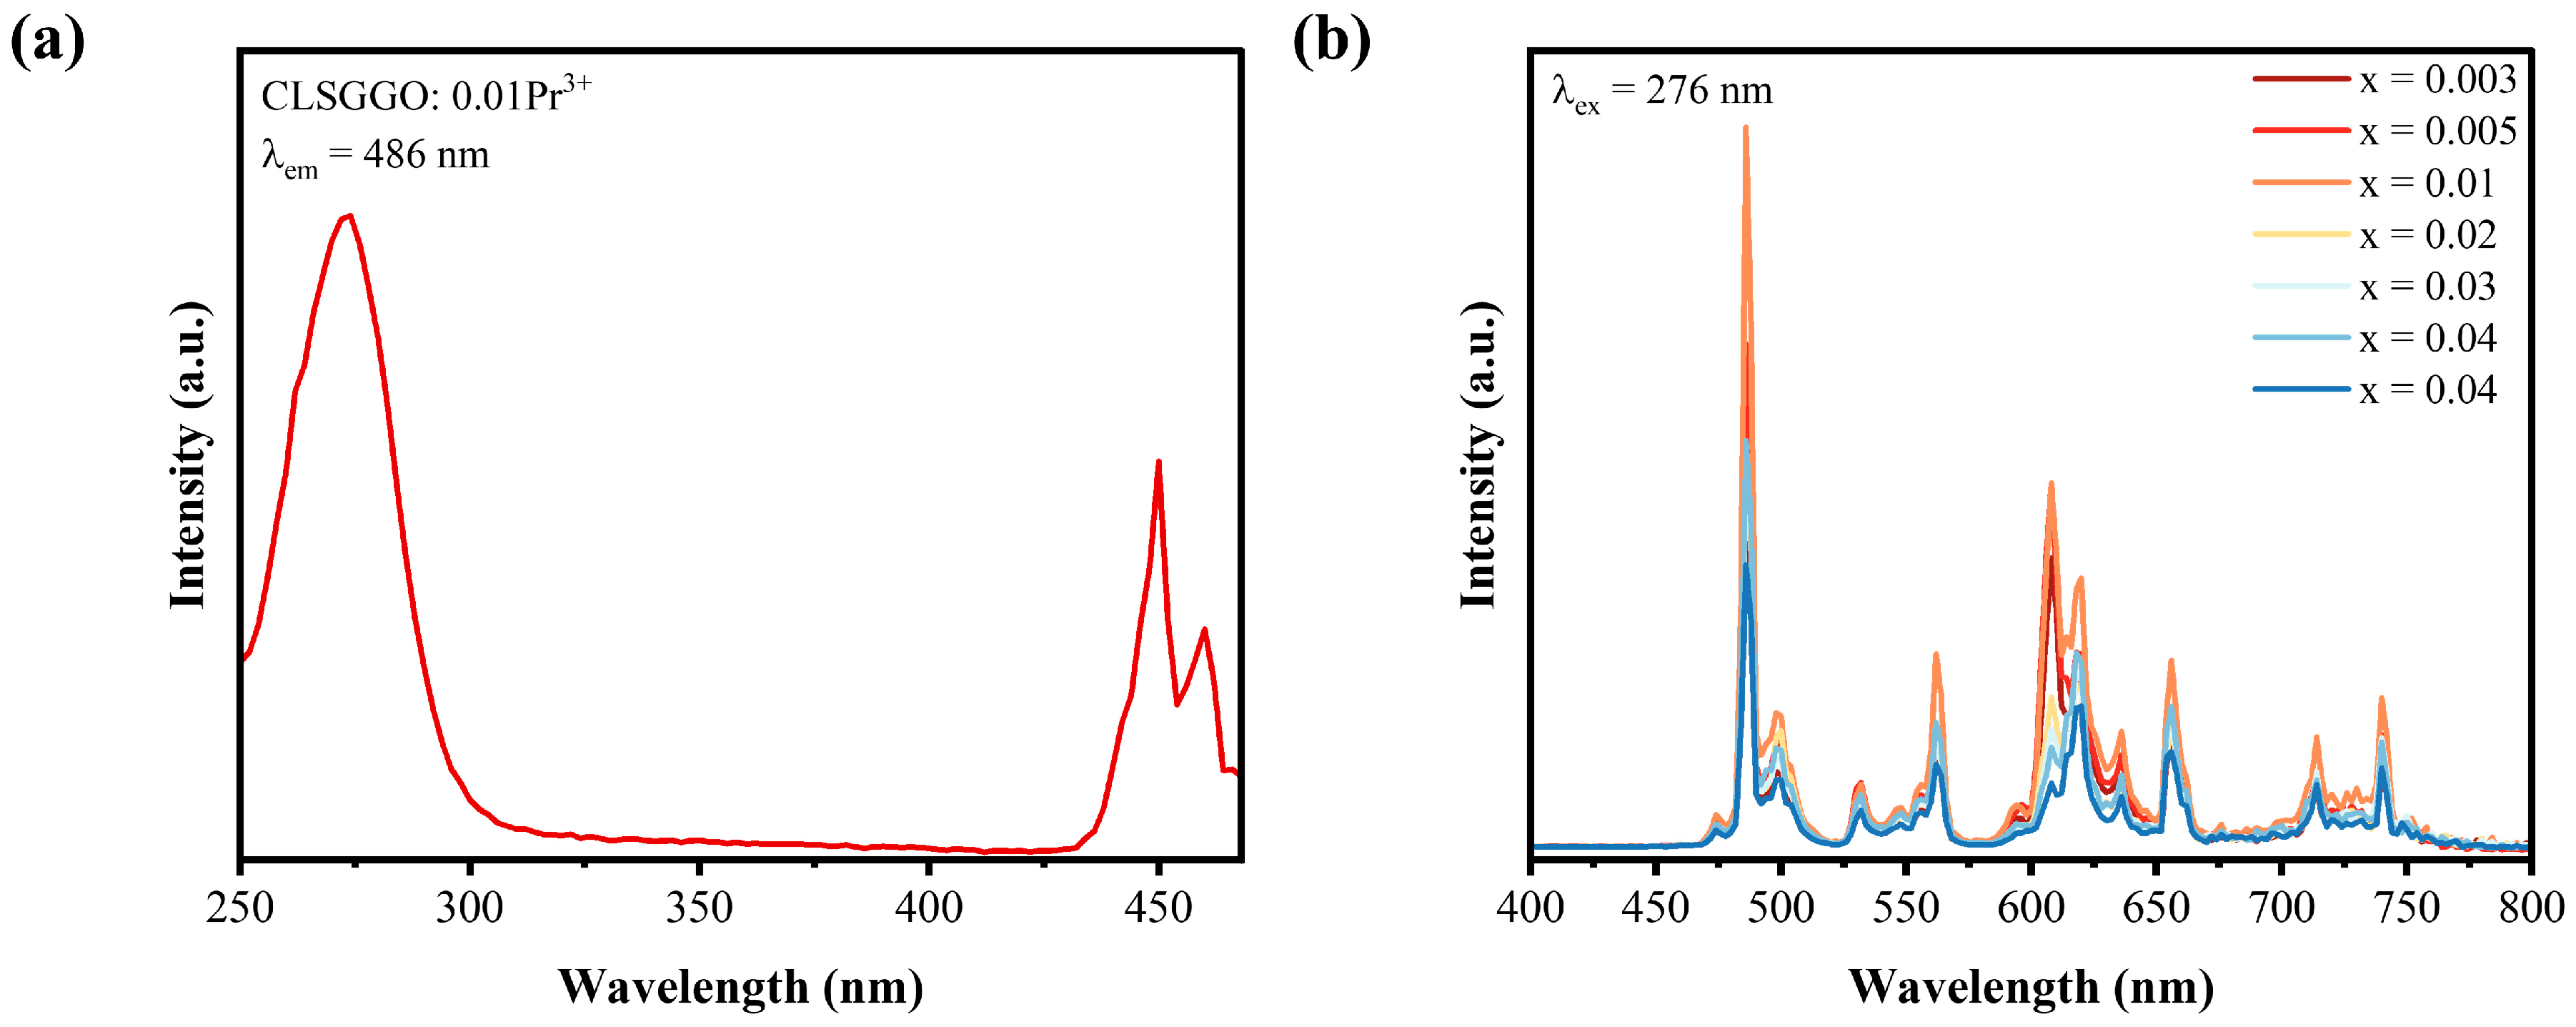
The excitation spectrum and emission spectrum of CLSGGO:0.01Pr3+ have been tested and presented in Figure 4a,b. It can be observed that when the emission wavelength is fixed at 486 nm, CLSGGO:0.01Pr3+ has a broad excitation peak at 276 nm, which is attributed to the 4f2-4f15d1 transition of Pr3+ [34,35]. Additionally, a sharp excitation peak at 425–475 nm comes from the characteristic excitation of Pr3+. Based on the above test results, 276 nm ultraviolet light is selected as the excitation wavelength and used to test the emission spectra under different Pr3+ doping concentrations, as shown in Figure 4b. The representative emission peaks of CLSGGO:Pr3+ are mainly located at 486 nm, 562 nm, 609 nm, 620 nm, 657 nm, 714 nm, and 740 nm, which are, respectively, attributed to the 3P03H4, 3P03H5, 1D23H4, 3P03H6, 3P03F2, 3P03F3, and 3P03F4 transitions of Pr3+ ions [36,37,38]. As the Pr3+ doping concentration in the samples increases, the intensity of the emission spectrum shows a trend of first increasing and then decreasing. When the doping concentration reaches 0.01, the luminescence intensity reaches the maximum. When the doping concentration is greater than 0.01, the increase in Pr3+-doping concentration will exacerbate the concentration quenching effect between the luminescence centers, resulting in a continuous decrease in luminescence intensity [39,40]. Therefore, the optimal doping concentration of Pr3+ in this phosphor is confirmed to be 0.01.
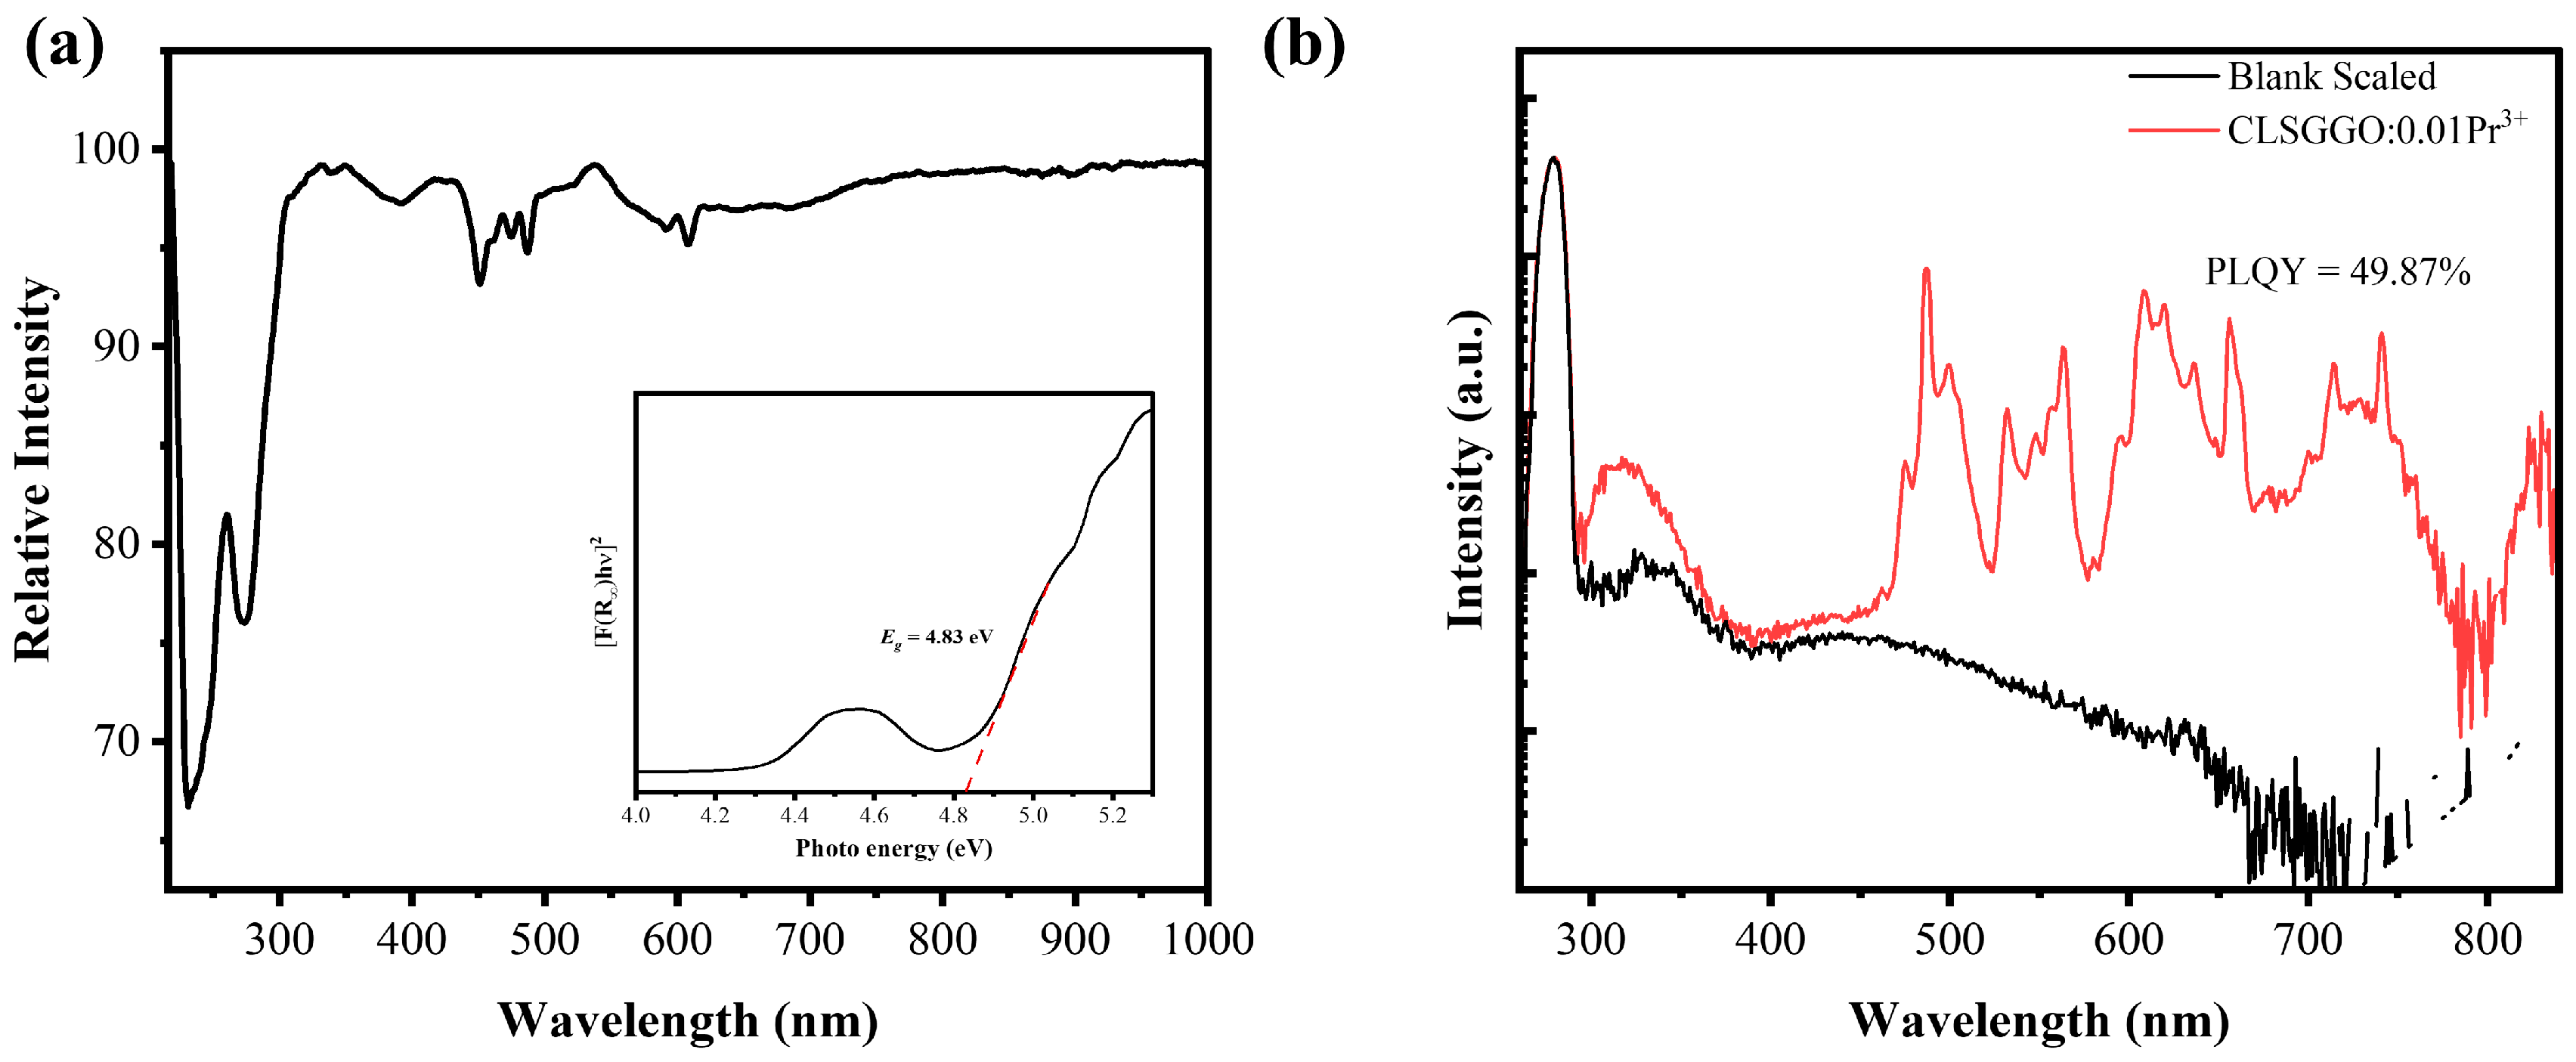
Figure 5a shows the diffuse reflection spectrum of CLSGGO:0.01Pr3+ phosphor. The strongest absorption peak in the range of 230–350 nm is attributed to the 4f-5d transition of Pr3+ [41]. Additionally, in the ranges of 430–500 nm and 550–650 nm, there are also relatively weak peaks, which are attributed to the transition absorption of Pr3+ at 3H43P0,1,2 (430–500 nm), 3H41D2, and 3H43H6 (550–650 nm), respectively [42,43]. Furthermore, the optical band gap (Eg) of CLSGGO:0.01Pr3+ is calculated using the following Kubelka–Munk equation [44,45]:
[ F R h ν ] n = C ( h ν E g )
F R = ( 1 R ) 2 2 R = K S
Among them, F(R) is calculated based on the measured reflectivity R and represents the Kubelka–Munk absorption coefficient; h is the Planck constant; ν is the frequency of light; n represents the transition coefficient and the direct energy band gap = 2; C is the absorption constant; Eg is the band gap [46,47]. Through calculation, the Eg of CLSGGO:0.01Pr3+ phosphor is approximately 4.83 eV, which is shown in the inset of Figure 5a. In addition, under excitation at the optimal excitation peak, the PLQY of CLSGGP:0.01Pr3+ is 49.87% in Figure 5b, indicating that CLSGGO:0.01Pr3+ has a relatively high luminous efficiency.

3.3. LPL Property and Trap Analysis

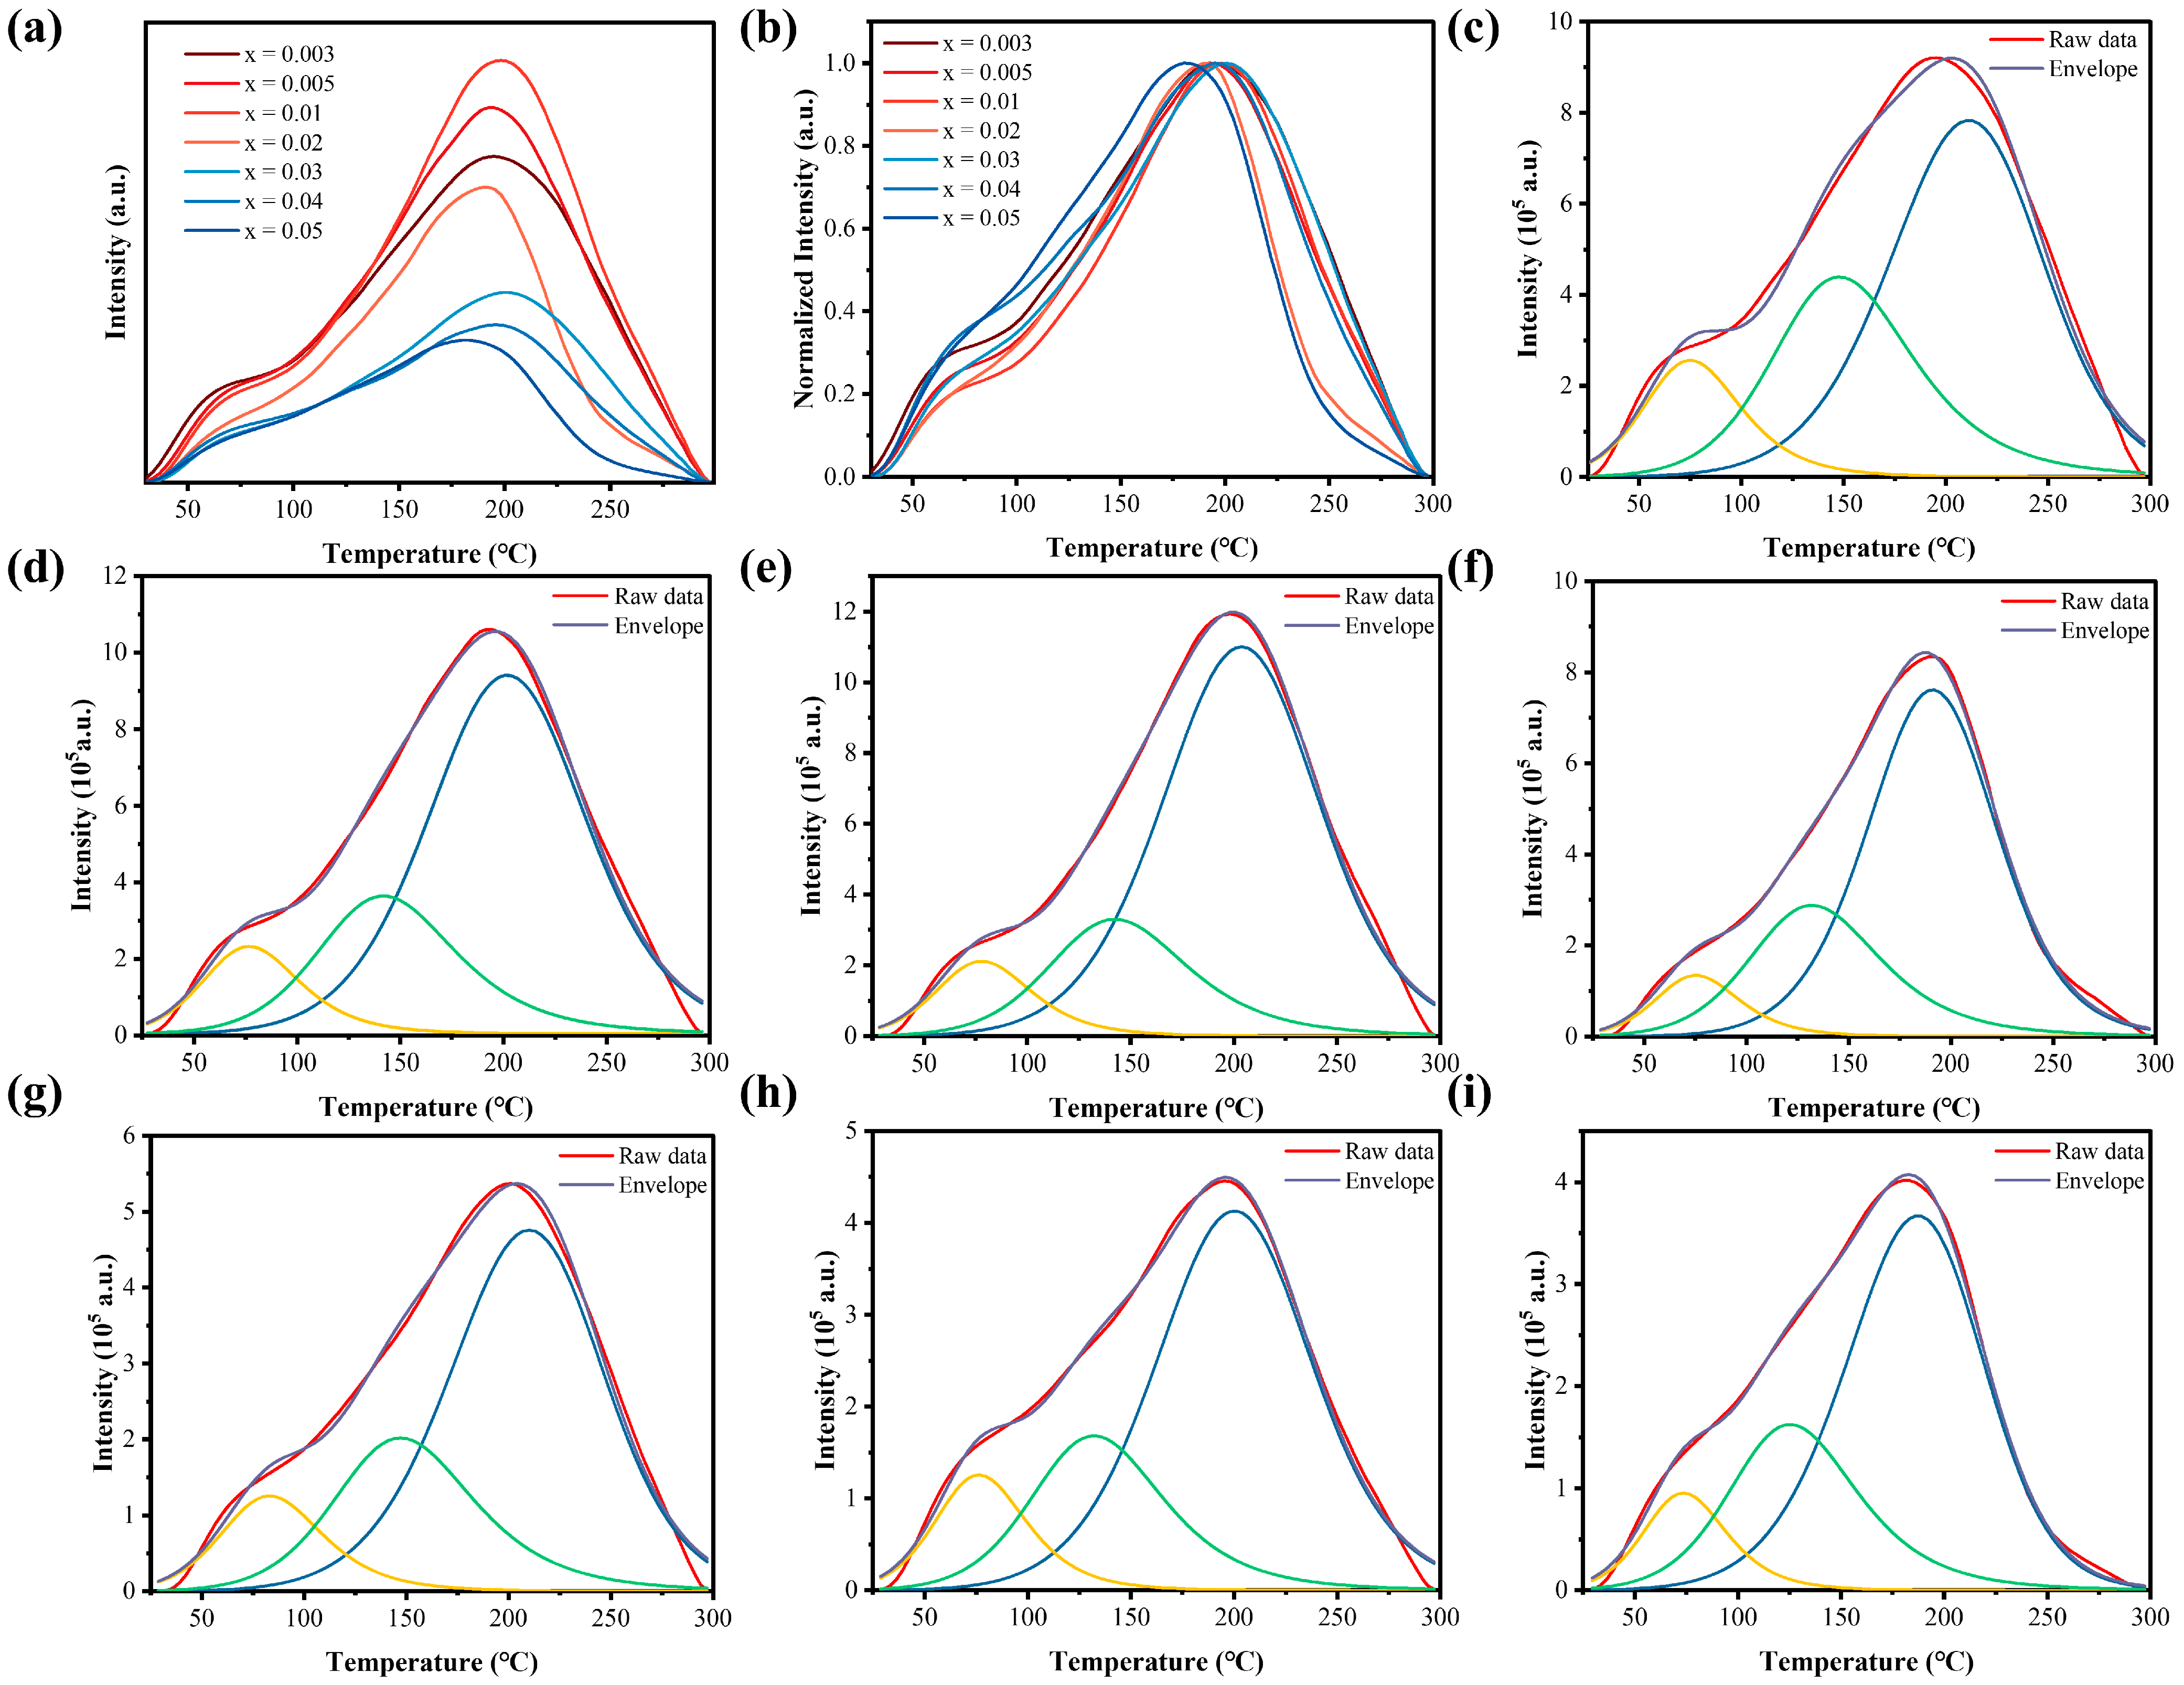
After the excitation light source turned off, the long persistent luminescence (LPL) materials can still maintain luminescence for a certain period of time [48,49]. The LPL spectrum and the thermoluminescence (TL) curve are often used to characterize the LPL properties of the samples and to infer the emission mechanism [50]. CLSGGO:Pr3+ still exhibits luminescence after being excited by 254 nm ultraviolet light for a period of time, which indicates that it has the property of LPL. To explore the intrinsic reason for the influence of Pr3+-doping concentration on LPL emission spectra, the TL curves at different doping concentrations are tested, mainly to study the influence of Pr3+ doping concentration on the trap density and trap distribution in Figure 6a. It can be found that changing the Pr3+-doping concentration will affect the shape of the TL curves, which means that the doping concentration is an important factor affecting the trap distribution and trap density. When the Pr3+-doping concentration in CLSGGO is 0.01, the intensity of the TL curve is the highest, and the peak is located at 197 °C. Generally, the intensity of the TL curve is related to the trap density, and the position of the peak in the TL curve is related to the trap depth; the greater the intensity, the greater the trap density, and the higher the temperature where the peak is located, the deeper the trap [51]. Therefore, the trap density of CLSGGO:0.01Pr3+ is the highest, and more traps are distributed in the deep region. The normalized results of different Pr3+-doping TL curves are shown in Figure 6b. It can be found that the shapes of the TL curves under different doping concentrations are roughly similar, which indicates that the trap distribution range and proportion of Pr3+-doped CLSGGO are approximately the same, mainly distributed in the range of 100 °C–300 °C, which means that there are more deep traps in these phosphors.
To conduct a detailed study on the trap states under different doping concentrations, the TL curves of different Pr3+ doping phosphors are fitted using the TL2000 1.0 version with first-order kinetic simulation, which are shown in Figure 6c–i [52]. The TL curves of all samples are fitted as the superposition of three fitting curves, indicating that there are three effective carrier trap types in these phosphors, which are represented in the figure as green trap A, yellow trap B, blue trap C, and the combined curve after the three traps are superimposed is blue. The temperature distribution range of trap A and trap B is significantly lower than that of trap C, indicating that the trap depth of trap A and trap B is shallower than that of trap C. The intensity of trap C is significantly higher than that of trap A and trap B, suggesting that trap C is the main trap type and has a larger trap density. When the doping concentration increases from 0.003 to 0.01, the proportion of trap A and trap B in the total TL curve area decreases and the proportion of trap C increases, indicating that the proportion of shallow traps reduces and the proportion of deep traps raises. When the doping concentration continues to increase from 0.01 to 0.05, the proportion of shallow traps of trap A and trap B increases and the proportion of deep traps of trap C decreases. In addition, when the doping concentration of Pr3+ is higher than 0.01, the intensity of the TL curve gradually decreases, indicating that continuously increasing the doping concentration will inhibit the generation of traps. Combining the results of the peak fitting of the TL curves, it can be found that a higher Pr3+ doping concentration changes the distribution of traps, inhibiting the formation of deep traps of trap C and promoting the formation of shallow traps trap A and trap C. The carriers existing in trap A and trap B can be slowly released at room temperature (RT), so CLSGGO:0.01Pr3+ exhibits a bright LPL phenomenon at RT. The carriers in the deep traps of trap C need to be stimulated by higher temperature or light to be released. In summary, the doping concentration of Pr3+ affects the generation and distribution of traps, which can effectively regulate the LPL performance.
In order to quantify the trap density and depth in the CLSGGO:xPr3+ phosphors, first-order kinetic simulation is employed to calculate the trap parameters under different doping concentrations. This theory has been widely applied in the study of trap properties of various LPL materials. Generally, the following equations are used to calculate the trap parameters [53]:
E t   =   2.52   +   10.2   ×   μ g     0.42   ×   k B T m 2 ω     2 k B T m
n 0 = ω I m β × [ 2.52 + 10.2 × μ g 0.42 ]
μ g = T 2 T m T 2 T 1
Herein, Et represents the trap depth, n0 represents the trap density, kB is the Boltzmann constant; β is the heating rate, which is 3 K/s in this paper, μg represents the asymmetry parameter, Tm is the temperature corresponding to the TL peak, ω is the full width at half maximum (FWHM) of the peak, and Im is the maximum intensity value of the peak. Since the LPL phenomenon at room temperature mainly originates from the release of carriers from shallow traps, the relevant parameters of shallow trap 1 (yellow line) are calculated and are shown in Table 1. It can be observed that the trap 1 depth of CLSGGO:xPr3+ varies from 0.694 eV to 0.712 eV. As the doping concentration increases, the trap depth Et shows a trend of first increasing and then decreasing. When the Pr3+ doping concentration is at a lower value, such as 0.003, 0.005, or 0.01, the n0 of traps in trap 1 is relatively high. As the doping concentration increases, the value of n0 decreases, which means that too high a doping concentration is not conducive to the formation of trap 1, thereby affecting the LPL phenomenon at room temperature.

3.4. LPL Mechanism

In order to deeply explore the mechanism of LPL, TL curves with different charging times, different excitation temperatures, and different decay times are tested. These test results can be used to analyze the storage and release process of charge carriers in CLSGGO:0.01Pr3+ traps [54]. The CLSGGO:0.01Pr3+ with the strongest thermal luminescence curve intensity is selected as the representative for the above tests. Firstly, charging with 254 nm ultraviolet light for different times, the TL curves and their normalized results are shown in Figure 7a,b, including 30 s, 60 s, 180 s, 5 min, 10 min, 20 min, and 30 min. In Figure 7a, it can be observed that the intensity of the TL curves grows rapidly as the charging time increases. When the charging time is 10 min or longer, the increase rate of the thermal luminescence curve intensity slows down, indicating that the traps have been basically filled with charge carriers after charging with 254 nm ultraviolet light for 10 min [55]. In the low-temperature region of Figure 7a, the shallow traps intensity of shorter charging time is higher than that of longer charging time, which means that as the charging time increases, the charge carriers in the shallow traps tend to move to the deep traps [56]. In addition, by normalizing the TL curves under different charging times in Figure 7b, it is found that when the charging time is shorter, the distribution ratio of charge carriers in the shallow traps is higher than that of longer charging time, which means that the charge carriers tend to preferentially distribute in the shallow traps when the charging time is short [57]. When the charging time reaches 10 min or more, the shape of the normalized thermal luminescence curve remains basically unchanged, indicating that the distribution ratio of charge carriers in traps remains basically unchanged and longer charging times do not affect the distribution ratio of charge carriers [58]. Therefore, the charging time has an influence on the density and distribution ratio of charge carriers in the traps. When the charging time reaches 10 min or longer, the influence of the charging time on the density and distribution ratio of charge carriers in the traps is relatively small. Therefore, 10 min with 254 nm ultraviolet light is determined as the subsequent test condition.
Under the condition of being charged with ultraviolet light of 254 nm for 10 min, the test results of the TL curves under different decay time are presented in Figure 7c,d. As the decay time increases, the intensity of the TL curves continuously decreases. This is because as the decay time prolongs, the trapped carriers are constantly released. However, when the decay time is extended from 30 s to 120 min, the intensity of the TL curve only decreases to 88% of that at 30 s, indicating that the carriers stored in the traps are relatively stable and are not easily released at RT. The results after normalizing the decay curves are shown in Figure 7d, in which it can be observed that the FWHM of the TL curve gradually decreases as the decay time grows, and the position of the peak of the TL cross-section gradually moves towards the high-temperature side. This is mainly due to the disappearance of the TL curve in the low-temperature region, which indicates that the carriers in different traps are not released simultaneously. The carriers in the shallow traps are released first, and those in the deep traps are slowly released at RT [59]. Therefore, after being decayed for 120 min, the CLSGGO:0.01Pr3+ can still measure a strong TL curve in the high-temperature region. Moreover, the extension of the decay time causes the movement of the TL peak, which indicates that there is a series of continuous distributed traps in CLSGGO:0.01Pr3+. As the decay time increases, the decay part of the TL curves is mainly concentrated in the section before 100 °C, indicating that the persistent luminescence at room temperature is mainly due to shallow traps. Figure 7e–f shows the LPL spectra and TL curves of CLSGGO:0.01Pr3+ after being excited by 254 nm ultraviolet light for 10 min at different excitation temperatures. Figure 7e presents the LPL spectra of CLSGGO:0.01Pr3+ at different temperatures ranging from 298 K to 523 K with a step of 25 K. It can be observed that the peak shapes of the LPL spectra at different excitation temperatures are similar, but the peak intensities are different, indicating that the excitation temperature affects the LPL emission of CLSGGO:0.01Pr3+. To further explore the mechanism and reasons for the influence of excitation temperature on the LPL properties, the TL curves after being excited by 254 nm for 10 min at different temperatures are shown in Figure 7f [60]. As the excitation temperature increases, the peak intensity of TL curve shows a trend of first increasing and then decreasing. However, the intensity of the deep traps at higher temperatures above 275 °C is lower than that at RT. This is because temperature increasing can promote the release of carriers in the deep trap, enter the shallow traps, and be stored [61]. Therefore, at the beginning of the temperature increase, the strongest peak intensity of the CLSGGO:0.01Pr3+ TL curve increases. As the excitation temperature continues to increase, the stored carriers in the traps are continuously excited and released, so the number of carriers that can be stored in the traps decreases, resulting in a continuous decrease in the intensity of the TL curves. Therefore, the TL curve shows a trend of first increasing and then decreasing with the increase in temperature.
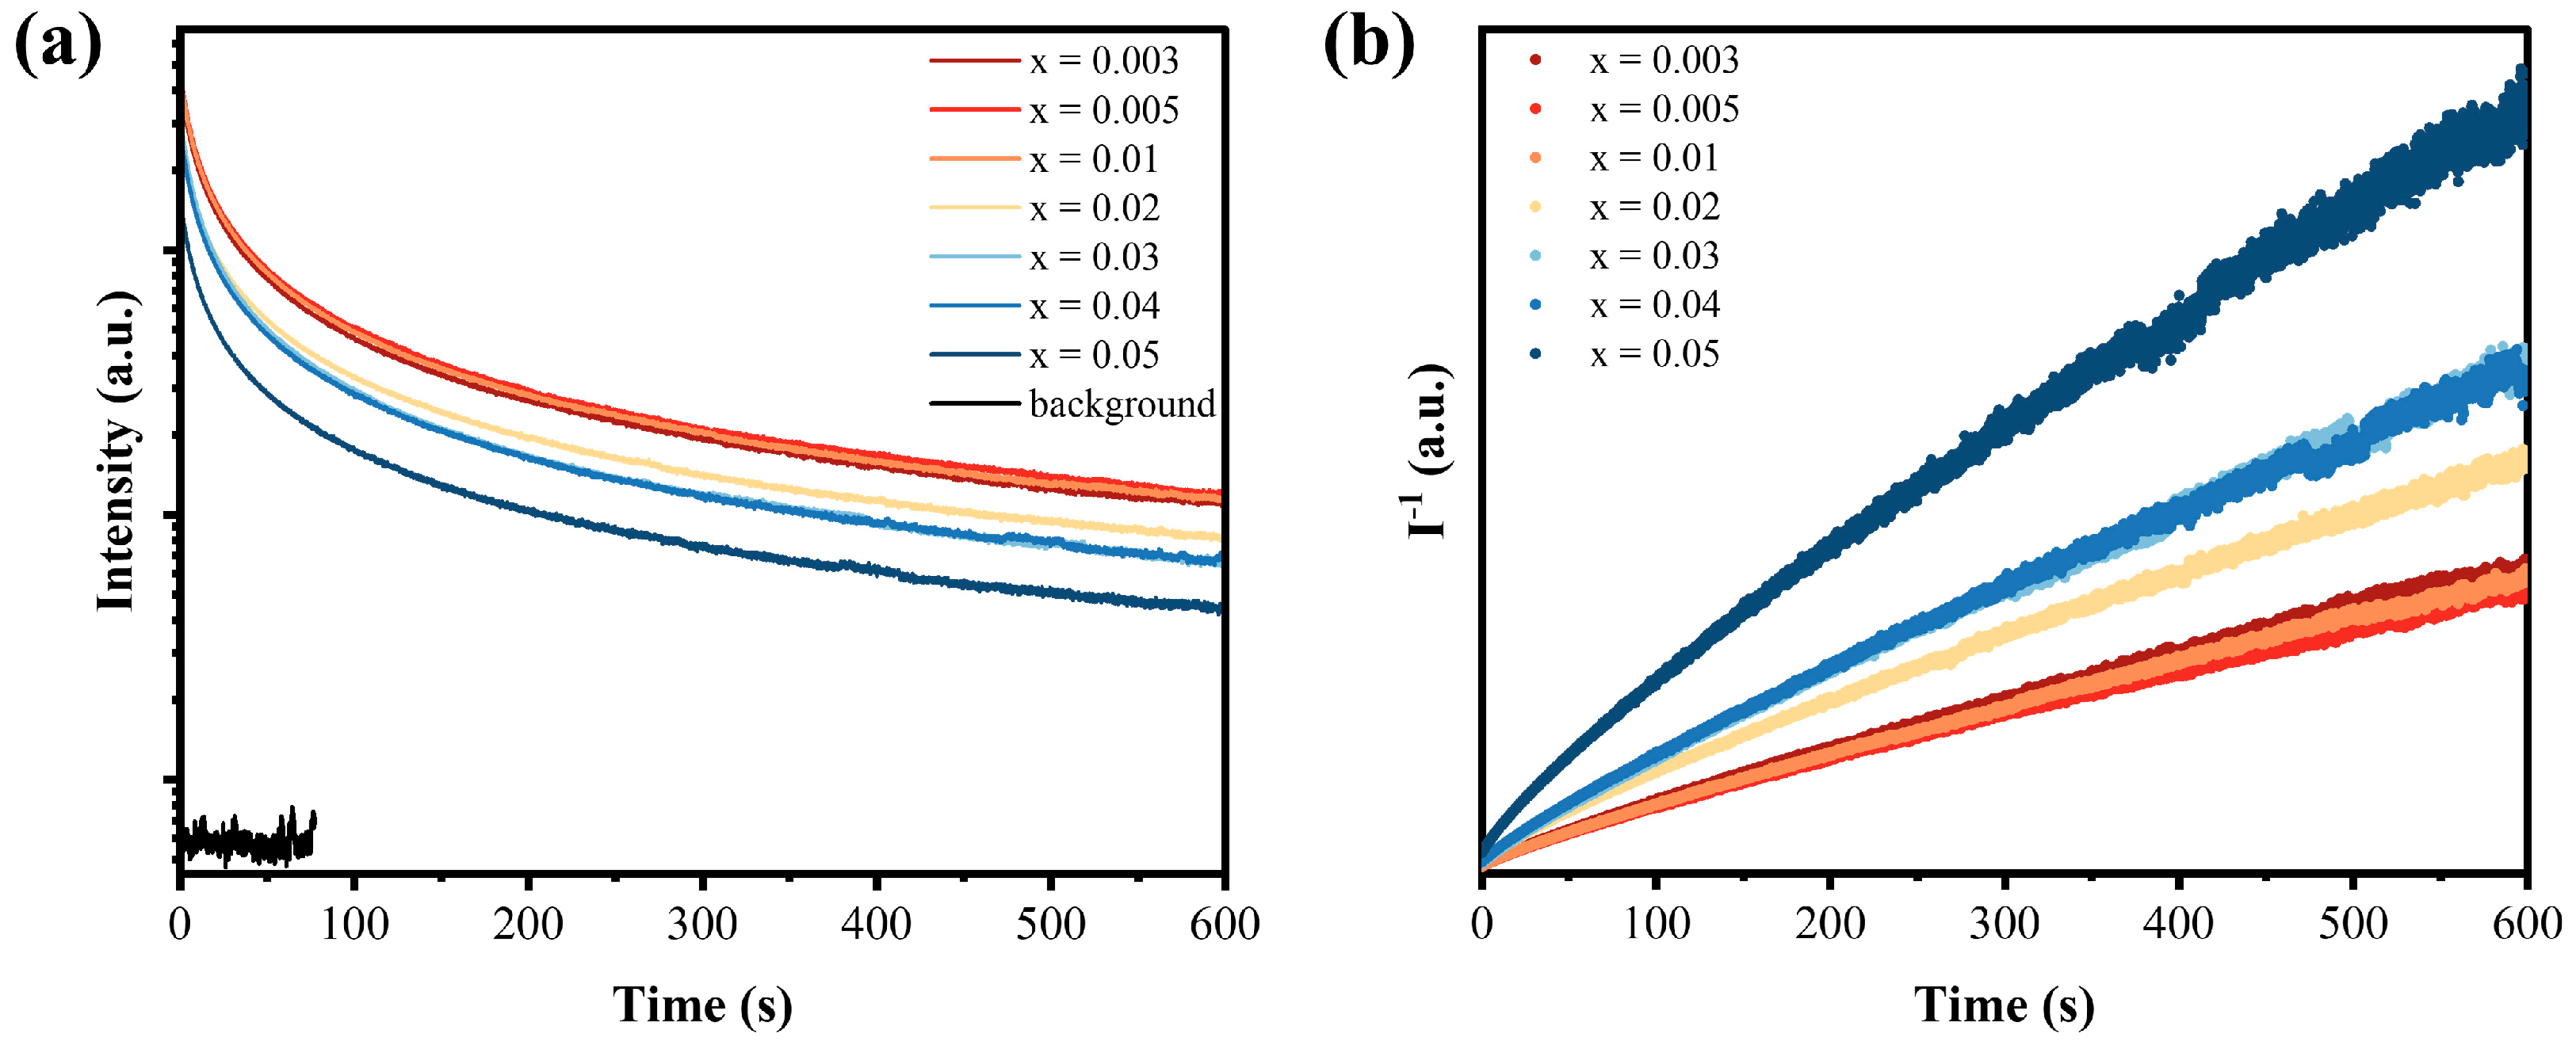
Figure 8a shows the variation pattern of the LPL intensity of CLSGGO:xPr3+ with the decay time. After the excitation light source is turned off 10 min after excitation, the LPL decay curves within 10 min are recorded. As shown in Figure 8a, within the first 100 s, the luminescence intensity decreased exponentially rapidly, because the carriers in the shallow traps can be released easily and produce luminescence at RT. Subsequently, the LPL intensity tended to stabilize and remained for a relatively long time, because the release rate of carriers in the deep traps is slower, so the LPL signal can be detected for a long time. After decaying for 10 min, the luminescence intensity of these phosphors is still higher than the background signal, which indicates that the LPL time of these phosphors can last for more than 10 min. Comparing the LPL decay curves of CLSGGO:xPr3+, it can be found that the LPL decay intensities of these phosphors are different. Compared to the LPL decay curve intensity of different doping concentrations, samples of 0.003, 0.005, and 0.01 are larger than those of 0.02, 0.03, 0.04, and 0.05, and the decay rate is slower, which is because the doping concentration of Pr3+ affects the distribution and density of traps, thereby affecting the LPL property of CLSGGO:xPr3+. In addition, studying the relationship between LPL intensity and decay time can reflect the carrier energy transfer process between traps and luminescence centers [62]. When electrons and holes undergo tunneling processes to recombine, the residual luminescence intensity and the reciprocal of time of the material will show a linear relationship. On the contrary, it will be achieved through the conduction band [32]. Therefore, the reciprocal of residual luminescence intensity is shown to be related to the decay time in Figure 8b. It can be found that within the 600 s decay time, the reciprocal of residual luminescence intensity (I−1) is approximately proportional to the decay time, indicating that the tunneling effect is the main process of carrier energy transfer between traps and luminescence centers, and this process plays a major role in the LPL process.
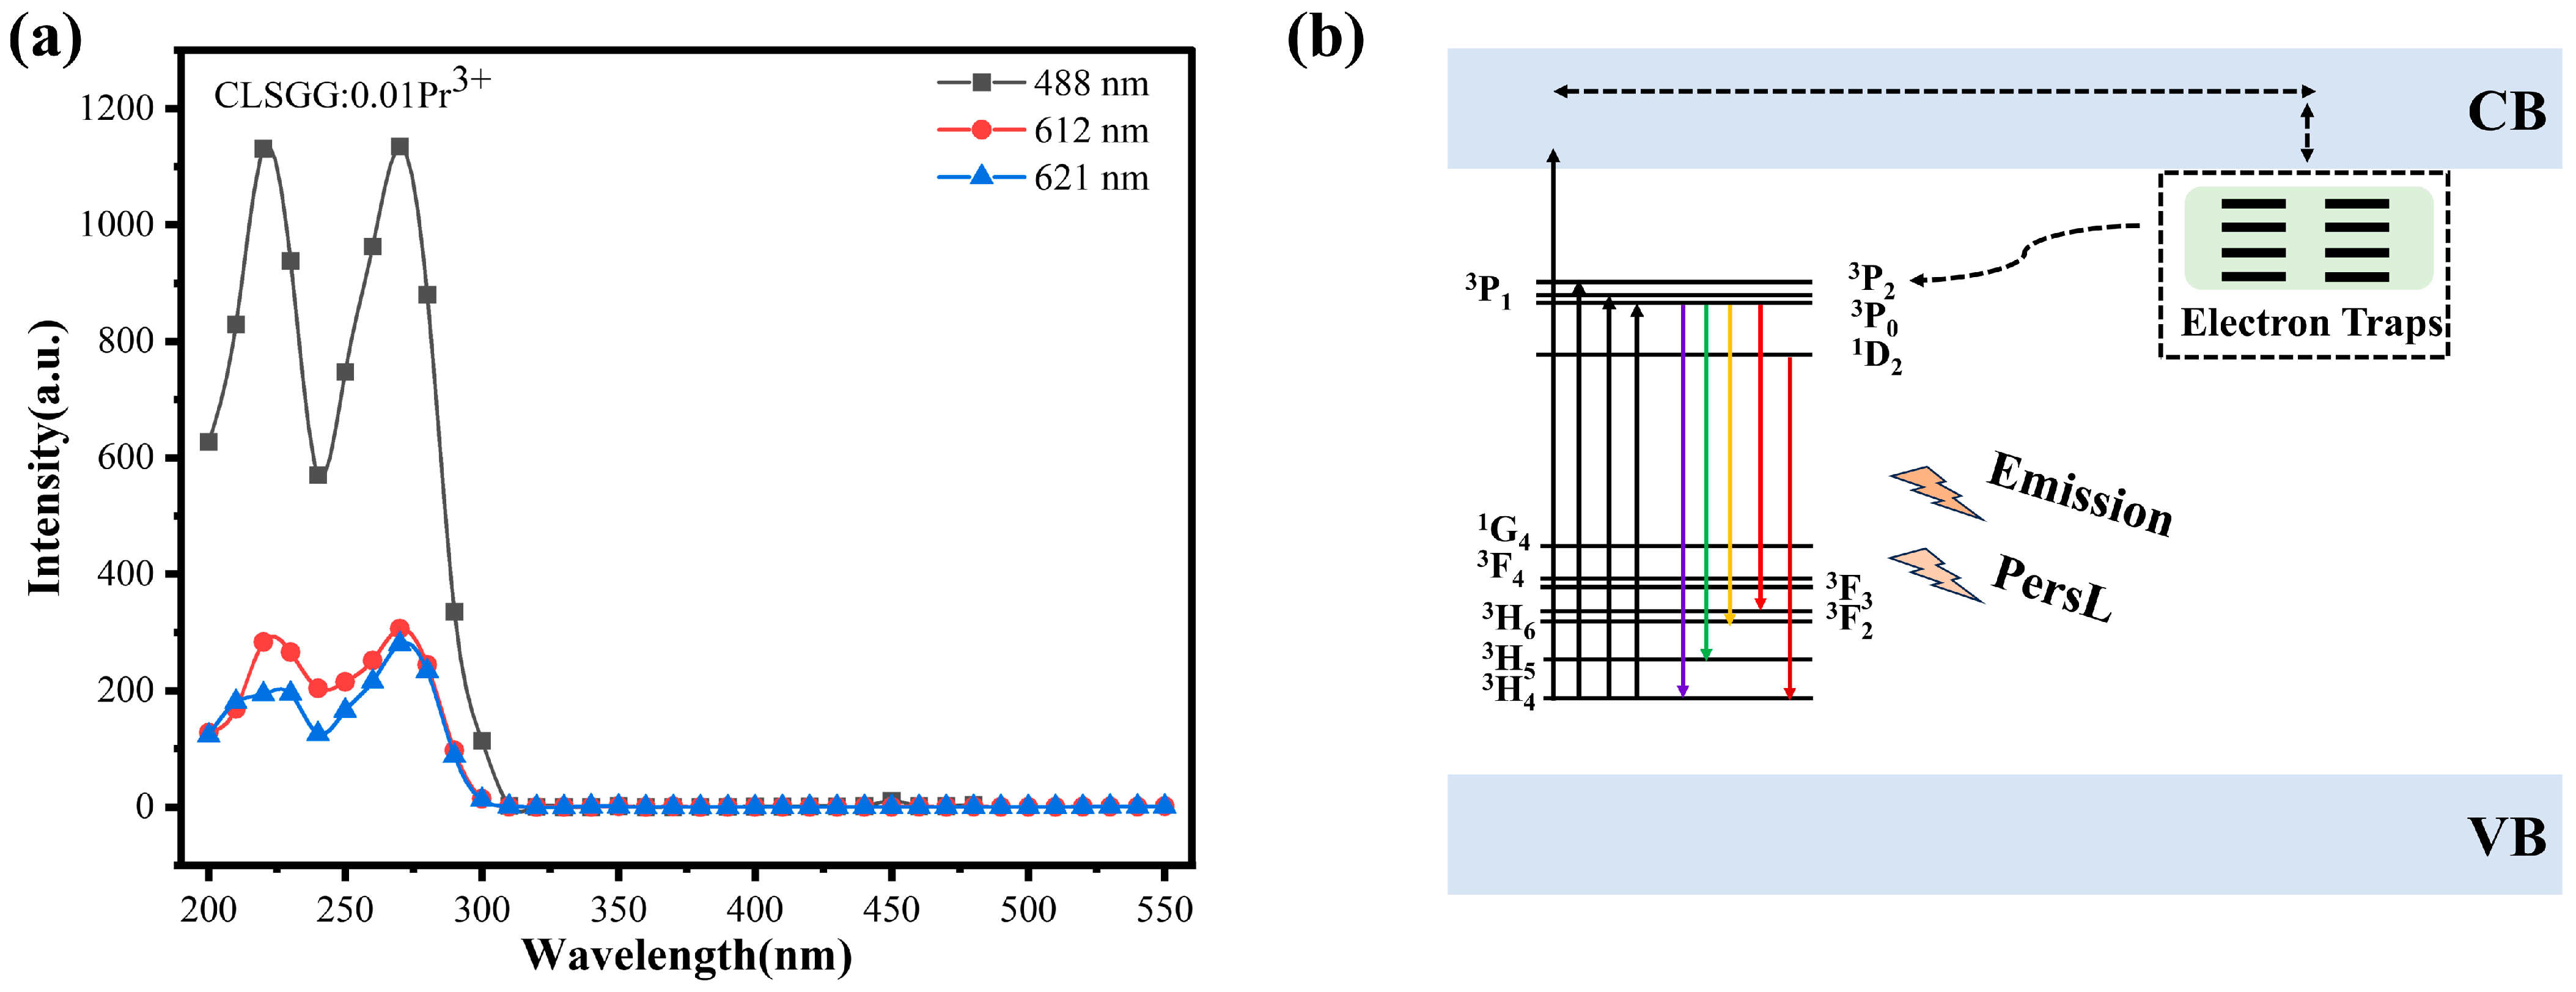
To determine the LPL mechanism of CLSGGO:Pr3+, the LPL excitation spectra of CLSGGO:0.01Pr3+ at 488 nm, 612 nm, and 621 nm are supplemented, respectively, as shown in Figure 9a. It can be found that the LPL excitation peaks at the three wavelengths are located at 220 nm and 270 nm in the ultraviolet region, which indicates that the LPL of CLSGGO:0.01Pr3+ can only be produced by irradiation with higher energy light in the 200–300 nm range. This result becomes an important basis to propose the electron capture model to explain the LPL mechanism. Regarding the properties of CLSGGO:0.01Pr3+, a reasonable TL emission mechanism has been proposed and described in Figure 9b. The phenomenon of TL in CLSGGO:0.01Pr3+ is caused by the release of carriers that are trapped after ultraviolet light excitation, leading to the release of energy. Under the excitation of 254 nm, the carriers in the valence band (VB) absorb the excitation light and enter the conduction band (CB), generating holes in the valence band. The carriers excited to the conduction band undergo energy level transitions according to the energy level structure of Pr3+, emitting specific orange-red light emission peaks of Pr3+. Additionally, while being carried back to the ground state, they will also be caught by traps in the material, and continuous illumination will cause the traps in these phosphors to gradually be filled. When the excitation light source is turned off, the carriers in the shallow traps gradually release at RT, thereby back to the ground state and re-combining with the holes. Therefore, for a period of time after the excitation light source removed, CLSGGO:xPr3+ exhibits the phenomenon of initial relatively strong LPL. The carriers stored in the deeper traps can be relatively stable stored and affected by the high-energy stimulation, such as high temperature and laser. These carriers can return to the excited state energy level by a short distance and then go back to the ground state to re-combine with the holes, resulting in long-lasting but faint LPL phenomenon.

4. Discussion

In this study, we discuss the photoluminescence and persistent luminescence properties of Pr3+ doped in CLSGGO garnet host and thoroughly investigate the intrinsic connection between the carriers’ movement in CLSGGO:Pr3+ and the luminescence phenomenon, establishing a bridge between macroscopic phenomena and microscopic mechanism. This research innovatively studies the persistent luminescence of the material under different excitation and decay conditions, infers the carrier movement in the material, and proposes a physical electron capture model, which is consistent with the experimental phenomena, enriching the research achievements of rare earth doped garnet systems in luminescence. However, in this paper, the characterization of traps in the material is limited to the use of thermoluminescence curves within the range of 298 K–573 K. Supplementing the thermoluminescence curves at low temperatures and the characterization of the carrier movement state can provide a more comprehensive study of the persistent luminescent properties of the material. Regarding the conjecture that deep traps can be stimulated by light, the laser of 980 nm or 1064 nm can be used to verify this assumption. In conclusion, more comprehensive characterization methods can provide an accurate and detailed understanding of the luminescence properties of phosphors.

5. Conclusions

In conclusion, a series of Pr3+ doped garnet-type phosphors (CLSGGO:xPr3+) are successfully prepared by high-temperature solid-phase method. Firstly, XRD and EDS mapping provide detailed evidence for the pure phase of the material and the uniform distribution of elements. Cs-TEM explored the lattice structure and atomic arrangement of the garnet matrix from the atomic level deeply, proving the superior lattice structure of the material and further confirming the successful synthesis of the phosphor. The excitation and emission spectra of CLSGGO:xPr3+ are characterized, and the optimal doping concentration of Pr3+ for photoluminescence is determined to be 0.01. In addition, the diffuse reflectance spectrum of CLSGGO:0.01Pr3+ combined with the Kubelka–Munk equation calculated its optical band gap to be 4.83 eV. To study the influence of Pr3+-doping concentration on the LPL performance of the material, the TL curves of samples with different Pr3+-doping concentrations are measured and fitted with the first-order kinetic peak fitting software TL2000 1.0 version. These results indicated that the doping concentration affected the trap density and distribution in the material. Furthermore, the first-order kinetic simulation equation calculated the trap depth of the samples to be between 0.38 eV and 0.40 eV, and the trap density to be within the range of 8.80 × 10⁶–1.62 × 10⁷. The TL curves under different excitation times, different decay times, and different excitation temperatures studied the storage and release process of carriers in the traps. The relationship between the LPL decay curve and the decay time proved that the energy transfer process between carriers and the luminescence center mainly originated from the tunneling effect. Finally, based on the above characterization of the LPL luminescence phenomenon and mechanism, an electron capture physical model is proposed to describe the mechanism of the photoluminescence and LPL luminescence phenomena of CLSGGO:xPr3+.

Author Contributions

Conceptualization, H.L. and S.Z.; Methodology, X.S., R.D. and S.Z.; Software, X.S.; Validation, H.L.; Investigation, R.D.; Resources, H.Z.; Data curation, X.S. and R.D.; Writing—original draft, X.S. and R.D.; Writing—review & editing, H.L.; Supervision, H.Z.; Funding acquisition, H.Z. All authors have read and agreed to the published version of the manuscript.

Funding

This research was funded by the Program of Science and Technology Development Plan of Jilin Province of China (YDZJ202302CXJD065) and Basic Science Center Project of the National Natural Science Foundation of China (22388101).

Data Availability Statement

The original contributions presented in this study are included in the article. Further inquiries can be directed to the corresponding authors.

Conflicts of Interest

The authors declare no conflicts of interest.

References

  1. Matsuzawa, T.; Aoki, Y.; Takeuchi, N.; Murayama, Y. A New Long Phosphorescent Phosphor with High Brightness, SrAl2O4: Eu2+, Dy3+. J. Electrochem. Soc. 1996, 143, 2670–2673. [Google Scholar] [CrossRef]
  2. Yang, C.; Chen, X.; Mao, M.; Luo, X.; Sheng, W.; Lu, Z.; Sun, S.; He, H.; Su, W.; Song, K. Ionic Selective Occupation, Lattice Modulation and Photoluminescence Properties of Garnet Typed Orange-Yellow Phosphors for White-Light-Emitting Diodes. Ceram. Int. 2023, 49, 7683–7691. [Google Scholar] [CrossRef]
  3. Meng, Q.; Zhu, Q.; Li, X.; Sun, X.; Li, J. New Mg2+/Ge4+-Stabilized Gd3MgxGexAl5−2xO12:Ce Garnet Phosphor with Orange-Yellow Emission for Warm-White Leds (X = 2.0–2.5). Inorg. Chem. 2021, 60, 9773–9784. [Google Scholar] [CrossRef]
  4. Chen, M.; Lai, Y.; Zhou, J.; Shi, C.; Li, B.; Wu, D.; Wang, B.; Ding, J.; Jiang, X.; Wu, H.; et al. Near-Ultraviolet Excited Broadband Orange-Yellow Emitting Sr8MgIn(PO4)7:Eu2+ Phosphors for Wleds with High Color Rendering Index. Opt. Mater. 2021, 115, 111055. [Google Scholar] [CrossRef]
  5. Lin, T.; Fu, X.; Liu, Z.; Chen, N.; Zhang, J.; Liu, R.; Meng, W.; Zhang, H. X-ray induced long afterglow luminescence from UVC to red region in Ca2P2O7:Pr3+. J. Rare Earths 2024, 43, 1601–1606. [Google Scholar] [CrossRef]
  6. Bi, Y.-X.; Zhao, D.; Dai, S.-J.; Zhang, R.-J.; Yao, Q.-X. Colour change and long-persistent properties of a new phosphor YBaZn3GaO7:Bi3+/Eu3+. J. Alloy. Compd. 2024, 1003, 175693. [Google Scholar] [CrossRef]
  7. Zhang, J.; Wang, Z.; Huo, X.; Wang, Y.; Li, P. A Multi-Color Persistent Luminescent Phosphor Ca3Al2Ge3O12:Re3+ (Re3+ = Tb3+, Pr3+, Dy3+) for Dynamic Anti-Counterfeiting. J. Lumines. 2023, 254, 119518. [Google Scholar] [CrossRef]
  8. Zhang, J.; Chen, G. A long-persistent phosphor Sr3MgSi2O8−1.5xNx:Eu2+,Dy3+,Mn2+ based on white LEDs applications. J. Lumines. 2019, 211, 69–75. [Google Scholar] [CrossRef]
  9. Zeng, W.; Wang, Y.; Han, S.; Chen, W.; Li, G.; Wang, Y.; Wen, Y. Design, synthesis and characterization of a novel yellow long-persistent phosphor: Ca2BO3Cl:Eu2+,Dy3+. J. Mater. Chem. C 2013, 1, 3004–3011. [Google Scholar] [CrossRef]
  10. Li, R.; Li, H.; Zhang, D.; Chang, C. Tailoring Afterglow Properties of Polychromatic Long-Persistent LiMgxSr4−X−2y(BO3)3: y Eu2+ Phosphor by Codoping with Dy3+ or Nd3+. Ceram. Int. 2023, 49, 1336–1343. [Google Scholar] [CrossRef]
  11. Liang, L.; Yang, H.; Chen, Y.; Ding, Y.; Zhao, F.; Mao, Q.; Liu, M.; Zhong, J. Realizing Tunable Long Persistent Luminescent in Novel Cu2+-Doped NaGaO2 for Multi-Level Information Storage and Encryption. Adv. Opt. Mater. 2024, 12, 2401775. [Google Scholar] [CrossRef]
  12. Guo, A.; Zhu, Q.; Zhang, S.; Sun, X.; Li, J. A Building-Block Strategy for Dynamic Anti-Counterfeiting by Using (Ba,Sr)Ga2O4:Sm3+ New Red Persistent Luminescent Phosphor as an Important Component. Ceram. Int. 2023, 49, 4622–4630. [Google Scholar] [CrossRef]
  13. Vijayalakshmi, L.; Kumar, K.N.; Babu, P.R.; Palle, K.; Rosaiah, P.; Lim, J.; Ifseisi, A.A. Biocompatible Glasses Activated by Pr3+ with Tunable Luminescence and E-Band Emission for Applications in Red Phosphor, Visible Lasers, Broadband Optical Amplifiers and Greenhouse Glass. Ceram. Int. 2025, 51, 16387–16395. [Google Scholar] [CrossRef]
  14. Li, H.; Pang, R.; Luo, Y.; Wu, H.; Zhang, S.; Jiang, L.; Li, D.; Li, C.; Feng, J.; Zhang, H. Commendable Pr3+-Activated Ba2Ga2GeO7 Phosphor with High-Brightness White Long-Persistent Luminescence. J. Mater. Chem. C. 2019, 7, 6698–6705. [Google Scholar] [CrossRef]
  15. Huang, D.; Wu, G.; Liu, D.; Cheng, Z.; Dang, P.; Lian, H.; Lin, J. Defect engineering to develop green-emitting Eu2+-doped sulphide phosphor for water-resistant LED backlighting. J. Rare Earths 2025, in press. [Google Scholar] [CrossRef]
  16. Huang, X.; Chu, J.; Sun, J.; Wen, J.; Fang, L.; Wang, X.; Qiao, Z. Intrinsic defects and Bi3+ luminescence in Ba3Sc4O9: A first-principles study. J. Rare Earths 2025, in press. [Google Scholar] [CrossRef]
  17. Wang, B.; Lin, H.; Xu, J.; Chen, H.; Lin, Z.; Huang, F.; Wang, Y. Design, Preparation, and Characterization of a Novel Red Long-Persistent Perovskite Phosphor: Ca3Ti2O7:Pr3+. Inorg. Chem. 2015, 54, 11299–11306. [Google Scholar] [CrossRef]
  18. Lv, X.; Guo, N.; Qu, S.; Xin, Y.; Yang, M.; Shao, B.; Ouyang, R. Thermal activation induced charge transfer state absorption redshift realizes strong anti-thermal quenching in Pr3+-activated phosphor. Chem. Commun. 2024, 60, 2804–2807. [Google Scholar] [CrossRef]
  19. Liu, J.; Yang, C.; Chai, H.; Xin, Y.; Qu, S.; Guo, N. Enhanced thermally stable performance of Pr3+-doped vanadate phosphor by inhibiting the intervalence charge transfer quenching channel. Dalton Trans. 2024, 53, 4132–4138. [Google Scholar] [CrossRef] [PubMed]
  20. Wang, Y.; Feng, P.; Ding, S.; Tian, S.; Wang, Y. A Promising Route for Developing Yellow Long Persistent Luminescence and Mechanoluminescence in CaGa2O4:Pr3+,Li+. Inorg. Chem. Front. 2021, 8, 3748–3759. [Google Scholar] [CrossRef]
  21. Zhang, D.; Zhang, T.; Kurboniyon, M.; Wang, P.; Ma, C. Cationic Substitution-Enabled Green-Emitting Gd2-yYyLuAl4GaO12: Ce3+ Garnet Phosphors with High Quantum Efficiency and Superior Thermal Stability for Advanced Wleds. Inorg. Chem. 2025, 64, 12792–12803. [Google Scholar] [CrossRef] [PubMed]
  22. Jiang, L.; Wang, J.; Shi, Z.; Zhang, J.; Li, G.; Yu, H.; Si, W.; Zheng, H.; Zhang, L.; Su, Y. Alleviating wavelength efficiency trade-offs in Cr3+-activated garnet phosphors by high entropy engineering. J. Alloy. Compd. 2025, 1036, 181821. [Google Scholar] [CrossRef]
  23. Duan, J.; Bai, C.; Sun, J.; Wang, D.; Wang, Y. Highly Efficient Novel Garnet-Structured Yellow Emitting Phosphor for High Power Laser-Driven Lighting. Laser Photonics Rev. 2025, 19, 2401371. [Google Scholar] [CrossRef]
  24. Zhang, H.; Li, R.; Bai, Z. Luminescence properties and preparation of Lu3Al5O12 powder doped with Ce and Pr ions. J. Mater. Sci. Mater. Electron. 2018, 29, 10753–10761. [Google Scholar] [CrossRef]
  25. Qiao, J.; Zhang, J.; Zhang, X.; Hao, Z.; Liu, Y.; Luo, Y. The Energy Transfer and Effect of Doped Mg2+ in Ca3Sc2Si3O12:Ce3+, Pr3+ Phosphor for White Leds. Dalton Trans. 2014, 43, 4146–4150. [Google Scholar] [CrossRef]
  26. Yuan, W.; Pang, R.; Tan, T.; Wu, H.; Wang, S.; Su, J.; Wang, J.; Jiao, S.; Li, C.; Zhang, H. Tuning Emission Color and Improving the Warm-White Persistent Luminescence of Phosphor BaLu2Al2Ga2SiO12:Pr3+Via Zn2+ Co-Doping. Dalton Trans. 2021, 50, 12137–12146. [Google Scholar] [CrossRef] [PubMed]
  27. Xiong, Y.; Shi, Y.; Wang, H.; Zhang, Q.; Wu, T.; Yuan, Q.; Ma, K.; Li, T.; Zhou, Z.; Fang, J.; et al. Ce3+, Pr3+ Co-Doped Lu3Al5O12 Single Crystals and Ceramics: A Comparative Study. Materials 2022, 15, 9025. [Google Scholar] [CrossRef]
  28. Teng, Y.; Zhou, J.; Khisro, S.N.; Zhou, S.; Qiu, J. Persistent luminescence of SrAl2O4: Eu2+, Dy3+, Cr3+ phosphors in the tissue transparency window. Mater. Chem. Phys. 2014, 147, 772–776. [Google Scholar] [CrossRef]
  29. Sójka, M.; Runowski, M.; Woźny, P.; Carlos, L.D.; Zych, E.; Lis, S. Y2(Ge,Si)O5:Pr phosphors: Multimodal temperature and pressure sensors shaped by bandgap management. J. Mater. Chem. C 2021, 9, 13818–13831. [Google Scholar] [CrossRef]
  30. Wei, Y.; Dang, P.; Dai, Z.; Li, G.; Lin, J. Advances in near-Infrared Luminescent Materials without Cr3+: Crystal Structure Design, Luminescence Properties, and Applications. Chem. Mater. 2021, 33, 5496–5526. [Google Scholar] [CrossRef]
  31. Zhang, X.; Zhang, S.; Li, X.; Tan, T.; Wu, H.; Su, J.; Yuan, W.; Pang, R.; Jiang, L.; Li, D.; et al. Effect of Pr3+ Concentration on the Luminescent Properties of Ca2LuScGa2Ge2O12 Compound with Garnet Structure. J. Solid State Chem. 2022, 306, 122758. [Google Scholar] [CrossRef]
  32. Su, J.; Pang, R.; Tan, T.; Wang, S.; Chen, X.; Zhang, S.; Zhang, H. A Novel near-Infrared Emitting Sr2LuSbO6:Fe3+ Phosphor with Persistent Luminescence Performance. Adv. Optical Mater. 2024, 12, 2303187. [Google Scholar] [CrossRef]
  33. Xue, Z.; Ding, D.; Sima, Y.; Zhou, Z.; Dong, H.; Zhao, S.; Feng, H. Effects of two strategies on afterglow behavior of Lu2O3:Eu single crystal scintillator: Co-doping with Pr3+ and solid solution with Sc2O3. J. Rare Earths 2022, 41, 658–665. [Google Scholar] [CrossRef]
  34. Zhang, N.-N.; Jiang, X.-X.; Wang, Y.-N.; Pan, X.-R.; Zhang, Y.-Y.; Liu, B.; Yang, Y.-G.; Wang, X.-P. Synthesis, structure and luminescence characteristics of La3Ga5SiO14:Pr3+ phosphors. J. Alloy. Compd. 2023, 932, 167626. [Google Scholar] [CrossRef]
  35. Luo, J.; Li, X.; Li, Y.; Cheng, L.; Wang, Y.; Yu, H.; Chen, B. Multimodal Luminescence in Ca2InTaO6: Pr3+ Phosphors: Applications in Dynamic Anticounterfeiting and Optical Thermometry. Inorg. Chem. 2025, 64, 10653–10664. [Google Scholar] [CrossRef] [PubMed]
  36. Tian, X.; Li, J.; Sheng, H.; Li, T.; Guo, L.; Ji, C.; Huang, Z.; Wen, J.; Liu, X.; Li, C.; et al. Luminescence and optical thermometry based on silico-carnotite Ca3Y2Si3O12: Pr3+ phosphor. Ceram. Int. 2022, 48, 3860–3868. [Google Scholar] [CrossRef]
  37. Kumari, C.; Manam, J.; Sharma, S.K. Synthesis and luminescence properties of a bluish-green-emitting Sr3LiSbO6: Pr3+ phosphor for optoelectronic applications. Ceram. Int. 2023, 50, 10535–10550. [Google Scholar] [CrossRef]
  38. Megharaj, T.N.; Radha Krushna, B.R.; Pruthviraj, I.S.; Sharma, S.C.; Manjunatha, K.; Wu, S.Y.; Arunakumar, R.; Komahal, F.F.; Ramakrishna, G.; Nagabhushana, H. Luminescence and structural insights of β-Ca2SiO4:Pr3+ Phosphor: Applications towards TL dosimetry and solid state lighting. Mater. Chem. Phys. 2025, 334, 130508. [Google Scholar] [CrossRef]
  39. Zhang, Y.; Shan, X.; Lv, X.; Chen, D.; Miao, S.; Wang, W.; Liang, Y. Multimodal luminescence in Pr3+ single-doped Li2CaSiO4 phosphor for optical information storage and anti-counterfeiting applications. Chem. Eng. J. 2023, 474, 145886. [Google Scholar] [CrossRef]
  40. Kang, X.; Lü, W.; Zhu, Z.; Jia, C. A Novel Blue-Light Excitable Pr3+ Doped (Sr,Ba) LaMgTao6 Phosphor for Plant Growth Lighting. J. Rare Earths. 2023, 41, 666–672. [Google Scholar] [CrossRef]
  41. Tian, X.; Xu, S.; Wen, J.; Zhu, L.; Ji, C.; Huang, Z.; Wang, X.; Luo, F.; Liu, X.; Lu, Y.; et al. Thermochromic Pr3+ doped CaMoO4 phosphor with diverse thermal responses for temperature sensing. Ceram. Int. 2023, 49, 27126–27137. [Google Scholar] [CrossRef]
  42. Long, M.; Li, C.; Li, B.; Yi, L.; Zhang, F. A Multi-Functional Phosphor Ba5La3MgAl3O15: Pr3+ with Diverse Thermal Responses for High Sensitive Temperature Sensing, Photothermochromism Indicator and Patterned Anti-Counterfeiting. Ceram. Int. 2025, 51, 22340–22350. [Google Scholar] [CrossRef]
  43. Kameshwaran, R.; Kumar, K.G.; Aravinth, K.; Raja, A.; Ramachandran, K.; Annalakshmi, D.O.; Bhargav, P.B.; Venthan, S.M.; Gokulkannan, K. Photoluminescence and thermoluminescence behaviour of Pr3+ doped sodium bismuth phosphate phosphors. J. Alloy. Compd. 2025, 1034, 181330. [Google Scholar] [CrossRef]
  44. Zheng, J.; Shen, H.; Li, Y.; Li, H.; Yue, Z. Structural and luminescent performance and optical thermometry of Pr3+ doped SrWO4 down-conversion phosphors. J. Alloy. Compd. 2023, 968, 172112. [Google Scholar] [CrossRef]
  45. Feng, L.; Wang, Z.; Cao, C.; Zhang, T.; Zhang, J.; Ci, Z.; Zhao, Z.; Wang, Y. Warm-White Persistent Luminescence of Lu3Al2Ga3O12: Pr3+ Phosphor. J. Rare Earths. 2017, 35, 47–52. [Google Scholar] [CrossRef]
  46. Yuan, W.; Tan, T.; Wu, H.; Pang, R.; Zhang, S.; Jiang, L.; Li, D.; Wu, Z.; Li, C.; Zhang, H. Intense UV Long Persistent Luminescence Benefiting from the Coexistence of Pr3+/Pr4+ in a Praseodymium-Doped BaLu2Al2Ga2SiO12 Phosphor. J. Mater. Chem. C. 2021, 9, 5206–5216. [Google Scholar] [CrossRef]
  47. Yang, N.; Li, Z.; Zhou, T.; Zhang, Z.; Shi, W.; Tong, Y.; Shi, J. A Highly Sensitive Multiple-Mode Optical Thermometer Designed in Eu2+/3+ and Li+ Co-Doped Polymorphism Compound LaSc3(BO3)4. J. Adv. Ceram. 2024, 13, 821–833. [Google Scholar] [CrossRef]
  48. Zhang, J.; Wang, Z.; Huo, X.; Meng, X.; Wang, Y.; Suo, H.; Li, P. Anti-Counterfeiting Application of Persistent Luminescence Materials and Its Research Progress. Laser Photonics Rev. 2024, 18, 2300751. [Google Scholar] [CrossRef]
  49. Du, J.; Wang, X.; Sun, S.; Wu, Y.; Jiang, K.; Li, S.; Lin, H. Pushing Trap-Controlled Persistent Luminescence Materials toward Multi-Responsive Smart Platforms: Recent Advances, Mechanism, and Frontier Applications. Adv. Mater. 2024, 36, 2314083. [Google Scholar] [CrossRef] [PubMed]
  50. Liu, B.-M.; Lin, Y.; Liu, Y.; Lou, B.; Ma, C.-G.; Zhang, H.; Wang, J. Excitation-wavelength-dependent persistent luminescence from single-component nonstoichiometric CaGaxO4:Bi for dynamic anti-counterfeiting. Light Sci. Appl. 2024, 13, 286. [Google Scholar] [CrossRef]
  51. Parayil, R.T.; Gupta, S.K.; Mohapatra, M. A review on defect engineered NIR persistent luminescence through transition metal ion (Cr, Mn, Fe and Ni) doping: Wider perspective covering synthesis, characterization, fundamentals and applications. Coord. Chem. Rev. 2025, 522, 216200. [Google Scholar] [CrossRef]
  52. Gao, D.; Du, C.; Wang, Y.; Xu, W.; Gao, W.; Pang, Q.; Wang, Y. Controllable Persistent Luminescence in Bismuth Activated Memory Phosphors by Trap Management for Artificial Intelligence Anti-Counterfeiting. J. Mater. Chem. C. 2024, 12, 19487–19497. [Google Scholar] [CrossRef]
  53. Chen, L.; Li, P.; Shen, G.; Kang, X.; Tang, S.; Zhang, T.; Zhu, Q. Effective electron trap regulation in near-infrared persistent phosphor of ZnAl2O4:Cr3+ for round-the-clock plant lighting. Mater. Today Chem. 2024, 40, 102204. [Google Scholar] [CrossRef]
  54. Zhang, T.; Guo, H.; Shi, Q.; Qiao, J.; Cui, C.; Huang, P.; Wang, L. Investigation of a novel Pr3+-activated LiYGeO4 phosphor with red long-persistent luminescence. J. Lumines. 2024, 267, 120382. [Google Scholar] [CrossRef]
  55. Chen, N.; Lin, T.; Liu, Z.; Liu, R.; Zhang, J.; Fu, X.; Zhang, H. Ultraviolet and visible persistent luminescence from Sr3MgSi2O8:Pr3+. Ceram. Int. 2024, 50, 1891–1897. [Google Scholar] [CrossRef]
  56. Du, Q.; Ueda, J.; Tanabe, S. Influence of Trap Centers on Persistent Luminescence of Cr3+ or Yb3+ Co-Doped Y3Al2Ga3O12: Pr3+ Ceramic Phosphors. J. Am. Ceram. Soc. 2024, 107, 5524–5533. [Google Scholar] [CrossRef]
  57. Wang, Y.; Lin, N.; Yue, Y.; Wang, J.; Li, Y.; Wu, Z.; Xu, S.; Bai, G. Multi-Mode Luminescence in Smart near-Infrared Cr3+/Pr3+ Codoped SrGa12O19 Phosphors Induced by Three Distinct Excitation Mechanisms. ACS Appl. Mater. Interfaces. 2024, 16, 33855–33864. [Google Scholar] [CrossRef]
  58. Balhara, A.; Gupta, S.K.; Ghosh, P.S.; Abraham, M.; Tyagi, M.; Yadav, A.K.; Das, S.; Sudarshan, K.; Sarkar, P.S. Unleashing the Potential of Defect Engineered Persistent Pr3+-Activated Phosphors for Multi-Dimensional Anti-Counterfeiting and X-Ray Imaging Applications. Small 2025, 2501752. [Google Scholar] [CrossRef]
  59. Zhang, J.; Liu, R.; Fu, X.; Yi, J.; Lin, T.; Liu, Z.; Chen, N.; Zhang, H. X-Ray–Induced Multicolor Long Afterglow and Photostimulated Luminescence from Pr3+-Doped Sr3(PO4)2. J. Am. Ceram. Soc. 2025, 108, e20204. [Google Scholar] [CrossRef]
  60. Li, C.; Shen, Y.; Lai, F.; Guan, L.; Zhang, J.; Qiang, Y.; Wang, B.; Leng, Y.; Li, W.; You, W. Co-doping Sm3+ transforms Y2Ge2O7:Pr3+ into a novel orange-reddish long afterglow phosphor. J. Alloy. Compd. 2024, 1003, 175581. [Google Scholar] [CrossRef]
  61. Wang, Y.; Du, J.; Lin, H.; Poelman, D.; Zych, E. Unlocking triple-band persistent luminescence: Invisible UVC-UVB and visible red emission through structural modulation of Na2SrSi2O6:Pr3+ cyclosilicate. Mater. Horiz. 2025. [Google Scholar] [CrossRef] [PubMed]
  62. Wu, H.; Xu, M.; Zhou, J.; Yang, B.; Zhang, Y.; Chang, C. Rare earth Ho-induced oxygen vacancy in synergy with europium for efficient white afterglow luminescence in Sr2MgSi2O7. J. Rare Earths 2025, in press. [Google Scholar] [CrossRef]
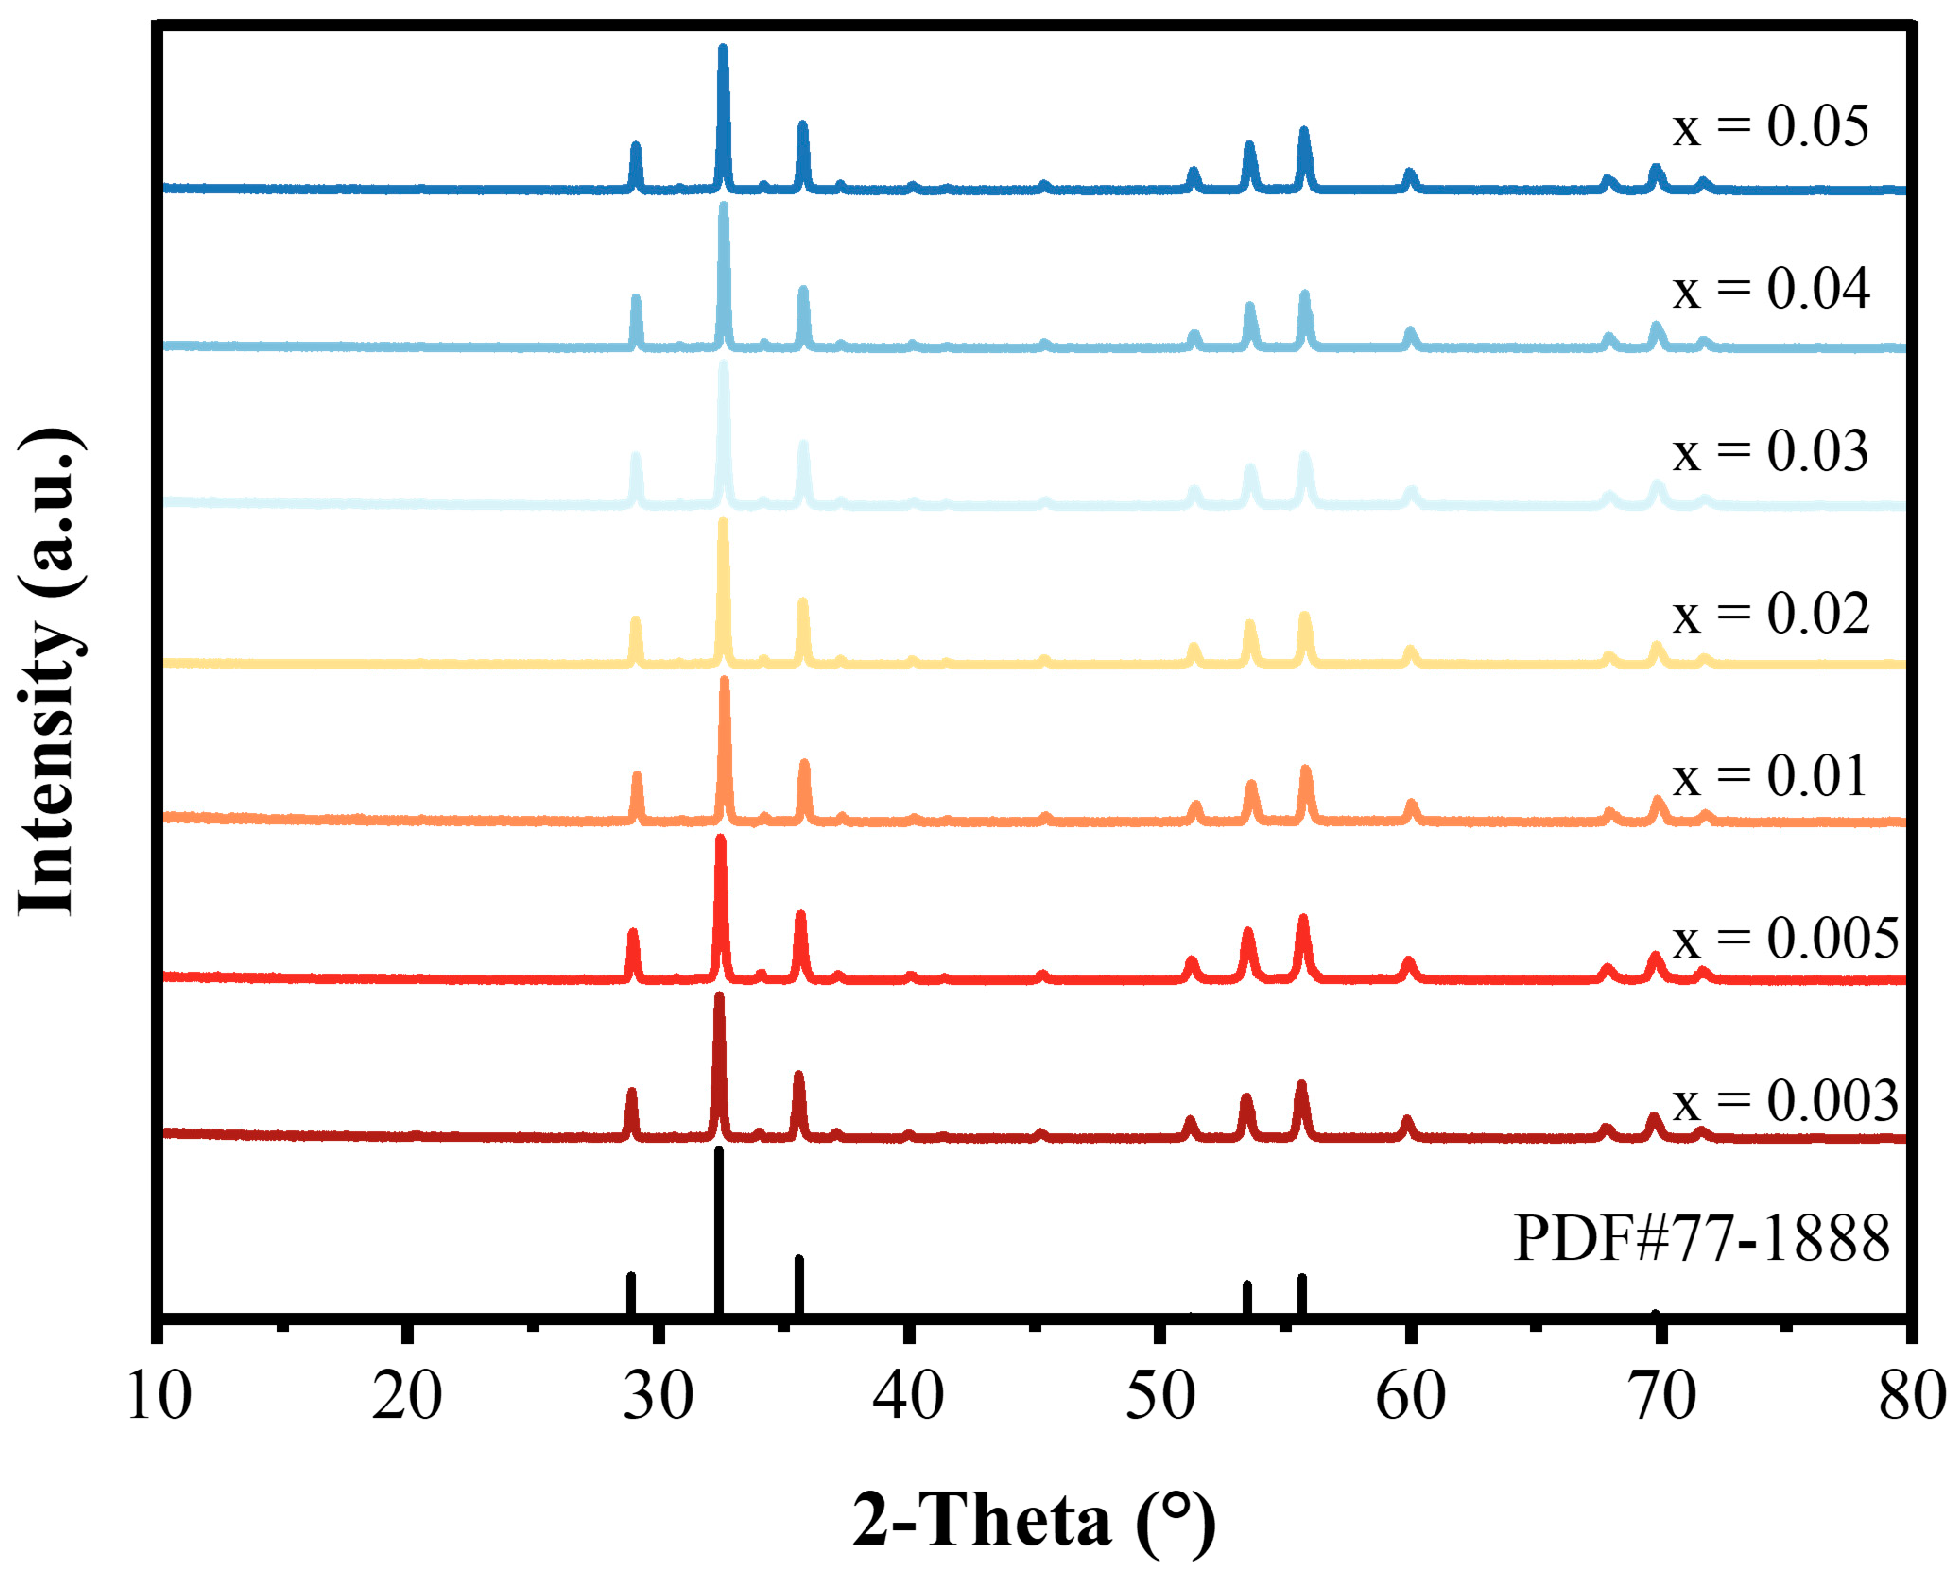
Figure 1. XRD patterns of CLSGGO:xPr3+ (x = 0.003, 0.005, 0.01, 0.02, 0.03, 0.04, 0.05).
Photochem 05 00038 g001
Figure 2. Micro-structures’ and elements’ characterization of the sample CLSGGO:0.05Pr3+. (a). TEM image of the sample under low magnification. (b). The HAADF-STEM image of the sample along [001]. (c) Crop image from (b). (d). The crystal structure of CLSGGO viewing along the direction of [001]. (e) The EDS mapping of the sample.
Photochem 05 00038 g002
Figure 3. EDS spectrum extracted from the selected mapping area. The corresponding elemental compositions taken and fitted from Figure 3, where the X-ray lines family used for quantification, and the atomic fraction, mass fraction, and the corresponding fitting error are given out.
Photochem 05 00038 g003
Figure 4. (a). The excitation spectrum of CLSGGO:0.01Pr3+. (b). The emission spectrum of CLSGGO:xPr3+ phosphors (x = 0.003, 0.005, 0.01, 0.02, 0.03, 0.04, 0.05).
Photochem 05 00038 g004
Figure 5. (a). Diffuse reflection spectrum of CLSGGO:0.01Pr3+ phosphor, the inset represents the absorption spectrum calculated by the Kubelka−Munk equation. (b). The PLQY of CLSGGO:0.01Pr3+ with 275 nm excitation.
Photochem 05 00038 g005
Figure 6. (a). TL curves of CLSGGO:xPr3+ phosphors (x = 0.003, 0.005, 0.01, 0.02, 0.03, 0.04, 0.05). (b). Normalized TL curves of CLSGGO:xPr3+ phosphors (x = 0.003, 0.005, 0.01, 0.02, 0.03, 0.04, 0.05). Fitting TL curves of CLSGGO:0.003Pr3+ in (c), CLSGGO:0.005Pr3+ in (d), CLSGGO:0.01Pr3+ in (e), CLSGGO:0.02Pr3+ in (f), CLSGGO:0.03Pr3+ in (g), CLSGGO:0.04Pr3+ in (h), CLSGGO:0.05Pr3+ in (i). The yellow, green, and blue lines represent trap1, trap2, and trap3, respectively.
Photochem 05 00038 g006
Figure 7. (a). TL curves of CLSGGO:0.01Pr3+ excited by 254 nm UV light for different charging times. (b). Normalized TL curves of CLSGGO:0.01Pr3+ excited by 254 nm UV light for different times. (c). TL curves of CLSGGO:0.01Pr3+ decay after different times which are pre-irradiated upon 254 nm UV light for 5 min. (d). Normalized TL curves of CLSGGO:0.01Pr3+ decay after different times which are pre-irradiated upon 254 nm UV light for 5 min. (e). PL spectra of CLSGGO:0.01Pr3+ upon pre-irradiated 254 nm UV light for 5 min at different temperature, 298 K to 523 K. (f). TL curves of CLSGGO:0.01Pr3+ upon pre-irradiated 254 nm UV light for 5 min at different temperature, 298 K to 523 K.
Photochem 05 00038 g007
Figure 8. (a). The PersL decay time of CLSGGO:xPr3+ phosphors (x = 0.003, 0.005, 0.01, 0.02, 0.03, 0.04, 0.05, recorded for 600 s). (b). The function of reciprocal PersL intensity (I−1).
Photochem 05 00038 g008
Figure 9. (a). The LPL excitation spectra of CLSGGO:0.01Pr3+ at 488 nm, 612 nm, and 621 nm. (b). The schematic pattern of the persistent luminescence mechanism of CLSGGO:Pr3+.
Photochem 05 00038 g009
Table 1. The calculated TL parameters of trap 1 (yellow line) of the CLSGGO:Pr3+ (x = 0.003–0.05) phosphors.
SampleTm/°CT1/°CT2/°CμgImE/eVn0
x = 0.00374481050.54255,9460.6941,262,805
x = 0.00577501060.52228,6000.7001,212,912
x = 0.0177521070.55211,4810.7001,001,847
x = 0.0275521000.52133,7400.696615,589
x = 0.0383541130.51125,6530.712722,050
x = 0.0476511030.52126,0100.698618,368
x = 0.057450980.5095,3990.694448,016
Disclaimer/Publisher’s Note: The statements, opinions and data contained in all publications are solely those of the individual author(s) and contributor(s) and not of MDPI and/or the editor(s). MDPI and/or the editor(s) disclaim responsibility for any injury to people or property resulting from any ideas, methods, instructions or products referred to in the content.