Article

Computational-Chemistry-Based Prediction of Near-Infrared Rhodamine Fluorescence Peaks with Sub-12 nm Accuracy

School of Chemistry and Chemical Engineering, Hainan University, Haikou 570228, China
*
Authors to whom correspondence should be addressed.
Photochem 2025, 5(2), 15; https://doi.org/10.3390/photochem5020015
Submission received: 11 April 2025 / Revised: 7 June 2025 / Accepted: 9 June 2025 / Published: 12 June 2025

Abstract

:
Near-infrared (NIR) rhodamine dyes are pivotal for bioimaging due to the minimal tissue interference. Yet, their rational design is hindered by unreliable computational methods for excited-state property prediction. We benchmarked the time-dependent density functional theory (TDDFT) with the linear-response (LR) and state-specific (SS) solvation models across five functionals (CAM-B3LYP, M06-2X, ωB97X-D, B3LYP, MN15) and optimized the ground/excited states for 42 rhodamine derivatives. A robust linear calibration framework was established by connecting the computed and experimental wavelengths, which was rigorously validated through six-fold cross-validation. The key metrics included the mean absolute error (MAE) and R2 to assess the prediction robustness. CAM-B3LYP combined with LR solvation achieved the highest accuracy (absorption: MAE = 6 nm, R2 = 0.94; emission: MAE = 12 nm, R2 = 0.72). By integrating the TDDFT with a calibrated linear-response solvation model, we achieved sub-12 nm accuracy in predicting the NIR fluorescence peaks. This framework enabled the rational design of nine novel rhodamine derivatives with emissions beyond 700 nm, offering a paradigm shift in bioimaging probe development.

Graphical Abstract

1. Introduction

Near-infrared (NIR) (650–900 nm) wavelength fluorescent dyes are attractive for biological applications because of the minimal tissue absorption and low background autofluorescence from serum, proteins, and other biomolecules in the NIR range, meaning that a high contrast can be obtained between the target and the background tissue [1,2,3,4,5,6,7]. Among the various fluorophores, rhodamine dyes have attracted considerable interest because of their excellent photophysical properties, such as their high molar extinction coefficients, excellent fluorescence quantum yields, and great photostability [8,9,10,11,12]. Therefore, developing NIR rhodamines would be highly desirable for application in fluorescence imaging.
Many efforts have been dedicated to designing superior NIR rhodamine dyes. The most representative strategy is the replacement of the bridging oxygen atom with a silicon (Si) atom [13]. The Si atom led to a redshift of ~90 nm in the emission wavelengths compared with the parent rhodamine dyes [13,14]. In addition, the replacement of the bridging oxygen atom with a phosphorus moiety also can elicit a ~140 nm bathochromic shift compared with the parent rhodamine dyes [15]. The strong electron-accepting properties and effective σ*–π* interactions of the phosphorus moiety caused the long emission wavelengths [15]. Moreover, another versatile strategy was to extend the π-conjugation of the xanthene moiety by adding aromatic rings toward the NIR region [16,17]. For example, Drexhage and co-workers constructed tetrahydroquinoline structural rhodamine dyes, which had emission wavelengths of over 660 nm [8]. Based on the two strategies, numerous NIR rhodamine dyes have been developed and applied in super-resolution imaging [18,19,20].
Incontestably, experimental methods still dominate in the development of NIR rhodamine dyes. The lack of theoretical studies on NIR rhodamine dyes is due to the great challenge of accurately modeling the excited-state properties of rhodamine dyes with computational chemistry tools. For example, previous studies showed that the time-dependent density functional theory (TDDFT) would overestimate the lowest excitation energies (underestimating the absorption wavelength) of rhodamine dyes [21,22]. Although pure functionals can offer reliable excitation energy, these functionals provide an incorrect order for the lowest nπ* and ππ* for charge transfer rhodamine dyes [23]. Theoretical studies also demonstrated that the complete active space self-consistent field with dynamic correlation treated by second-order perturbation theory (CASPT2) calculations produced a good agreement with the experimental excitation energy [23]. Still, the method is unsuitable for studying large dyes. Additionally, as far as we know, these reported theoretical works focused mainly on the prediction of excitation energies and few studies on emission spectra have been reported. These drawbacks make theoretical screening of NIR rhodamine dyes challenging. Hence, proposing reliable methods for predicting the properties of the excited states, including the absorption and emission wavelengths of rhodamine dyes, is important for accelerating NIR rhodamine dyes.
In this work, we combine five popular functionals (M06-2X, ωB97X-D, B3LYP, MN15, and CAM-B3LYP) with the linear-response and state-specific solvation models to predict the absorption and emission wavelengths of NIR rhodamine dyes. The establishment of a linear calibration relationship between the calculated and experimental wavelengths enables significantly improved prediction accuracy for the absorption and emission wavelengths of NIR rhodamine dyes, with the mean absolute errors (MAE) decreasing dramatically from the original range of 38.74–256.27 nm to a refined range of 6.26–18.92 nm through this calibration approach. Through the systematic evaluation of 10 functional–solvation combinations, we identified the model integrating CAM-B3LYP (as the functional) with the LR solvation models as the most robust wavelength prediction framework. This optimized model achieved a correlation coefficient of 0.94 and demonstrated high precision with a mean absolute error (MAE) of only 6 nm. Based on this relationship, nine new rhodamine derivatives (with an emission wavelength exceeding 700 nm) were systematically designed and evaluated. We expected that our investigation could provide experimental researchers with a practical tool to predict NIR wavelengths with quantitative reliability, thereby advancing the design of fluorescent probes.

2. Computational Methods

The geometries were fully optimized using five popular functionals (M06-2X, ωB97X-D, B3LYP, CAM-B3LYP, MN15) and the Def2-SVP basis set using the Gaussian 16 C01 code [24]. These functionals were selected for the following reasons: (1) B3LYP is the most popular functional for studying the electronic properties in the ground and excited states of organic dyes, (2) MN15 has been demonstrated to reliably assess the excitation energies of difluoroboranes and hydroxyphenylimidazo[1,2-a]pyridine derivatives [25], (3) M06-2X is heavily used to investigate the excited state properties of rhodamine dyes [26,27], and (4) CAM-B3LYP and ωB97X-D are range-separated hybrid functionals, which are recommended to evaluate the excited-state properties of charge transfer dyes [28]. The solvent effect was considered by the solvation model based on the density (SMD) model in all the calculations [29]. Line-response and state-specific solvation models were adopted to calculate the absorption and emission wavelengths.
For our dataset of 42 samples, the 6-fold cross-validation worked as follows. (1) The samples were randomly divided into 6 equal groups (with 7 samples per group). (2) In each of the 6 iterations, one group was temporarily set aside as the test set, while the remaining 5 groups (35 samples) were used to train the model. (3) After training, the model predicted the test set’s results. This process repeated until every group has been tested once. (4) Finally, the R2 value for each test set (one per fold) was calculated, resulting in 6 R2 values across all the iterations. These values were visualized as a boxplot, where the spread of the box reflects the prediction consistency (narrower ranges = higher stability) and the mean R2 quantifies the overall performance (higher values = better accuracy).

3. Results and Discussion

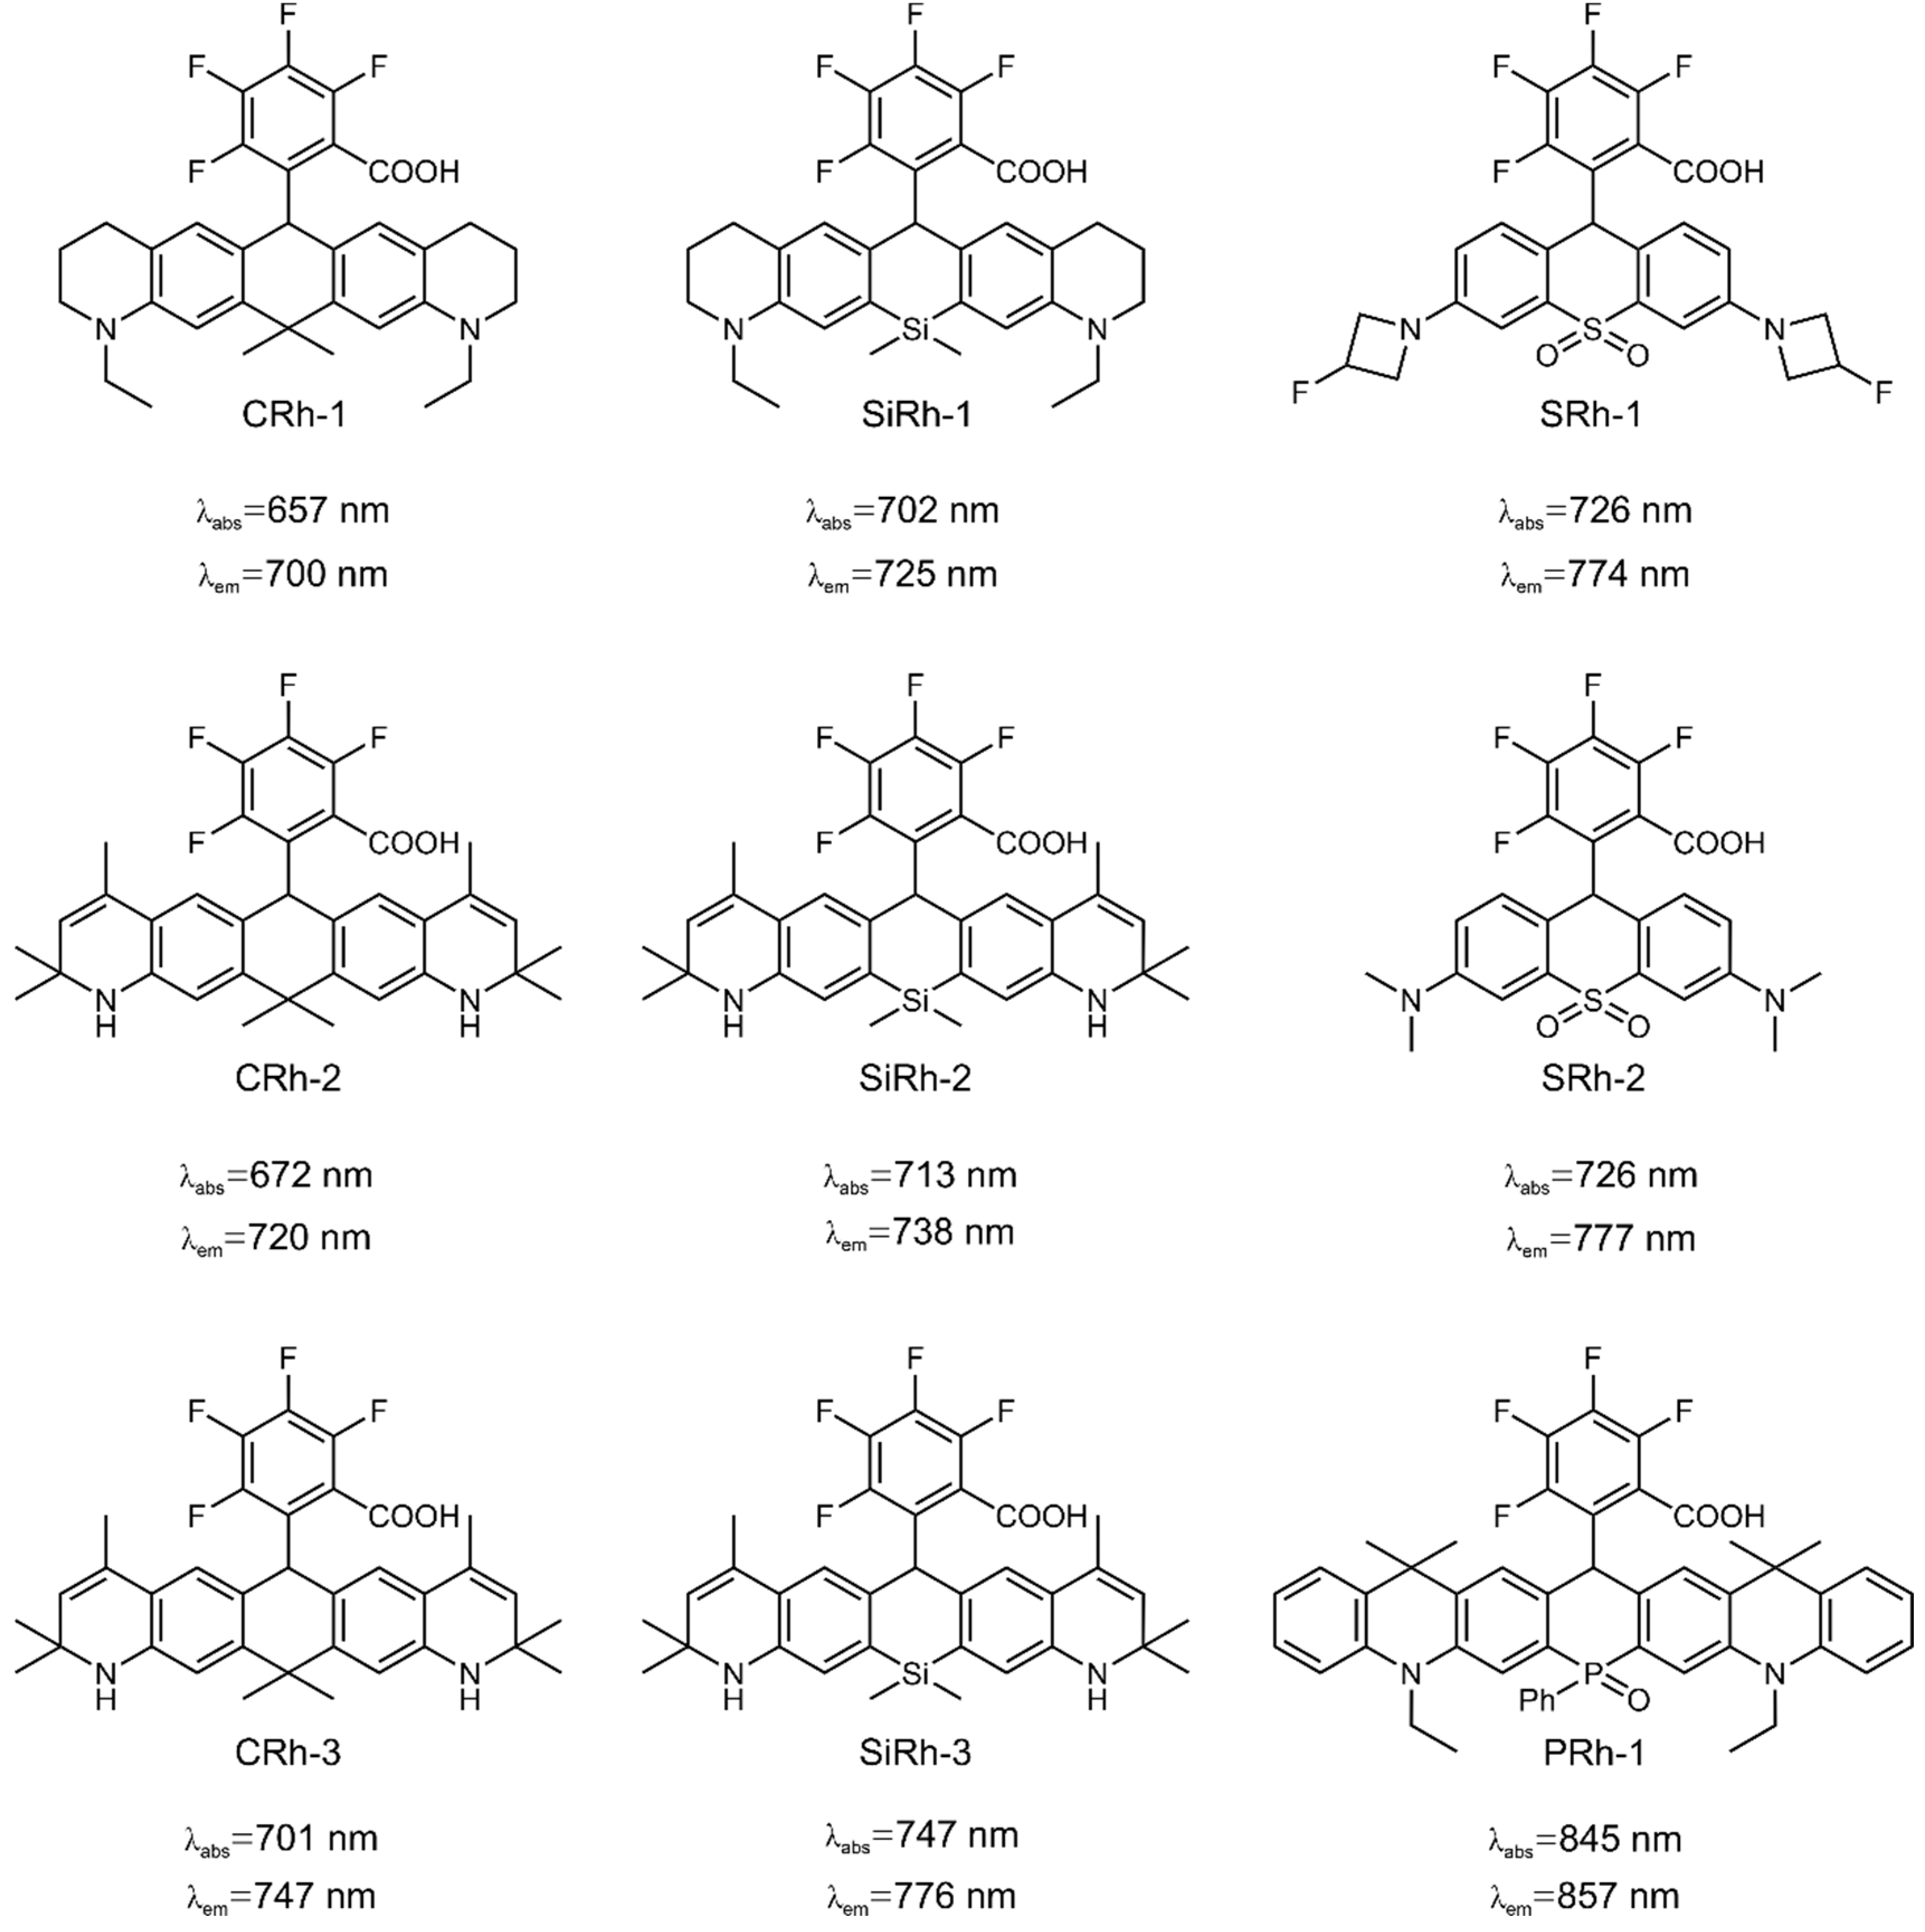
3.1. Calculating the Wavelength of Dyes

In this study, we systematically curated 42 rhodamine dyes with emission wavelengths exceeding 650 nm from the published literature to establish a focused molecular database. The constructed database comprises four carbon-bridged, 10 silicon-bridged, six sulfur-bridged, and 22 phosphorus-bridged rhodamine derivatives. Our investigation specifically targeted the open-ring form of these dyes, as their closed-ring counterparts exhibit negligible fluorescence due to structural constraints. The structures and experimental spectral data of the selected dye molecules are shown in Table S1.
To benchmark the computational accuracy, we assessed five functionals (M06-2X, ωB97X-D, B3LYP, MN15, and CAM-B3LYP) of the absorption and emission wavelengths for these rhodamine dyes. The absorption and emission wavelengths calculated by the LR and SS solvation models of these rhodamine dyes are listed in Tables S2–S11. For each method, we calculated the mean absolute error (MAE) between the predicted values and the experimental values. The MAE is calculated as follows:
M A E = 1 n i = 1 n λ e x p i λ c a l i
where λexp. is the experimental value, λcal. is the predicted value, and n is the sample size.
Unfortunately, the calculated λcal. exhibits a significant disparity compared with the λexp., with a high MAE margin ranging from 39 to 256 nm, as shown in Table 1. This direct wavelength computation method exhibits significant inherent errors that cannot be overlooked in accurately predicting experimental absorption/emission wavelengths (λexp.). Such large discrepancies likely stem from the TDDFT’s known limitations in treating charge transfer transitions [30] and the insufficient treatment of solvent reorganization between the ground and excited states [31].

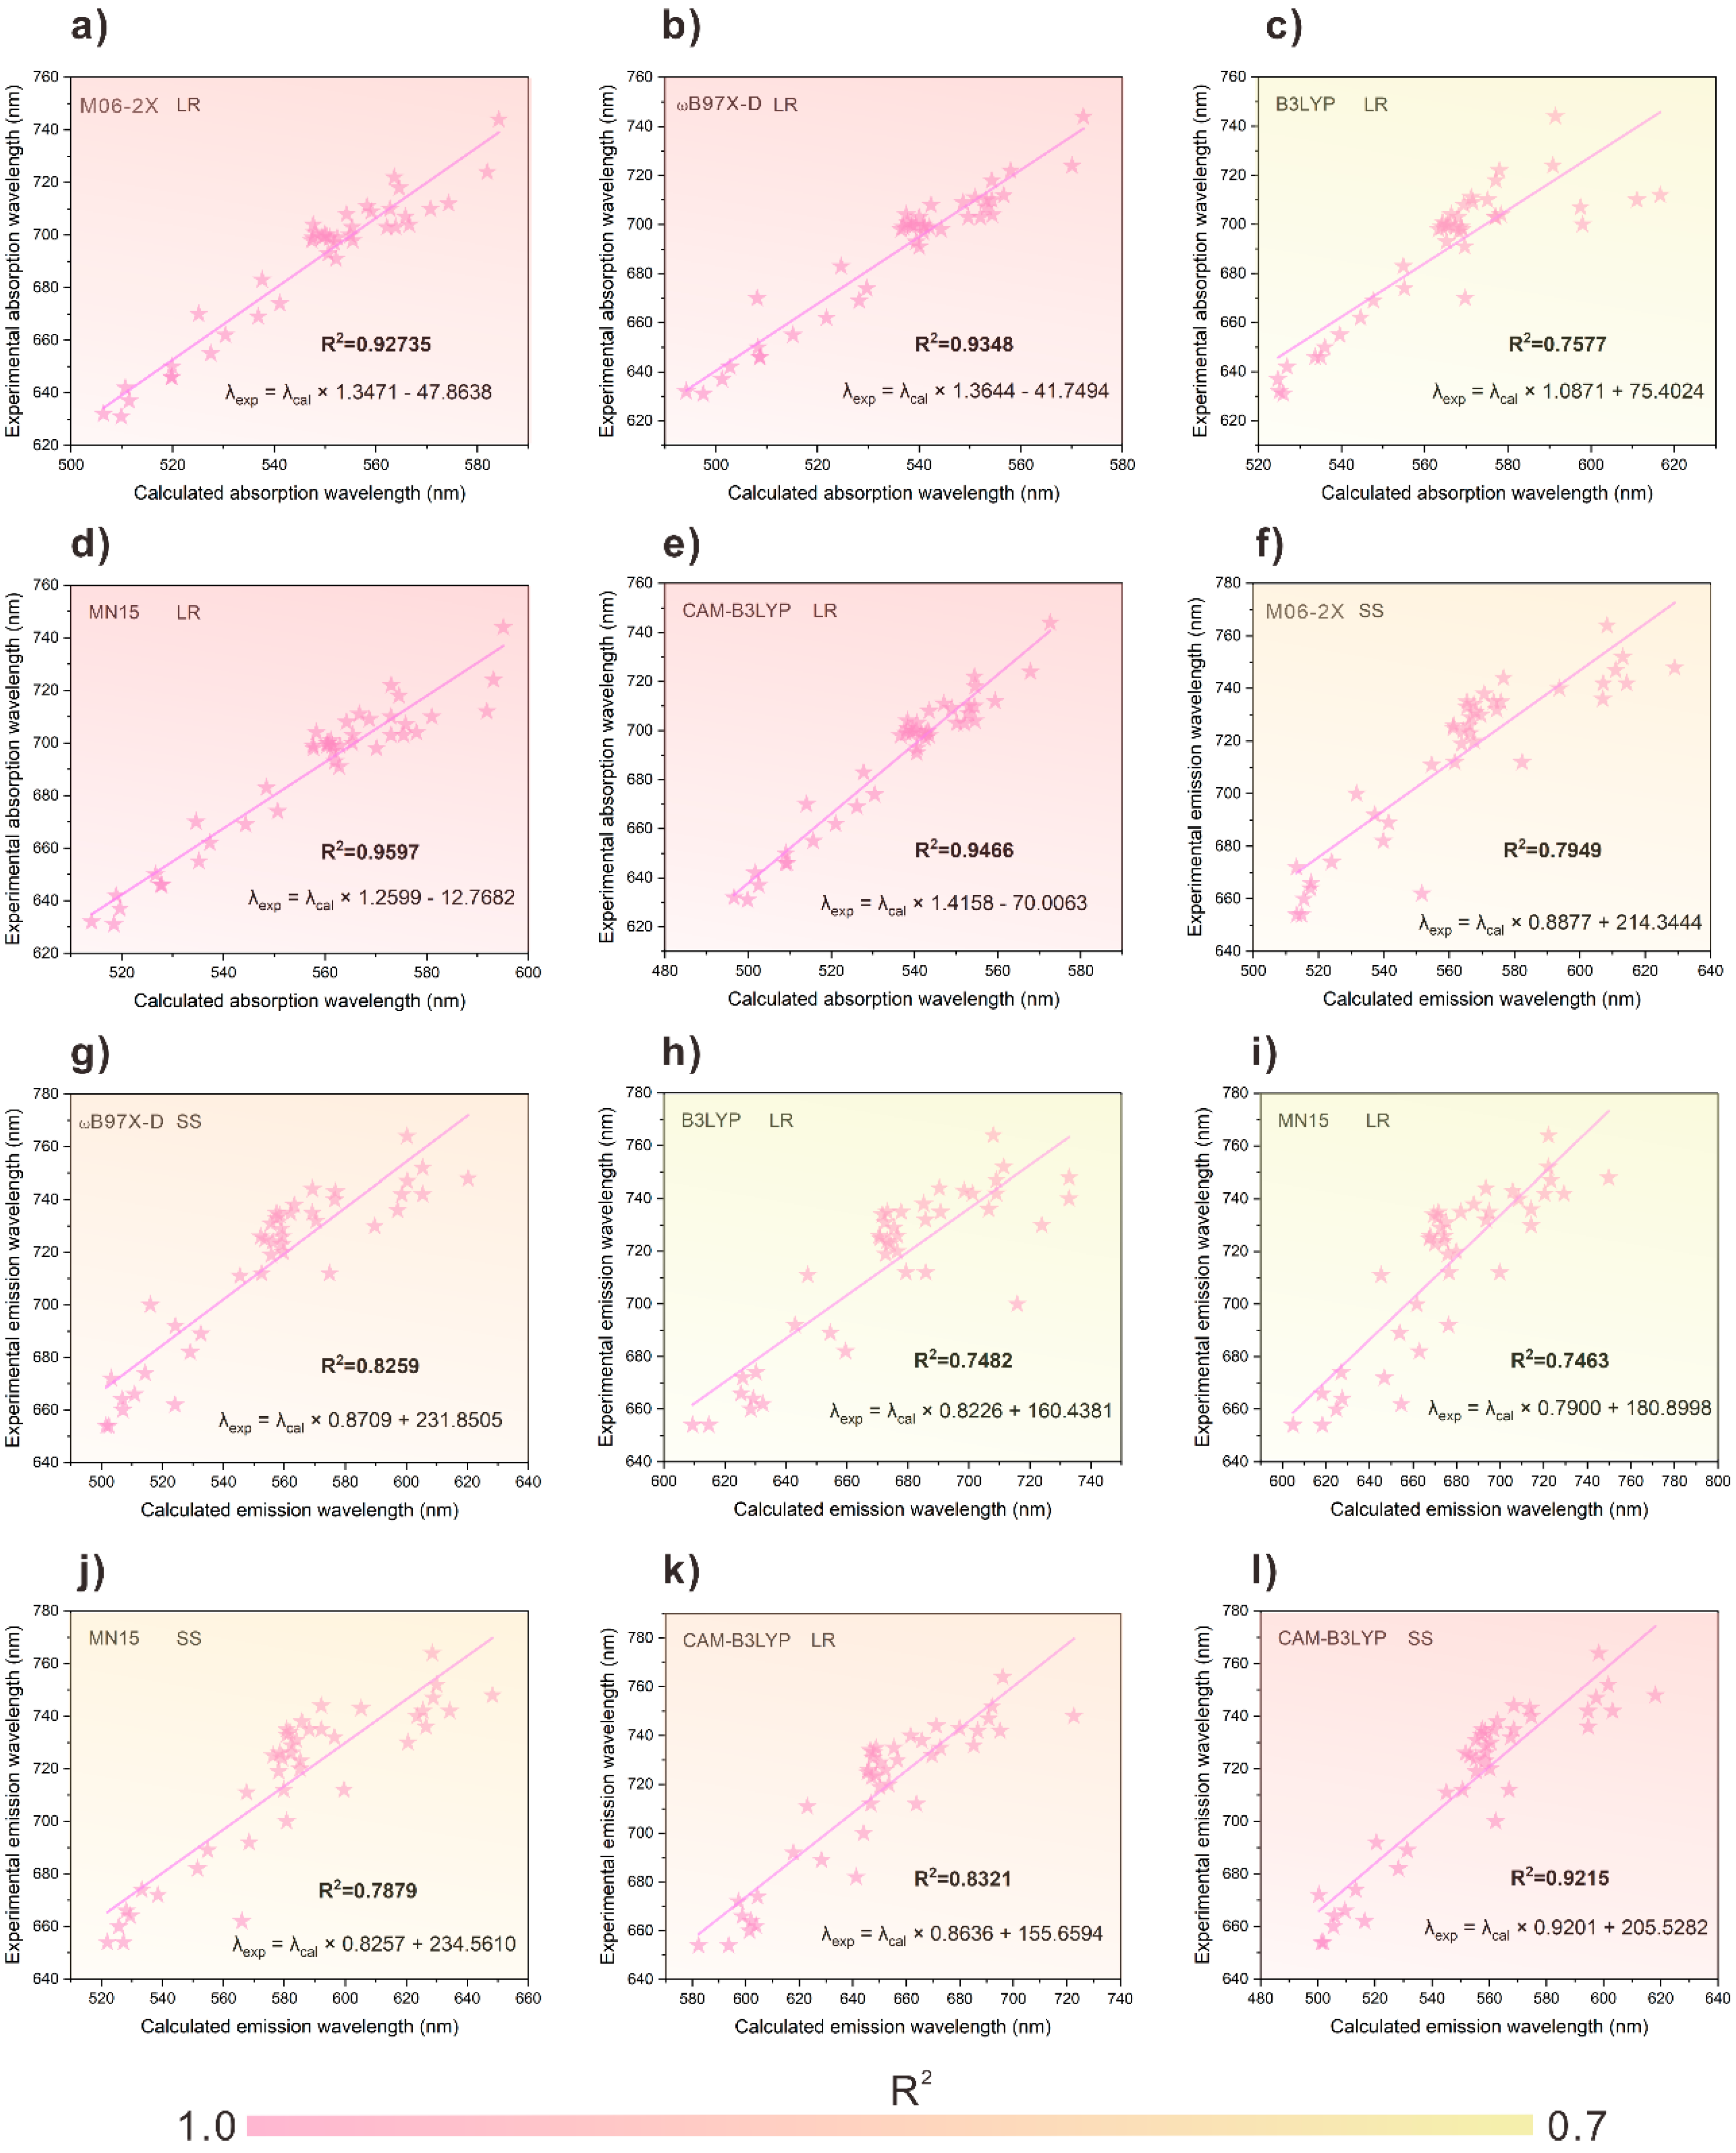
3.2. Establishing a λcal.–λexp. Relationship

To enhance the accuracy of the prediction, we attempted to establish the relationship between the calculated λcal. and the experimental λexp.. During the basis set selection, we compared the performance of def2−SVPD (with diffuse functions) and def2−SVP (without diffuse functions). We observed that def2−SVP yielded superior fitting performance (Figure S1). Consequently, we consistently opted for basis sets devoid of diffuse functions in all the subsequent calculations. The correlations of the λcal. and λexp. values built by various methods are shown in Figure 1 and Figures S2–S9. The calibrated predicted wavelength (λpre.) was derived by applying the linear correction to the TDDFT−computed wavelength. Notably, the absorption wavelengths calculated using the MN15 functional combined with the LR solvation model showed the strongest correlation (R2 = 0.959, Figure 1d), emerging as the top−performing approach among those evaluated. Considering the limited dataset of dye molecules reported in the existing database, we adopted a six−fold cross−validation strategy to evaluate and identify the optimal computational methodology systematically.
After evaluating the linear regression model through six-fold cross-validation, we recalculated the mean absolute error (MAE) between the λpre. and λexp. values. As illustrated in Table 2, establishing a linear calibration relationship between the λpre. and the λexp. led to a substantial reduction in the prediction error, with the range of the MAE decreasing from 256.27–38.74 nm to 6.26–18.92 nm. Therefore, the establishment of a linear relationship between λcal. and λexp. significantly enhances the accuracy of wavelength predictions.

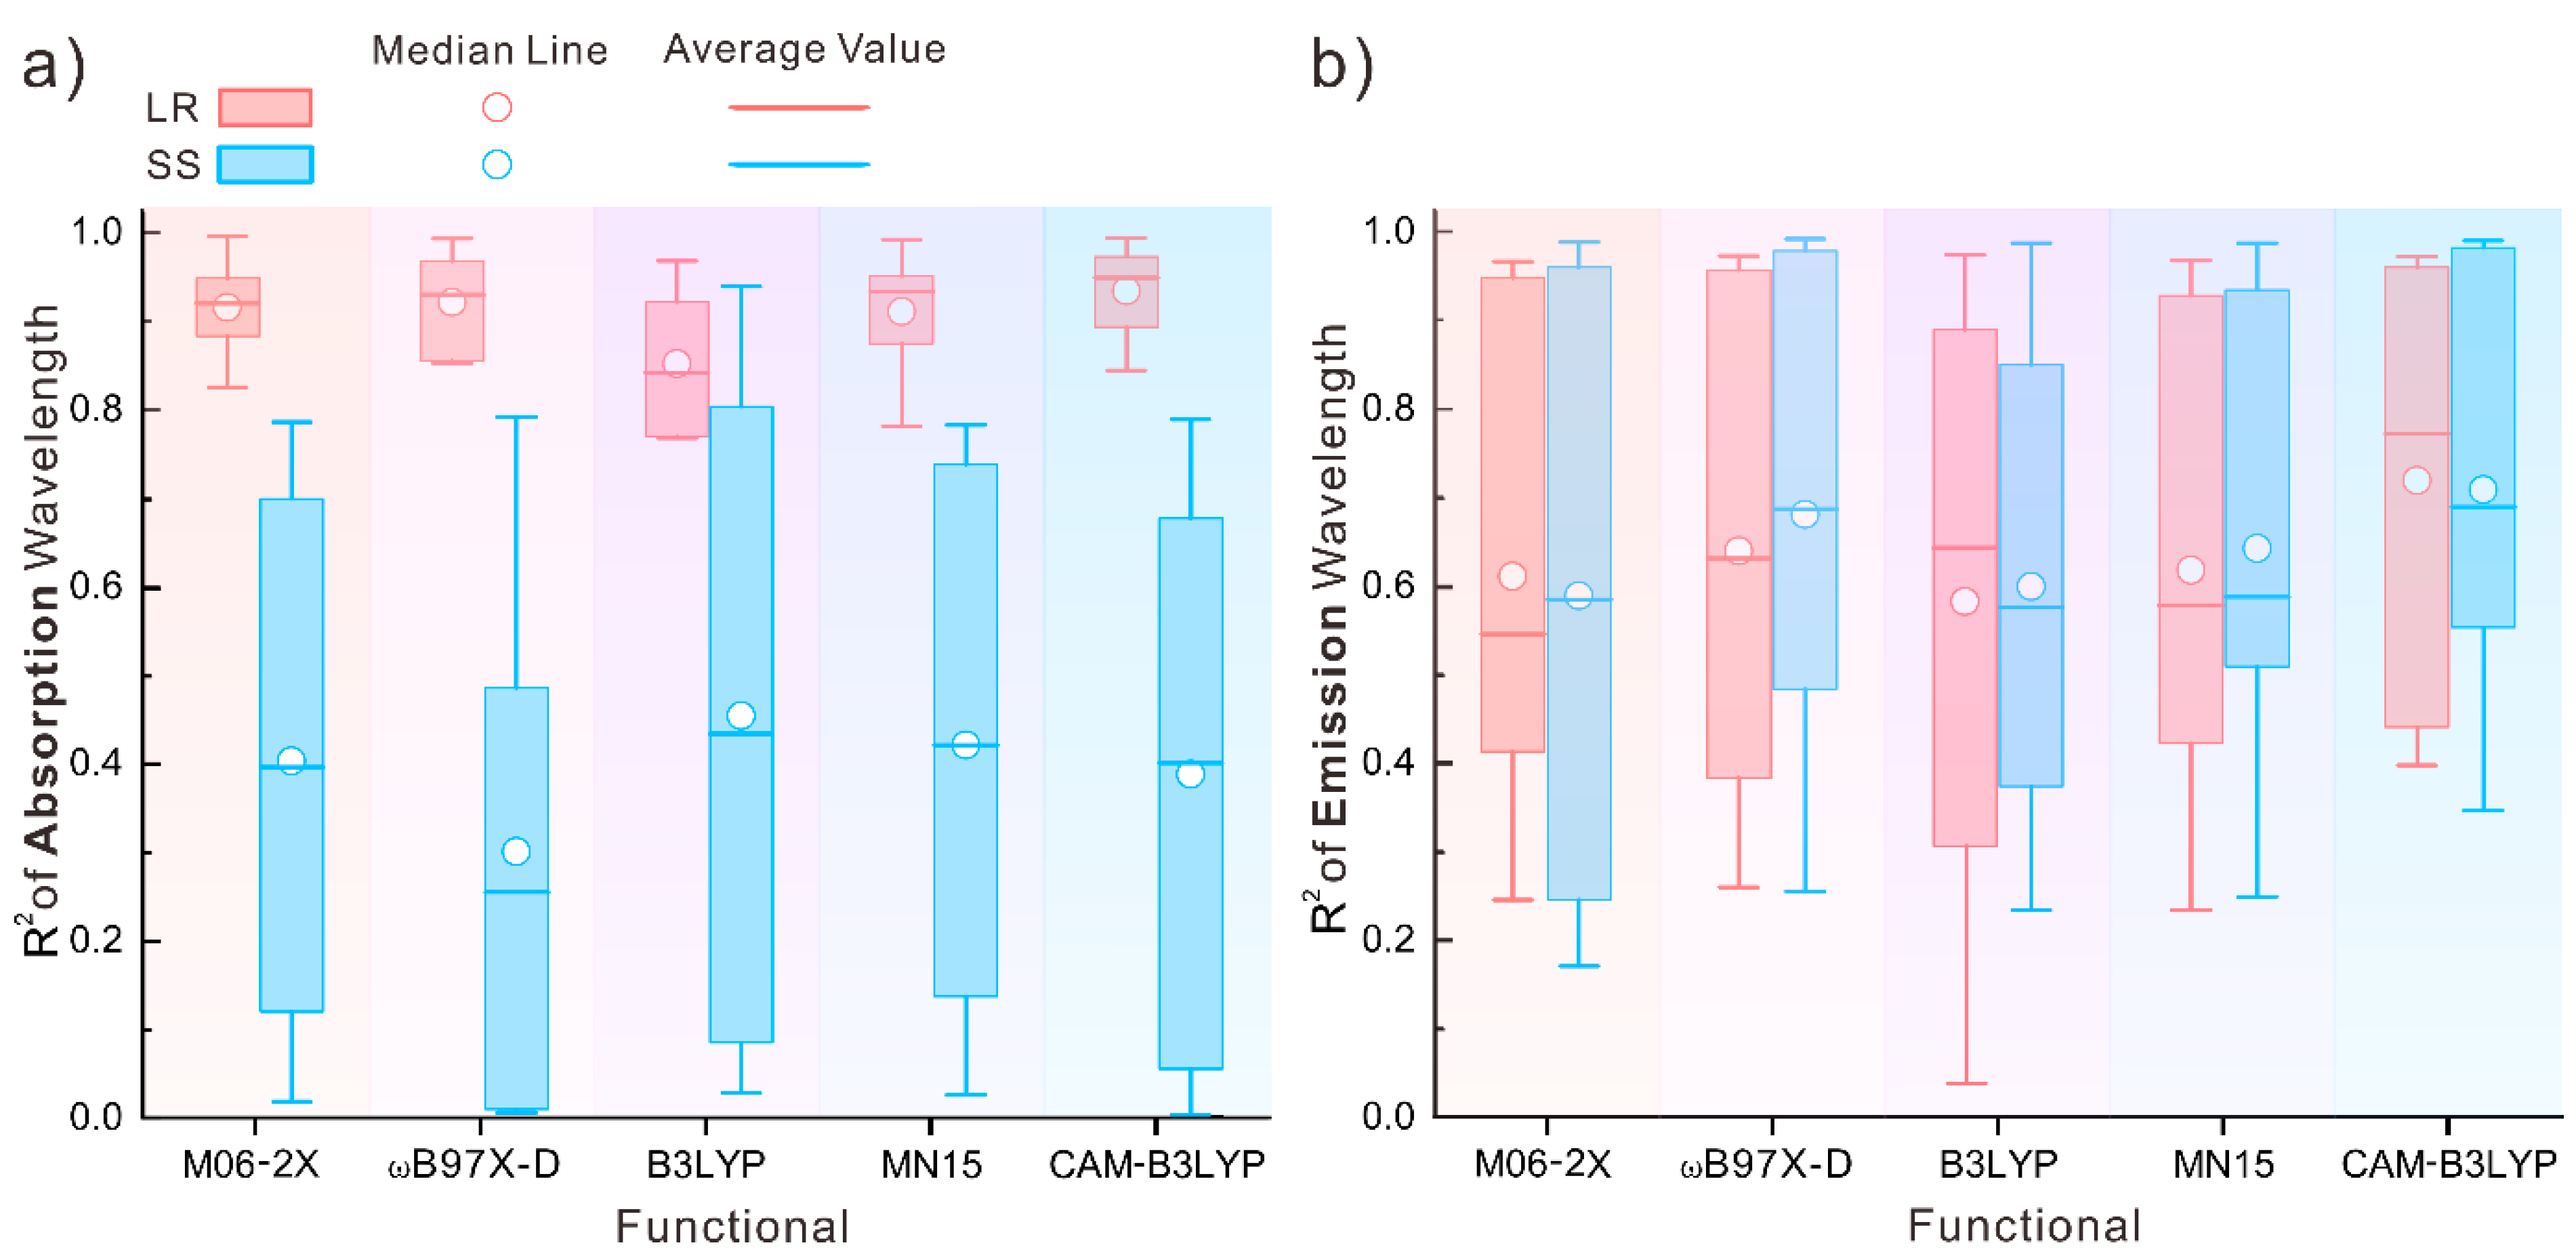
3.3. Selection of Wavelength Prediction Model

However, certain computational methodologies yield a higher MAE or λcal. that demonstrates less pronounced correlations with the λexp. values. Therefore, the selection of appropriate computational approaches significantly influences the predictive accuracy of wavelength determination.
As detailed in Table S12, the coefficient of determination (R2) for the absorption/emission wavelength prediction was comprehensively evaluated using five functionals (M06-2X, ωB97X-D, B3LYP, MN15, and CAM-B3LYP) combined with the LR and SS solvation models through six-fold cross-validation. Furthermore, the methodological performance across these configurations is graphically represented through the boxplot analysis in Figure 2, providing a quantitative comparison of the prediction accuracy variations. The boxplots show the distribution of the R2 values of the absorption/emission wavelength for each functional, where red and blue represent the LR and SS data, respectively, circles represent the mean, and horizontal lines represent the median.
For the absorption wavelength predictions, it is obvious that the LR model shows much higher median and average R2 values compared to the SS model, indicating better performance. The LR model also has a smaller interquartile range (IQR), suggesting more consistent predictions. The LR solvation model underestimates the modifications in the solute–solvent interactions arising from the dipole moment shift between the ground and excited states, whereas the SS approach explicitly incorporates this effect. However, due to the relatively minor role of the solvent reorganization effects in wavelength predictions for rhodamine dyes, the LR model demonstrates superior accuracy compared to the SS method in estimating the absorption/emission wavelengths of these systems [32,33].
For the absorption wavelength predictions, CAM-B3LYP with the LR model, among all the methods, shows the highest median and average R2 value (0.9355), with a relatively small IQR, indicating both high accuracy and consistency. Compared to the absorption wavelength predictions, the methods for predicting the emission wavelength exhibit limited precision and reliability, showing a lower median, average R2 value, and much wider IQR. CAM-B3LYP remains relatively superior, achieving an average R2 value of 0.72. In addition, the CAM-B3LYP functional combined with the LR solvation model demonstrated the lowest MAE (11.96) among all the methods (Table 2). CAM-B3LYP is a hybrid functional that incorporates Hartree–Fock (HF) exchange differentiation between the short- and long-range electron interactions [34]. This feature enables it to reliably describe the excited-state charge transfer and electron delocalization. The π-electron delocalization and heteroatom substituents in rhodamine dyes may induce charge-transfer-like excitations. Emission wavelength predictions rely on modeling the excited-state geometric relaxation, which requires accurate treatment of the long-range electron correlation and nonlocal exchange effects. CAM-B3LYP’s range-separated hybrid functional effectively captures the long-range electron correlations and charge transfer excitations, which dominate rhodamine electronic transitions. Combined with LR, this model outperforms the others in balancing accuracy and computational feasibility. Compared to CAM-B3LYP, B3LYP lacks long-range correction, leading to errors in the charge transfer and delocalized excitations [35]. The meta-hybrid functionals, M06-2X and MN15, lack explicit long-range separation, limiting the accuracy for charge transfer states in large conjugated systems like rhodamines [36]; ωB97X-D also includes long-range correction, but its dispersion corrections focus on only weak interactions [37]. The emission wavelengths of the rhodamine dyes in our dataset are predominantly located in the near-infrared (NIR) region. These dyes exhibit pronounced charge transfer (CT) character in their excitations. The CAM-B3LYP functional, which incorporates both long- and short-range exchange components, provides a balanced description of CT-dominated transitions, thus yielding improved accuracy in our calculations.
Based on the analysis of the boxplots and MAE, the CAM-B3LYP functional combined with the LR solvation model appears to be the best method for predicting wavelengths, especially the absorption wavelength. This combination consistently shows the highest median and average R2 values with relatively small IQRs and low MAEs, indicating both high accuracy and consistency in its predictions.

3.4. Computational Design and Screening of Near-Infrared Rhodamines

Drawing on the existing structural frameworks and benchmarking data of rhodamine systems [8,38,39], we proposed a strategy (CAM-B3LYP/Def2SVP with linear-response solvation) to design rhodamine derivatives with redshifted absorption profiles. All the designed variants are predicted to absorb > 650 nm and emit > 700 nm, situating them within the near-infrared (NIR) regime critical for deep-tissue imaging (Figure 3 and Table S13). One standout candidate, PRh1, exhibits predicted absorption at 845 nm and emission beyond 857 nm. This computational pipeline establishes a template for the rational design of NIR-II rhodamines, circumventing the traditional trial-and-error synthesis paradigm. The experimental validation of these candidates could unlock transformative tools for in vivo imaging and multiplexed super-resolution microscopy.

4. Conclusions

In conclusion, this study resolved the NIR wavelength prediction challenges in rhodamines through systematic excited-state refinements of 42 derivatives by integrating five density functionals (including CAM-B3LYP, M06-2X, ωB97X-D, B3LYP, MN15) with the linear-response (LR) and state-specific (SS) solvation models. A six-fold cross-validated linear calibration framework successfully mapped the predictions to the experimental absorption/emission wavelengths, resolving the systematic discrepancies inherent to the TDDFT. The quantitative analysis identified CAM-B3LYP/LR solvation as the optimal approach, delivering predictive accuracy nearing the experimental error margins (absorption MAE = 6 nm, R2 = 0.94; emission MAE = 12 nm, R2 = 0.72). The established correlation informed the computational design of nine new rhodamine dyes, all predicted to exhibit emission maxima beyond 700 nm. This framework bridges quantum chemistry and experimental photophysics, offering a predictive blueprint for precision NIR dye engineering.

Supplementary Materials

The following supporting information can be downloaded at: https://www.mdpi.com/article/10.3390/photochem5020015/s1, Figure S1: Linear correlation between the calculated and experimental absorption wavelength of rhodamine dyes using CAM-B3LYP with def2-SVPD (a) and def2-SVP (b) basis sets (TDDFT/LR); Figure S2: Correlation plots between the calculated and experimental absorption wavelength, at the M062X/SS level; Figure S3: Correlation plots between the calculated and experimental emission wavelength, at the M062X/LR level; Figure S4: Correlation plots between the calculated and experimental absorption wavelength, at the WB97XD/SS level; Figure S5: Correlation plots between the calculated and experimental emission wavelength, at the WB97XD/LR level; Figure S6: Correlation plots between the calculated and experimental absorption wavelength, at the B3LYP/SS level; Figure S7: Correlation plots between the calculated and experimental emission wavelength, at the B3LYP/SS level; Figure S8: Correlation plots between the calculated and experimental absorption wavelength, at the MN15/SS level; Figure S9: Correlation plots between the calculated and experimental absorption wavelength, at the CAM-B3LYP/SS level; Table S1: Structure and experimental spectral data of dyes; Table S2: The experimental and calculated absorption wavelength at the M062X level; Table S3: The experimental and calculated emission wavelength at the M062X level; Table S4: The experimental and calculated absorption wavelength at the WB97XD level; Table S5: The experimental and calculated emission wavelength at the WB97XD level; Table S6: The experimental and calculated absorption wavelength at the B3LYP level; Table S7: The experimental and calculated emission wavelength at the B3LYP level; Table S8: The experimental and calculated absorption wavelength at the MN15 level; Table S9: The experimental and calculated emission wavelength at the MN15 level; Table S10: The experimental and calculated absorption wavelength at the CAM-B3LYP level; Table S11: The experimental and calculated emission wavelength at the CAM-B3LYP level; Table S12: The R² for absorption/emission wavelength prediction using five functionals (M06-2X, WB97XD, B3LYP, MN15, and CAM-B3LYP) combined with linear response (LR) and state-specific (SS) solvation models through 6-fold cross-validation; Table S13: Designed rhodamine derivatives with correlated absorption and emission wavelengths (λabs & λem).

Author Contributions

Q.Y.: Writing—original draft, Visualization, Validation, Formal analysis, Data curation. H.W.: Writing—Visualization, Formal analysis. P.S.: Writing—review & editing, Supervision. C.Z.: Resources, Funding acquisition. W.C.: Writing—Review & editing, Supervision, Investigation, Funding acquisition. All authors have read and agreed to the published version of the manuscript.

Funding

This work was financially supported by the National Natural Science Foundation of China (No. 22,203,024 and 32360236), the Hainan Provincial Natural Science Foundation of China (No. 123QN181 and 123MS001), the Collaborative Innovation Center Foundation of the Hainan University (No. XTCX2022JKB03), the Hainan Provincial Foreign Experts Project (No. G20230607014E), and the Research Start-up Fund Project of Hainan University (No. RZ2200001217 and RZ2200001216).

Data Availability Statement

The original contributions presented in this study are included in the article/Supplementary Material. Further inquiries can be directed to the corresponding authors.

Acknowledgments

The authors gratefully acknowledge HZWTECH for providing computational facilities.

Conflicts of Interest

The authors declare that they have no known competing financial interests or personal relationships that could have appeared to influence the work reported in this paper.

References

  1. Koide, Y.; Urano, Y.; Hanaoka, K.; Piao, W.; Kusakabe, M.; Saito, N.; Terai, T.; Okabe, T.; Nagano, T. Development of NIR fluorescent dyes based on Si–rhodamine for in vivo imaging. J. Am. Chem. Soc. 2012, 134, 5029–5031. [Google Scholar] [CrossRef]
  2. Li, H.; Kim, Y.; Jung, H.; Hyun, J.Y.; Shin, I. Near-infrared (NIR) fluorescence-emitting small organic molecules for cancer imaging and therapy. Chem. Soc. Rev. 2022, 51, 8957–9008. [Google Scholar] [CrossRef]
  3. Feng, Z.; Tang, T.; Wu, T.; Yu, X.; Zhang, Y.; Wang, M.; Zheng, J.; Ying, Y.; Chen, S.; Zhou, J.; et al. Perfecting and extending the near-infrared imaging window. Light Sci. Appl. 2021, 10, 197. [Google Scholar] [CrossRef]
  4. Usama, S.M.; Inagaki, F.; Kobayashi, H.; Schnermann, M.J. Norcyanine-carbamates are versatile near-infrared fluorogenic probes. J. Am. Chem. Soc. 2021, 143, 5674–5679. [Google Scholar] [CrossRef]
  5. Dong, M.; Wang, D.; Yang, J.; Sun, P.; Ding, W.; Yang, J.; Yan, J.; Chi, W.J. Computational chemistry-assisted design of hydrazine-based fluorescent molecular rotor for viscosity sensors. Smart Mol. 2023, 1, e20230011. [Google Scholar] [CrossRef]
  6. Yang, X.Z.; Yao, S.; Wu, J.; Diao, J.; He, W.; Guo, Z.; Chen, Y.J. Recent advances in single fluorescent probes for monitoring dual organelles in two channels. Smart Mol. 2024, 2, e20240040. [Google Scholar] [CrossRef]
  7. Duo, Y.Y.; Zhao, L.; Wang, Z.G.; Liu, S.L. NIR-II fluorophores: From synthesis to biological applications. J. Anal. Test. 2023, 7, 245–259. [Google Scholar] [CrossRef]
  8. Wang, L.; Du, W.; Hu, Z.; Uvdal, K.; Li, L.; Huang, W. Hybrid rhodamine fluorophores in the visible/nir region for biological imaging. Angew. Chem. Int. Ed. 2019, 58, 14026–14043. [Google Scholar] [CrossRef]
  9. Grimm, J.B.; Tkachuk, A.N.; Xie, L.; Choi, H.; Mohar, B.; Falco, N.; Schaefer, K.; Patel, R.; Zheng, Q.; Liu, Z.; et al. A general method to optimize and functionalize red-shifted rhodamine dyes. Nat. Methods 2020, 17, 815–821. [Google Scholar] [CrossRef]
  10. Ye, Z.; Yu, H.; Yang, W.; Zheng, Y.; Li, N.; Bian, H.; Wang, Z.; Liu, Q.; Song, Y.; Zhang, M.; et al. Strategy to lengthen the on-time of photochromic rhodamine spirolactam for super-resolution photoactivated localization microscopy. J. Am. Chem. Soc. 2019, 141, 6527–6536. [Google Scholar] [CrossRef]
  11. Zhang, J.; Yue, C.; Ke, Y.; Qu, H.; Zeng, L. Fluorescent probes for the detection of biogenic amines, nitrite and sulfite in food: Progress, challenges and perspective. Adv. Agrochem 2023, 2, 127–141. [Google Scholar] [CrossRef]
  12. Chen, J.; Liu, H.; Xie, W.; Gu, M.; Mao, G.; Yang, S.J. Recent progress in endoplasmic reticulum-targetable small-molecule probes for fluorescence sensing and phototherapy. J. Anal. Test. 2023, 7, 304–324. [Google Scholar] [CrossRef]
  13. Fu, M.; Xiao, Y.; Qian, X.; Zhao, D.; Xu, Y. A design concept of long-wavelength fluorescent analogs of rhodamine dyes: Replacement of oxygen with silicon atom. Chem. Commun. 2008, 15, 1780–1782. [Google Scholar] [CrossRef]
  14. Zhou, P.; Ning, C.; Alsaedi, A.; Han, K. The effects of heteroatoms Si and S on tuning the optical properties of rhodamine- and fluorescein-based fluorescence probes: A theoretical analysis. ChemPhysChem 2016, 17, 3139–3145. [Google Scholar] [CrossRef]
  15. Chai, X.; Cui, X.; Wang, B.; Yang, F.; Cai, Y.; Wu, Q.; Wang, T. Near-infrared phosphorus-substituted rhodamine with emission wavelength above 700 nm for bioimaging. Chem. Eur. J. 2015, 21, 16754–16758. [Google Scholar] [CrossRef]
  16. Gong, Y.J.; Zhang, X.B.; Mao, G.J.; Su, L.; Meng, H.M.; Tan, W.; Feng, S.; Zhang, G. A unique approach toward near-infrared fluorescent probes for bioimaging with remarkably enhanced contrast. Chem. Sci. 2016, 7, 2275–2285. [Google Scholar] [CrossRef]
  17. McCann, T.E.; Kosaka, N.; Koide, Y.; Mitsunaga, M.; Choyke, P.L.; Nagano, T.; Urano, Y.; Kobayashi, H. Activatable optical imaging with a Silica-rhodamine based Near Infrared (SiR700) fluorophore: A comparison with cyanine based dyes. Bioconjug. Chem. 2011, 22, 2531–2538. [Google Scholar] [CrossRef]
  18. Grzybowski, M.; Taki, M.; Senda, K.; Sato, Y.; Ariyoshi, T.; Okada, Y.; Kawakami, R.; Imamura, T.; Yamaguchi, S. A highly photostable near-infrared labeling agent based on a phospha-rhodamine for long-term and deep imaging. Angew. Chem. Int. Ed. 2018, 57, 10137–10141. [Google Scholar] [CrossRef]
  19. Liu, J.; Sun, Y.Q.; Zhang, H.; Shi, H.; Shi, Y.; Guo, W. Sulfone-rhodamines: A new class of near-infrared fluorescent dyes for bioimaging. ACS Appl. Mater. Interfaces 2016, 8, 22953–22962. [Google Scholar] [CrossRef] [PubMed]
  20. Liu, D.; He, Z.; Zhao, Y.; Yang, Y.; Shi, W.; Li, X.; Ma, H. Xanthene-based NIR-II dyes for in vivo dynamic imaging of blood circulation. J. Am. Chem. Soc. 2021, 143, 17136–17143. [Google Scholar] [CrossRef] [PubMed]
  21. Kulesza, A.J.; Titov, E.; Daly, S.; Włodarczyk, R.; Megow, J.; Saalfrank, P.; Choi, C.M.; MacAleese, L.; Antoine, R.; Dugourd, P. Excited States of Xanthene Analogues: Photofragmentation and Calculations by CC2 and Time-Dependent Density Functional Theory. ChemPhysChem 2016, 17, 3129–3138. [Google Scholar] [CrossRef] [PubMed]
  22. Moore, B., II; Schrader, R.L.; Kowalski, K.; Autschbach, J. Electronic π-to-π* Excitations of Rhodamine Dyes Exhibit a Time-Dependent Kohn–Sham Theory “Cyanine Problem”. ChemistryOpen 2017, 6, 385–392. [Google Scholar] [CrossRef] [PubMed]
  23. Zhou, P. Why the lowest electronic excitations of rhodamines are overestimated by time-dependent density functional theory. Int. J. Quantum Chem. 2018, 118, e25780. [Google Scholar] [CrossRef]
  24. Frisch, M.J.; Trucks, G.W.; Schlegel, H.B.; Scuseria, G.E.; Robb, M.A.; Cheeseman, J.R.; Scalmani, G.; Barone, V.; Petersson, G.A.; Nakatsuji, H.; et al. Gaussian, version C; Gaussian, Inc.: Wallingford, CT, USA, 2016.
  25. Grabarz, A.M.; Ośmiałowski, B. Benchmarking Density Functional Approximations for Excited-State Properties of Fluorescent Dyes. Molecules 2021, 26, 7434. [Google Scholar] [CrossRef]
  26. Chi, W.J.; Qi, Q.L.; Wang, C.; Zheng, J.; Zhou, W.; Xu, N.; Wu, X.; Jiang, X.; Tan, D.; Xu, Z.C.; et al. Descriptor ΔGC-O Enables the Quantitative Design of Spontaneously Blinking Rhodamines for Live-Cell Super-Resolution Imaging. Angew. Chem. Int. Ed. 2020, 59, 20215–20223. [Google Scholar] [CrossRef]
  27. Chi, W.J.; Qi, Q.L.; Lee, R.; Xu, Z.C.; Liu, X.G. A Unified Push–Pull Model for Understanding the Ring-Opening Mechanism of Rhodamine Dyes. J. Phys. Chem. C 2020, 124, 3793–3801. [Google Scholar] [CrossRef]
  28. Wang, C.; Qiao, Q.L.; Chi, W.J.; Chen, J.; Liu, W.; Tan, D.; McKechnie, S.; Lyu, D.; Jiang, X.F.; Zhou, W.; et al. Quantitative Design of Bright Fluorophores and AIEgens by the Accurate Prediction of Twisted Intramolecular Charge Transfer (TICT). Angew. Chem. Int. Ed. 2020, 59, 10160–10172. [Google Scholar] [CrossRef]
  29. Marenich, A.V.; Cramer, C.J.; Truhlar, D.G. Universal Solvation Model Based on Solute Electron Density and on a Continuum Model of the Solvent Defined by the Bulk Dielectric Constant and Atomic Surface Tensions. J. Phys. Chem. B 2009, 113, 6378–6396. [Google Scholar] [CrossRef] [PubMed]
  30. Casida, M.E.; Huix-Rotllant, M. Progress in time-dependent density-functional theory. Annu. Rev. Phys. Chem. 2012, 63, 287–323. [Google Scholar] [CrossRef]
  31. Dhbaibi, K.; Morgante, P.; Vanthuyne, N.; Autschbach, J.; Favereau, L.; Crassous, J. Low-temperature luminescence in organic helicenes: Singlet versus triplet state circularly polarized emission. J. Phys. Chem. Lett. 2023, 14, 1073–1081. [Google Scholar] [CrossRef]
  32. Tomasi, J.; Mennucci, B.; Cammi, R. Quantum mechanical continuum solvation models. Chem. Rev. 2005, 105, 2999–3094. [Google Scholar] [CrossRef] [PubMed]
  33. Van den Heuvel, W.; Reinholdt, P.; Jensen, H.J.A.; Kongsted, J. Multiconfigurational SCF and Short-Range DFT Combined with Polarizable Density Embedding: Comparison of Linear-Response and State-Specific Solvatochromic Shifts of Acrolein and Para-nitrophenolate in Water. J. Chem. Theory Comput. 2022, 18, 6231–6239. [Google Scholar] [CrossRef] [PubMed]
  34. Cipolloni, M.; Fresch, B.; Occhiuto, I.; Rukin, P.; Komarova, K.G.; Cecconello, A.; Willner, I.; Levine, R.D.; Remacle, F.; Collini, E. Coherent electronic and nuclear dynamics in a rhodamine heterodimer–DNA supramolecular complex. Phys. Chem. Chem. Phys. 2017, 19, 23043–23051. [Google Scholar] [CrossRef]
  35. Selenius, E.; Sigurdarson, A.E.; Schmerwitz, Y.L.; Levi, G. Orbital-optimized versus time-dependent density functional calculations of intramolecular charge transfer excited states. J. Chem. Theory Comput. 2024, 20, 3809–3822. [Google Scholar] [CrossRef]
  36. Yu, H.S.; He, X.; Li, S.L.; Truhlar, D.G. MN15: A Kohn–Sham global-hybrid exchange–correlation density functional with broad accuracy for multi-reference and single-reference systems and noncovalent interactions. Chem. Sci. 2016, 7, 5032–5051. [Google Scholar] [CrossRef]
  37. Paul, B.K.; Rakshit, P.A. Computational assessment of the O−H···O intramolecular hydrogen-bonding in substituted phenalenes: Diverse degrees of covalence. Monatsh. Chem. 2023, 154, 605–613. [Google Scholar] [CrossRef]
  38. Yuan, Q.L.; Ma, M.Y.; Wang, M.Y.; Sun, P.P.; Xiao, X.Q.; Chi, W.J. Determining the Recruiting Rate of Spontaneously Blinking Rhodamines by Density Functional Calculations. J. Phys. Chem. A 2025, 129, 667–676. [Google Scholar] [CrossRef]
  39. Ren, X.; Wang, C.; Wu, X.; Rong, M.; Huang, R.; Liang, Q.; Shen, T.; Sun, H.; Zhang, R.; Zhang, Z.; et al. Auxochrome Dimethyl-Dihydroacridine Improves Fluorophores for Prolonged Live-Cell Super-Resolution Imaging. J. Am. Chem. Soc. 2024, 146, 6566–6579. [Google Scholar] [CrossRef]
Figure 1. Linear correlation between the calculated and experimental absorption wavelengths using (a) M06−2X/LR (R2 = 0.9274), (b) ωB97X−D/LR (R2 = 0.9348), (c) B3LYP/LR (R2 = 0.7577), (d) MN15/LR (R2 = 0.9597), (e) CAM−B3LYP/LR (R2 = 0.9466); and emission wavelength using the (f) M06−2X/SS (R2 = 0.7949), (g) ωB97X−D/SS (R2 = 0.8259), (h) B3LYP/LR (R2 = 0.7482), (i) MN15/LR (R2 = 0.7463), (j) MN15/SS (R2 = 0.7879), (k) CAM−B3LYP/LR (R2 = 0.8321), and (l) CAM−B3LYP/SS (R2 = 0.9215).
Photochem 05 00015 g001
Figure 2. The boxplot of the R2 through six-fold cross-validation for the (a) absorption and (b) emission wavelengths using five functionals combined with the linear-response (LR) and state-specific (SS) solvation models.
Photochem 05 00015 g002
Figure 3. Structural design of rhodamine derivatives with the correlated absorption and emission wavelengths (λabs. and λem.).
Photochem 05 00015 g003
Table 1. Mean absolute error (nm) of the calculated wavelength (λcal.) and experimental wavelength (λexp.) in the absorption and emission wavelengths.
M062XWB97XDB3LYPMN15CAM-B3LYP
MAEAbsLR142.17153.59124.61132.10153.07
SS250.04254.93241.15241.15256.27
EmLR50.8367.6340.8038.7467.24
SS150.98160.13128.17132.99161.24
Table 2. Mean absolute error (nm) of the predicted wavelength (λpre.) and experimental wavelength (λexp.) in the absorption and emission wavelengths.
M062XWB97XDB3LYPMN15CAM-B3LYP
MAEAbsLR7.386.7511.907.256.26
SS17.7218.9218.2317.0517.18
EmLR14.3314.2315.2314.8511.96
SS13.2512.7915.5613.7411.76
Disclaimer/Publisher’s Note: The statements, opinions and data contained in all publications are solely those of the individual author(s) and contributor(s) and not of MDPI and/or the editor(s). MDPI and/or the editor(s) disclaim responsibility for any injury to people or property resulting from any ideas, methods, instructions or products referred to in the content.

