Article

Decoding Breast Cancer Metabolism: Hunting BRCA Mutations by Raman Spectroscopy

by
Monika Kopec
1,
Beata Romanowska-Pietrasiak
2 and
Halina Abramczyk
1,*
1
Laboratory of Laser Molecular Spectroscopy, Institute of Applied Radiation Chemistry, Lodz University of Technology, Wroblewskiego 15, 93-590 Lodz, Poland
2
Oncological Surgery Department, Medical Genetics Department, Copernicus Provincial Multidisciplinary Centre of Oncology and Traumatology in Lodz, Pabianicka 62, 93-513 Lodz, Poland
*
Author to whom correspondence should be addressed.
Photochem 2022, 2(3), 752-764; https://doi.org/10.3390/photochem2030048
Submission received: 4 July 2022 / Revised: 17 August 2022 / Accepted: 23 August 2022 / Published: 25 August 2022

Abstract

:
Presented study included human blood from healthy people and patients with BReast CAncer gene (BRCA) mutation. We used Raman spectroscopy for BRCA mutation detection and the bioanalytical characterization of pathologically changed samples. The aim of this study is to evaluate the Raman biomarkers to distinguish blood samples from healthy people and patients with BRCA mutation. We demonstrated that Raman spectroscopy is a powerful technique to distinguish between healthy blood and blood with BRCA mutation and to characterize the biochemical composition of samples. We applied partial least squares discriminant analysis (PLS-DA) to discriminate BRCA1/2 mutations and control samples without the mutations based on vibrational features. The sensitivity and specificity for calibration obtained directly from PLS-DA are equal to 94.2% and 97.6% and for cross-validation are equal to 93.3% and 97%. Our combination (Raman spectroscopy and PLS-DA) provides quick methods to reliably visualize the biochemical differences in human blood plasma. We proved that Raman spectroscopy combined with the chemometric method is a promising tool for hunting BRCA mutation in breast cancer.

Graphical Abstract

1. Introduction

The blood is an important fluid that circulates through the body and has a lot of functions that are fundamental for survival [1]. The blood transports oxygen to cells and tissues and delivers substances necessary for living cells, such as sugars or hormones, as well as removing waste products from cells [2]. The blood also regulates the right temperature and concentration for each component of the blood [3]. The important function of the blood is to protect the body from diseases and infections [2,3,4]. From monitoring specific markers in the blood, we can obtain essential molecular information, which reveals the real health status based on metabolism [5]. The blood contains biomarkers that characterize cancer pathology processes and altered metabolism and reprogramming [6,7,8,9,10]. Blood marker analysis including BRCA mutations may help to identify the early stages of pathological processes that can lead to the development of cancer [11]. Breast cancer is one of the most common cancer in the population and one of the most common cancer deaths [12]. One of the hallmarks of a higher risk of breast cancer is related to mutations in breast genes (BRCA). Normal BRCA genes produce proteins that repair DNA [13,14]. People with BRCA1/2 mutations have a higher level of risk of cancer disease, particularly breast cancer [15,16]. There are reports demonstrating that tumor grade correlates with the level of BRCA proteins [17].
The protein expression induced by BRCA mutations in breast cancer has been studied by numerous groups [6,18,19,20,21,22,23,24,25]. E. Gross et al. used chromatography to study BRCA mutations [26].
Recently, next-generation sequencing (NGS) technologies have been widely developed for BRCA mutations analysis [27,28]. E. Szczerba et al. studied BRCA mutations in tumor tissues by using bioinformatic NGS software programs to analyze BRCA. NGS procedures can improve clinical diagnosis in the near future [21,29,30,31,32].
The molecular diagnosis of genetic disorders is defined as searching for and revealing defects in deoxyribonucleic acid (DNA) and/or ribonucleic acid (RNA) samples. The methods for identification of the disease-causing mutations can be classified as methods for the detection of known and unknown mutations [33,34,35].
Peripheral blood is treated with ethylenediamine tetraacetic acid (EDTA) or sodium citrate to prevent clotting and the human genomic DNA can be isolated and purified [36,37].
In families carrying a pathogenic variant in BRCA1 and BRCA2 genes, usually, the gold-standard Sanger sequencing method is used to detect them. This method uses the selective incorporation of chain-terminating dideoxynucleotides by DNA polymerase during in vitro DNA replication [38,39].
The main technique dedicated to the detection of known mutations in BRCA1 and BRCA2 is the polymerase chain reaction (PCR) and its various options, for example, real-time PCR with high sensitivity and specificity [40,41,42].
In cases of large genomic rearrangements, such as the exons deletions or amplifications in hereditary breast cancer, another molecular diagnostic technique of multiplex ligation-dependent probe amplification (MLPA) is used for large genomic rearrangements [43,44,45,46].
The BRCA gene test is a standard method used for people who inherited this mutation based on family history. However, it is justified to find new methods for the detection of cancer mutations that will provide deeper insight into biochemical alterations. This may be provided by Raman spectroscopy and Raman imaging. By establishing changes in Raman spectroscopic profiles in the human blood, it will be able to determine molecular differences, leading to establishing biochemical alterations during cancer progression in humans. Moreover, Raman spectroscopy allows the label-free molecular sensing of a biological sample [47,48,49,50,51].
To the best of our knowledge, only a few papers report on Raman spectroscopy to study BRCA mutation. L.R. Allain et al. reported the use of Surface Enhanced Raman Spectroscopy (SERS) to monitor the BRCA1 breast cancer mutations on modified silver surfaces [52]. They proved that the SERS technique for gene expression studies is a significant step forward in enabling biological quantification [52]. Another group that used SERS to analyze BRCA mutation was that of M. Culha et al. [53]. The most important achievement of Pal’s group was the preparation of a protocol for binding cresyl fast violet (CFV), a SERS-active dye (label) containing an aromatic amino group with a modified oligomer that has a carboxy-derivatized thymidine moiety using carbodiimide coupling [54]. The potential of using Raman spectroscopy for BRCA analyses was investigated also by Vo-Dinh et al. [55] and Coluccio et al. [56].
Raman imaging and Raman spectroscopy are tools that provide information about the biochemical composition of organelles in single cells and identify cancer biomarkers that can discriminate between the normal state and cancer pathology.
There are a vast popular machine learning tools that are used as feature selectors and classifiers. Among these, partial least squares discriminant analysis is the most common method used to identify vibrational biomarkers. PLS-DA is an algorithm for the predictive and descriptive modeling and discriminative variable selection.
PLS-DA analysis allows for the calculation of sensitivity and specificity. Sensitivity is described by the equation:
sensitivity = TP ( TP + FN )
Specificity is described by the equation:
specificity = TN ( TN + FP )
where TP is the true positive result, FN is the false negative result, TN is the true negative result, and FP is the false positive result.
The PLS-DA method also provides information about the Receiver Operating Characteristic (ROC). ROC is a measure of a classifier’s predictive quality that compares and visualizes the tradeoff between the model’s sensitivity and specificity [57,58].
The goal of this paper is to demonstrate that Raman spectroscopy combined with statistical methods is a quick and reliable tool for monitoring BRCA mutations. In this paper, we present that Raman spectroscopy results combined with statistical methods of artificial intelligence make it possible to discriminate between healthy people without BRCA mutations and patients with BRCA mutations by testing human blood plasma. In particular, we focus on the analysis of 104 Raman spectra of blood plasma from 15 patients without BRCA mutations (control) and 460 Raman spectra from 85 patients with BRCA mutations by using chemometric methods to differentiate between the samples. We demonstrate that Raman spectroscopy provides a new promise to provide a perfect tool for BRCA mutation diagnosis.

2. Materials and Methods

2.1. Sample Preparation

Blood samples were obtained from the Voivodeship Multi-Specialist Center for Oncology and Traumatology in Lodz. The spectroscopic analysis did not affect the scope of the course and type of hospital treatment undertaken. A written informed agreement was obtained from all patients. The Bioethical Committee at the Medical University of Lodz, Poland (RNN/17/20/KE) approved the measurement protocols.
Patients were diagnosed with or without BRCA mutations and treated at the Voivodeship Multi-Specialist Center for Oncology and Traumatology in Lodz. Real-time PCR kit for detection of 8 mutations, BRCA1 (185delAG, 4153delA, 5382insC, 3819delGTAAA, 3875delGTCT, T181G (Cys61Gly), 2080delA) and BRCA2 (6174delT) (Sacace Biotechnologies), was used to detect BRCA1 and BRCA2.
We examined 2 groups of patients participating in the experiment: (1) healthy people, i.e., without the BRCA 1/2 mutations and without oncological disease, and (2) patients with (a) mutation of the BRCA 1/2 genes who did not suffer from oncological diseases and (b) cancer patients with a mutation of the BRCA 1/2 patients after recovery for whom the treatment process was completed (with at least 5 years of survival free from the appearance of a new cancer pathology). The ratio of patients in groups 2a to 2b was estimated as 40%:60%. The demographics and clinical trials for cohort A were: Females aged ≥18 (documented carrier of a germinale pathogenic mutation in BRCA1 or BRCA2 genes). Females aged ≥18 (with a diagnosis of invasive breast cancer or/and invasive ovarian cancer or/and pancreatic cancer and documented carrier of a pathogenic mutation in BRCA1 or BRCA2 genes). The demographics and clinical trials for cohort B (control group) were: Females aged ≥18 without any prior cancer diagnosis and without germinale pathogenic mutation in BRCA1 or BRCA2 genes (demonstrated normal genetic testing results). Exclusion criteria for (Cohort A and Cohort B) were: pregnant or breast-feeding subjects, major surgery within 4 weeks prior to the study entry, history of clinically significant disease or other immunosuppressive disease, HIV infection, receipt of any blood product within 2 weeks prior to the study entry, any illness or condition that in the opinion of the investigator could affect the safety of the subject or the evaluation of any study endpoint, and active drug use or dependence that, in the opinion of the investigator, could interfere with adherence to study requirements.
For all experiments, we used human fresh blood. Blood samples were collected in ethylenediamine tetraacetic acid (EDTA) vials and subsequently centrifuged at 3500 rpm for 5 min at 18 °C to obtain the plasma samples. A 10 µL drop of each blood plasma was placed on clean CaF2 windows (Crystran). Raman spectra were recorded in the different localizations around the center of the dry drop.

2.2. Raman Spectroscopy

The Raman measurements were recorded using an alpha 300 RSA+ (WITec, Ulm, Germany) combined with a confocal microscope coupled via the fiber of 50 μm core diameter with a spectrometer UHTS (Ultra High Throughput Spectrometer) (WITec, Ulm, Germany) and a CCD Camera (Andor Newton DU970N-UVB-353) (Andor Technology, Belfast, Northern Ireland) operating in standard mode with 1600 × 200 pixels at −60 °C with full vertical binning. A standard calibration procedure was performed every day before measurement with the use of a silicon plate (520.7 cm−1). Raman data were pre-processed using the WITec Project 4.1 Plus Software. Each Raman spectra were processed to remove cosmic rays (model: filter size: 2, dynamic factor: 10). The corrected Raman spectra were smoothed by a Savitzky and Golay procedure (model: order: 4; derivative: 0) and baseline subtraction (Raman peaks from the studied spectral range were fitted to second-degree polynomial). The Raman measurements were performed by using excitation of a laser beam (SHG of the Nd:YAG laser (532 nm)) and 40× dry objective (Nikon, objective type CFI Plan Fluor CELWD DIC-M, numerical aperture (NA) of 0.60 and a 3.6–2.8 mm working distance). Raman spectra for plasma blood samples were recorded using integration time 1s and 10 numbers of accumulations. All experiments were performed using a laser with a power 10 mW at the sample position.
The baseline subtraction (baseline mode: user-defined and baseline anchor points: 2nd derivative (zeroes)) and the normalization (model: divided by norm) were performed by using Origin software. The normalization was performed by dividing each spectrum by the spectrum norm, according to:
V = V V V = v 1 2 + v 2 2 + v n 2
where:
v n   is the nth V value [59].
The normalization procedure was performed for the spectral region of 400–1700 cm−1.

2.3. Statistical Analysis

We analyzed samples with BRCA mutation from 85 patients and samples from control patients without BRCA mutations from 15 patients. A total of 460 Raman single spectra for BRCA mutations samples and 104 Raman single spectra for control patients were analyzed.
Statistical chemometric analysis was performed by using MATLAB and PLS_Toolbox Version 4.0 (Eigenvector Research, Wenatchee, WA, USA). Partial Least Squares Discriminant Analysis (PLS-DA) was used for building predictive classification models to validate the classification models and to calculate sensitivity and specificity. The PLS-DA used for the classification and cross-validation as well as permutation testing was used to validate the classification models. We used cross-validation: Venetian blinds w/10 splits, which means that each test set was performed by selecting every 10th object in the data set, starting at the data numbered 1. A ROC curve analysis was also performed. The PLS-DA analysis was performed using an imbalanced group approach (85 samples from patients with BRCA mutation and 15 samples from control patients). More details about chemometric methods were described in our previous papers [57].

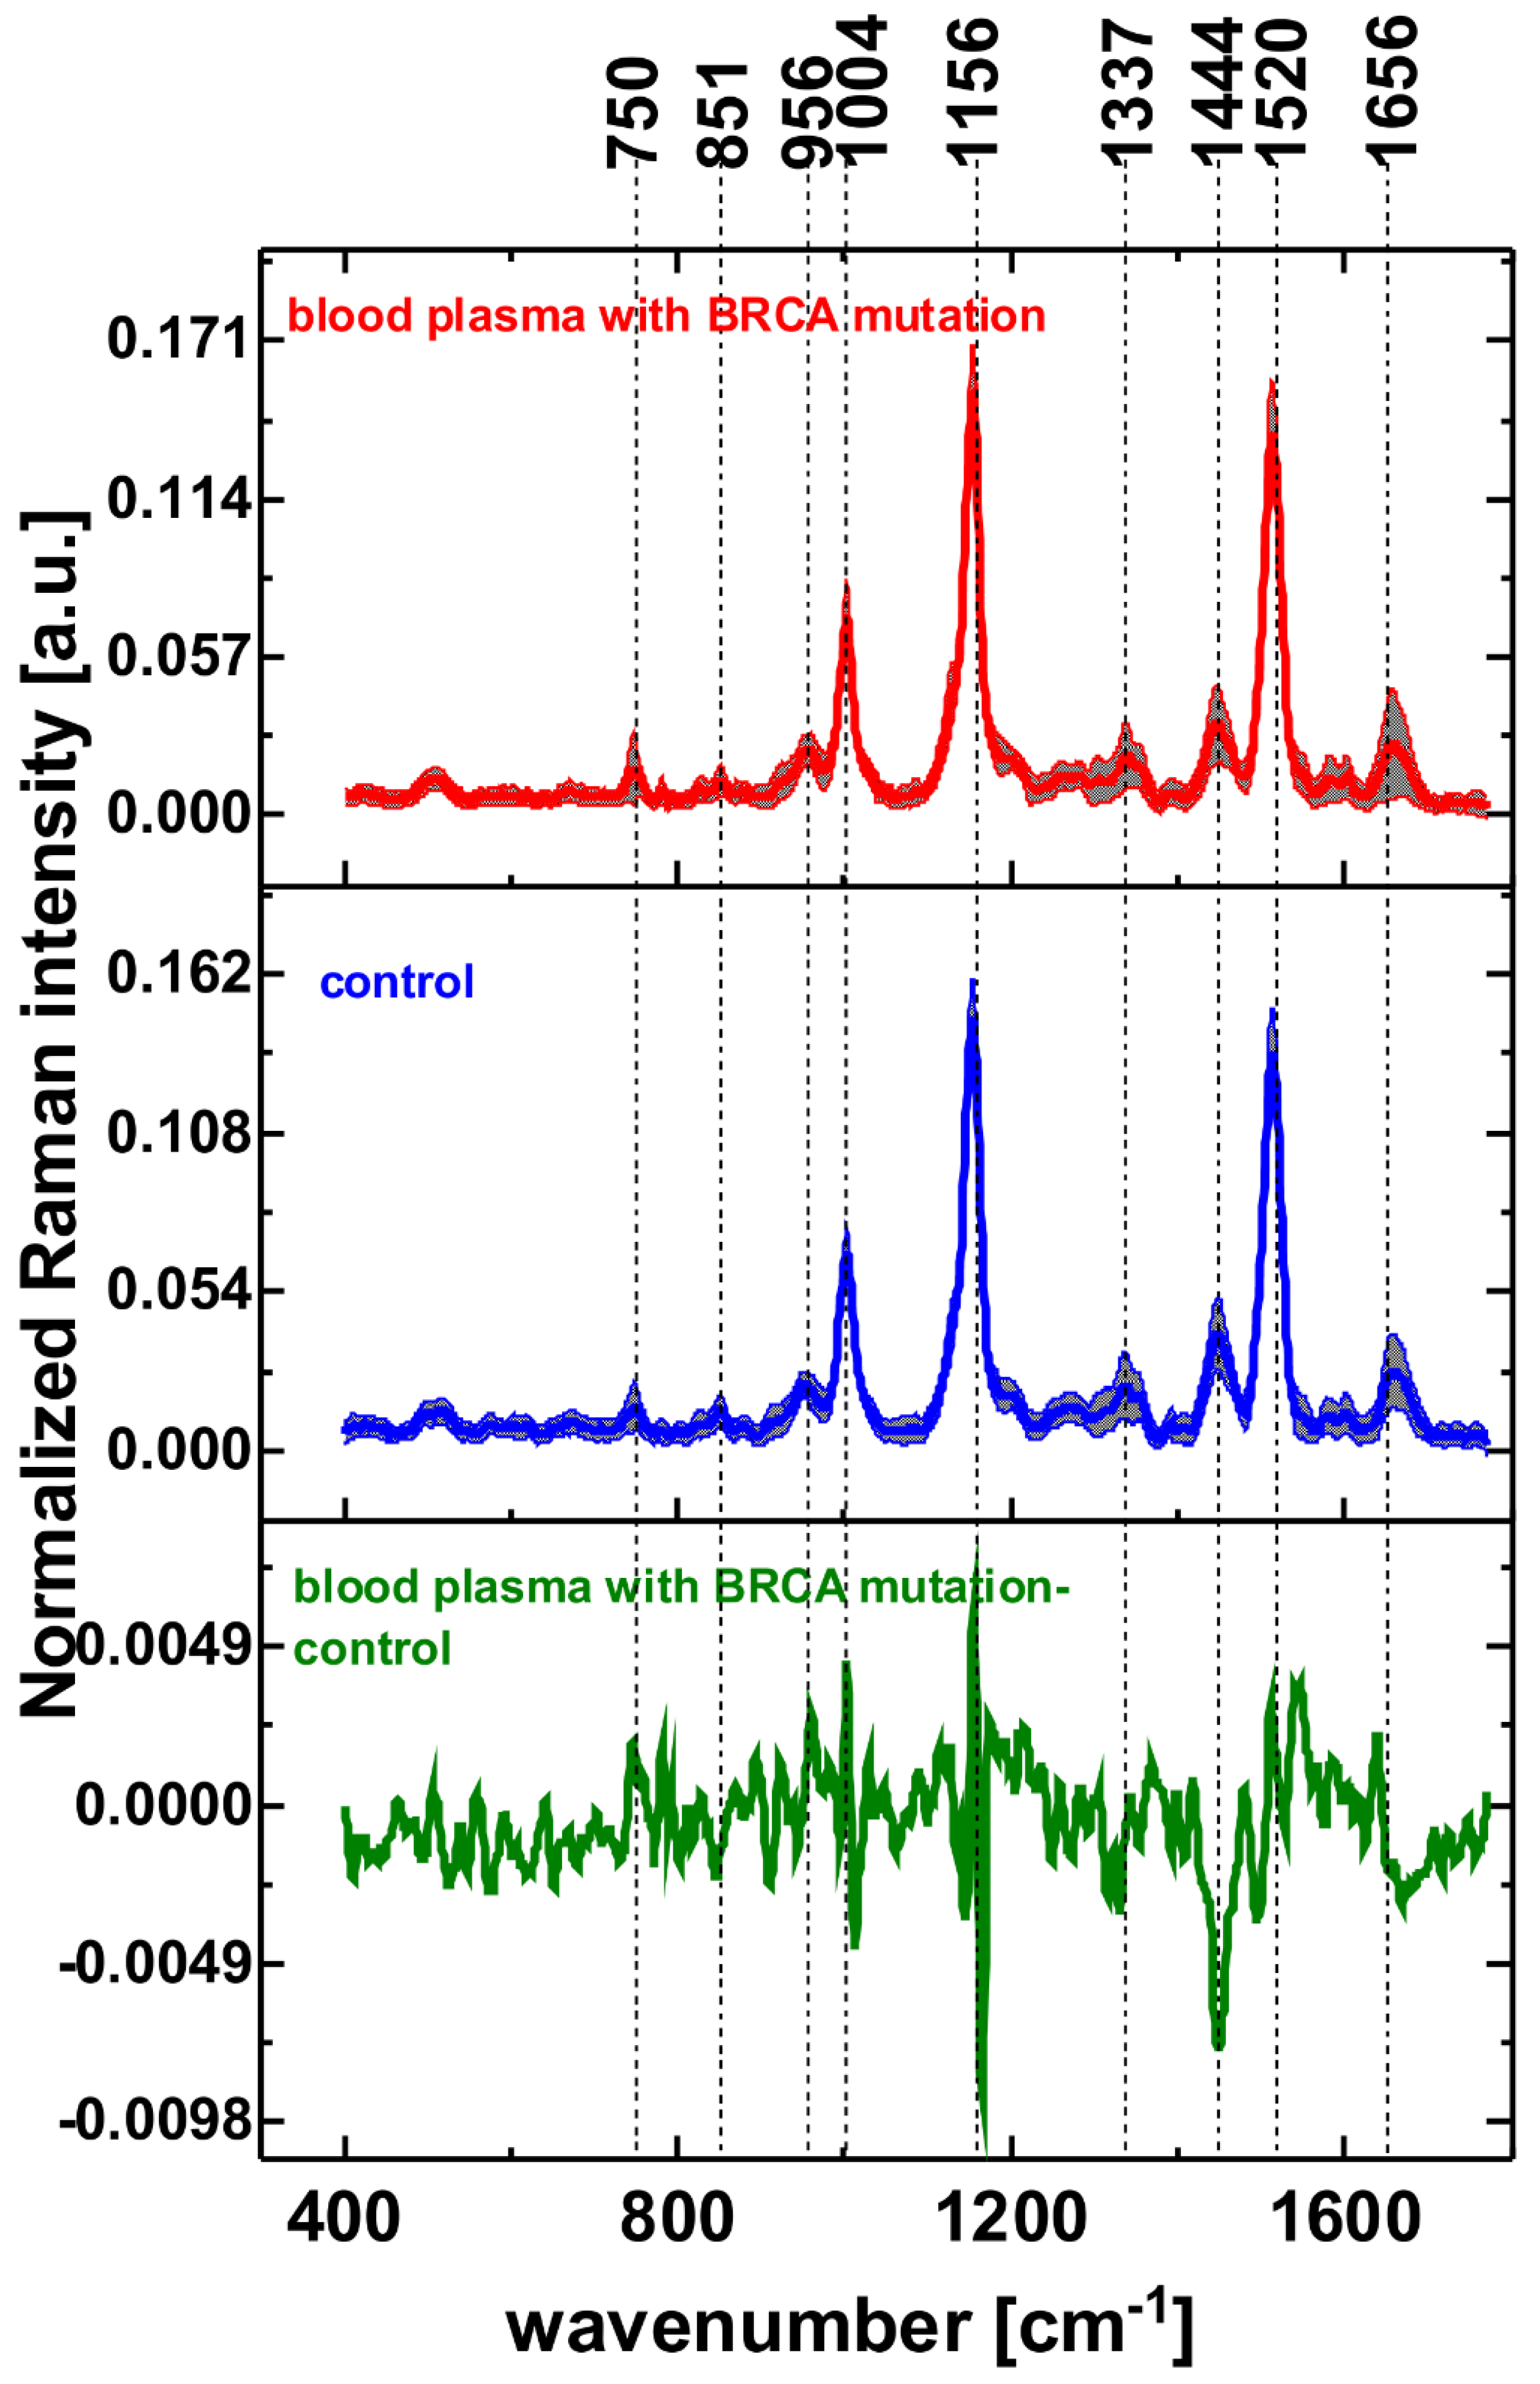
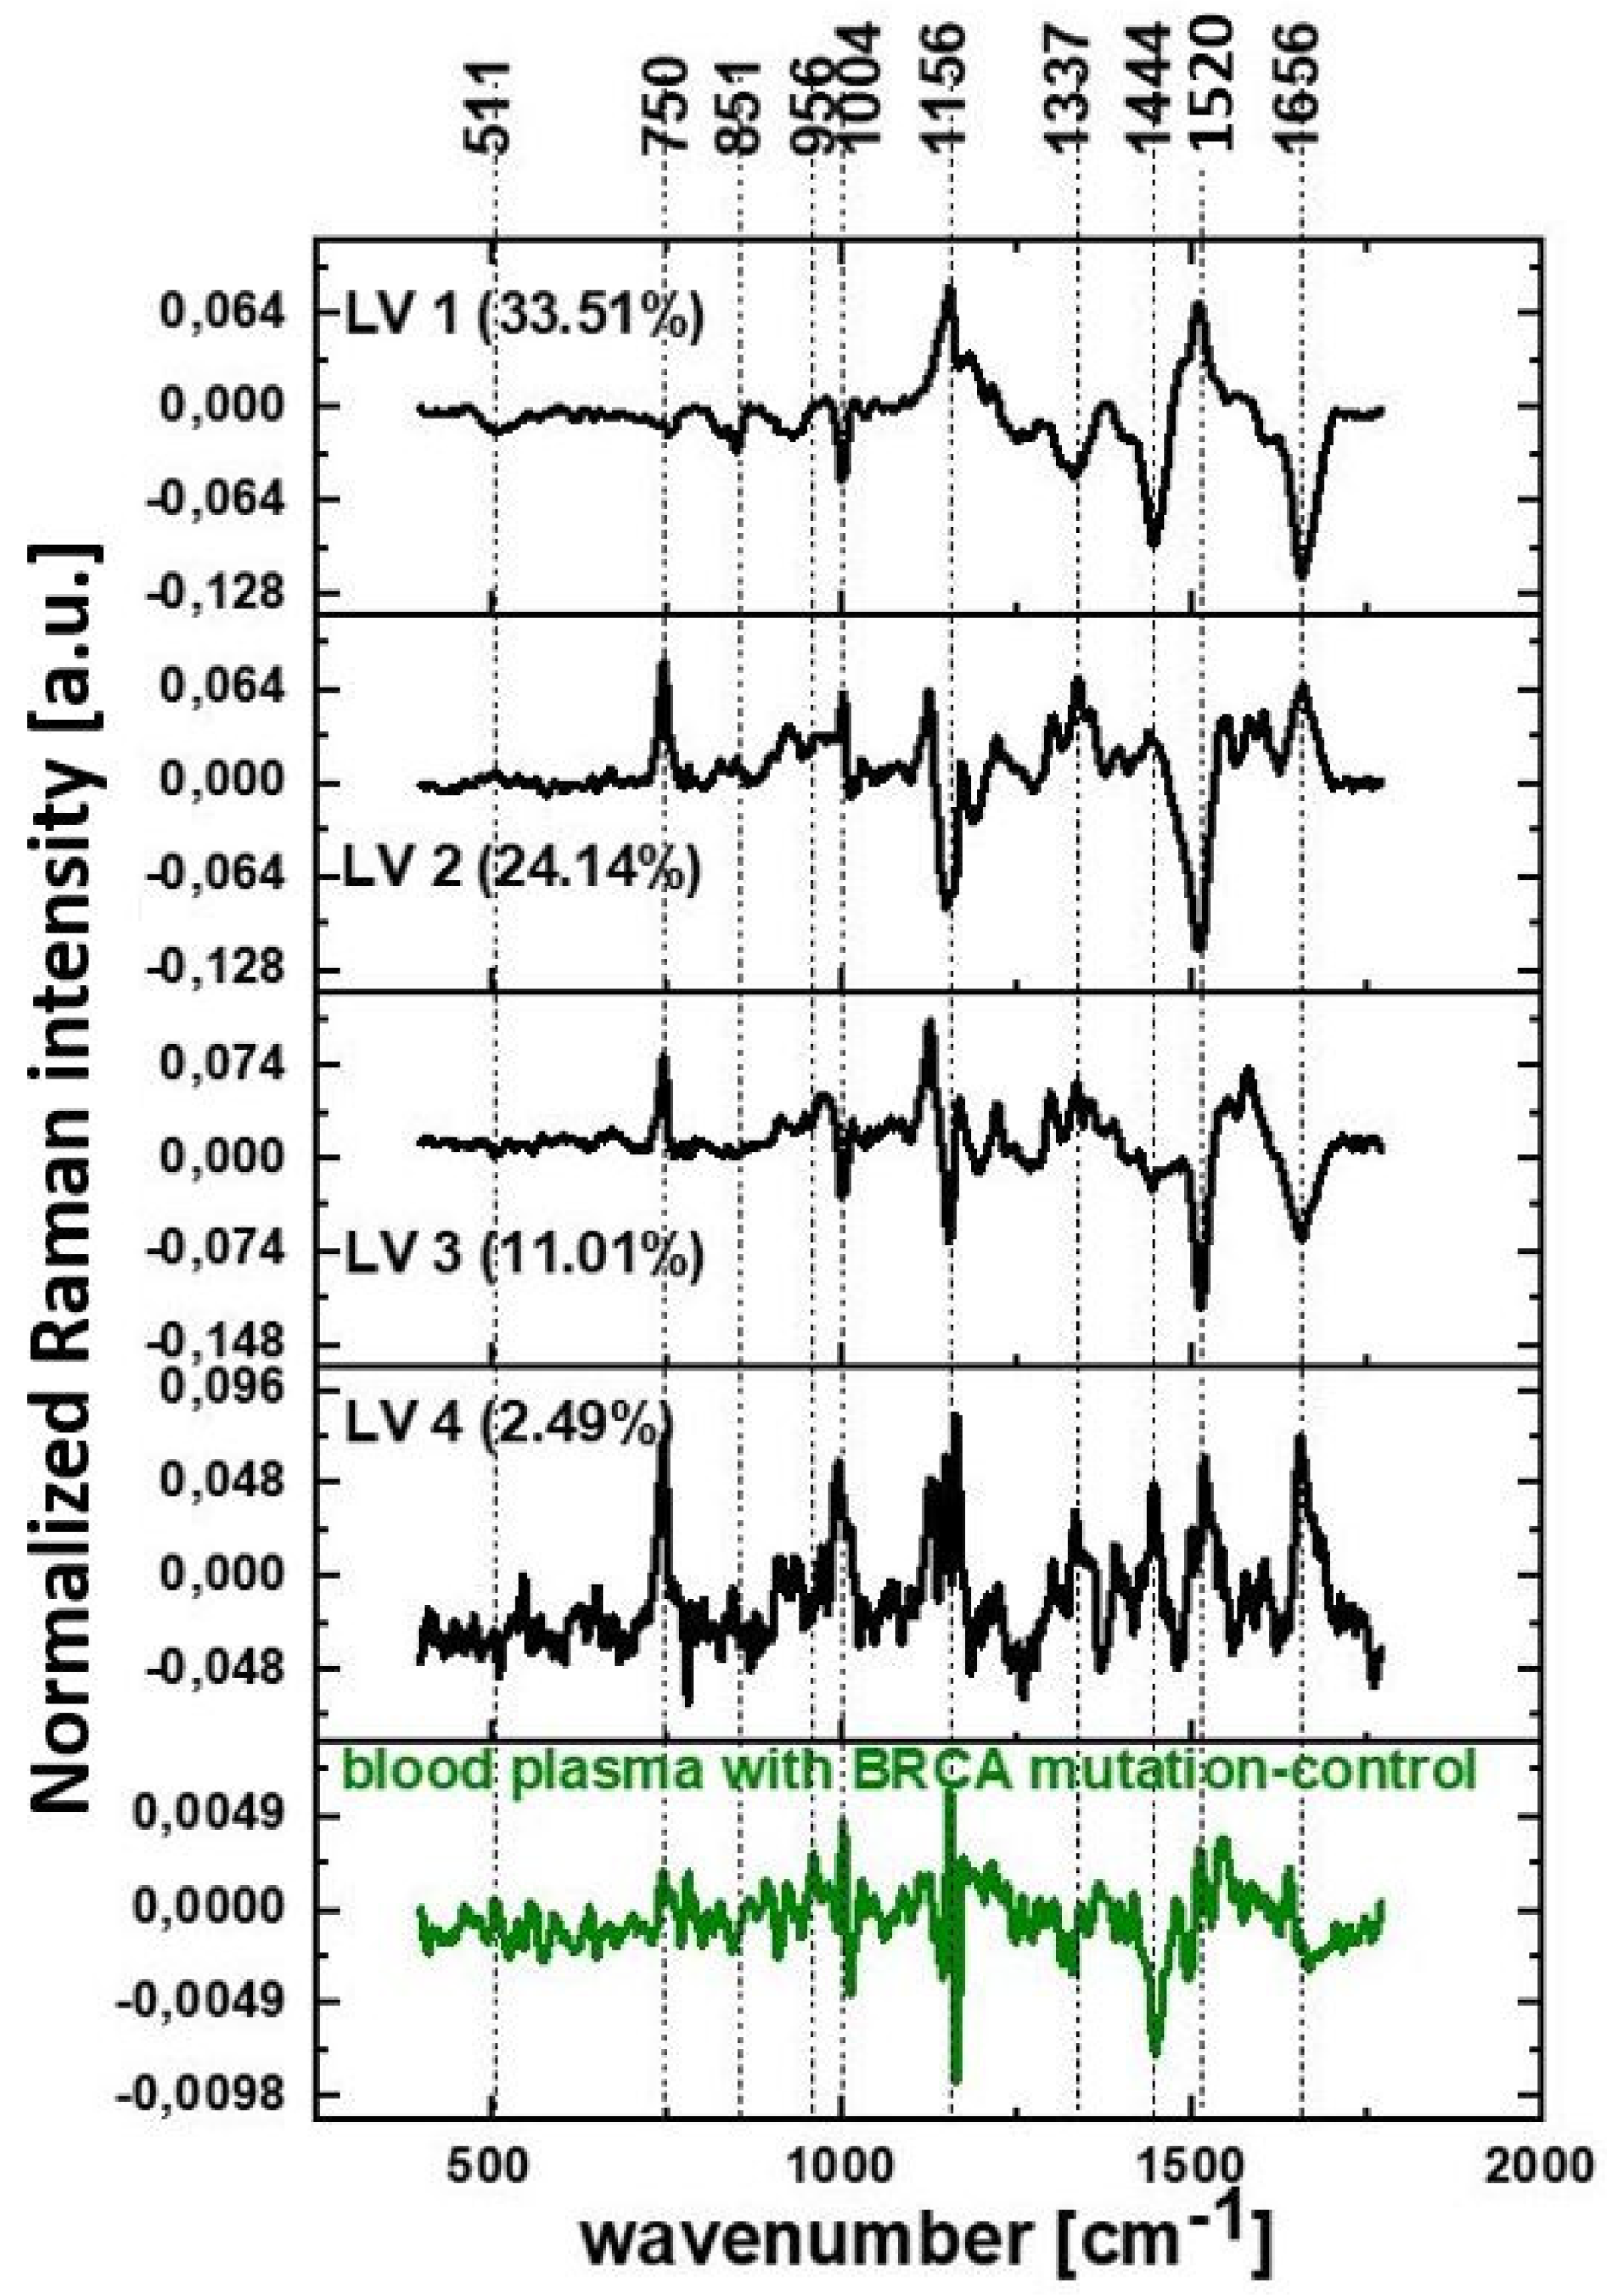
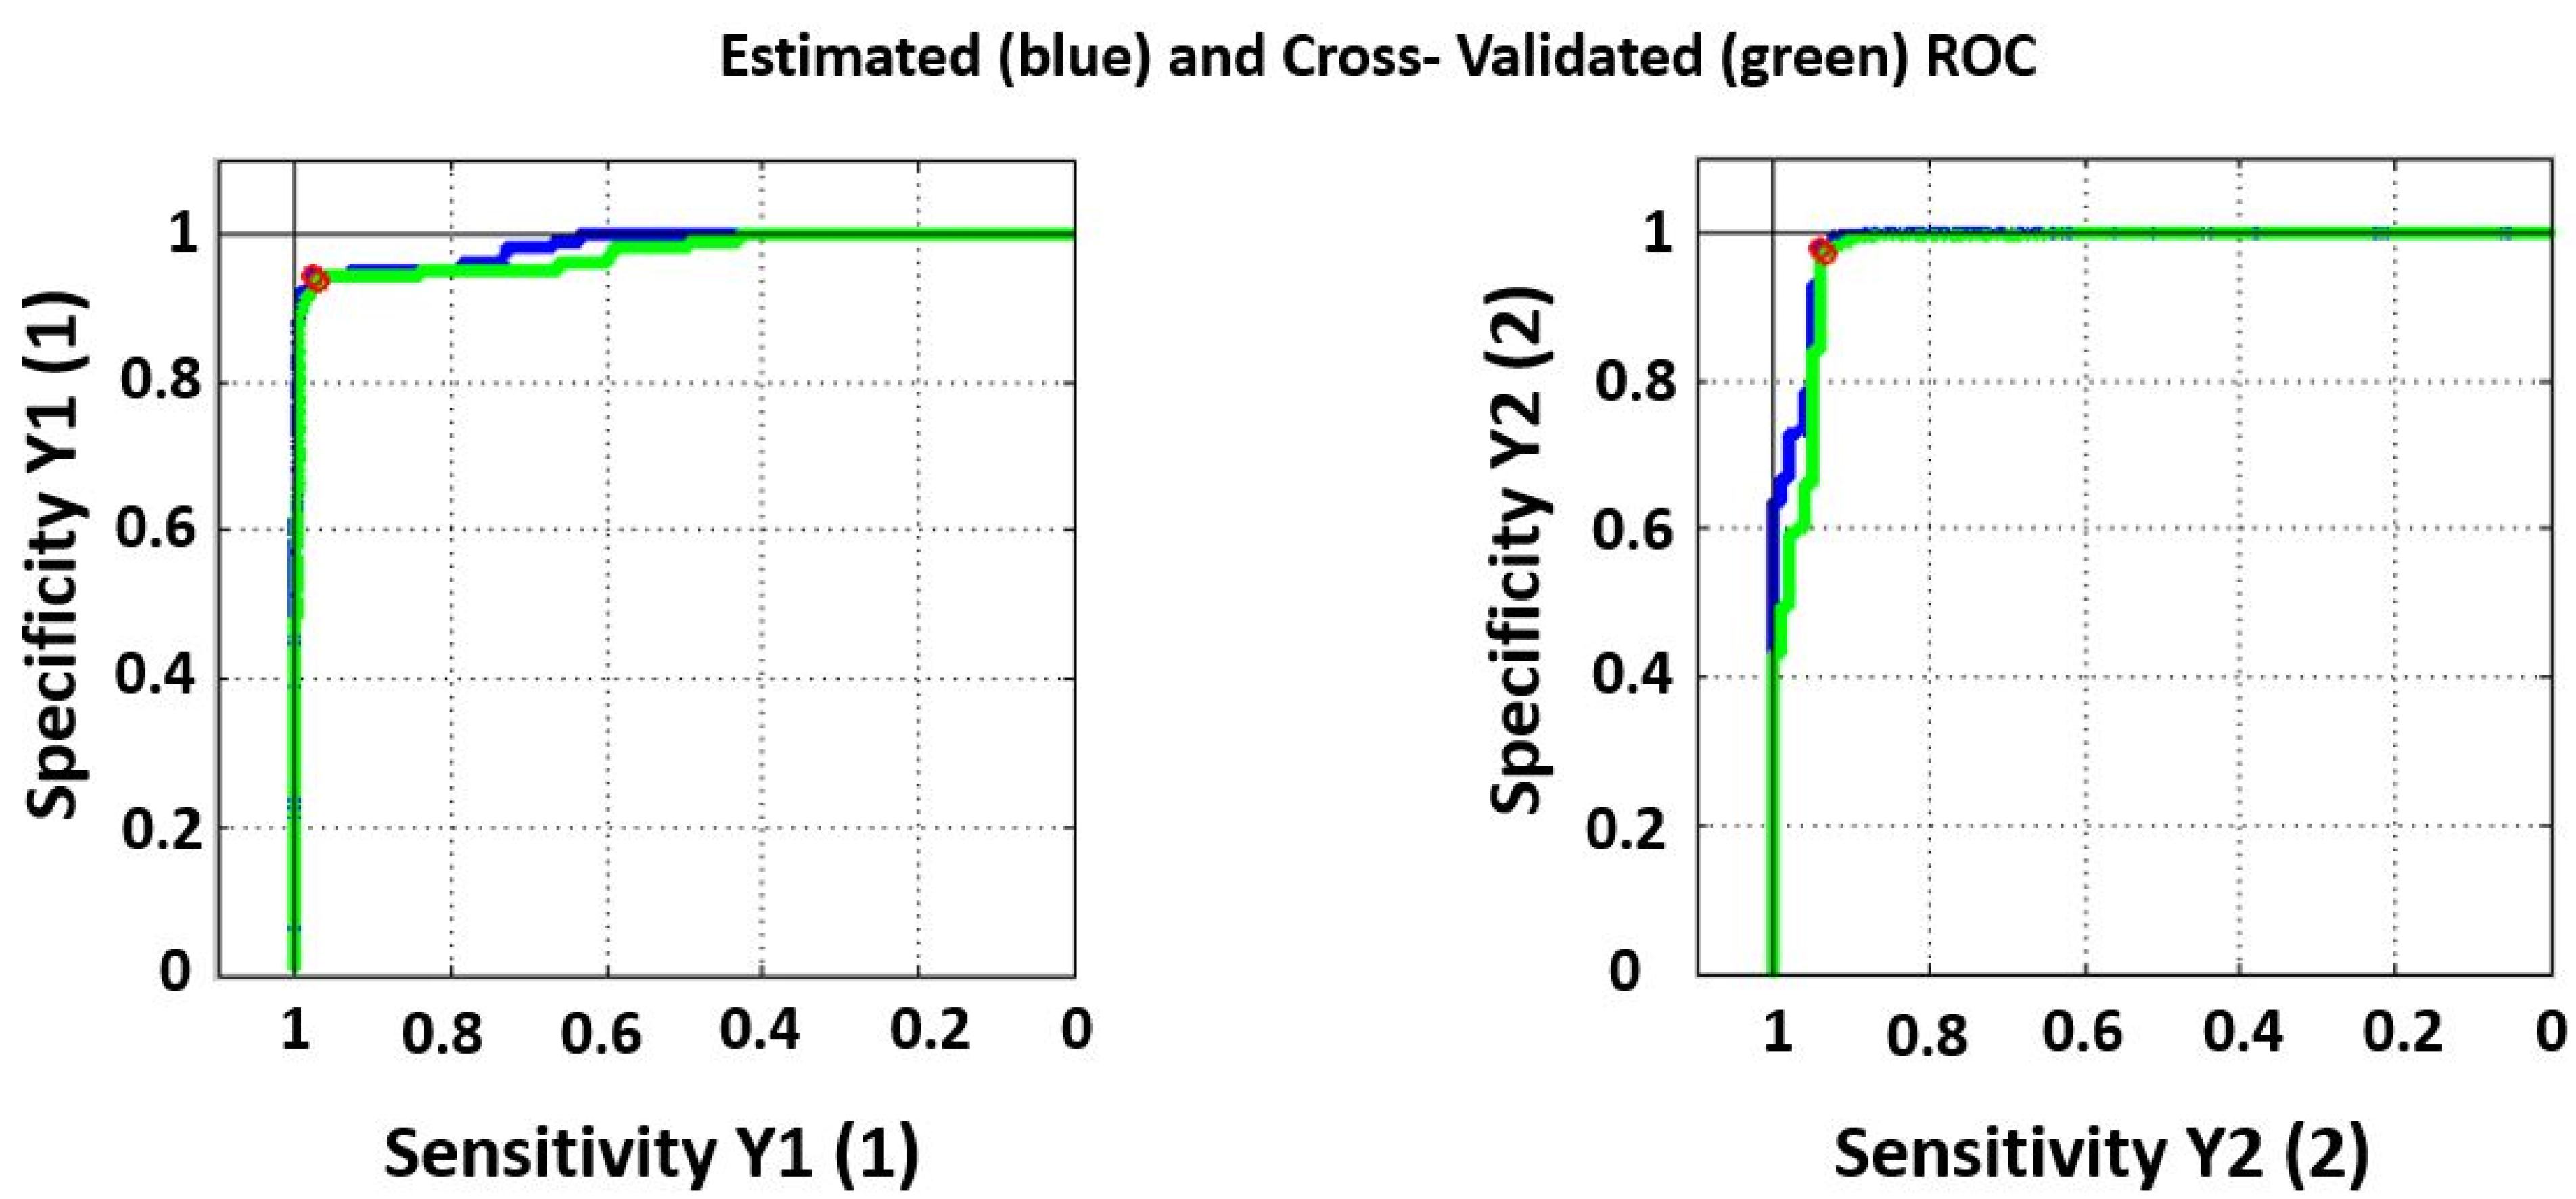
3. Results and Discussion

In this section, we present the results for human blood plasma from patients without BRCA mutations (control) and patients with BRCA mutations. Figure 1 presents average normalized Raman spectra of human plasma with standard deviation (dark shadows) based on 104 single spectra (control, blue line) and 460 spectra of patients with BRCA mutations (red line). Additionally, the difference Raman spectrum (human blood plasma with BRCA mutation–control, marked with as a green line) is presented in Figure 1.
One can see from the difference spectrum at Figure 1 that the peak at 1004 cm−1 assigned to phenylalanine and 750 cm−1 corresponding to cytochrome c/hemoglobine are positive, which confirms the higher amount of cytochrome c in blood plasma with BRCA mutation. The positive difference is also observed at the Raman signal at 1656 cm−1. This peak is assigned to amid I/lipids, which is stronger in the Raman spectra for blood plasma with BRCA mutation (positive correlation in difference spectrum).
Comparing the Raman signals at 1444 cm−1 assigned to the C-H bending vibrations of fatty acids/triglycerides CH2 or CH3, one can see that this band is stronger for healthy blood plasma (negative correlation in difference spectrum). The same tendency is observed for the Raman signals at 1156 cm−1 and 1520 cm−1 assigned to carotenoids. This result supports our previous findings from our previous papers for cancer pathology [57,62].
To visualize chemical similarities and differences between human blood plasma for patients without BRCA mutations and blood plasma samples for patients with BRCA mutation, we used multivariate statistical methods for data interpretation. We performed statistical analysis for 564 single Raman spectra (460 Raman spectra of 85 human blood samples with BRCA mutation and 104 Raman spectra of 15 human blood samples without BRCA). A large number of samples and multidimensional Raman vectors (intensities vs. wavenumbers) were analyzed with dimension reduction by means of partial least squares discriminant analysis (PLS-DA).
Figure 2 shows the PLS-DA score plot for the Raman spectra of the human blood plasma samples with BRCA 1/2 mutations and the samples without BRCA mutations. The latent variable (LV) is the percent variance capture by model. The 95% confidence interval is presented by the PLS-DA ellipse (blue dashed line).
One can see from Figure 2 the evident separation between human blood plasma with BRCA and human blood plasma without BRCA mutations. The differences are clearly visible from grouping the results into two separate clusters: blue color samples without BRCA mutations and red for samples with the BRCA mutations. Raman spectra for human blood plasma without BRCA mutations (blue circle) are grouped in the left upper area of the plot, while the samples from human blood plasma with BRCA mutations (red circle) are grouped in the right upper area and in the lower area of the plot.
To extract the molecular information contained in the LV1, LV2, LV3 and LV4, we used the loading plots presented in Figure 3 that reveal the most important characteristic features in the Raman spectra.
The loading plots of LV1, LV2, LV3 and LV4 versus wavenumbers obtained from PLS-DA methods for two classes of spectra typical for human blood plasma without BRCA mutations and for human blood plasma with BRCA mutation and comparison with the difference spectrum (blood plasma with BRCA–control) are shown in Figure 3. One can see that the loading plots show the changes around the characteristic Raman peaks of carotenoids, lipids and proteins.
One can see from Figure 3 that the first LV1 has a contribution of 33.51%, LV2 a contribution of 24.14%, LV3 a contribution of 11.01% to variance and LV4 a contribution of 2.49% to variance. LV1, LV2 and LV3 provide the dominant account for the maximum variance in the data.
The most characteristic minima in the loading plot of LV1 are at 511 cm−1, 750 cm−1, 851 cm−1, 1004 cm−1, 1337 cm−1, 1444 cm−1 and 1656 cm−1 and the most characteristic maxima in the loading plot are at 1156 cm−1 and 1520 cm−1. The LV2 reaches its minima at 1156 cm−1 and 1520 cm−1 and maxima at 750 cm−1, 1004 cm−1, 1337 cm−1 and 1656 cm−1. The LV3 reaches its minima at 1004 cm−1, 1156 cm−1, 1520 cm−1 and 1656 cm−1 and maximum at 750 cm−1. The LV4 reaches its maxima at 750 cm−1, 1004 cm−1, 1156 cm−1, 1337 cm−1, 1444 cm−1, 1520 cm−1 and 1656 cm−1.
Table 2 presents the results of the sensitivity and specificity obtained from the PLS-DA method.
In 2018, a survey of laboratories offering BRCA1/BRCA2 sequence analysis was reported, which revealed a large number of differences in technology, such as gene coverage, sensitivities, cost, single-site analyses and a variant of uncertain significance. The reported sensitivity was 97% and the median was 99.5% with a range from 85.2 to 100% [63].
We compared the sensitivity and specificity obtained by Raman method with other methods, such as immunohistochemistry, for which sensitivity to predict for BRCA1 mutation carriers was 80% and specificity was 100%, with a positive predictive value of 100% and a negative predictive value of 93% [64].
ROC curves (Receiver Operating Characteristic) for blood plasma samples without BRCA mutations (control) and for blood plasma samples with BRCA mutations are presented in Figure 4. Figure 4 confirms the high potential of Raman spectroscopy to differentiate between patients without BRCA mutations and with BRCA mutations.

4. Conclusions

In this paper, we used Raman spectroscopy to monitor BRCA mutations in human blood plasma. Raman spectroscopy and PLS-DA are useful tools for the diagnosis of breast BRCA mutations. Raman spectroscopy and chemometric method were successfully applied to characterize and differentiate between human blood plasma without BRCA mutations and human blood plasma with BRCA mutation. The sensitivity and specificity for calibration obtained directly from PLS-DA are equal to 94.2% and 97.6%, respectively, and for cross-validation are equal to 93.3% and 97%, respectively, which were higher than the values of the conventional methods of sequence analysis in molecular biology used to date.
The results presented in this paper demonstrate that Raman biomarkers provide additional insight into the biology of human blood plasma. The differentiation by Raman spectroscopy between blood plasma without BRCA mutations and blood plasma with BRCA mutations is important because the high specificity and sensitivity can lead to better genomic breast diagnosis. Our results can help to implement Raman spectroscopy as a tool for blood analysis to investigate BRCA mutations.

Author Contributions

Conceptualization: H.A. and M.K.; Funding acquisition: H.A., Investigation: M.K. and B.R.-P., Methodology: H.A., M.K. and B.R.-P.; Writing—original draft: M.K., H.A. and B.R.-P.; Manuscript editing: M.K., H.A. and B.R.-P. All authors have read and agreed to the published version of the manuscript.

Funding

This work was supported by the National Science Centre of Poland (Narodowe Centrum Nauki, UMO-2019/33/B/ST4/01961).

Institutional Review Board Statement

The study was conducted according to the guidelines of the Declaration of Helsinki and approved by the Local Bioethical Committee at the Medical University of Lodz, Poland (RNN/17/20/KE).

Informed Consent Statement

Informed consent was obtained from all subjects involved in the study.

Data Availability Statement

The raw data underlying the results presented in the study are available from Lodz University of Technology Institutional Data Access for researchers who meet the criteria for access to confidential data. The data contain potentially sensitive information. Request for access to those data should be addressed to the Head of Laboratory of Laser Molecular Spectroscopy, Institute of Applied Radiation Chemistry, Lodz University of Technology. Data requests might be sent by email to the secretary of the Institute of Applied Radiation Chemistry: [email protected].

Conflicts of Interest

The authors declare no conflict of interest.

References

  1. Basu, D.; Kulkarni, R. Overview of blood components and their preparation. Indian J. Anaesth. 2014, 58, 529–537. [Google Scholar] [CrossRef] [PubMed]
  2. Weiss, C.; Jelkmann, W. Functions of the Blood. In Human Physiology; Schmidt, R.F., Thews, G., Eds.; Springer: Berlin/Heidelberg, Germany, 1989; pp. 402–438. [Google Scholar] [CrossRef]
  3. Kuhn, V.; Diederich, L.; Keller, T.C.S.; Kramer, C.M.; Lückstädt, W.; Panknin, C.; Suvorava, T.; Isakson, B.E.; Kelm, M.; Cortese-Krott, M.M. Red Blood Cell Function and Dysfunction: Redox Regulation, Nitric Oxide Metabolism, Anemia. Antioxid. Redox Signal. 2017, 26, 718–742. [Google Scholar] [CrossRef] [PubMed]
  4. Seyoum, M.; Enawgaw, B.; Melku, M. Human blood platelets and viruses: Defense mechanism and role in the removal of viral pathogens. Thromb. J. 2018, 16, 16. [Google Scholar] [CrossRef] [PubMed]
  5. Kirkman, M.S.; Mahmud, H.; Korytkowski, M.T. Intensive Blood Glucose Control and Vascular Outcomes in Patients with Type 2 Diabetes Mellitus. Endocrinol. Metab. Clin. North Am. 2018, 47, 81–96. [Google Scholar] [CrossRef] [PubMed]
  6. Feng, Q.; Yu, M.; Kiviat, N.B. Molecular Biomarkers for Cancer Detection in Blood and Bodily Fluids. Crit. Rev. Clin. Lab. Sci. 2006, 43, 497–560. [Google Scholar] [CrossRef]
  7. Mitchell, P.S.; Parkin, R.K.; Kroh, E.M.; Fritz, B.R.; Wyman, S.K.; Pogosova-Agadjanyan, E.L.; Peterson, A.; Noteboom, J.; O’Briant, K.C.; Allen, A.; et al. Circulating microRNAs as stable blood-based markers for cancer detection. Proc. Natl. Acad. Sci. USA 2008, 105, 10513–10518. [Google Scholar] [CrossRef]
  8. El-Khoury, V.; Schritz, A.; Kim, S.-Y.; Lesur, A.; Sertamo, K.; Bernardin, F.; Petritis, K.; Pirrotte, P.; Selinsky, C.; Whiteaker, J.R.; et al. Identification of a Blood-Based Protein Biomarker Panel for Lung Cancer Detection. Cancers 2020, 12, 1629. [Google Scholar] [CrossRef]
  9. Berghuis, A.M.S.; Koffijberg, H.; Prakash, J.; Terstappen, L.W.M.M.; Ijzerman, M.J. Detecting Blood-Based Biomarkers in Metastatic Breast Cancer: A Systematic Review of Their Current Status and Clinical Utility. Int. J. Mol. Sci. 2017, 18, 363. [Google Scholar] [CrossRef]
  10. Kazarian, A.; Blyuss, O.; Metodieva, G.; Gentry-Maharaj, A.; Ryan, A.; Kiseleva, E.M.; Prytomanova, O.M.; Jacobs, I.J.; Widschwendter, M.; Menon, U.; et al. Testing breast cancer serum biomarkers for early detection and prognosis in pre-diagnosis samples. Br. J. Cancer 2017, 116, 501–508. [Google Scholar] [CrossRef]
  11. Hampel, H.; O’Bryant, S.E.; Molinuevo, J.L.; Zetterberg, H.; Masters, C.L.; Lista, S.; Kiddle, S.J.; Batrla, R.; Blennow, K. Blood-based biomarkers for Alzheimer disease: Mapping the road to the clinic. Nat. Rev. Neurol. 2018, 14, 639–652. [Google Scholar] [CrossRef]
  12. Harbeck, N.; Penault-Llorca, F.; Cortes, J.; Gnant, M.; Houssami, N.; Poortmans, P.; Ruddy, K.; Tsang, J.; Cardoso, F. Breast cancer. Nat. Rev. Dis. Primers 2019, 5, 66. [Google Scholar] [CrossRef] [PubMed]
  13. Atchley, D.P.; Albarracin, C.T.; Lopez, A.; Valero, V.; Amos, C.I.; Gonzalez-Angulo, A.M.; Hortobagyi, G.N.; Arun, B.K. Clinical and Pathologic Characteristics of Patients with BRCA-Positive and BRCA-Negative Breast Cancer. J. Clin. Oncol. 2008, 26, 4282–4288. [Google Scholar] [CrossRef] [PubMed]
  14. Force, U.P.S.T.; Owens, D.K.; Davidson, K.W.; Krist, A.H.; Barry, M.J.; Cabana, M.; Caughey, A.B.; Doubeni, C.A.; Epling, J.W.; Kubik, M.; et al. Risk Assessment, Genetic Counseling, and Genetic Testing for BRCA-Related Cancer: US Preventive Services Task Force Recommendation Statement. JAMA 2019, 322, 652–665. [Google Scholar] [CrossRef]
  15. Narod, S.A. BRCA mutations in the management of breast cancer: The state of the art. Nat. Rev. Clin. Oncol. 2010, 7, 702–707. [Google Scholar] [CrossRef]
  16. Alsop, K.; Fereday, S.; Meldrum, C.; DeFazio, A.; Emmanuel, C.; George, J.; Dobrovic, A.; Birrer, M.J.; Webb, P.M.; Stewart, C.; et al. BRCA Mutation Frequency and Patterns of Treatment Response in BRCA Mutation–Positive Women with Ovarian Cancer: A Report from the Australian Ovarian Cancer Study Group. J. Clin. Oncol. 2012, 30, 2654–2663. [Google Scholar] [CrossRef]
  17. Hedau, S.; Batra, M.; Singh, U.R.; Bharti, A.C.; Ray, A.; Das, B.C. Expression of BRCA1 and BRCA2 proteins and their correlation with clinical staging in breast cancer. J. Cancer Res. Ther. 2015, 11, 158–163. [Google Scholar] [CrossRef]
  18. Rakha, E.A.; El-Sheikh, S.E.; Kandil, M.A.; El-Sayed, M.E.; Green, A.R.; Ellis, I.O. Expression of BRCA1 protein in breast cancer and its prognostic significance. Hum. Pathol. 2008, 39, 857–865. [Google Scholar] [CrossRef]
  19. Wang, Z.; Zhang, J.; Zhang, Y.; Deng, Q.; Liang, H. Expression and mutations of BRCA in breast cancer and ovarian cancer: Evidence from bioinformatics analyses. Int. J. Mol. Med. 2018, 42, 3542–3550. [Google Scholar] [CrossRef]
  20. Al-Mulla, F.; Abdulrahman, M.; Varadharaj, G.; Akhter, N.; Anim, J.T. BRCA1 Gene Expression in Breast Cancer: A Correlative Study between Real-time RT-PCR and Immunohistochemistry. J. Histochem. Cytochem. 2005, 53, 621–629. [Google Scholar] [CrossRef] [Green Version]
  21. Andres, J.L.; Fan, S.; Turkel, G.J.; Wang, J.-A.; Twu, N.-F.; Yuan, R.-Q.; Lamszus, K.; Goldberg, I.D.; Rosen, E.M. Regulation of BRCA1 and BRCA2 expression in human breast cancer cells by DNA-damaging agents. Oncogene 1998, 16, 2229–2241. [Google Scholar] [CrossRef]
  22. Chen, H.; Wu, J.; Zhang, Z.; Tang, Y.; Li, X.; Liu, S.; Cao, S.; Li, X. Association Between BRCA Status and Triple-Negative Breast Cancer: A Meta-Analysis. Front. Pharmacol. 2018, 9, 909. [Google Scholar] [CrossRef] [PubMed]
  23. Welcsh, P.L. BRCA1 and BRCA2 and the genetics of breast and ovarian cancer. Hum. Mol. Genet. 2001, 10, 705–713. [Google Scholar] [CrossRef] [PubMed]
  24. Wagner, T.; Stoppa-Lyonnet, D.; Fleischmann, E.; Muhr, D.; Pagès, S.; Sandberg, T.; Caux, V.; Moeslinger, R.; Langbauer, G.; Borg, A.; et al. Denaturing High-Performance Liquid Chromatography Detects Reliably BRCA1 and BRCA2 Mutations. Genomics 1999, 62, 369–376. [Google Scholar] [CrossRef] [PubMed]
  25. Roth, J.; Peer, C.J.; Mannargudi, B.; Swaisland, H.; Lee, J.-M.; Kohn, E.C.; Figg, W.D. A Sensitive and Robust Ultra HPLC Assay with Tandem Mass Spectrometric Detection for the Quantitation of the PARP Inhibitor Olaparib (AZD2281) in Human Plasma for Pharmacokinetic Application. Chromatography 2014, 1, 82–95. [Google Scholar] [CrossRef]
  26. Gross, E.; Arnold, N.; Goette, J.; Schwarz-Boeger, U.; Kiechle, M. A comparison of BRCA1 mutation analysis by direct sequencing, SSCP and DHPLC. Hum Genet. 1999, 105, 72–78. [Google Scholar] [CrossRef]
  27. D’Argenio, V.; Esposito, M.V.; Telese, A.; Precone, V.; Starnone, F.; Nunziato, M.; Cantiello, P.; Iorio, M.; Evangelista, E.; D’Aiuto, M.; et al. The molecular analysis of BRCA1 and BRCA2: Next-generation sequencing supersedes conventional approaches. Clin. Chim. Acta 2015, 446, 221–225. [Google Scholar] [CrossRef]
  28. Wallace, A.J. New challenges for BRCA testing: A view from the diagnostic laboratory. Eur. J. Hum. Genet. 2016, 24 (Suppl. S1), S10–S18. [Google Scholar] [CrossRef]
  29. Szczerba, E.; Kamińska, K.; Mierzwa, T.; Misiek, M.; Kowalewski, J.; Lewandowska, M.A. BRCA1/2 Mutation Detection in the Tumor Tissue from Selected Polish Patients with Breast Cancer Using Next Generation Sequencing. Genes 2021, 12, 519. [Google Scholar] [CrossRef]
  30. Behjati, S.; Tarpey, P.S. What is next generation sequencing? Arch. Dis. Child.-Educ. Pract. Ed. 2013, 98, 236–238. [Google Scholar] [CrossRef] [Green Version]
  31. Jones, M.A.; Rhodenizer, D.; da Silva, C.; Huff, I.J.; Keong, L.; Bean, L.J.; Coffee, B.; Collins, C.; Tanner, A.K.; He, M.; et al. Molecular diagnostic testing for congenital disorders of glycosylation (CDG): Detection rate for single gene testing and next generation sequencing panel testing. Mol. Genet. Metab. 2013, 110, 78–85. [Google Scholar] [CrossRef]
  32. Dahui, Q. Next-generation sequencing and its clinical application. Cancer Biol. Med. 2019, 16, 4–10. [Google Scholar] [CrossRef] [PubMed]
  33. Konstantinos, K.V.; Panagiotis, P.; Antonios, V.T.; Agelos, P.; Argiris, N.V. PCR–SSCP: A Method for the Molecular Analysis of Genetic Diseases. Mol. Biotechnol. 2008, 38, 155–163. [Google Scholar] [CrossRef] [PubMed]
  34. Evans, D.G.R.; Eccles, D.M.; Rahman, N.; Young, K.; Bulman, M.; Amir, E.; Shenton, A.; Howell, A.; Lalloo, F. A new scoring system for the chances of identifying a BRCA1/2 mutation outperforms existing models including BRCAPRO. J. Med Genet. 2004, 41, 474–480. [Google Scholar] [CrossRef]
  35. Mahdieh, N.; Rabbani, B. An Overview of Mutation Detection Methods in Genetic Disorders. Iran. J. Pediatr. 2013, 23, 375–388. [Google Scholar] [PubMed]
  36. Xue, Y.; Ankala, A.; Wilcox, W.R.; Hegde, M.R. Solving the molecular diagnostic testing conundrum for Mendelian disorders in the era of next-generation sequencing: Single-gene, gene panel, or exome/genome sequencing. Genet. Med. 2015, 17, 444–451. [Google Scholar] [CrossRef]
  37. Shashi, V.; McConkie-Rosell, A.; Rosell, B.; Schoch, K.; Vellore, K.; McDonald, M.; Jiang, Y.-H.; Xie, P.; Need, A.; Goldstein, D.B. The utility of the traditional medical genetics diagnostic evaluation in the context of next-generation sequencing for undiagnosed genetic disorders. Genet. Med. 2014, 16, 176–182. [Google Scholar] [CrossRef]
  38. Crossley, B.M.; Bai, J.; Glaser, A.; Maes, R.; Porter, E.; Killian, M.L.; Clement, T.; Toohey-Kurth, K. Guidelines for Sanger sequencing and molecular assay monitoring. J. Veter-Diagn. Investig. 2020, 32, 767–775. [Google Scholar] [CrossRef]
  39. Sikkema-Raddatz, B.; Johansson, L.F.; de Boer, E.N.; Almomani, R.; Boven, L.G.; van den Berg, M.P.; van Spaendonck-Zwarts, K.Y.; van Tintelen, J.P.; Sijmons, R.H.; Jongbloed, J.D.H.; et al. Targeted Next-Generation Sequencing can Replace Sanger Sequencing in Clinical Diagnostics. Hum. Mutat. 2013, 34, 1035–1042. [Google Scholar] [CrossRef]
  40. Kluska, A.; Balabas, A.; Paziewska, A.; Kulecka, M.; Nowakowska, D.; Mikula, M.; Ostrowski, J. New recurrent BRCA1/2 mutations in Polish patients with familial breast/ovarian cancer detected by next generation sequencing. BMC Med Genom. 2015, 8, 19. [Google Scholar] [CrossRef] [Green Version]
  41. Tuffaha, H.W.; Mitchell, A.; Ward, R.L.; Connelly, L.; Butler, J.R.; Norris, S.; Scuffham, P.A. Cost-effectiveness analysis of germ-line BRCA testing in women with breast cancer and cascade testing in family members of mutation carriers. Genet. Med. 2018, 20, 985–994. [Google Scholar] [CrossRef]
  42. Richards, S.; Aziz, N.; Bale, S.; Bick, D.; Das, S.; Gastier-Foster, J.; Grody, W.W.; Hegde, M.; Lyon, E.; Spector, E.; et al. Standards and guidelines for the interpretation of sequence variants: A joint consensus recommendation of the American College of Medical Genetics and Genomics and the Association for Molecular Pathology. Genet. Med. 2015, 17, 405–424. [Google Scholar] [CrossRef] [PubMed]
  43. Hömig-Hölzel, C.; Savola, S. Multiplex Ligation-dependent Probe Amplification (MLPA) in Tumor Diagnostics and Prognostics. Diagn. Mol. Pathol. 2012, 21, 189–206. [Google Scholar] [CrossRef] [PubMed]
  44. Bozsik, A.; Pócza, T.; Papp, J.; Vaszkó, T.; Butz, H.; Patócs, A.; Oláh, E. Complex Characterization of Germline Large Genomic Rearrangements of the BRCA1 and BRCA2 Genes in High-Risk Breast Cancer Patients—Novel Variants from a Large National Center. Int. J. Mol. Sci. 2020, 21, 4650. [Google Scholar] [CrossRef] [PubMed]
  45. Engert, S.; Wappenschmidt, B.; Betz, B.; Kast, K.; Kutsche, M.; Hellebrand, H.; Goecke, T.O.; Kiechle, M.; Niederacher, D.; Schmutzler, R.K.; et al. MLPA screening in theBRCA1gene from 1506 German hereditary breast cancer cases: Novel deletions, frequent involvement of exon 17, and occurrence in single early-onset cases. Hum. Mutat. 2008, 29, 948–958. [Google Scholar] [CrossRef]
  46. Durmaz, A.A.; Karaca, E.; Demkow, U.; Toruner, G.; Schoumans, J.; Cogulu, O. Evolution of Genetic Techniques: Past, Present, and Beyond. BioMed Res. Int. 2015, 2015, 461524. [Google Scholar] [CrossRef]
  47. Abramczyk, H.; Brozek-Pluska, B.; Kopeć, M. Double face of cytochrome c in cancers by Raman imaging. Sci. Rep. 2022, 12, 2120. [Google Scholar] [CrossRef]
  48. Abramczyk, H.; Brozek-Pluska, B.; Jarota, A.; Surmacki, J.; Imiela, A.; Kopec, M. A look into the use of Raman spectroscopy for brain and breast cancer diagnostics: Linear and non-linear optics in cancer research as a gateway to tumor cell identity. Expert Rev. Mol. Diagn. 2020, 20, 99–115. [Google Scholar] [CrossRef]
  49. Nargis, H.F.; Nawaz, H.; Ditta, A.; Mahmood, T.; Majeed, M.I.; Rashid, N.; Muddassar, M.; Bhatti, H.N.; Saleem, M.; Jilani, K.; et al. Raman spectroscopy of blood plasma samples from breast cancer patients at different stages. Spectrochim. Acta Part A Mol. Biomol. Spectrosc. 2019, 222, 117210. [Google Scholar] [CrossRef]
  50. Giamougiannis, P.; Silva, R.V.O.; Freitas, D.L.D.; Lima, K.M.G.; Anagnostopoulos, A.; Angelopoulos, G.; Naik, R.; Wood, N.J.; Martin-Hirsch, P.L.; Martin, F.L. Raman spectroscopy of blood and urine liquid biopsies for ovarian cancer diagnosis: Identification of chemotherapy effects. J. Biophotonics 2021, 14, e202100195. [Google Scholar] [CrossRef]
  51. Giamougiannis, P.; Morais, C.L.M.; Grabowska, R.; Ashton, K.M.; Wood, N.J.; Martin-Hirsch, P.L.; Martin, F.L. A comparative analysis of different biofluids towards ovarian cancer diagnosis using Raman microspectroscopy. Anal. Bioanal. Chem. 2021, 413, 911–922. [Google Scholar] [CrossRef]
  52. Allain, L.R.; Vo-Dinh, T. Surface-enhanced Raman scattering detection of the breast cancer susceptibility gene BRCA1 using a silver-coated microarray platform. Anal. Chim. Acta 2002, 469, 149–154. [Google Scholar] [CrossRef]
  53. Culha, M.; Stokes, D.; Allain, L.R.; Vo-Dinh, T. Surface-Enhanced Raman Scattering Substrate Based on a Self-Assembled Monolayer for Use in Gene Diagnostics. Anal. Chem. 2003, 75, 6196–6201. [Google Scholar] [CrossRef] [PubMed]
  54. Pal, A.; Isola, N.R.; Alarie, J.P.; Stokes, D.L.; Vo-Dinh, T. Synthesis and characterization of SERS gene probe for BRCA-1 (breast cancer). Faraday Discuss. 2006, 132, 293–301. [Google Scholar] [CrossRef] [PubMed]
  55. Vo-Dinh, T.; Allain, L.R.; Stokes, D.L. Cancer gene detection using surface-enhanced Raman scattering (SERS). J. Raman Spectrosc. 2002, 33, 511–516. [Google Scholar] [CrossRef]
  56. Coluccio, M.L.; Gentile, F.; Das, G.; Nicastri, A.; Perri, A.M.; Candeloro, P.; Perozziello, G.; Zaccaria, R.P.; Gongora, J.S.T.; Alrasheed, S.; et al. Detection of single amino acid mutation in human breast cancer by disordered plasmonic self-similar chain. Sci. Adv. 2015, 1, e1500487. [Google Scholar] [CrossRef]
  57. Surmacki, J.; Brozek-Pluska, B.; Kordek, R.; Abramczyk, H. The lipid-reactive oxygen species phenotype of breast cancer. Raman spectroscopy and mapping, PCA and PLSDA for invasive ductal carcinoma and invasive lobular carcinoma. Molecular tumorigenic mechanisms beyond Warburg effect. Analyst 2015, 140, 2121–2133. [Google Scholar] [CrossRef]
  58. Brozek-Pluska, B. Statistics assisted analysis of Raman spectra and imaging of human colon cell lines—Label free, spectroscopic diagnostics of colorectal cancer. J. Mol. Struct. 2020, 1218, 128524. [Google Scholar] [CrossRef]
  59. Beton, K.; Wysocki, P.; Brozek-Pluska, B. Mevastatin in colon cancer by spectroscopic and microscopic methods—Raman imaging and AFM studies. Spectrochim. Acta Part A Mol. Biomol. Spectrosc. 2022, 270, 120726. [Google Scholar] [CrossRef]
  60. Movasaghi, Z.; Rehman, S.; Rehman, I.U. Raman Spectroscopy of Biological Tissues. Appl. Spectrosc. Rev. 2007, 42, 493–541. [Google Scholar] [CrossRef]
  61. Kopec, M.; Błaszczyk, M.; Radek, M.; Abramczyk, H. Raman imaging and statistical methods for analysis various type of human brain tumors and breast cancers. Spectrochim. Acta Part A Mol. Biomol. Spectrosc. 2021, 262, 120091. [Google Scholar] [CrossRef]
  62. Abramczyk, H.; Brozek-Pluska, B. Raman Imaging in Biochemical and Biomedical Applications. Diagnosis and Treatment of Breast Cancer. Chem. Rev. 2013, 113, 5766–5781. [Google Scholar] [CrossRef] [PubMed]
  63. Toland, A.E.; on behalf of the BIC Steering Committee; Forman, A.; Couch, F.J.; Culver, J.O.; Eccles, D.M.; Foulkes, W.D.; Hogervorst, F.B.L.; Houdayer, C.; Levy-Lahad, E.; et al. Clinical testing of BRCA1 and BRCA2: A worldwide snapshot of technological practices. NPJ Genom. Med. 2018, 3, 7. [Google Scholar] [CrossRef] [PubMed]
  64. Vaz, F.H.; Machado, P.M.; Brandão, R.D.; Laranjeira, C.T.; Eugénio, J.S.; Fernandes, A.H.; André, S.P. Familial Breast/Ovarian Cancer and BRCA1/2 Genetic Screening: The Role of Immunohistochemistry as an Additional Method in the Selection of Patients. J. Histochem. Cytochem. 2007, 55, 1105–1113. [Google Scholar] [CrossRef] [PubMed] [Green Version]
Figure 1. The normalized average Raman spectra typical for plasma from healthy people (control, blue line) with SD (blue shadow), plasma from patients with BRCA mutation (red line) with SD (red shadow) and the difference spectrum (blood plasma with BRCA, control) (green line). One can see from Figure 1 that the Raman spectra of the human blood plasma can be characterized by vibrational peaks at 750, 851, 956, 1004, 1156, 1337, 1444, 1520 and 1656 cm−1. The tentative assignments of Raman peaks observed in human blood plasma are presented in Table 1.
Photochem 02 00048 g001
Figure 2. The scores plots (model: mean center) LV3 vs. LV1 (panel A), LV3 vs. LV2 (panel B) and LV4 vs. LV2 (panel C) obtained from the PLS−DA for the Raman spectra of blood plasma without BRCA mutations (blue circle) and for Raman spectra of blood plasma with BRCA mutations (red circle) and the 95% confidence interval in panel (AC) (blue dashed line).
Photochem 02 00048 g002
Figure 3. PLS−DA loading plot for LV1, LV2, LV3 and LV4 for the Raman spectra of the human blood plasma without BRCA mutations and Raman spectra of the human blood plasma with BRCA mutation and the difference spectrum (blood plasma with BRCA, control).
Photochem 02 00048 g003
Figure 4. ROC curves for two classes of Raman spectra assigned to blood plasma without BRCA mutations (control) and blood plasma with BRCA mutation. The red dot means the value that maximized both the sensitivity and specificity values of the target class.
Photochem 02 00048 g004
Table 1. Tentative assignments of Raman peaks [60,61].
Wavenumber [cm−1]Tentative Assignments
750tryptophan, cytochrome c, hemoglobine
851tyrosine
956hydroxyproline/collagen backbone
1004phenylalanine
1156carotenoids
1337cytochrome b
1444fatty acids, triglycerides
1520carotenoids
1656amide I, lipids
Table 2. The values of sensitivity and specificity for the calibration and cross-validation procedure from PLS-DA analysis.
Healthy Blood PlasmaBlood Plasma with BRCA Mutation
Sensitivity (calibration)0.9420.976
Specificity (calibration)0.9760.942
Sensitivity (cross validation)0.9330.970
Specificity (cross validation)0.9700.933
Publisher’s Note: MDPI stays neutral with regard to jurisdictional claims in published maps and institutional affiliations.

