Abstract
Many sunscreen chemical agents are designed to absorb UVB radiation (and in some cases UVA) to protect the skin from sunlight, but UV absorption is often accompanied by photodissociation of the chemical agent, which may reduce its UV absorption capacity. Therefore, it is important to understand the photochemical processes of sunscreen agents. In this study, the photolysis of para-aminobenzoic acid (PABA), one of the original sunscreen chemical agents, at three different UV ranges (UVA: 355 nm, UVB: >280 nm, and UVC: 266 nm and 213 nm) was investigated using parahydrogen (pH) matrix isolation Fourier-Transform Infrared (FTIR) Spectroscopy. PABA was found to be stable under UVA (355 nm) irradiation, while it dissociated into 4-aminylbenzoic acid (the PABA radical) through the loss of an amino hydrogen atom under UVB (>280 nm) and UVC (266 nm and 213 nm) irradiation. The radical production supports a proposed mechanism of carcinogenic PABA-thymine adduct formation. The infrared spectrum of the PABA radical was analyzed by referring to quantum chemical calculations, and two conformers were found in solid pH. The PABA radicals were stable in solid pH for hours after irradiation. The trans-hydrocarboxyl (HOCO) radical was also observed as a minor secondary photoproduct of PABA following 213 nm irradiation. This work shows that pH matrix isolation spectroscopy is effective for photochemical studies of sunscreen agents.
1. Introduction
The ozone layer in the stratosphere absorbs all UVC light and some UVB light, preventing most of this harmful radiation from reaching the surface of the earth. However, as the ozone hole grows, more UVB light reaches the surface of the earth, increasing the rate of skin cancer in humans [1]. Introduced in 1943, para-aminobenzoic acid (PABA) was one of the first active ingredients in sunscreen and subsequently was a component for both vitamin synthesis and for combating premature hair greying [2,3]. PABA’s absorption capabilities of UV light make it a useful agent for preventing sun burns and cancerous skin tumors, which has been proven by experiments on mice [4,5]. However, electronic excitations of molecules via UV radiation often cause photodissociation of molecules, resulting in the degradation of UV absorption capabilities. Thus, understanding both the degradation process and the UV resistance of any sunscreen materials, such as PABA, are important. As PABA was once one of the most broadly used sunscreens, it is an ideal starting point for photolysis studies of sunscreen molecules [6,7]. Indeed, Chan et al. emphasized that PABA becomes reactive under UV irradiation. In the presence of thymine, a nucleic acid, photolyzed PABA (supposedly through the undetected intermediate radical) forms a carcinogenic adduct, breaking DNA strands [8,9].
In the gas phase, the ← transition of PABA occurs at 292.6 nm [10]. PABA’s UV absorption has been measured in 10 different organic solvents, with maximum absorptions ranging from 280.9 nm in n-butyl acetate to 289.0 nm in methanol and ethanol [11]. A previous study reported that PABA’s UV absorption in water has an absorption maximum of 260 nm and that there is a second absorption band at a wavelength less than 240 nm [12]. UV photolysis studies of PABA in solution show that PABA undergoes self-reactions following photolysis [13]. In anaerobic conditions, Shaw et al. reported two photoproducts following 254 nm and >290nm irradiation: 4-(4-aminophenyl)aminobenzoic acid and 4-(2-amino-5-carboxyl)aminobenzoic acid [13]. Figure 1 shows the two photoproducts of PABA photolysis in solution, reporting that 4-aminylbenzoic acid (referred to as the PABA radical hereafter) was likely the predecessor of the two photoproducts, but due to rapid self-reactions, they were unable to isolate the radical in the solution [13]. Shaw et al. also reported that the PABA-thymine adduct was produced by photolyzing PABA in the presence of thymine, showing that the PABA radical was also the likely predecessor of this adduct, but were still unable to detect the PABA radical [9]. Other previous PABA photolysis studies in solution reported hydroxyl radical production, though PABA’s elementary photolytic processes were unknown [14].
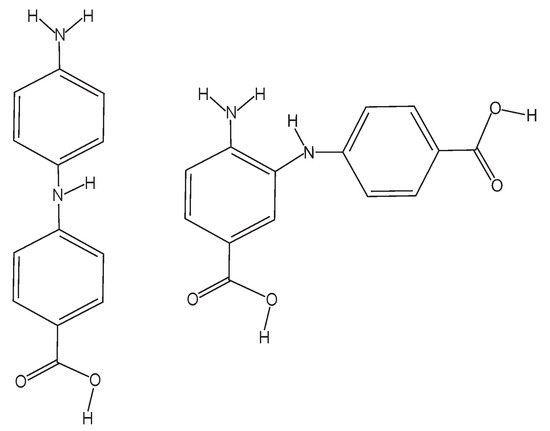
Figure 1.
The two photoproducts that Shaw et al. observed following both 254 nm and >290 nm PABA photolysis in anaerobic solution [13]. (Left): 4-(4-aminophenyl)aminobenzoic acid. (Right): 4-(2-amino-5-carboxyl)aminobenzoic acid.
Matrix isolation allows the observation of elementary pathways by stabilizing reactive species and preventing self-reactions. Parahydrogen (pH) was introduced as a matrix host at the end of the twentieth century [15]. A pH matrix has properties that are advantageous over other matrix hosts. Due to its weak cage effects, molecules produced through in-situ photolysis in pH can escape the lattice site and are isolated in a cryogenic environment, thus avoiding any further radical recombination reactions [16]. This reduces the number of possible photoproducts that can form following photolysis, simplifying photolysis mechanisms and improving accuracy in assigning photoproducts. Furthermore, a pH matrix provides sharper, narrower spectral peaks, which can be studied in more detail by infrared spectroscopy [15,16,17]. In this study, the pH matrix isolation spectroscopy was used to investigate the photodegradation of PABA. A pH matrix sample containing PABA was irradiated with three different UV ranges (UVA: 355 nm, UVB: >280 nm, and UVC: 266 nm and 213 nm), and the resulting photoproducts were detected by Fourier-Transform Infrared (FTIR) Spectroscopy.
2. Materials and Methods
Normal hydrogen gas (99.99%, Praxair Canada Inc., Mississauga, Canada) was converted to >99.9% pH with (FeOH)O as a magnetic converter at 14.1 K using a closed cycle He fridge [18]. The pH was then deposited onto a BaF window inside a cryostat at 3.8 K. PABA (>99%, Sigma–Aldrich, Oakville, Canada) was sublimed and deposited from inside a Knudsen cell heated to 110 °C at the same time as the pH deposition for approximately 1 h, trapping PABA inside the pH matrix [19]. Approximately 10–60 ppm PABA was deposited. The concentration of PABA and its photoproducts were estimated from the peak area, the calculated intensity of the peak, and the crystal thickness [20]. Table S1 in the ESI shows the peaks chosen for PABA and the photoproducts, as well as the modes’ intensities. The thicknesses of the samples ranged from 1.2 mm to 1.8 mm, which were determined by previously developed protocols, which include the peak area of the 4495–4520 cmpH peak [20]. After deposition, PABA was irradiated with 213, 266, or 355 nm UV pulses generated by a Nd:YAG laser (Litron, Nano-SG 150-10 10 Hz repetition rate, Rugby, England) or with broadband radiation at >280 nm using a 450 W xenon lamp (Ushio, UXL-451, Tokyo, Japan) equipped with a 290 nm long-pass filter (Toshiba UV 29, Tokyo, Japan). As the photon density employed in this work was different at different wavelengths, quantitative comparison of the photodissociation rates is not discussed in this work. The wavelengths were chosen based on the previous PABA UV absorption studies [10,12]. Furthermore, 355 nm is past the top absorption band, >280 nm is near the peak of the first absorption band, 266 nm is in between the two absorption bands, and 213 nm is near the second absorption band. Figure 2 depicts the experimental setup. In the cryostat, both the pH gas line and the Knudsen cell tip point directly towards the BaF window and both are equidistant from the window. The UV light travels at a 45 angle towards the window. The irradiation time of each wavelength varied, ranging from 30 to 60 min. Infrared spectra were collected by a Fourier Transform infrared spectrometer (Bruker, IFS 125 HR, Ettlingen, Germany) with 0.1 cm resolution averaged over 100 scans. Vibrational frequency calculations of PABA and the PABA radical were carried out using Gaussian 09 [21]. B3LYP/cc-pVDZ was used because of its reliability to calculate vibrational frequencies of small organic molecules, as well as its low computational cost.
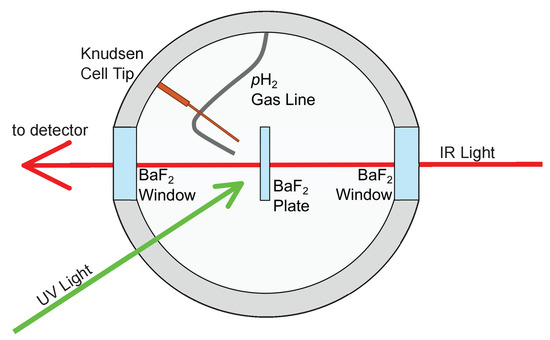
Figure 2.
The experimental setup of the cryostat used for irradiation experiments.
3. Results and Discussion
3.1. Matrix-Isolation Infrared Spectroscopy of PABA
There are two PABA conformers, one of which is found to be substantially more stable. The geometries of the two PABA conformers are shown in Figure 3. Their optimized geometries obtained using B3LYP/cc-pVDZ are listed in Table S2 of the ESI. Conformer (I), which has a cis carboxyl group, was found to be more stable than Conformer (II), in which the carboxyl group is trans. In both conformers, the carboxyl groups reside in the plane of the phenyl ring. In contrast, the two amino hydrogen atoms are out of the plane of the phenyl ring with a H-N-C-C dihedral angle of 23.5°for both conformers. The zero-point energy corrected barrier height between the 23.5° and the −23.5° H-N-C-C dihedral angle is 7.51 kJ mol for Conformer (I). The less stable conformer of PABA (Conformer (II)) is 28.13 kJ mol higher in energy than the most stable conformer of PABA (Conformer (I)). The zero-point energy corrected barrier to conversion from Conformer (I) to Conformer (II) is 49.77 kJ mol, and from Conformer (II) to Conformer (I) is 21.64 kJ mol. Conformer (I) has a calculated conformation population distribution of 99.98% at the sublimation temperature.
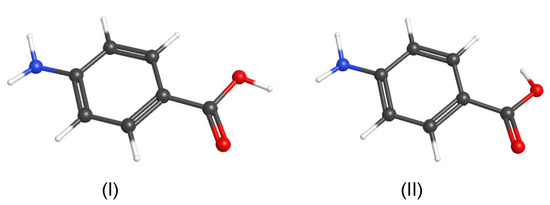
Figure 3.
The most stable conformer (Conformer (I)) and the less stable conformer (Conformer (II)) of PABA. Red: oxygen, blue: nitrogen, black: carbon, and white: hydrogen.
Figure 4 compares the pH-isolated IR spectrum of PABA and theoretically calculates vibrational transitions for both conformers of PABA. The entire PABA IR spectrum in the spectral range between 3675 cm and 675 cm is shown in Figure S1 in the ESI. The observed peaks shown in Figure 4 match well with those of Conformer (I). Table 1 displays the theoretical vibrational frequencies of Conformer (I) and observed frequencies in pH, as well as those in the gas and solid states previously reported [22,23]. The 30 vibrational modes of PABA can be assigned in this spectral region. According to the calculations, most of the remaining modes reside at frequencies lower than 650 cm, as listed in Table S3 in the ESI. The NH asymmetric stretching mode at 3437 cm shows a doublet with peaks separated by 1.1 cm, and the NH symmetric stretching mode at 3532 cm shows a doublet with peaks separated by 1.3 cm. These doublets can be attributed to the NH inversion tunneling splitting previously discussed for aniline [24]. The vibrational modes of the HOCO unit also show doublet peaks with slightly larger separations. The H-C-O bending at 1364–1368 cm has a separation of 3.6 cm, the C=O stretching at 1744–1746 cm has a separation of 2.4 cm, and the O-H stretching at 3580–3583 cm, has a separation of 2.6 cm. These splittings may also be due to tunneling motion. Although the HOCO unit is in the plane of the phenyl ring, the phenyl ring itself is slightly out of plane due to the twisted NH, which could induce tunneling splitting in the vibrational modes of the HOCO unit.
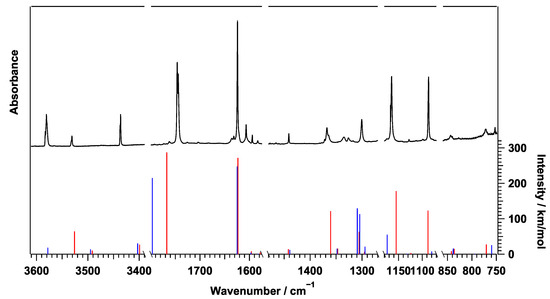
Figure 4.
The IR Spectrum of PABA in pH compared to the anharmonic B3LYP/cc-pVDZ intensities of PABA Conformer (I) (red) and Conformer (II) (blue).

Table 1.
Observed and calculated wavenumbers (cm) of PABA and their intensities (km mol).
As shown in Figure 4, most of the observed peaks are assigned to Conformer (I). According to the calculation (Table S3 in the ESI), Conformer (II) has a strong peak at 1624.8 cm for the NH scissoring mode and at 1796.5 cm for the C=O stretching mode. These peaks are predicted to be shifted to slightly higher frequencies than the corresponding Conformer (I) peaks. As shown in Figure S1 of the ESI, weak peaks are observed at 1631 cm and 1762 cm, both of which are slightly higher frequencies than the corresponding Conformer (I) peaks. These weak peaks may be assigned to Conformer (II), whose predicted wavenumbers are 1624.8 cm and 1796.5 cm, respectively. Unassigned peaks at 1317 cm and 1326 cm may also be attributed to the C-N and C-O stretching modes of Conformer (II), whose predicted wavenumbers are 1304.5 cm and 1309.1 cm, respectively. Although these assignments are still tentative, the intensity of Conformer (II) is significantly weaker than that of Conformer (I), which indicates that the majority of PABA isolated in pH is of Conformer (I) geometry. Previous gas phase studies also concluded that PABA has only one stable rotamer [11,25,26].
3.2. UVA: 355 nm Irradiation
Following 10 min of 20 mJ of 355 nm irradiation, negligible photolysis of PABA was observed. The concentration of PABA decreased by 0.3% and no photoproducts were observed, thus confirming that there is no photodissociation of PABA at 355 nm.
3.3. UVB: >280 nm Irradiation
Irradiation of PABA using the xenon lamp with a 290 nm long-pass filter reduced the PABA peaks and generated new peaks. The top trace in Figure 5 shows a difference spectrum after irradiating PABA with >280 nm radiation minus the spectrum before irradiation. Several new peaks were clearly seen after the >280 nm irradiation. The entire difference IR spectrum is shown in Figure S2 in the ESI. Figure 6 shows the temporal behaviour of these newly formed peaks at 774 cm and 1078 cm as a function of the >280 nm irradiation time. Both peaks showed a doublet structure, and the temporal behaviour of each component of the doublets are shown. All peaks showed the same irradiation behaviour with a single exponential increase. The fitted rate constants agree within 20% between the four peaks: 0.026 ± 0.001 min and 0.023 ± 0.001 min for the peaks at 1079.5 cm and 1077.2 cm, respectively, and 0.021 ± 0.003 min and 0.023 ± 0.003 min for the peaks at 774.3 cm and 774.6 cm, respectively. The same irradiation behaviour indicates that these peaks are due to the same photoproduct or species produced from the same photoprocess (see Section 3.6).
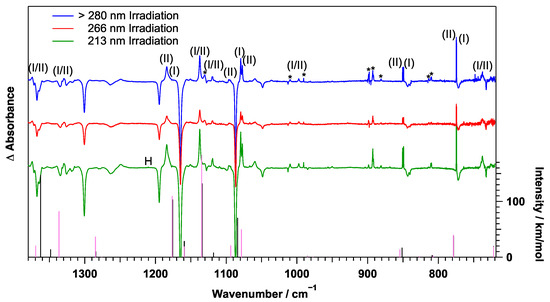
Figure 5.
Difference spectra of PABA irradiated by 60 min >280 nm (blue), 30 min 266 nm (red), and 40 min 213 nm (green) UV radiation. Sticks are the calculated vibrational peaks of PABA radical Conformer (I) (black) and Conformer (II) (pink) using anharmonic B3LYP/cc-pVDZ. (I) = Conformer (I), (II) = Conformer (II), H = HOCO Radical, and * = Unassigned Peak.
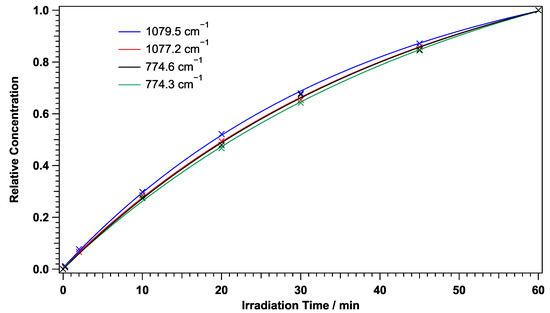
Figure 6.
Temporal behaviour of four different photoproduct peaks following >280 nm irradiation. The y-axis is scaled to such that the value at 60 min becomes 1 for each peak. The scale factors are 8.74, 7.03, 18.79, and 18.47 for the peaks at 1079.5 cm, 1077.2 cm, 774.6 cm, and 774.3 cm, respectively.
The single exponential behaviour also indicates that these are primary photoproducts. Indeed, the decay of the PABA concentration roughly matches to the increase of the concentration of these photoproducts. Figure 7a compares the change in the concentration of PABA and that of the photoproduct under >280 nm photolysis. It can be seen that there is a close anti-correlation between the increase in photoproduct transitions and the decrease in PABA. PABA’s decay rate constant, as shown in Figure 7a, is 0.022 ± 0.002 min, which agrees with the photoproduct’s production rate constant.
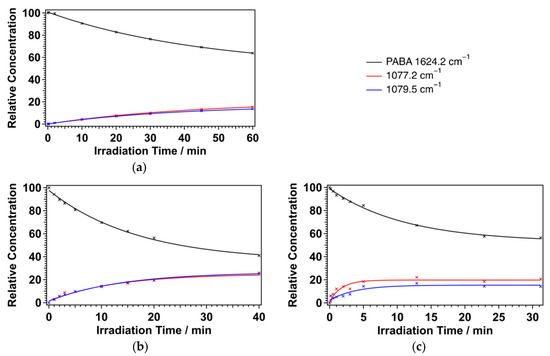
Figure 7.
Temporal behaviour of the photoproduct peaks at 1077.2 cm (red) and 1079.5 cm (blue): (a) >280 nm; (b) 266 nm; (c) 213 nm. All data are fitted with a single exponential function. The duration of irradiation times at different wavelengths were different, since the photon density at different wavelengths was different.
Most of the observed photoproduct transition wavenumbers were similar to those of the PABA peaks. Therefore, it can be assumed that the photoproduct is similar in structure to PABA and that the photoproduct likely did not result from cleavage of the aromatic ring. The three most likely photoproducts are aniline (or the anilino radical) through the dissociation of the carboxyl group, benzoic acid (or the benzoic acid radical) through the dissociation of the amino group, and 4-aminylbenzoic acid (the PABA radical) through the loss of one amino hydrogen atom. Table S4 in the ESI shows the calculated vibrational transitions of the aromatic-centered anilino radical, and Table S5 in the ESI shows the calculated aromatic-centered benzoic acid radical transitions. Neither of these peaks were consistent with the photoproduct peaks observed here. In addition, neither the HOCO radical at 1845.1 cm in pH [27] nor NH at 1527.85 cm or NH at 968.1 cm [21,28,29] was observed via the >280 nm irradiation. It is also noted that protonated aniline [30,31] and benzoic acid [32], which could be by-products of the formation of the anilino radical or the benzoic acid radical, were also not detected.
Therefore, the remaining assignment possibility is 4-aminylbenzoic acid (the nitrogen-centered PABA radical). Table 2 compares the experimental frequencies and intensities of the theoretical calculations of the PABA radical of the two possible conformers (see Section 3.6), and Table S6 in the ESI lists all of the PABA radical fundamental modes of these two possible conformers. The observed frequencies and their intensities agree well with the calculated frequencies, indicating that the primary photoproduct of PABA is the PABA radical.

Table 2.
The PABA radical vibrational mode assignments and their wavenumbers (cm). Intensities are written in parentheses.
3.4. UVC: 266 nm Irradiation
Following 1.0 mJ of 266 nm irradiation with the Nd:YAG laser, the same photoproduct peak as the >280 nm irradiation was observed, as shown in the middle trace of Figure 5. Figure 7b shows the temporal behaviour of PABA and the PABA radical following 266 nm photolysis. The PABA decay rate constant matches the PABA radical’s production rate constant, following 266 nm photolysis. The PABA radical is also the main primary photoproduct of 266 nm irradiation. This supports Shaw et al.’s discussion on the photolysis of PABA in solution, which determined that identical photoproducts were produced from both 254 nm and >290 nm irradiation [13].
During 266 nm irradiation, a small yet broad peak was noticed at 2124.1 cm. Based on its position, this peak could be assigned to a ketene. The temporal behaviour of the peak at 2124.1 cm following the 266 nm photolysis is shown in Figure S3 of the ESI. There is not enough information to confidently determine which ketene it is, but it is confirmed that it is not methylketene [33]. From known intensities of other ketene-containing molecules, approximately <0.5 ppm of this ketene was isolated, and therefore, it is a minor primary photoproduct following the 266 nm photolysis [23].
3.5. UVC: 213 nm Irradiation
After 1.3 mJ of 213 nm irradiation with the Nd:YAG laser, the same photoproduct peaks to the 266 nm irradiation were observed, as shown in the bottom trace of Figure 5. Figure 7c shows the temporal behaviour of PABA and the PABA radical following 213 nm photolysis. The rate constant of PABA decay is almost the same as that of PABA radical production following 213 nm photolysis. The PABA radical is still the main photoproduct of 213 nm photolysis. Similar photolytic behaviour between the >280 nm, 266 nm, and 213 nm experiments suggests that the first and second excited state dissociations are the same.
In addition to the peaks of the PABA radical, a few weak peaks due to other photoproducts were detected after 213 nm photolysis. Table S7 in the ESI lists the peaks of other photoproducts. The unknown ketene peak at 2124.6 cm was also observed following 213 nm photolysis. The temporal behaviour of the peak at 2124.1 cm following the 213 nm photolysis is also shown in Figure S3 of the ESI. Unique to 213 nm photolysis, the trans-HOCO radical [27] was observed as a minor photoproduct. Figure 8a shows the most intense trans-HOCO radical peak and the temporal behaviour of the trans-HOCO radical following 213 nm photolysis. The cis-HOCO radical was not observed [34]. The HOCO unit dissociation may result in the formation of the cis-HOCO radical, but previous work noted that the cis-HOCO radical immediately undergoes a conformational change from the cis conformer to the much more stable trans conformer when isolated [27].
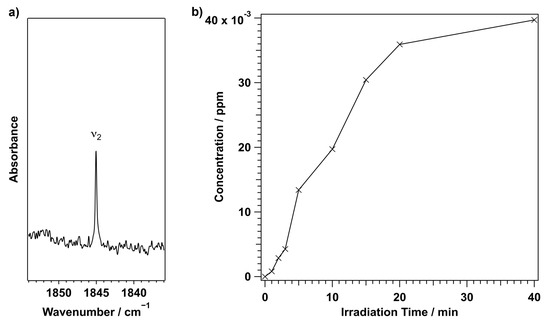
Figure 8.
The most intense trans-HOCO radical peak (a) and its temporal behaviour (b) following 213 nm photolysis.
No clear co-product of the HOCO radical was observed. As shown in Figure 8b, the HOCO radical’s production rate increased at early irradiation times. The curvature of the increase in the HOCO radical concentration in the early stages of the irradiation (<10 min) may be similar to the typical kinetic trend of secondary photoproduct, though it cannot be clearly concluded. The HOCO radical concentration plateaued around 20 minutes, and the CO and CO concentrations increased following 213 nm photolysis [35,36]. This behaviour is the same as alanine photolysis [27]. Further work is needed to understand how HOCO radicals are produced by the photodissociation of PABA.
3.6. The PABA Radical Conformational Analysis
The PABA radical results from the loss of one amino hydrogen from PABA [13]. There are four possible PABA radical conformers. Two conformers have a trans carboxyl group and two have a cis carboxyl group. Similar to PABA, the two conformers with a cis carboxyl group are more stable than the trans carboxyl group conformers. The two conformers with a trans carboxyl group are both approximately 30 kJ mol higher in energy than the two conformers with a cis carboxyl group. Table S8 in the ESI shows the vibrational frequencies and intensities of Conformers (III) and (IV). The most and second most stable PABA radical conformers (the two conformers with the cis carboxyl group) are differentiated due to amino hydrogen lost from PABA and the position of the remaining amino hydrogen. Calculations determining the optimized geometry of the two most stable conformers of the PABA radical were carried out in Gaussian 09 using anharmonic B3LYP/cc-pVDZ. One conformer had the amino hydrogen cis, with respect to the PABA radical’s carbonyl (Conformer (I)), and the other conformer had the amino hydrogen trans, with respect to the carbonyl (Conformer (II)). Figure 9 shows the structures of the four possible PABA radical conformers, two of which were observed in the pH matrix. All of the atoms of the PABA radical were in the plane of the phenyl ring, including the remaining hydrogen atom on the amino group. Conformer (II) was 0.30 kJ mol less stable than Conformer (I). The zero-point energy corrected barrier to conversion for the H-N-C-C dihedral angle rotation from Conformer (I) to Conformer (II) was 54.89 kJ mol, and Conformer (II) to Conformer (I) was 54.59 kJ mol. Because the PABA N-H bond lengths shown in Table S1 are identical, and the conformer energies are nearly identical, it is likely that PABA does not exclusively dissociate to one radical conformer.
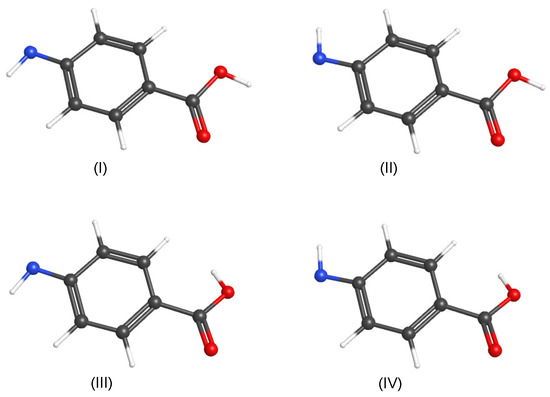
Figure 9.
The four possible conformers of the PABA radical. Red: oxygen, blue: nitrogen, black: carbon, and white: hydrogen.
The experimental transitions assigned to the PABA radical produced irradiation of PABA at all three wavelengths, as shown in Table 2. Many PABA radical transitions observed in parahydrogen are doublets, while the corresponding PABA transitions were singlets. The doublets observed at , , and observed intensities matching the calculated relative intensities for Conformers (I) and (II). Figure 10 shows the mode, mode, mode, and mode of the PABA radical conformers. The separation of the doublets are 0.3 cm, 1.4 cm, and 2.3 cm for , , and , respectively. The calculated frequency differences of 0.26 cm, 3.09 cm, and 5.36 cm for , , and are in agreement with the experimental frequency differences. Because the observed intensities and frequency differences of the experimental doublets closely match the expected differences between Conformers (I) and (II), these doublets likely arise from the production of both (I) and (II) of the PABA radical from photolysis of PABA. The assignment of Conformer (II) can be confirmed from , where the calculated intensity is 1 km mol for Conformer (I) and 20 km mol for Conformer (II). This vibrational mode should only be observed for Conformer (II), and a singlet is indeed observed at 1518.5 cm for . This, along with the observed doublets for , , and indicate that Conformers (I) and (II) are produced from photolysis of PABA. The doublet relative intensities are consistent with an approximately equal distribution between the two most stable conformers. The photodissociation of PABA yields a mixture of the most stable PABA radical conformers, as expected from the ground state geometry of PABA.
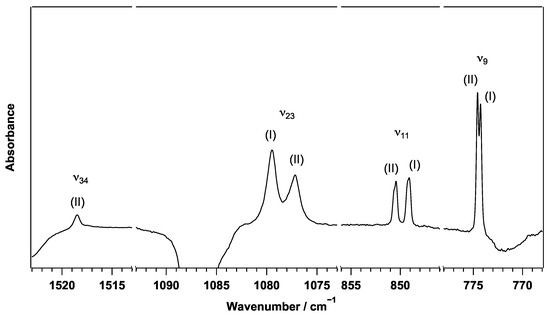
Figure 10.
The mode, mode, mode, and mode of the PABA radical conformers.
3.7. Overall Reaction
From the observed photoproduct and its temporal behaviour, it is concluded that the following reaction scheme shown in Figure 11 is the only photodissociation process of PABA under UVB and UVC irradiation. PABA loses one of its amino hydrogen atoms, forming the PABA radical.
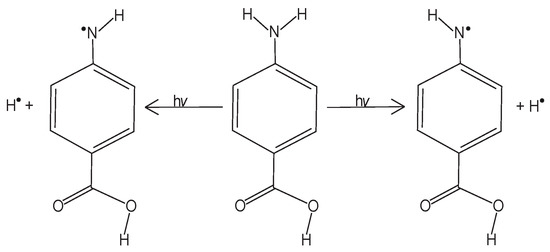
Figure 11.
The UVB and UVC photodissociation process of PABA.
The production of the PABA radical following UV photolysis of PABA is consistent with the previous study by Mitchell et al. [25], who reported that PABA’s first electronically excited state is at approximately 292 nm in the gas phase, where the electron density on the amino group decreases and the electron density on the carboxyl group increases [25]. They refer to PABA as a “push-pull” molecule, since it has an electron donating group (an amino group) on one end of the phenyl ring and an electron withdrawing group (a carboxyl group) on the other end at the para position of the phenyl ring. Due to the decrease of the electron density on the amino group, it is expected that the dissociation occurs on the amino group side. PABA, like other molecules of a similar structure, including 4-methyl-benzenamine, 2,6-dimethyl-benzenamine, 2,5-di-tert-butyl-benzenamine, and 2,4,6-tri-tert-butyl-benzenamine, forms a radical species resulting from the loss of an amino hydrogen upon irradiation [37].
Following photolysis, the system was left exposed to IR for 18 h and no spectral changes were detected. The PABA radical was very stable in solid pH. The reverse reaction of the PABA radical gaining a hydrogen atom via a tunneling reaction with a H molecule or a H atom to reform PABA seems to be a very slow process in solid pH at 3.8 K.
4. Conclusions
It was confirmed that PABA is resistant to UVA radiation, while it degrades upon UVB and UVC irradiation. The major primary photoproduct of PABA photolysis is the PABA radical whose infrared spectrum was observed for the first time. The confirmed presence of this radical reinforces Shaw et al.’s mechanism forming the PABA-thymine adduct, further confirming PABA’s carcinogenic properties and DNA destroying capabilities [9]. Although, at present, ZnO and TiO are most commonly used as sunscreen rather than PABA, humans still use PABA-containing products for other purposes [2,3]. Therefore, it is important to further investigate the chemical properties of the PABA radical.
In this work, we demonstrate that pH matrix isolation spectroscopy is a powerful technique for the study of UV photochemical processes of sunscreen molecules. UV photolysis of other sunscreen agents, such as 2-ethylhexyl 4-(dimethylamino)benzoate (Padimate O) [38,39,40], would also be worth investigating using pH matrix isolation spectroscopy.
Supplementary Materials
The following supporting information can be downloaded at: https://www.mdpi.com/article/10.3390/photochem2010008/s1, Electronic Supplementary Information (ESI) available: The observed wavenumbers of peaks used for integration (Table S1), the geometry of the two PABA Conformers (I) and (II) (Table S2), the entire spectrum of PABA in a solid pH matrix (Figure S1), the frequencies and intensities of PABA Conformers (I) and (II) (Table S3), the aromatic-centred anilino radical (Table S4), the aromatic-centred benzoic acid radical (Table S5), the entire difference spectrum following >280 nm, 266 nm, and 213 nm irradiation (Figure S2), the frequencies and intensities of the PABA radical Conformer (I) and (II) (Table S6), other photoproducts’ wavenumbers (Table S7), the temporal behaviour of the unknown ketene following 266 nm and 213 nm photolysis (Figure S3), and the vibrational frequencies and intensities of the PABA radical Conformers (III) and (IV) (Table S8).
Author Contributions
Methodology, T.M. and P.D.; investigation, A.M. and B.M.; formal analysis, A.M.; writing—original draft preparation, A.M.; writing—review and editing, A.M.; B.M., T.M. and P.D.; supervision, T.M.; funding acquisition, T.M. All authors have read and agreed to the published version of the manuscript.
Funding
This research was supported by a Natural Sciences and Engineering Research Council (NSERC) Discovery Grant in Canada and funds from the Canada Foundation for Innovation for the Centre for Research on Ultracold Systems (CRUCS).
Institutional Review Board Statement
Not Applicable.
Informed Consent Statement
Not Applicable.
Acknowledgments
A.M. thanks E. R. Miller for his technical assistance with the xenon lamp and E. R. Grant (UBC) for his thoughtful discussion on the thermodynamic stability of the conformers of PABA.
Conflicts of Interest
The authors declare no conflict of interest.
References
- Abarca, J.F.; Casiccia, C.C. Skin Cancer and Ultraviolet-B Radiation Under the Antartic Ozone Hole: Southern Chile, 1987–2000. J. Am. Chem. Soc. 2002, 18, 294–302. [Google Scholar]
- Scott, H.W.; Dehority, B.A. Vitamin Requirements of Several Cellulolytic Rumen Bacteria. J. Bacteriol. 1964, 89, 1169–1175. [Google Scholar] [CrossRef] [PubMed]
- Mahendiratta, S.; Sarma, P.; Kaur, H.; Kaur, S.; Kaur, H.; Bansal, S.; Prasad, D.; Prajapat, M.; Upadhay, S.; Kumar, S.; et al. Premature Graying of Hair: Risk Factors, Co-Morbid Conditions, Pharmacotherapy and Reversal—A Systematic Review and Meta-Analysis. Dermatol. Ther. 2020, 33, 1–14. [Google Scholar] [CrossRef] [PubMed]
- Snyder, D.S.; May, M. Ability of PABA to Protect Mammalian Skin from Ultraviolet Light-Induced Skin Tumors and Actinic Damage. J. Investig. Dermatol. 1975, 65, 543–546. [Google Scholar] [CrossRef][Green Version]
- Flindt-Hansen, H.; Thune, P.; Larsen, T.E. The Inhibiting Effect of PABA on Photocarcinogenesis. Arch. Dermatol. Res. 1990, 282, 38–41. [Google Scholar] [CrossRef]
- Zhou, L.; Ji, Y.; Zeng, C.; Zhang, Y.; Wang, Z.; Yang, X. Aquatic Photodegradation of Sunscreen Agent p-Aminobenzoic Acid in the Presence of Dissolved Organic Matter. Water Res. 2013, 47, 153–162. [Google Scholar] [CrossRef]
- Wong, T. Sunscreen Allergy and its Investigation. Clin. Dermatol. 2011, 29, 306–310. [Google Scholar] [CrossRef]
- Chan, C.T.L.; Ma, C.; Chan, R.C.T.; Ou, H.M.; Xie, H.X.; Wong, A.K.W.; Wang, M.L.; Kwok, W.M. A Long Lasting Sunscreen Controversy of 4- Aminobenzoic Acid and 4-Dimethylaminobenzaldehyde Derivatives Resolved by Ultra-fast Spectroscopy Combined with Density Functional Theoretical Study. Phys. Chem. Chem. Phys. 2020, 22, 8006–8020. [Google Scholar] [CrossRef]
- Shaw, A.A.; Wainschel, L.A.; Shetlar, M.D. Photoaddition of p-Aminobenzoic acid to Thymine and Thymidine. Photochem. Photobiol. 1992, 55, 657–663. [Google Scholar] [CrossRef]
- Meijer, G.; de Vries, M.S.; Hunziker, H.E.; Wendt, H.R. Laser Desorption Jet-Cooling Spectroscopy of Para-Amino Benzoic Acid Monomer, Dimer, and Clusters. J. Chem. Phys. 1990, 92, 7625–7635. [Google Scholar] [CrossRef]
- Magata, N. Solvent Effects on the Absorption and Fluorescence Spectra of Napthylamines and Isomeric Aminobenzoic Acids. Bull. Chem. Soc. Jpn. 1963, 36, 654–662. [Google Scholar] [CrossRef]
- Lynch, K.; Pergolizzi, R.G. In vitro Method to Quantify UV Mediated DNA Damage. J. Young Investig. 2010, 20, 1–16. [Google Scholar]
- Shaw, A.A.; Wainschel, L.A.; Shetlar, M.D. The Photochemistry of p-Aminobenzoic Acid. Photochem. Photobiol. 1992, 55, 647–656. [Google Scholar] [CrossRef] [PubMed]
- Cismesia, A.P.; Nicholls, G.R.; Polfer, N.C. Amine vs. Carboxylic Acid Protonation in Ortho-, Meta-, and Para-Aminobenzoic Acid: An IRMPD Spectroscopy Study. J. Mol. Spectrosc. 2017, 332, 79–85. [Google Scholar] [CrossRef] [PubMed]
- Momose, T.; Fushitani, M.; Hoshina, H. Chemical Reactions in Quantum Crystals. Int. Rev. Phys. Chem. 2005, 24, 533–552. [Google Scholar] [CrossRef]
- Momose, T.; Shida, T. Matrix-Isolation Spectroscopy Using Solid Parahydrogen as the Matrix: Application to High-Resolution Spectroscopy, Photochemistry, and Cryochemistry. J. Chem. Phys. 1998, 108, 4237–4241. [Google Scholar] [CrossRef]
- Momose, T.; Hoshina, H.; Fushitani, M.; Katsuki, H. High-Resolution Spectroscopy and its Analysis of Ro-Vibrational Transitions of Molecules in Solid Parahydrogen. Vib. Spectrosc. 2004, 34, 95–108. [Google Scholar] [CrossRef]
- Tom, B.A.; Bhasker, S.; Miyamoto, Y.; Momose, T.; McCall, B.J. Producing and Quantifying Enriched para-H2. Rev. Sci. Inst. 2009, 80, 16108–16111. [Google Scholar] [CrossRef]
- Wong, Y.T.A.; Toh, S.Y.; Djuricanin, P.; Momose, T. Conformational Composition and Population Analysis of β-alanine Isolated in Solid Parahydrogen and Argon Matrices. J. Mol. Spectrosc. 2015, 310, 23–31. [Google Scholar] [CrossRef]
- Wakabayashi, T.; Momose, T.; Fajardo, M.E. Matrix Isolation Spectroscopy and Spectral Simulations of Isotopically Substituted C60 Molecules. J. Chem. Phys. 2019, 151, 234301. [Google Scholar] [CrossRef]
- Schmidt, W.; Polik, J.R. WebMO Enterprise; Version 17.0.012e; WebMO LLC: Holland, MI, USA, 2016; Available online: https://www.webmo.net (accessed on 13 July 2021).
- Borah, B.; Gomti Devi, T. The Vibrational Study on the Molecular interaction of L- Proline and Para-Aminobenzoic Acid. J. Mol. Struct. 2020, 1203, 1–15. [Google Scholar] [CrossRef]
- NIST Chemistry WebBook, SRD. 69 Online. Available online: https://webbook.nist.gov/cgi/cbook.cgi?ID=C150130&Units=SI&Type=IR-SPEC&Index=0#IR-SPEC (accessed on 20 June 2021).
- Fehrensen, B.; Luckhaus, D.; Quack, M. Inversion Tunneling in Aniline from High Resolution Infrared Spectroscopy and an Adiabatic Reaction Path Hamiltonian Approach. Z. Phys. Chem. 1999, 209, 1–19. [Google Scholar] [CrossRef]
- Mitchell, D.M.; Morgan, P.J.; Pratt, D.W. Push-Pull Molecules in the Gas Phase: Stark Effect Measurements of the Permanent Dipole Moments of p-Aminobenzoic Acid in Its Ground and Electronically Excited States. J. Phys. Chem. A 2008, 112, 12597–12601. [Google Scholar] [CrossRef] [PubMed]
- Fleisher, A.J.; Morgan, P.J.; Pratt, D.W. High-Resolution Electronic Spectroscopy Studies of meta-Aminobenzoic Acid in the Gas Phase Reveal the Origins of its Solvatochromic Behaviour. J. Mol. Struct. 2020, 55, 657–663. [Google Scholar]
- Moore, B.; Toh, C.S.Y.; Wong, Y.T.A.; Bashiri, T.; McKinnon, A.; Wai, Y.; Lee, A.; Ovchinikov, P.; Chiang, C.; Djuricanin, P.; et al. Hydrocarboxyl Radical as a Product of α-Alanine Ultraviolet Photolysis. J. Chem. Phys. Lett. 2021, 12, 11992–11997. [Google Scholar] [CrossRef]
- Ruzi, M.; Anderson, D.T. Matrix Isolation Spectroscopy and Nuclear Spin Conversion of NH3 and ND3 in Solid Parahydrogen. J. Phys. Chem. A 2013, 117, 9712–9724. [Google Scholar] [CrossRef]
- Ruzi, M.; Anderson, D.T. Fourier Transform Infrared Studies of Ammonia Photochemistry in Solid Parahydrogen. J. Phys. Chem. A 2013, 117, 13832–13842. [Google Scholar] [CrossRef]
- Gée, C.; Crépin, S.D.C.; Bréchignac, P. Infrared Spectroscopy of Aniline (C6H5NH2) and its Cation in a Cryogenic Argon Matrix. Chem. Phys. Lett. 2001, 338, 130–136. [Google Scholar]
- Tsuge, M.; Chen, Y.H.; Lee, Y.P. Infrared Spectra of Isomers of Protonated Aniline in Solid para-Hydrogen. J. Phys. Chem. A 2020, 124, 2253–2263. [Google Scholar] [CrossRef]
- Stephanian, S.; Reva, I.D.; Radchenko, E.D.; Sheina, G.G. Infrared Spectra of Benzoic Acid Monomers and Dimers in Argon Matrix. Vib. Spectrosc. 1996, 11, 123–133. [Google Scholar] [CrossRef]
- Winther, F.; Meyer, S.; Nicolaisen, F.M. The Infrared Spectrum of Methylketene. J. Mol. Struct. 2002, 611, 9–22. [Google Scholar] [CrossRef]
- Ryazantsev, S.V.; Feldman, V.I. Matrix-Isolation Studies on the Radiation-Induced Chemistry in H2O/CO2 Systems: Reactions of Oxygen Atoms and Formation of HOCO Radical. J. Phys. Chem. A 2014, 119, 2578–2586. [Google Scholar] [CrossRef] [PubMed]
- Fajardo, M.E.; Lindsay, C.M.; Momose, T. Crystal Field Theory Analysis of Rovibrational Spectra of Carbon Monoxide Monomers Isolated in Solid Parahydrogen. J. Chem. Phys. 2009, 130, 244508–244517. [Google Scholar] [CrossRef] [PubMed]
- Tam, S.; Fajardo, M.E. Observation of the High-Resolution Infrared Absorption Spectrum of CO2 Molecules Isolated in Solid Parahydrogen. Low. Temp. Phys. 2000, 26, 889–898. [Google Scholar] [CrossRef]
- Land, E.J.; Porter, G. Primary Photochemical Processes in Aromatic Molecules. Trans. Faraday Soc. 1963, 59, 2027–2037. [Google Scholar] [CrossRef]
- Roscher, N.M.; Lindemann, M.K.; Kong, S.B.; Cho, C.G.; Jiang, P. Photodecomposition of Several Compounds Commonly Used as Sunscreen Agents. J. Photochem. Photobiol. A Chem. 1994, 80, 417–421. [Google Scholar] [CrossRef]
- Fisher, M.S.; Menter, J.M.; Willis, I. Ultraviolet Radiation-Induced Suppression of Contact Hypersensitivity in Relation to Padimate O and Oxybenzone. Soc. Investig. Dermatol. 1989, 92, 337–341. [Google Scholar] [CrossRef]
- Knowland, J.; McKenzie, E.A.; McHugh, P.J.; Cridland, N.A. Sunlight-Induced Mutagenicity of a Common Sunscreen Ingredient. FEBS Lett. 1993, 324, 309–313. [Google Scholar] [CrossRef]
Publisher’s Note: MDPI stays neutral with regard to jurisdictional claims in published maps and institutional affiliations. |
© 2022 by the authors. Licensee MDPI, Basel, Switzerland. This article is an open access article distributed under the terms and conditions of the Creative Commons Attribution (CC BY) license (https://creativecommons.org/licenses/by/4.0/).