Abstract
A significant development has been the integration of natural elements with bio-based materials to produce entirely bio-based functional textiles. In this investigation, lycopene, derived from tomatoes, is used as a new natural red dye for silk. A suitable solvent was selected to precisely measure the lycopene content in silk. The stability of lycopene in a simulated dye bath was examined in relation to heating duration and pH values. Central composite design was employed to evaluate the impact of dyeing conditions on the color intensity of silk. The results showed that lycopene dissolves more efficiently in dichloromethane than in water or ethanol. UV–Vis absorption spectra, which remained nearly constant, indicate that lycopene retains its stability after being heated at 90 °C for 60 min or when the pH is between 3.2 and 6.2. Higher temperatures lead to increased lycopene adsorption, thereby enhancing color intensity. Based on the ANOVA analysis from the central composite design experiment, the most influential factor affecting color intensity is the concentration of lycopene, followed by temperature, and then pH. As the lycopene concentration increases, the color intensity and saturation of the dyed silk also increase. Although the lycopene-dyed silk shows good wash fastness, there is room for improvement in rub fastness. In summary, this study confirms the potential of using lycopene as a new natural red dye for silk.
1. Introduction
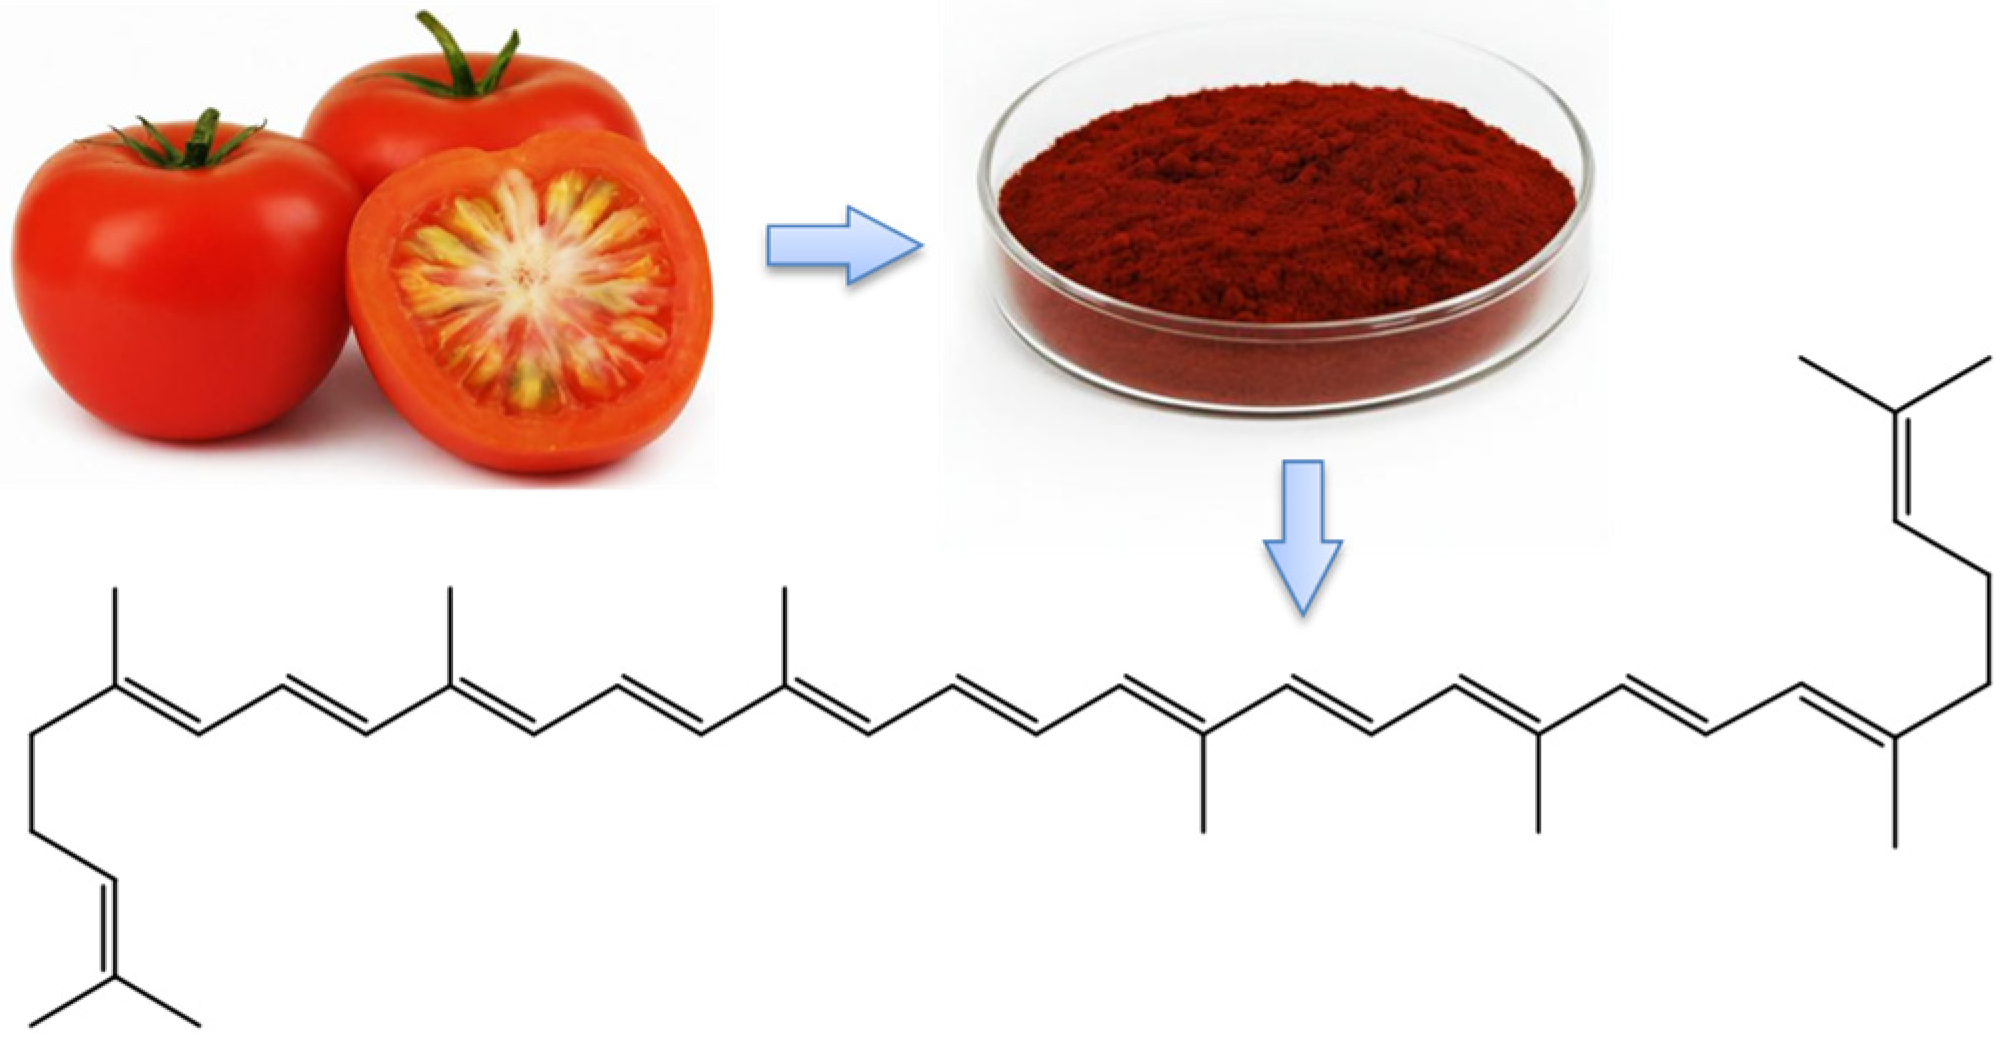
Lycopene (LYC), a potent antioxidant with vibrant red coloration, holds significant potential for use as both a coloring agent and a key ingredient in functional foods due to its natural origin [1]. LYC is predominantly found in a variety of fruits and vegetables such as papaya, pink grapefruit, tomatoes, red cabbage, asparagus, dried persimmons, pink guavas, and watermelons [2]. LYC is a lipophilic pigment belonging to the carotenoid family [3]. Its chemical structure (C40H56; molecular weight = 536.86) comprises an isoprenoid backbone featuring 11 conjugated and 2 non-conjugated double bonds (Figure 1). Among carotenoids, LYC stands out due to its high degree of unsaturation and typically occurs in a trans-configuration, making it susceptible to oxidation, degradation, and isomerization [4]. First isolated in 1873 from the dark red crystals of Tamus communis L. berries, Schunck noted that this pigment’s absorption spectrum differed from that of carotene, leading to its naming as LYC [5]. Subsequent studies by Willstattler and Escher confirmed LYC as an isomer of carotene, characterized by 11 conjugated and 2 non-conjugated carbon–carbon double bonds. Yildiz and Baysal’s research demonstrated that enhancing the LYC content through electroplasmolysis during the preheating process could improve the color of tomato puree more effectively than traditional steaming methods, thereby yielding a superior product [6].

Figure 1.
Tomato, LYC powder, and LYC chemical structure.
Lianfu and Zelong assessed the efficacy of LYC extraction from tomatoes using microwave/ultrasonic and ultrasonic techniques, concluding that the microwave/ultrasonic approach yielded superior pigment recovery [7]. Wang et al., along with Jiang and Wu, utilized ultrasonic extraction for capsanthin from capsicum and LYC from fresh tomatoes, noting that ultrasound significantly enhanced pigment yield [8,9]. Carvalho and Santos successfully dyed polyester fabrics red using LYC, a natural pigment sourced from Solanum lycopersium fruits [10]. In a similar vein, Baaka et al. extracted LYC from tomatoes for use in dyeing wool, silk, and polyamide fabrics, evaluating both the antioxidant capabilities and colorfastness of the dyed materials [11]. Their findings confirmed that tomatoes serve as an environmentally friendly source of natural pigments, imparting functional benefits to textiles. Although there is existing research on LYC’s application in textile dyeing [12,13], the impact of various dyeing parameters on the color intensity of silk treated with LYC needs more investigation. Moreover, the relationships among these parameters are not yet fully understood. To address this, this study began with a single-factor experiment to explore the initial effects on PLA’s adsorption and color properties. Subsequently, a central composite design (CCD) was employed to analyze the importance of each factor and their interactions, and to identify the optimal processing conditions. The primary aim of this research is to enhance the use of bio-extracts in entirely bio-based textile materials, offering a guide for both academic and industrial advancements in research and product development.
2. Materials and Methods
2.1. Materials
Crepe de chine silk, weighing 52 g/m2, was acquired from Wujiang Zhiyuan Textile Co., Ltd., based in Suzhou, China. Tomato extract, primarily composed of LYC, was obtained from Xi’an Shouhe Biological Technology Co., Ltd., located in Xi’an, China. Analytical-grade chemicals such as acetic acid, sodium acetate, ethanol, and dichloromethane (DCM) were supplied by Jiangsu Qiangsheng Chemical Co., Ltd., situated in Changshu, China. All the water used in the process was ultrapure and sourced from a Millipore purification system (MilliporeSigma, Burlington, MA, USA).
2.2. UV–Vis Absorption Spectroscopy
The UV–Vis absorption spectra of LYC in water, ethanol, and dichloromethane were obtained using a Shimadzu UV-1800 UV–Vis spectrophotometer, sourced from Kyoto, Japan. The calibration plot for LYC in the concentration range from 0.05 g/L to 1 g/L in dichloromethane was formulated.
To determine the thermal stability, a mixture of LYC (1 g/L) in water was placed in an oscillated dyeing machine. The solution was subjected to a simulated high-temperature dyeing procedure, commencing from room temperature to 90 °C with a rate of 2 °C/min, and then maintained at that temperature with continuous agitation for 0–60 min. As for pH stability, adjustments were made using acetate buffer. Due to the low solubility of LYC in water, the measurement of the UV–Vis absorption spectrum was taken in DCM after drying up the water in the solution.
2.3. Fabric Treatment
Silk processing was conducted using a water bath shaker that held conical flasks containing 1 g of fabric and 50 mL of the treatment solution. Acetate buffer was used to calibrate the pH levels. The remaining solution underwent an exhaustion assessment. In the single-factor experiment, the correlation between the level of LYC and color intensity was investigated.
2.4. CCD Experiment
A central composite design (CCD) experiment was executed using Minitab 19’s trial edition (USA), following the procedure detailed in Section 2.3, related to fabric processing. This study focuses on the impact of three key factors—LYC concentration, pH level, and temperature—on the color intensity (K/S) of dyed silk fabrics. The predicted and actual values for these parameters are summarized in Table 1.

Table 1.
Matrix for variables and levels.
2.5. Measurement
2.5.1. Adsorption Quantity
The adsorption quantity (mg/g) was calculated from the exhaustion percentage (%) of LYC using the Abs at λmax = 478 nm, by comparing the quantity of LYC in the treatment solution before and after silk treatment; see Equation (1) [14,15]:
where C0 and C1 are the LYC concentrations before and after adsorption, respectively.
2.5.2. Color Characteristics
The L*a*b* coordinates and K/S values for the silk fabric were obtained using a HunterLab UltraScan PRO reflectance spectrophotometer with a 10-degree standard observer setting. Fastness to washing and rubbing was assessed using a WashTec-P fastness tester (Roaches International, Leek, England), in accordance with ISO 105-C06, and a Model 670 Crockmaster (James H. Heal, Halifax, England), following ISO 105-X12, respectively.
3. Results
3.1. Properties of LYC in Various Solvents
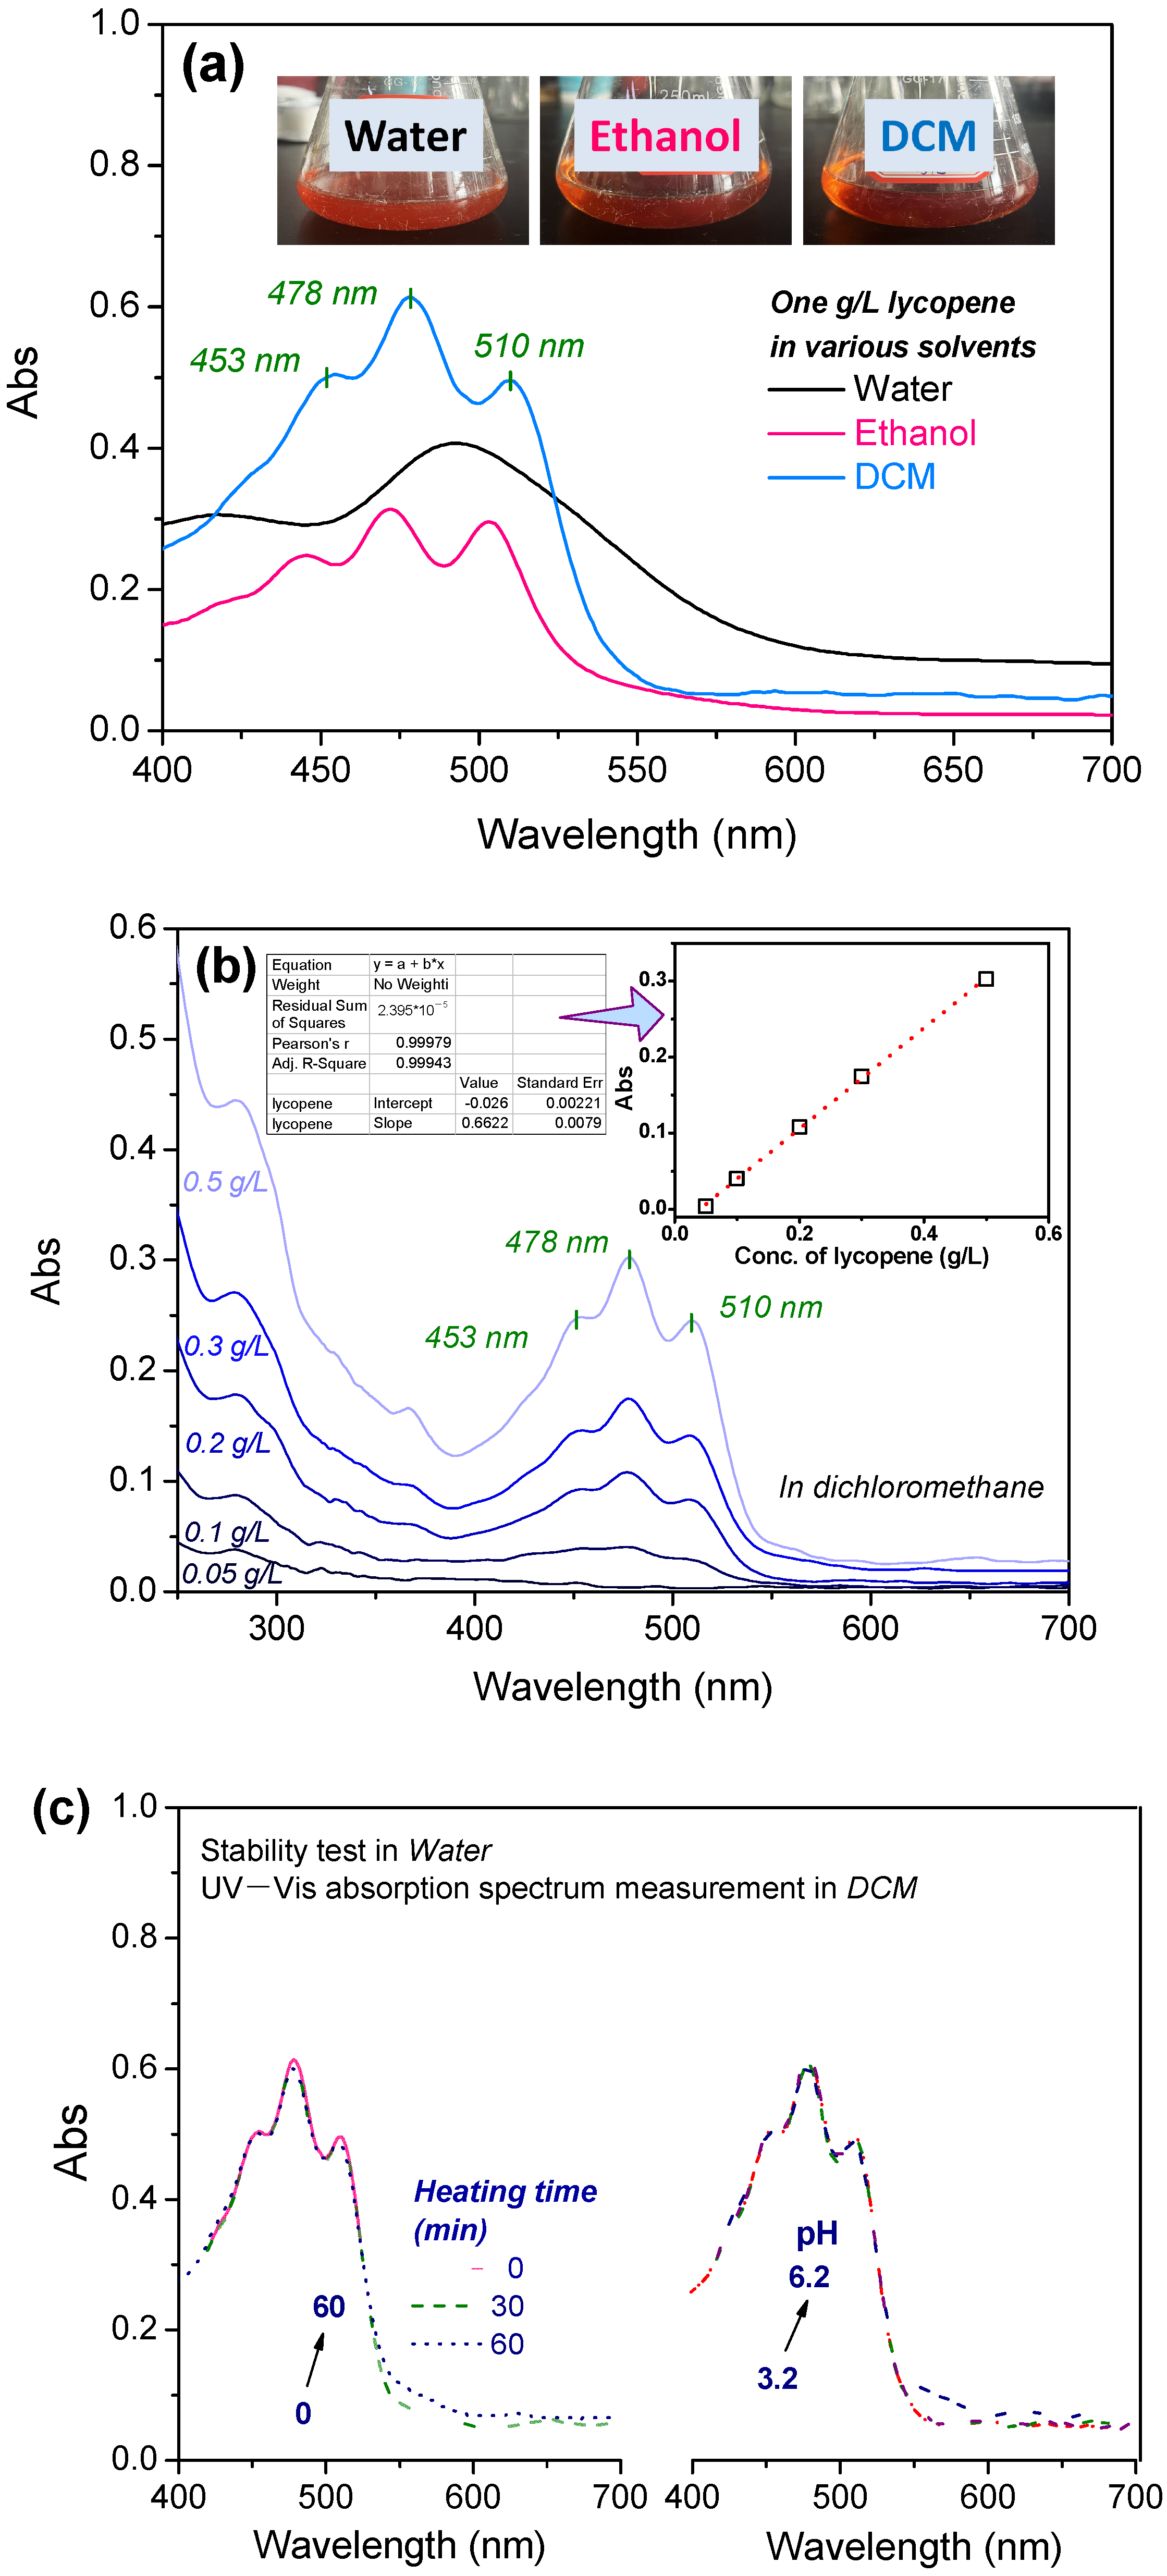
Before applying LYC to silk, it is necessary to select an appropriate solvent to evaluate its light absorption properties and determine its concentration in both the silk and the remaining dye solution. To this end, one gram of LYC was either dissolved or dispersed in water, ethanol, and DCM. The resulting mixtures’ spectra and images are shown in Figure 2a. It is evident that LYC displays distinct and strong peaks in both DCM and ethanol solutions. In contrast, the spectrum of LYC in water is quite faint, featuring only a broad band near 490 nm. This is because LYC is a lipophilic natural pigment and part of the carotenoid family [12]. As depicted in its chemical structure in Figure 1, LYC lacks any hydrophilic groups, confirming its hydrophobic characteristics. In both DCM and ethanol, three clear, intense peaks appear between 450 and 510 nm. These absorption bands are characteristic of xanthophyll derivatives. The primary band at 478 nm corresponds to the red hue of LYC. This observation aligns with the UV–Vis absorption spectra seen in the inserted images. The turbidity of LYC in water indicates minimal solubility, while its partial solubility in ethanol contrasts with its superior solubility in DCM. Overall, given the higher solubility of LYC in DCM compared to water and ethanol, DCM was chosen for further experiments.
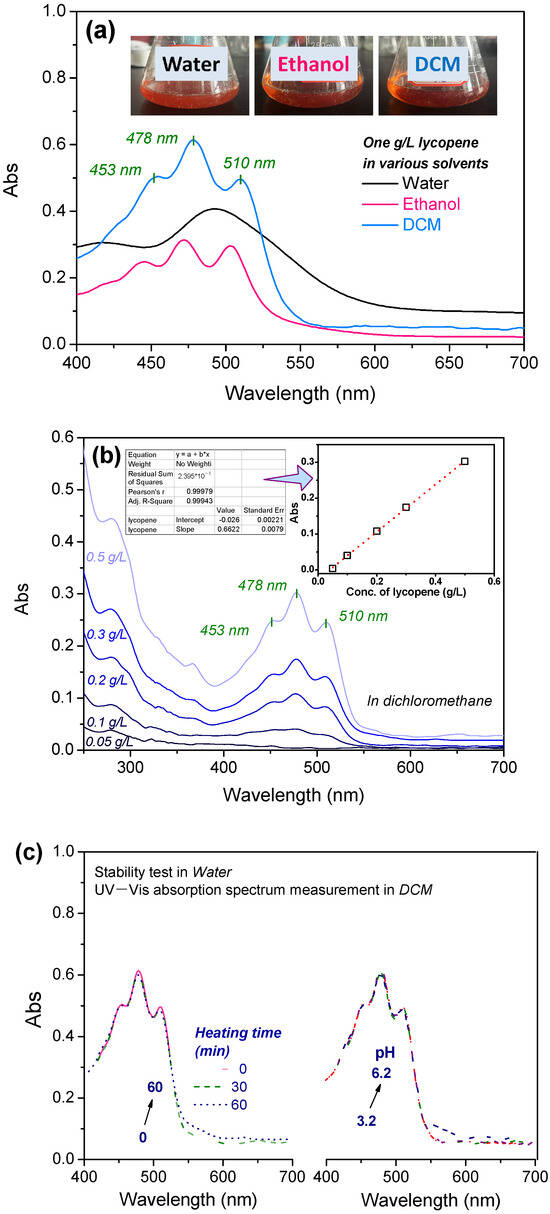
Figure 2.
(a) UV–Vis absorption spectra of LYC in various solvents. (b) Calibration curve of LYC in dichloromethane. (c) Stability of LYC in water under heating and pH-adjusted conditions.
Figure 2b displays the UV–Vis absorption spectra of LYC in DCM at varying concentrations ranging from 0.05 g/L to 0.5 g/L. As the concentration of LYC increases, so does the absorption intensity. A calibration curve was constructed based on the relationship between absorbance (Abs) and LYC concentration. The extremely high R-squared value indicated the model’s excellent fit, which facilitated the precise measurement of LYC concentration. Notably, the calibration curve had a slope of just 0.6622, indicating a low color saturation level for LYC. This suggests that to achieve higher color intensity on fabrics, the dyeing process must be adjusted to enhance LYC’s adsorption onto the fabric.
The stability of LYC within the dye bath is crucial for maintaining dyeing quality. As depicted in Figure 2c, the stability of LYC was evaluated under heated conditions at 90 °C and across a pH range of 3.2 to 6.2. The UV–Vis absorption spectra remain virtually unchanged over 60 min of heating, indicating excellent thermal stability under dyeing conditions. Furthermore, alterations in pH had minimal impact on the UV–Vis absorption profiles. This robust stability can be attributed to the limited number of reactive functional groups in the LYC structure, which makes it resistant to changes induced by heat or solvents.
3.2. Building-Up Property
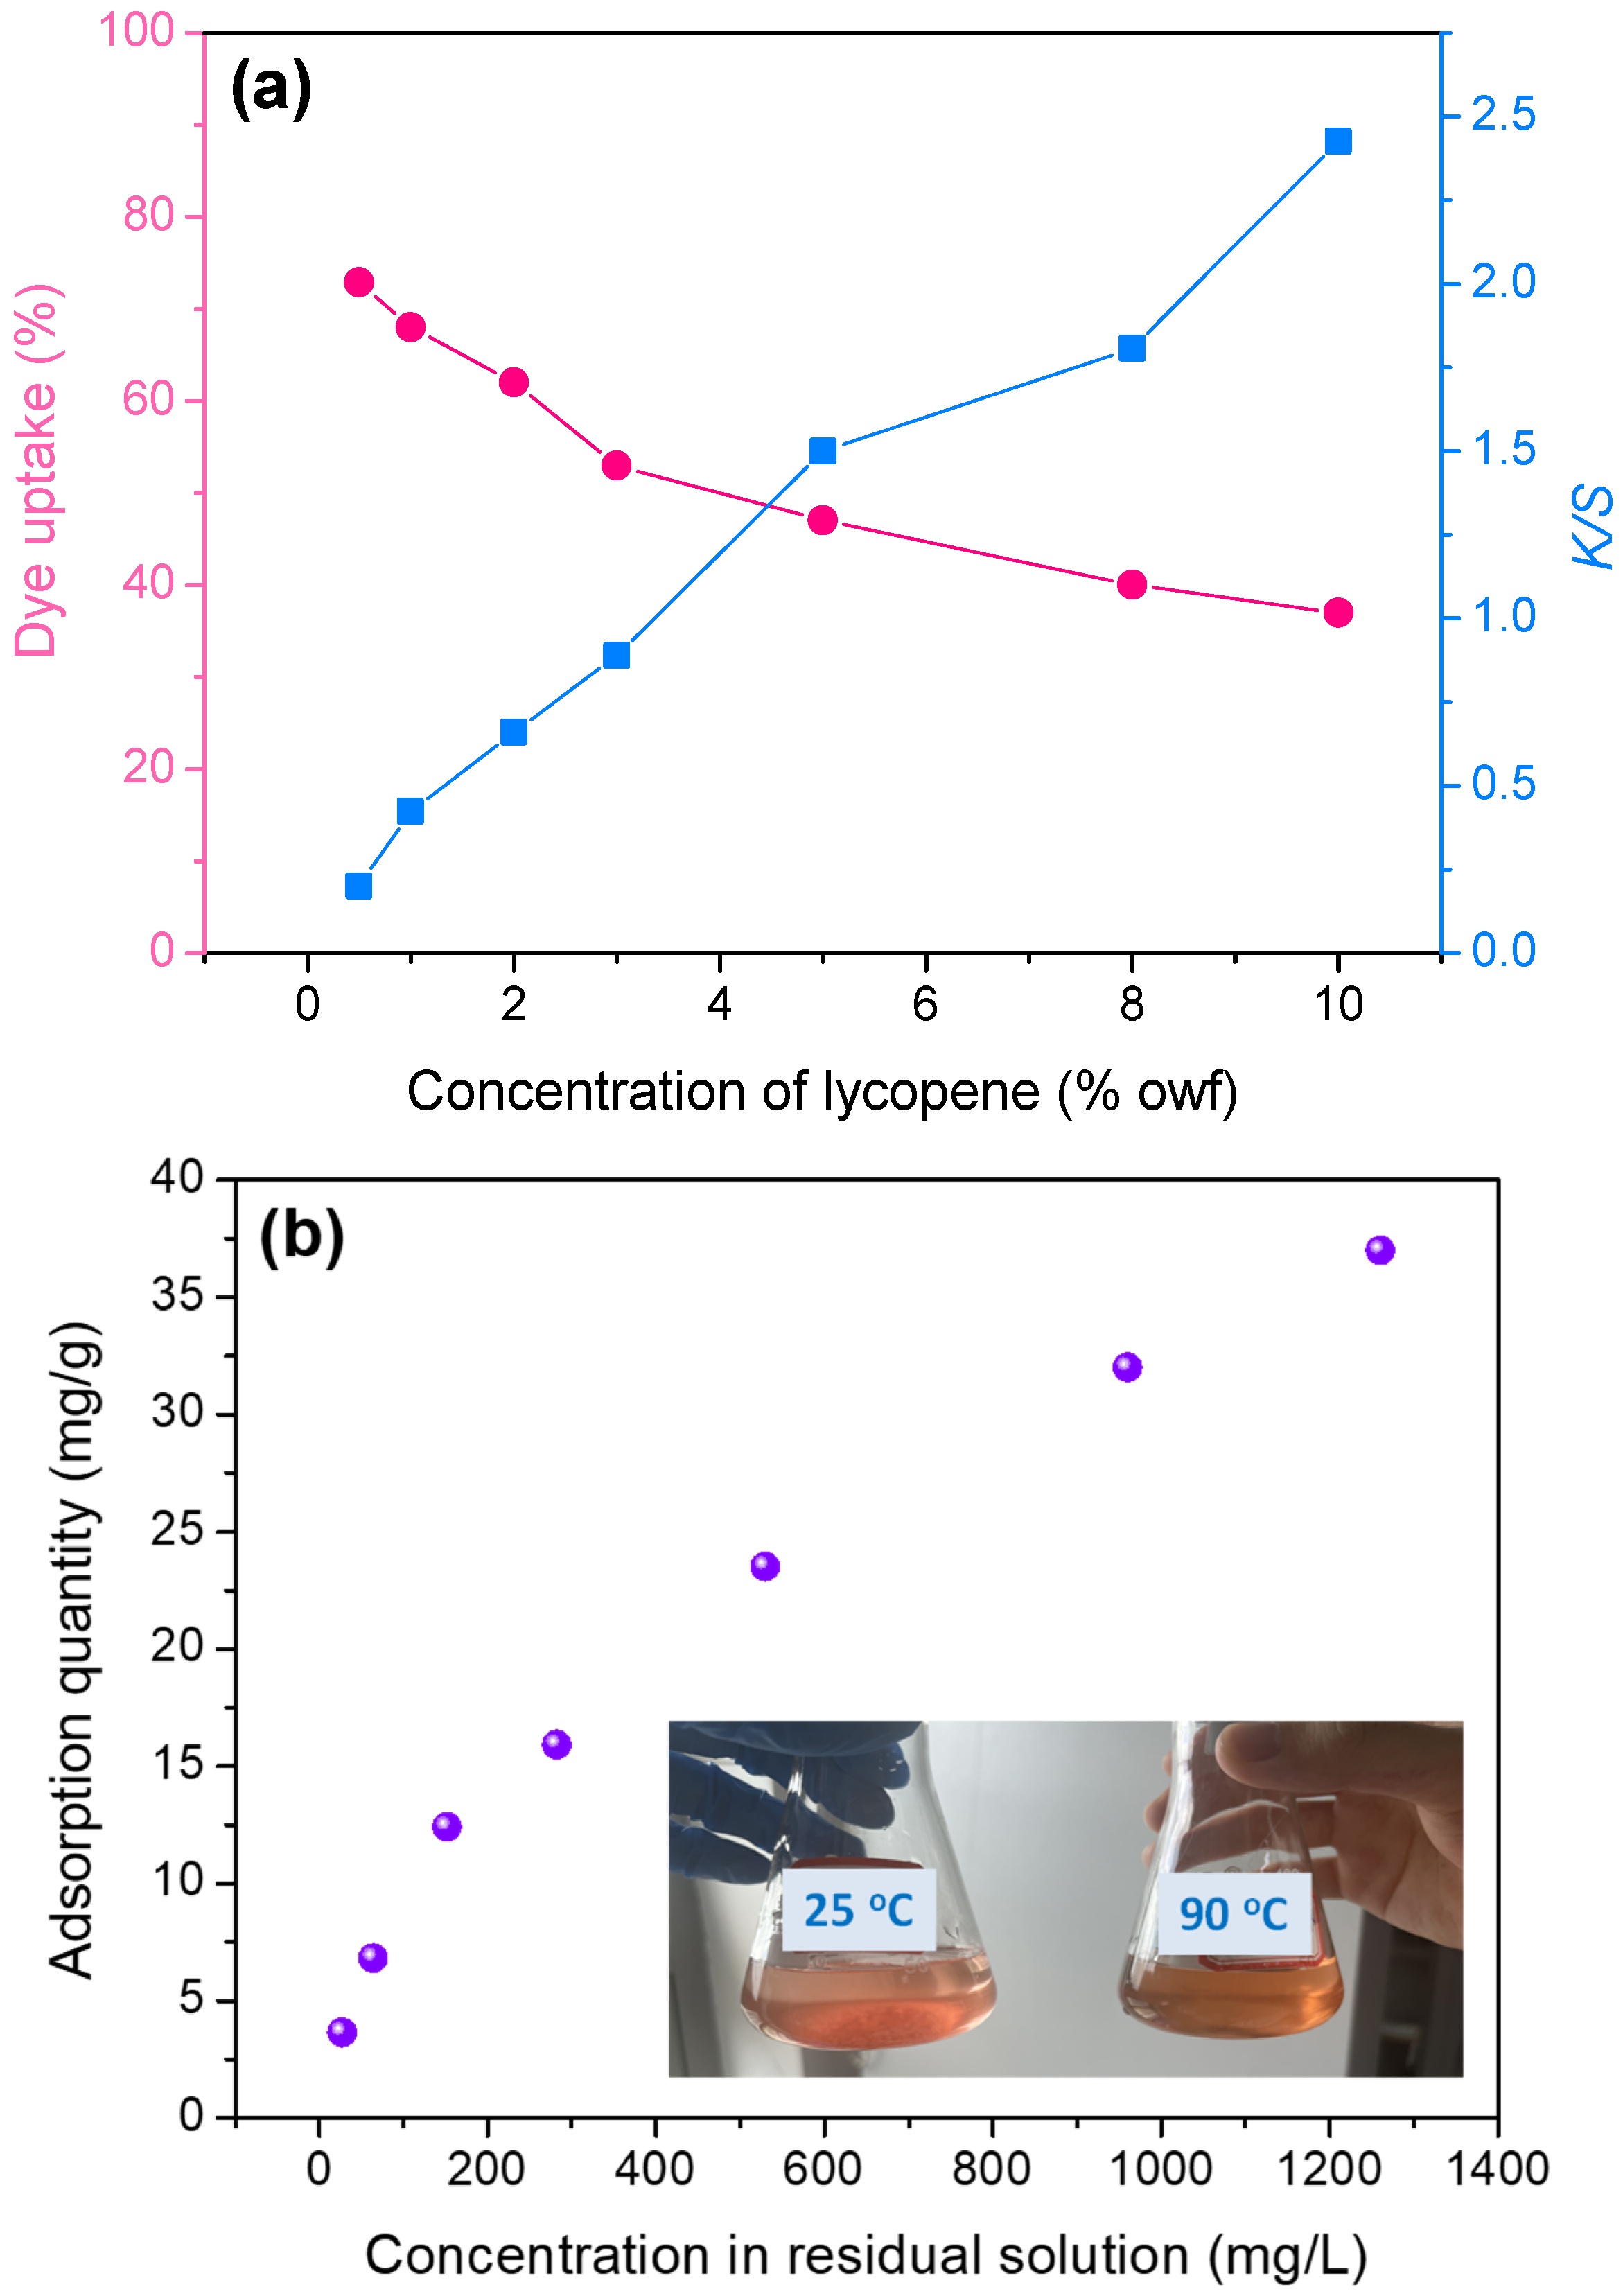
The effects of varying LYC concentrations on dye absorption, the amount of LYC adsorbed, and the color intensity of dyed silk were investigated through a single-factor experiment. As shown in Figure 3a, an increase in LYC concentration resulted in a decrease in dye absorption, indicating the reduced effectiveness of LYC. However, the color intensity increased, suggesting a deeper hue. To quantify the precise adsorption levels, a graph of adsorption quantity versus concentration in the residual solution was plotted and is shown in Figure 3b. It revealed that the amount of LYC adsorbed rose with its concentration in the dye bath, which explains the enhanced color depth. Notably, even at higher LYC concentrations, the color depth continued to increase. Intriguingly, despite LYC’s poor solubility in water (as seen in Figure 2a), it could be adsorbed by silk. To visually examine solubility, a heated conical flask was used. The inset photograph shows that at room temperature, only a small amount of LYC (0.4 g/L) dissolved in water, with most of it settling at the bottom of the container. At 90 °C, however, there were virtually no undissolved residues, as the elevated temperature facilitated the disintegration of LYC, enhancing its adsorption. Considering the low color saturation of LYC observed in Section 3.1 across various solvents, exploring optimal dyeing conditions is essential to achieve deeper color shades.
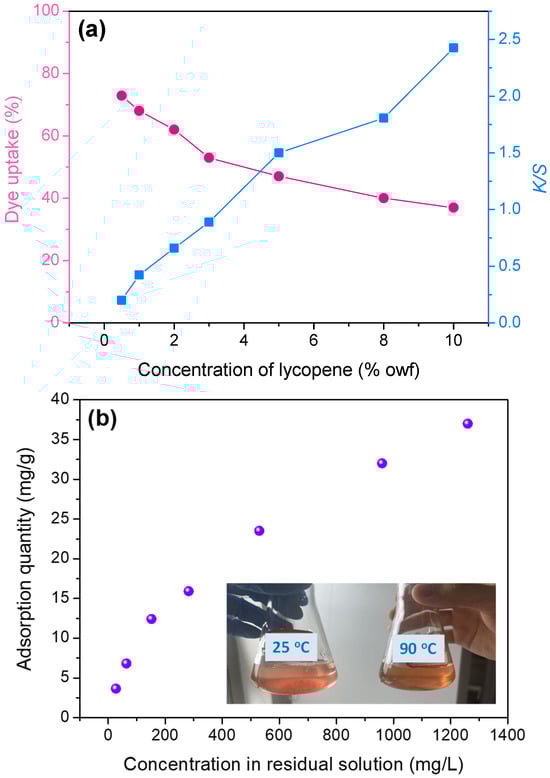
Figure 3.
(a) Dye uptake and color strength of dyed silk, and (b) adsorption quantity vs. concentration in residual solution.
3.3. Analysis of CCD Experiment
A comprehensive study using CCD was undertaken to explore the multifactorial impacts on the color strength of dyed silk, offering a more profound understanding compared to a single-factor experiment. A critical equation was formulated to depict the relationship between processing variables and the color strength of dyed silk. The use of response surface methodology enabled a detailed examination of the compiled data. As outlined in Table 1, the investigated factors were a1. LCY concentration ranging from 1.6% to 18.4% owf; a2. pH values spanning from 3.3 to 6.7; and a3. temperatures between 63.2 °C and 96.8 °C. Consequently, the equation was established as:
where a1, a2, and a3 are variables; A is a constant; B, C, and D are the linear coefficients; E, F, and G are the interactive coefficients; and H, I, and J are the quadratic coefficients.
K/S = A + Ba1 + Ca2 + Da3 + Ea1a2 + Fa1a3 + Ga2a3 + Ha12 + Ia22 + Ja32
The actual equation generated from modeling is shown below:
K/S = −0.82 + 0.1687 × Conc.(LYC) + 0.068 × pH + 0.0180 × Temp. − 0.00503 × Conc.(LYC) × Conc.(LYC) − 0.0128 × pH × pH − 0.000065 × Temp. × Temp. + 0.00367 × Conc.(LYC) × pH + 0.000772 × Conc.(LYC) × Temp. + 0.00071 × pH × Temp.
Table 2 presents the factorial design along with the calculated and observed adsorption capacities (mg/g). As outlined in Table 3, the model’s F value of 52.59 indicates a significant fit. The linear components (B and C) and the interaction component (E) all have p-values below 0.001, highlighting their critical role in the adsorption of baicalin onto PLA. The ’lack-of-fit’ p-value of 0.541 is above the 0.05 threshold, suggesting that the lack of fit is not statistically significant. Furthermore, the predicted R-Squared value of 90.79% aligns well with the adjusted R-Squared of 96.07%, indicating a high degree of agreement between the theoretical predictions and the experimental outcomes. The model’s high R2 value of 97.93% underscores its excellent applicability for making predictions.
Table 2.
Experimental runs and responses.
Table 3.
Model analysis.
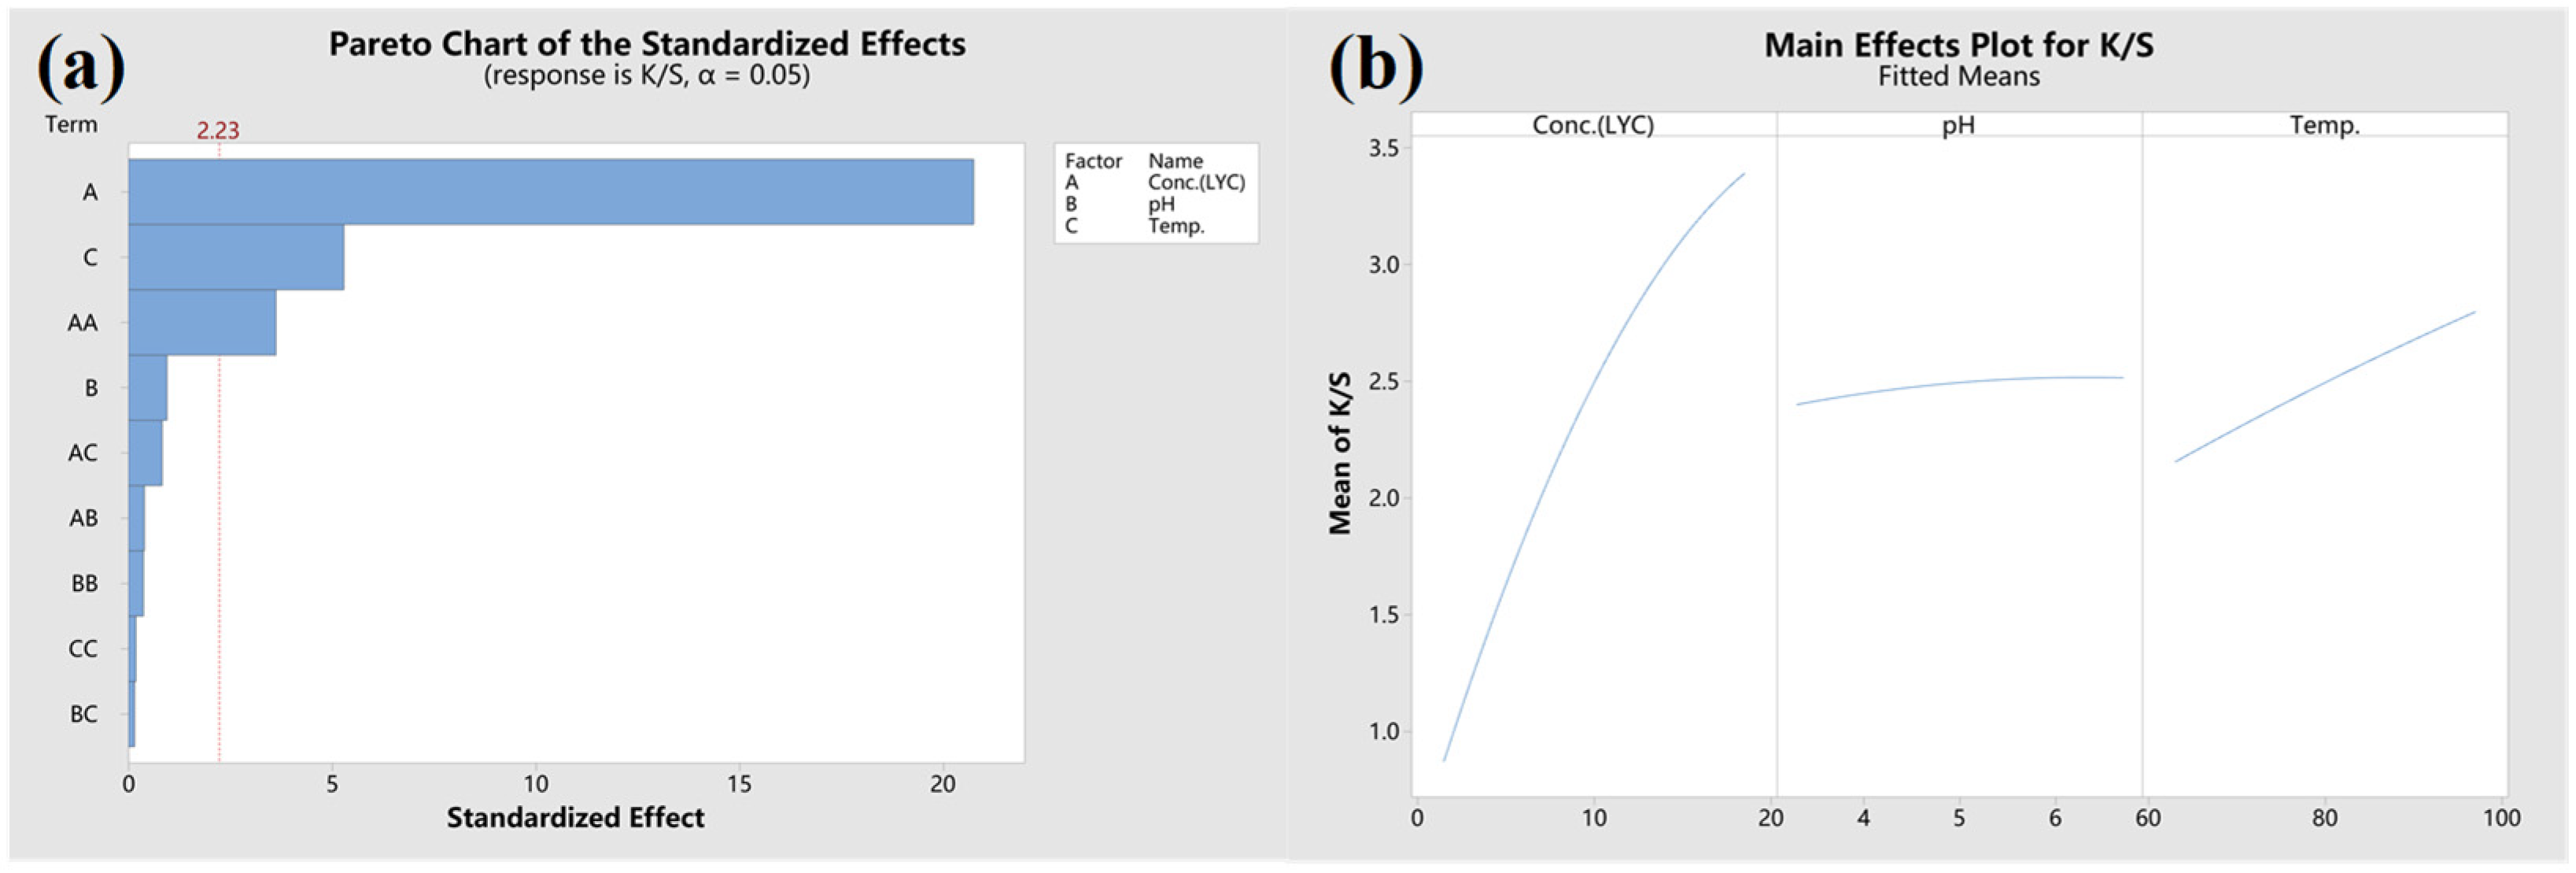
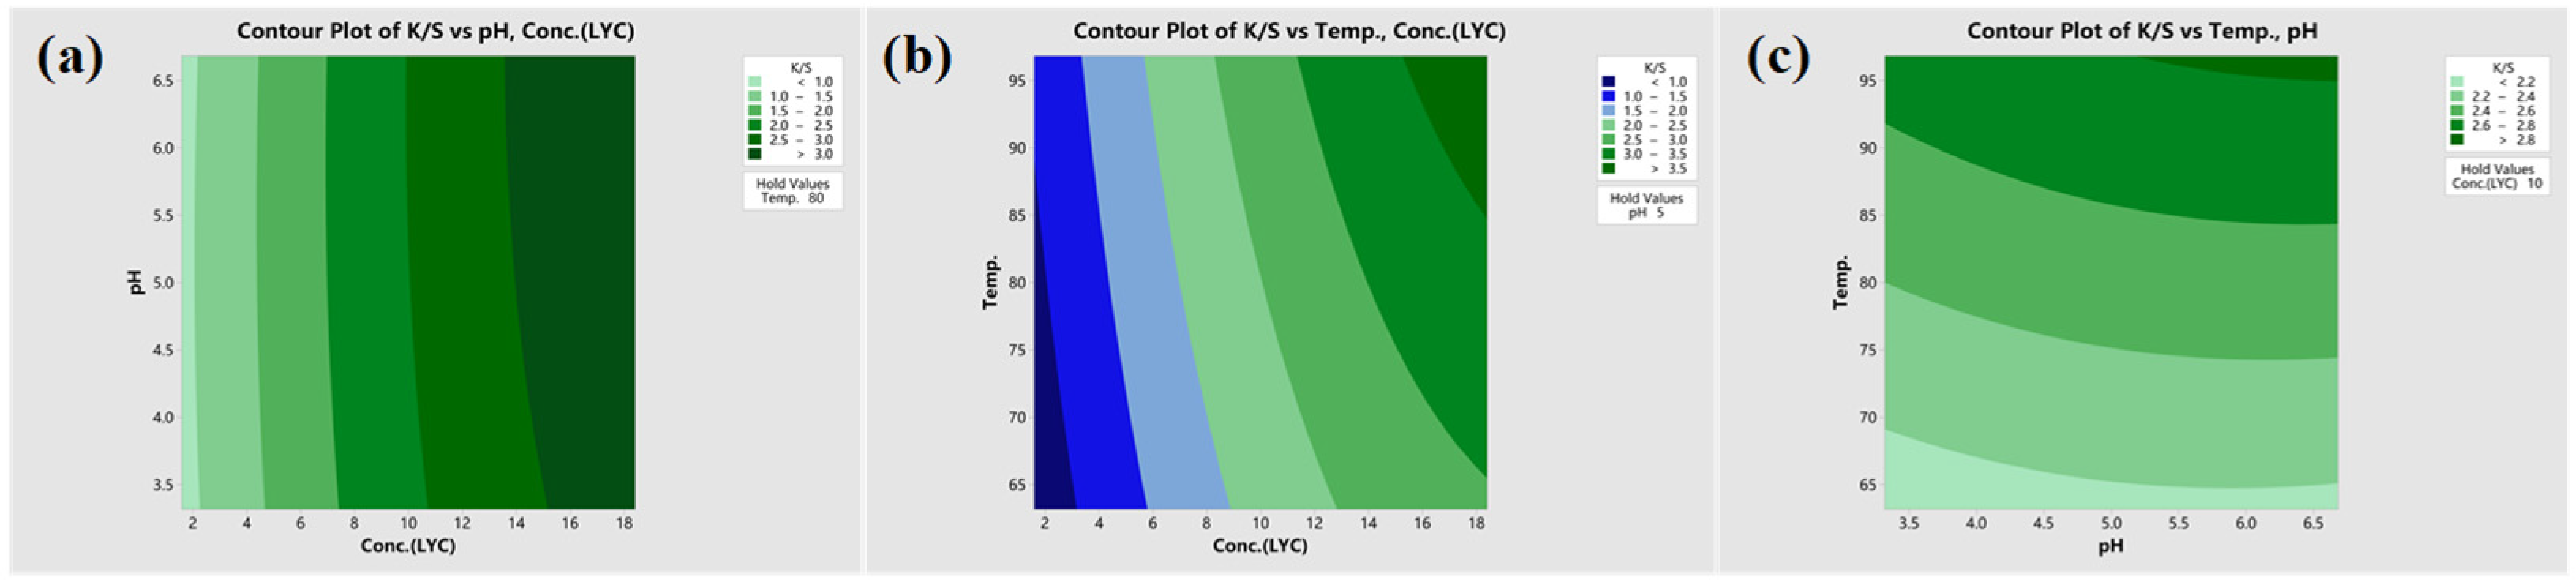
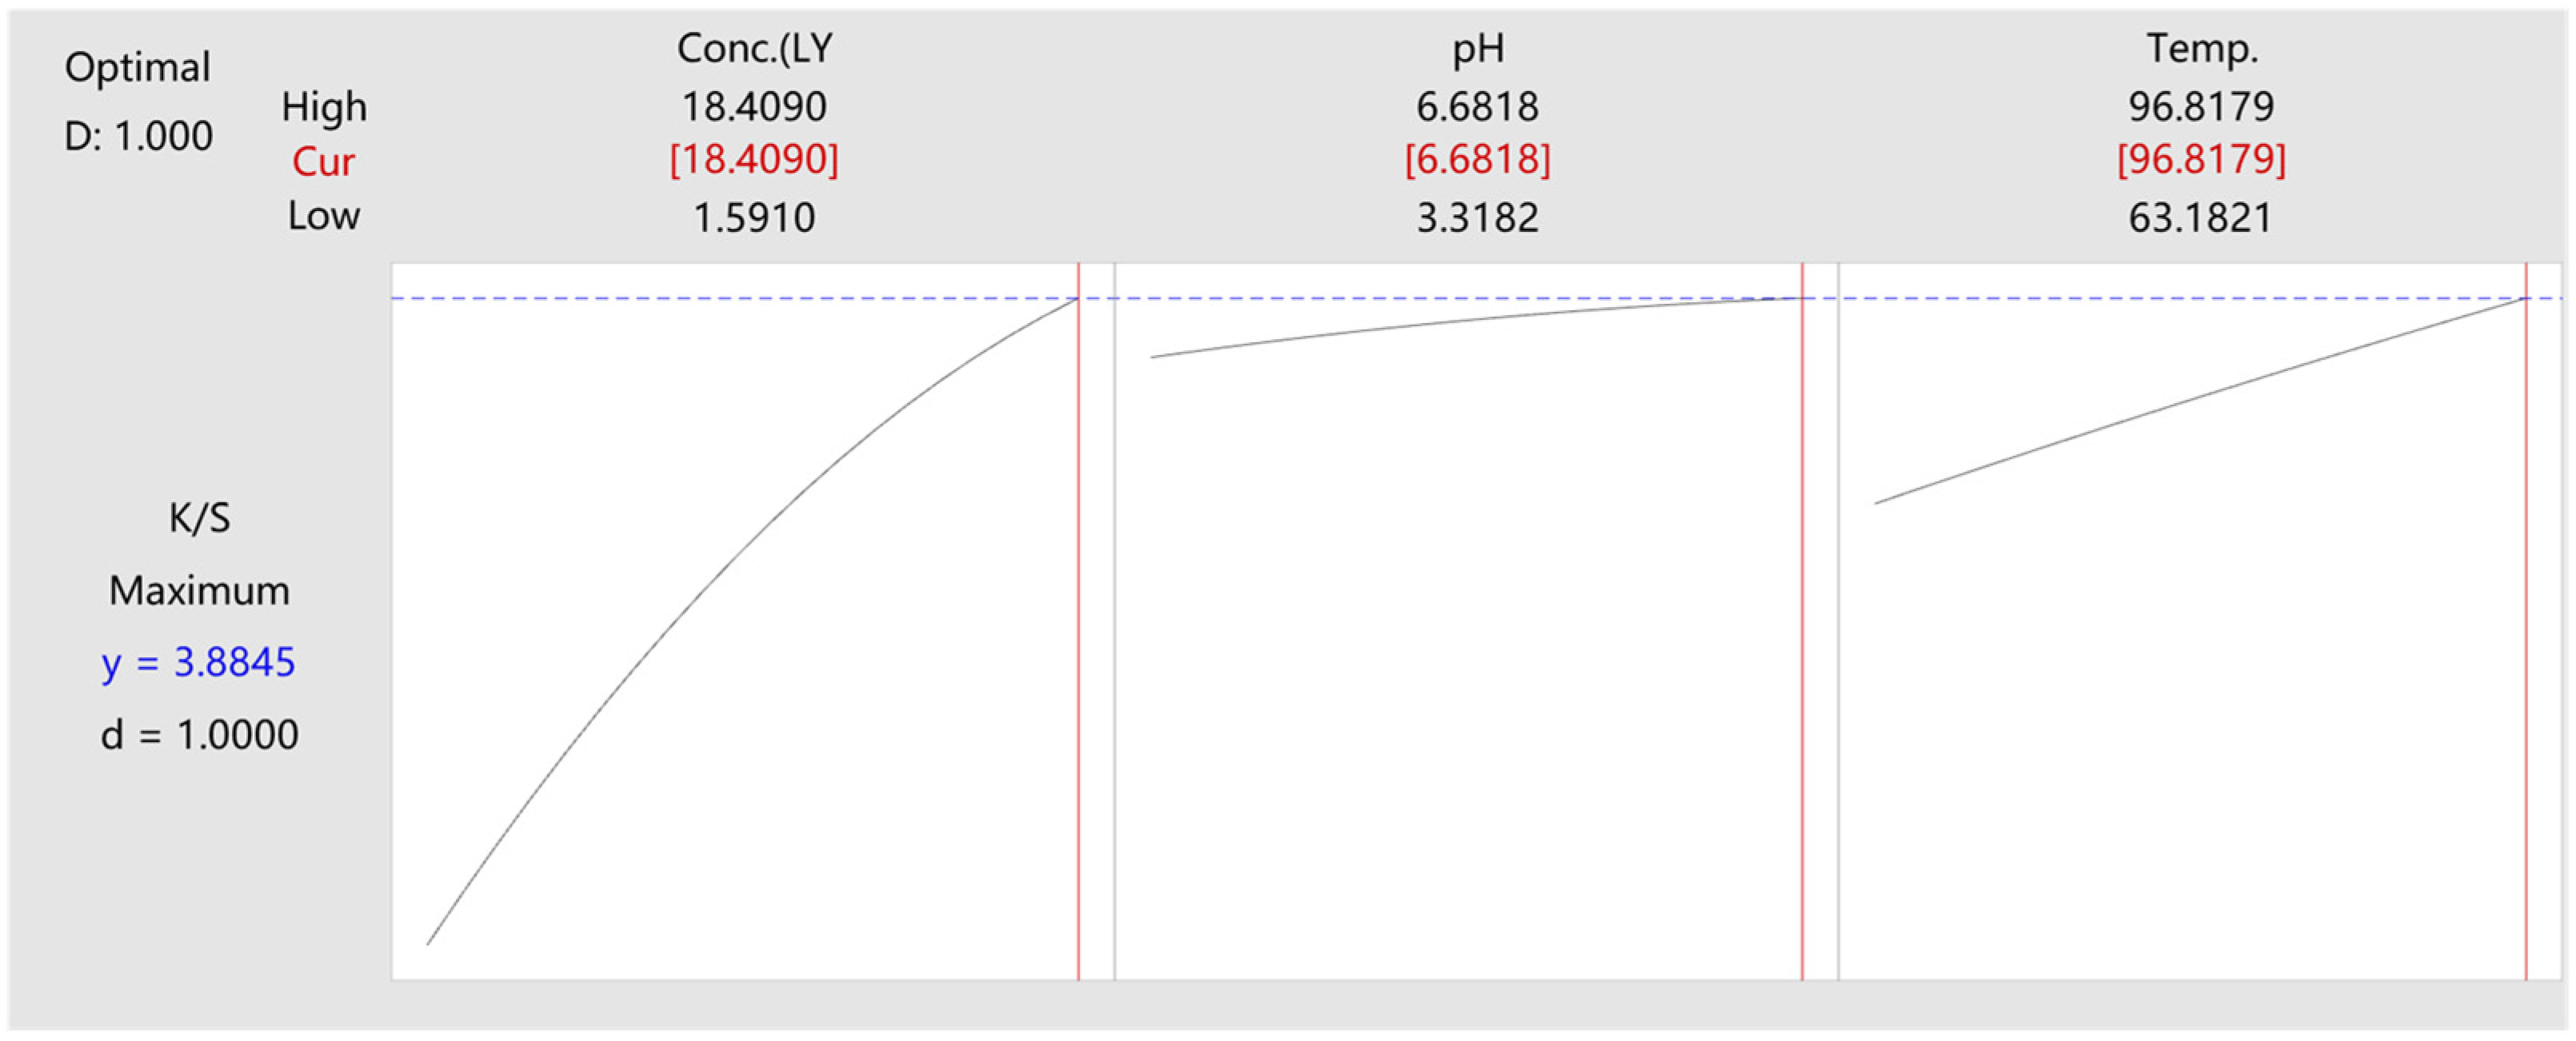
Graphical representations, such as those for main effects and interactions, significantly enhance the understanding of variable importance and their interrelationships. Pareto charts, specifically, highlight the magnitude of these effects. In line with the findings from the p-values reported in Table 3, Figure 4a,b reveal that the concentration of LYC and temperature are the most influential variables. Notably, the concentration of LYC had the greatest impact on color depth. The pH factor, however, did not show significance, likely because LYC did not undergo disassociation at different pH levels. Any observed increase in LYC adsorption can be attributed to the minor expansion of silk fibers and enhanced solubility. Higher temperatures contributed to greater fiber expansion, thereby increasing adsorption capacity. Within the studied range, there were no significant interactions among the factors. Of the three pairs considered, the interaction between LYC concentration and temperature had the lowest p-value. A contour diagram (Figure 5) elucidates the impact of parameters using a quadratic model. The deep green area indicates high color yields, located in the top right corner, suggesting that increasing both temperature and LYC concentration improves performance. However, pH did not have a substantial effect on color strength when varied alongside LYC concentration or temperature, which was in agreement with the findings in Table 3. Consequently, an optimal processing condition was determined (LYC concentration: 18.4% owf; pH 6.68; temperature: 96.8 °C), predicting a maximum theoretical K/S value of 3.88 for silk (Figure 6).
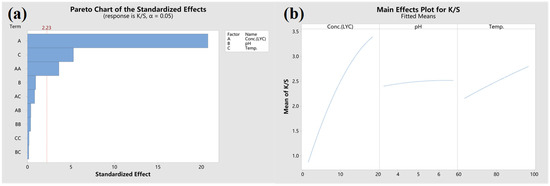
Figure 4.
(a) Pareto chart and (b) main effects plot for silk dyeing with LYC.

Figure 5.
Contour plots: (a) LYC concentration and pH, (b) LYC concentration and temperature, and (c) pH and temperature.
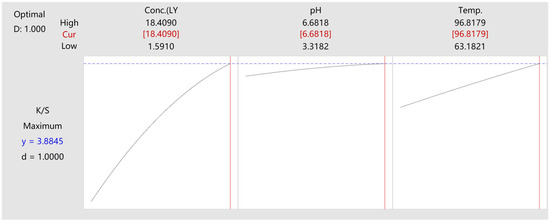
Figure 6.
Optimization for the K/S of LYC-dyed silk.
3.4. Color Characterization and Fastness
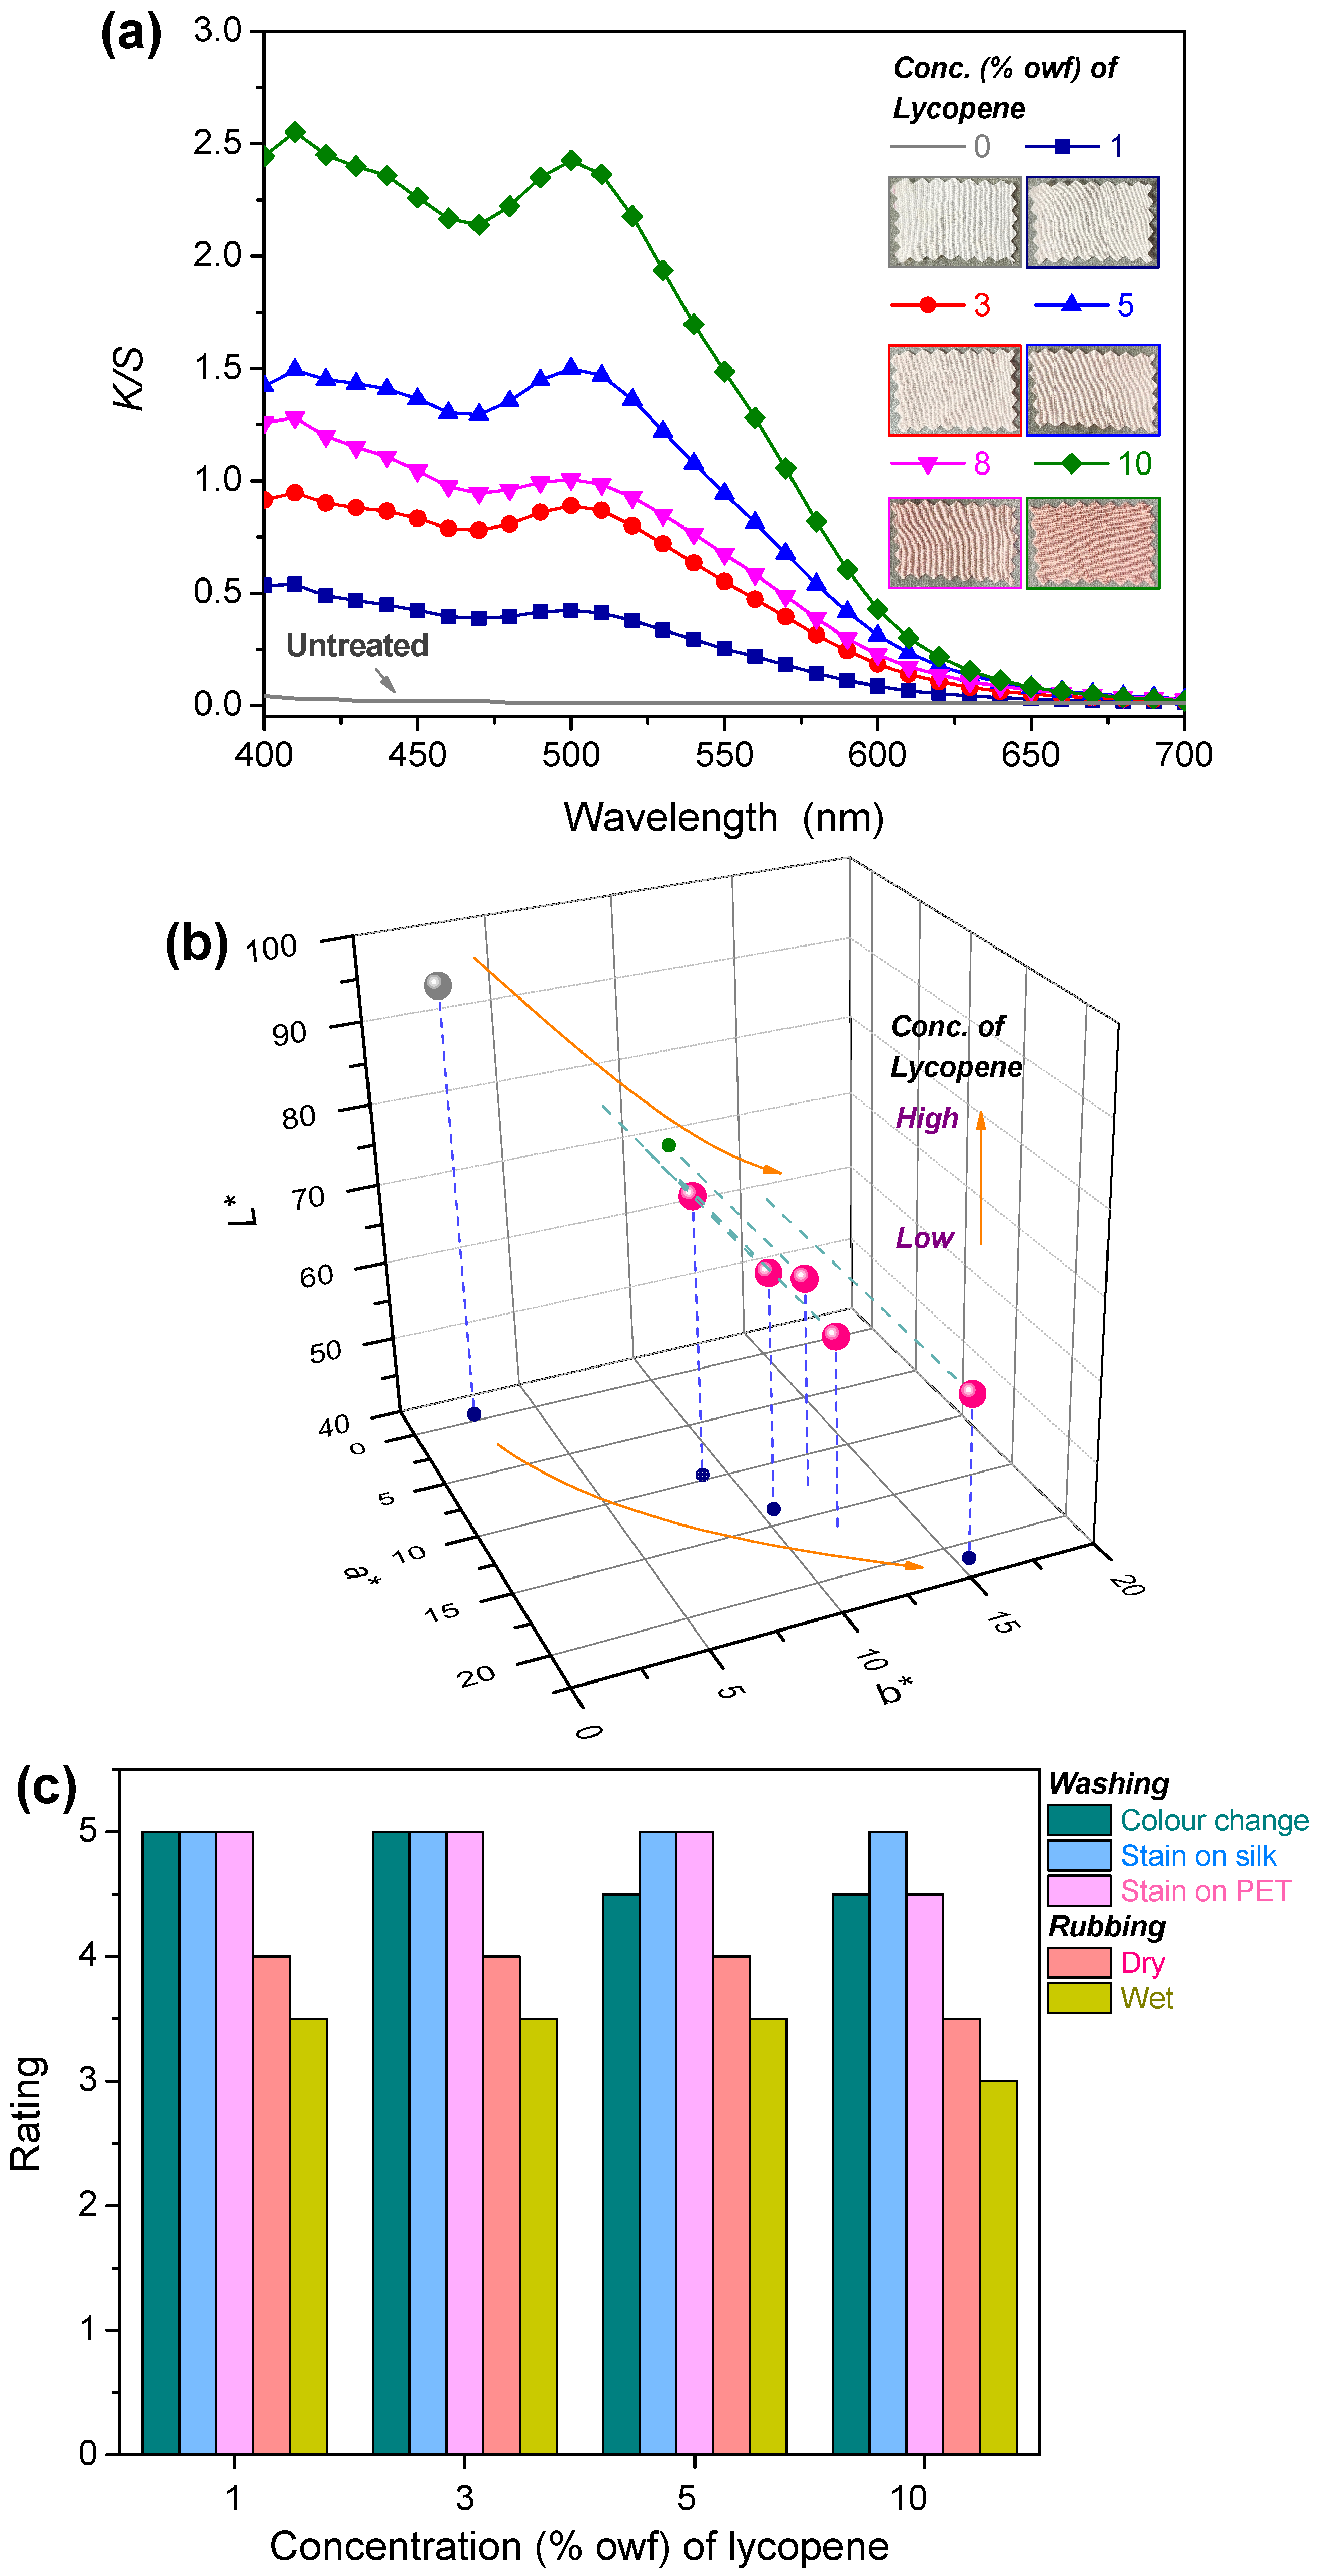
As illustrated in Figure 7a, natural silk exhibited low K/S values across the entire visible spectrum, suggesting a relatively dull hue. When silk was dyed with LYC, a broad peak emerged around 500 nm, reflecting the interaction between the dye and the silk fiber. An increase in LYC concentration led to an enhancement in the K/S values, and the photographic insert vividly demonstrates the deepening red coloration of the silk fabric as the dye concentration rises. Simultaneously, the lightness values (Figure 7b) decreased, indicating a darker shade. The a*/b* coordinates moved towards the lower-right quadrant of the plane. Overall, as depicted in Figure 7c, the colorfastness ratings were generally above moderate levels. Silk dyed with LYC concentrations below 3 achieved a colorfastness to washing rating of 5, while higher concentrations of LYC reduced this rating. At 10% owf, LYC was more likely to stain PET than silk, likely due to its hydrophobic properties. The rubbing fastness of LYC-dyed silk was rated between 3 and 4. This is attributed to the tendency of LYC aggregates on the surface of the dyed silk fibers to rub off. Consequently, enhancing the rubbing fastness of LYC-dyed silk is a promising area for future research.
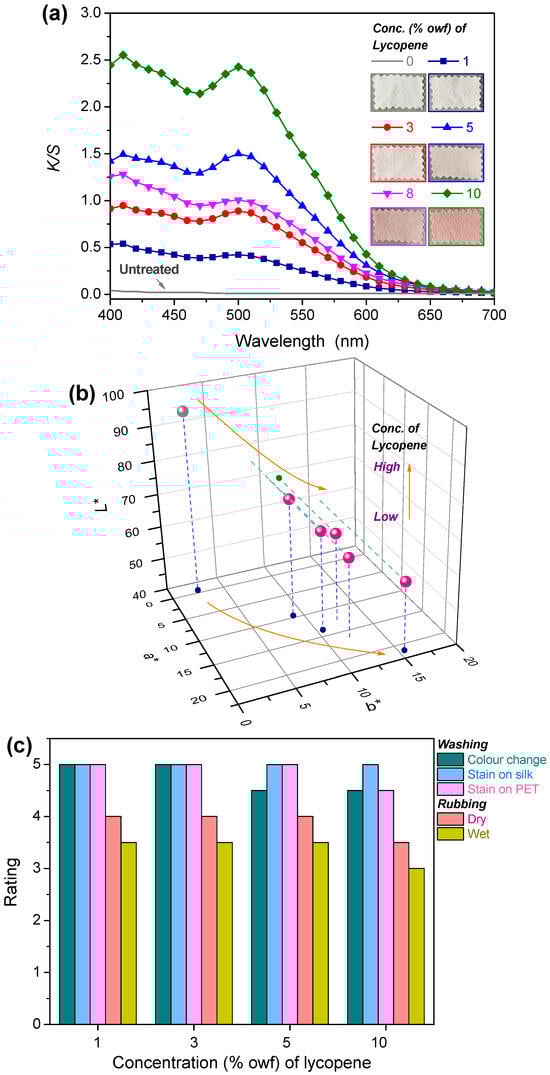
Figure 7.
(a) K/S curve, (b) L*a*b* values, and (c) washing and rubbing fastness.
4. Conclusions
This study focuses on the use of a new natural red dye, known as LYC, on silk materials. Before applying the dye to silk, the properties of LYC in various solvents were analyzed, and its stability was confirmed. A central composite design (CCD) experiment was carried out to assess the color intensity of silk under different conditions. The results showed that LYC was more soluble in dichloromethane (DCM) than in water or ethanol. The dye remained stable when exposed to heat at 90 °C or in solutions with a pH between 3.2 and 6.2. Higher temperatures increased the breakdown of LYC, which enhanced its absorption by the silk. The CCD experiment revealed that the concentration of LYC was the most significant factor influencing color depth, followed by temperature, while pH had a minimal effect. As the LYC concentration increased, the color strength and saturation of the dyed silk also increased. Although the silk dyed with LYC showed excellent wash fastness, its rub fastness needs improvement.
Author Contributions
Conceptualization, Y.Z.; methodology, J.Z.; software, Y.Z.; validation, Y.Z., and J.Z.; formal analysis, Y.Z.; investigation, J.Z.; resources, Y.Z.; data curation, Y.Z.; writing—original draft preparation, Y.Z. and J.Z.; writing—review and editing, Y.Z.; visualization, Y.Z.; supervision, Y.Z.; project administration, Y.Z.; funding acquisition, Y.Z. All authors have read and agreed to the published version of the manuscript.
Funding
This research was funded by the National Natural Science Foundation of China (52203065); the Suzhou Intangible Cultural Heritage Inheritance and Innovation Consortium (Textile and Silk Category) Sub-project 2 (7111500224); the Opening Project of the Jiangsu Engineering Research Center of Textile Dyeing and Printing for Energy Conservation, Discharge Reduction and Cleaner Production (ERC) (SDGC2226); and the China National Textile and Apparel Council Key Laboratory of Natural Dyes (YX202327).
Data Availability Statement
The raw data supporting the conclusions of this article will be made available by the authors on request.
Conflicts of Interest
The authors declare no conflicts of interest.
References
- Novais, C.; Molina, A.K.; Abreu, R.M.V.; Santo-Buelga, C.; Ferreira, I.C.F.R.; Pereira, C.; Barros, L. Natural Food Colorants and Preservatives: A Review, a Demand, and a Challenge. J. Agric. Food Chem. 2022, 70, 2789–2805. [Google Scholar] [CrossRef] [PubMed]
- Rojas-Garbanzo, C.; Gleichenhagen, M.; Heller, A.; Esquivel, P.; Schulze-Kaysers, N.; Schieber, A. Carotenoid Profile, Antioxidant Capacity, and Chromoplasts of Pink Guava (Psidium guajava L. Cv. ‘Criolla’) during Fruit Ripening. J. Agric. Food Chem. 2017, 65, 3737–3747. [Google Scholar] [CrossRef] [PubMed]
- Skibsted, L.H. Carotenoids in Antioxidant Networks. Colorants or Radical Scavengers. J. Agric. Food Chem. 2012, 60, 2409–2417. [Google Scholar] [CrossRef] [PubMed]
- Nair, A.; Ahirwar, A.; Singh, S.; Lodhi, R.; Lodhi, A.; Rai, A.; Jadhav, D.A.; Harish; Varjani, S.; Singh, G.; et al. Astaxanthin as a King of Ketocarotenoids: Structure, Synthesis, Accumulation, Bioavailability and Antioxidant Properties. Mar. Drugs 2023, 21, 176. [Google Scholar] [CrossRef] [PubMed]
- Kong, K.W.; Khoo, H.E.; Prasad, K.N.; Ismail, A.; Tan, C.P.; Rajab, N.F. Revealing the power of the natural red pigment lycopene. Molecules 2010, 15, 959–987. [Google Scholar] [CrossRef] [PubMed]
- Yildiz, H.; Baysal, T. Color and lycopene content of tomato puree affected by electroplasmolysis. Int. J. Food Prop. 2007, 10, 489–495. [Google Scholar] [CrossRef]
- Lianfu, Z.; Zelong, L. Optimization and comparison of ultrasound/microwave assisted extraction (UMAE) and ultrasonic assisted extraction(UAE) of lycopene from tomatoes. Ultrason. Sonochem. 2008, 15, 731–737. [Google Scholar] [CrossRef] [PubMed]
- Wang, B.; Wang, J.Z.; Zhao, L.C. The optimization of response surface method on capsicum red dyestuff extracting by ultrasonic method. Chin. Agric. Sci. Bull. 2008, 24, 96–101. [Google Scholar] [CrossRef]
- Jiang, S.J.; Wu, J.B. Study on the extracting process of orange peel stuff by ultrasonic technology. J. Anhui. Sic. 2008, 36, 3934–3935, 3940. [Google Scholar]
- Carvalho, C.; Santos, G. Global communities, biotechnology and sustainable design–natural/bio dyes in textiles. Procedia Manuf. 2015, 3, 6557–6564. [Google Scholar] [CrossRef]
- Baaka, N.; El Ksibi, I.; Mhenni, M.F. Optimisation of the recovery of carotenoids from tomato processing wastes: Application on textile dyeing and assessment of its antioxidant activity. Nat. Prod. Res. 2017, 31, 196–203. [Google Scholar] [CrossRef] [PubMed]
- Castro, T.A.; Leite, B.S.; Assuncao, L.S.; de Jesus Freitas, T.; Colauto, N.B.; Linde, G.A.; Otero, D.M.; Machado, B.A.S.; Ferreira Ribeiro, C.D. Red Tomato Products as an Alternative to Reduce Synthetic Dyes in the Food Industry: A Review. Molecules 2021, 26, 7125. [Google Scholar] [CrossRef] [PubMed]
- Freeman, H.S.; Räisänen, R. Waterless Dyeing with Plant-Based Natural Dyes as Colorants; International Society for Horticultural Science (ISHS): Leuven, Belgium, 2023; pp. 141–148. [Google Scholar]
- Wu, M.; Zhou, Y.; Tang, R.-C. Bridging phycocyanin onto silk by genipin towards durable colouristic, antioxidant and UV protective properties: A sustainable strategy for fully bio-based textile. Chem. Eng. J. 2023, 477, 146808. [Google Scholar] [CrossRef]
- Zhou, Y.; Yang, Z.Y.; Tang, R.C. Bioactive and UV protective silk materials containing baicalin—The multifunctional plant extract from Scutellaria baicalensis Georgi. Mater. Sci. Eng. C Mater. Biol. Appl. 2016, 67, 336–344. [Google Scholar] [CrossRef] [PubMed]
Disclaimer/Publisher’s Note: The statements, opinions and data contained in all publications are solely those of the individual author(s) and contributor(s) and not of MDPI and/or the editor(s). MDPI and/or the editor(s) disclaim responsibility for any injury to people or property resulting from any ideas, methods, instructions or products referred to in the content. |
© 2025 by the authors. Licensee MDPI, Basel, Switzerland. This article is an open access article distributed under the terms and conditions of the Creative Commons Attribution (CC BY) license (https://creativecommons.org/licenses/by/4.0/).