Article

Catalytic Effects of Different Metal Salts on Cotton Waste Textiles by Pyrolysis: Pyrolysis Behavior and Properties of Activated Carbon

1
School of Resources and Environment, Wuhan Textile University, Wuhan 430073, China
2
Engineering Research Centre for Clean Production of Textile Dyeing and Printing, Ministry of Education, Wuhan Textile University, Wuhan 430073, China
*
Author to whom correspondence should be addressed.
Textiles 2025, 5(1), 4; https://doi.org/10.3390/textiles5010004
Submission received: 10 December 2024 / Revised: 6 January 2025 / Accepted: 8 January 2025 / Published: 10 January 2025

Abstract

:
This study was conducted to explore the catalytic effects of different metal salts on the pyrolysis behavior of cotton waste textiles (CWTs) and the properties of their activated carbons (ACs). The decomposition characteristics of CWTs with Zn, Fe, and Cu salts were studied by thermogravimetric analysis (TGA) to analyze the catalytic effects. The physical and chemical characteristic differences of the ACs were detected with SEM-EDS, BET, FTIR, and XPS. The results show that metal salts reduced the decomposition temperature of the CWTs and improved the pore structures and specific surface areas of the activated carbons (ACs). The ACs produced abundant acidic surface functional groups on their surfaces, which facilitated the selective adsorption of pollutants. This study indicates that cotton waste textile biochar treated with metal salts may be a promising adsorbent for the removal of heavy metals and organic pollutants.

Graphical Abstract

1. Introduction

Waste textiles are mainly waste fabrics such as clothing, blankets, and curtains, as well as fringes, remnants, and other materials produced in the processing of clothes and materials [1]. The global production of waste textiles reaches 40 million tons/year, reaching 20 million tons/year in China [2]. Because of these huge volumes, waste textiles have become a global challenge [3]. It is reported that the amount of discarded textiles reaches 184 billion pounds per year around the world [4]. Unfortunately, nearly 69% of the world’s waste textiles (most of them are waste cotton textiles) end up in landfills, causing serious environmental pollution and a waste of resources [5].
Incineration is a typical recycling treatment of waste textile energy, chemical products, and oil products. But the CO2 and dioxins produced by incineration will cause secondary pollution and a large amount of natural material and recyclable material waste [6,7]. Pyrolysis is an environmentally friendly and effective method of converting organic macromolecules under anaerobic or anoxic conditions into a variety of products, including biochar, bio-oil, and small-molecule gases [8,9]. It has a promising application as an alternative to incineration, which produces less secondary pollution and increases the economic benefits of waste textile recycling [10]. The hydrogen-rich gas products and bio-oil products resulting from pyrolysis can be used as energy sources, and the solid products can be used as adsorbents to removal heavy metals and organic pollutants [11,12]. Nowadays, many studies prepare activated carbons from waste textiles and use them to adsorb heavy metals such as Cr (VI) [5,13], indicating that the activated carbons derived from waste textiles have large specific areas and rich functional groups such as -OH, -COOH, -C=O, and -C-O on their surfaces.
Catalysts are usually introduced to improve the pollutant adsorption capacity of solid products in the pyrolysis process [14,15]. In this regard, heavy metals and their chemical compounds are effective catalysts which are often used for pyrolysis reactions [10,16,17]. Moreover, the catalytic effect of different metal catalysts is different. ZnO has an obvious effect on reducing the release of H2S and improving the kinetic process during the pyrolysis process, and Fe2O3 helps to improve the production of liquid products [10,17,18]. Metal-like catalysts can also significantly affect organic macromolecules’ pyrolysis behavior and product distribution, and even a very small number of metal-like catalysts can also have a significant impact [19]. Emara [20] reported that copper exhibited excellent catalytic activity for the pyrolysis of cellulose and hemicellulose. Zhang Daofang [21] mixed MgCl2 with waste polyester textiles, and the solid product biochar had a high specific surface area compared with pure polyester pyrolysis biochar. In addition, there is a large body of literature reporting the effects of metals or their compounds on the pyrolysis process, product distribution, and properties [22,23,24]. However, the catalytic differences in adsorption properties have not been reported.
The aims of this study were to explore the catalytic effects of different heavy salts on waste cotton textiles, figure out which metal salts have the most significant effect on the adsorption properties of solid pyrolysis products, and detect the selective adsorption of the activated carbons catalyzed by different salts. In this study, cotton waste textiles (CWTs) were used as raw materials. Three typical heavy metal salts (Zn salts, Fe salts, and Cu salts) were added to the CWTs using the immersion method. The catalysis of the heavy metal salts during the pyrolysis process, the adsorption properties of the activated carbons (ACs), and the differences in the catalytic effects of these heavy metal salts were studied. This study provides a new direction for the harmless and reduced treatment of waste cotton textiles and the selective utilization of solid products in the environmental field.

2. Materials and Methods

2.1. Materials

CWTs were obtained from a weaving factory in Nantong, Jiangsu Province, China. ZnCl2, FeCl3, Cu (NO3)2, and HCl were all used as analytical reagents. All the solutions were prepared using deionized water.

2.2. Preparation

Five-gram CWTs were cut into approximately 3 × 3 mm squares and then immersed in 50 ml ZnCl2, FeCl3, and Cu (NO3)2 solutions with a w/w (CWT: ZnCl2/FeCl3/Cu (NO3)2) of 1:2 at 25 °C for 24 h. The mixtures were placed into a drying oven overnight at 60 °C and were named Zn-CWT, Fe-CWT, and Cu-CWT.
The dried samples were placed into quartz boats and pyrolyzed in a tubular furnace with a heating rate of 10 °C/min under a nitrogen atmosphere. The final pyrolysis temperature was 800 °C, and the residence time was set to 1 h. After the pyrolysis reactions were completed, the samples were soaked with 100 mL of 10% v/v HCl for 10 min and then rinsed with deionized water until they were neutral. The pyrolyzed samples were milled into powder and placed in valve bags for subsequent use. The samples were named Zn-AC, Fe-AC, Cu-AC, and AC according to the treatment reagents.

2.3. Characterization

A thermogravimetric–differential thermogravimetric (TG–DTG) analyzer (TG209F1) was used to determine the pyrolysis behaviors of the samples. Fourier transform infrared (FTIR) spectroscopy (Thermo Fischer, Nicolet iS5, USA) and X-ray photoelectron spectroscopy (XPS; ESCALAB 250XI, USA) were used to measure the surface functional group variations before and after catalysis. The surface morphologies and pore structures of the samples were determined using scanning electron microscopy–energy-dispersive spectrometry (SEM–EDS; Zeiss Sigma 300, Germany). The Brunauer–Emmett–Teller method (BET; ASAP 2460, USA) was used to determine the specific surface areas and aperture distributions of the samples, which were measured after the samples were completely dried and degassed at 200 °C for 8 h.

3. Results and Discussion

3.1. Pyrolysis Behavior
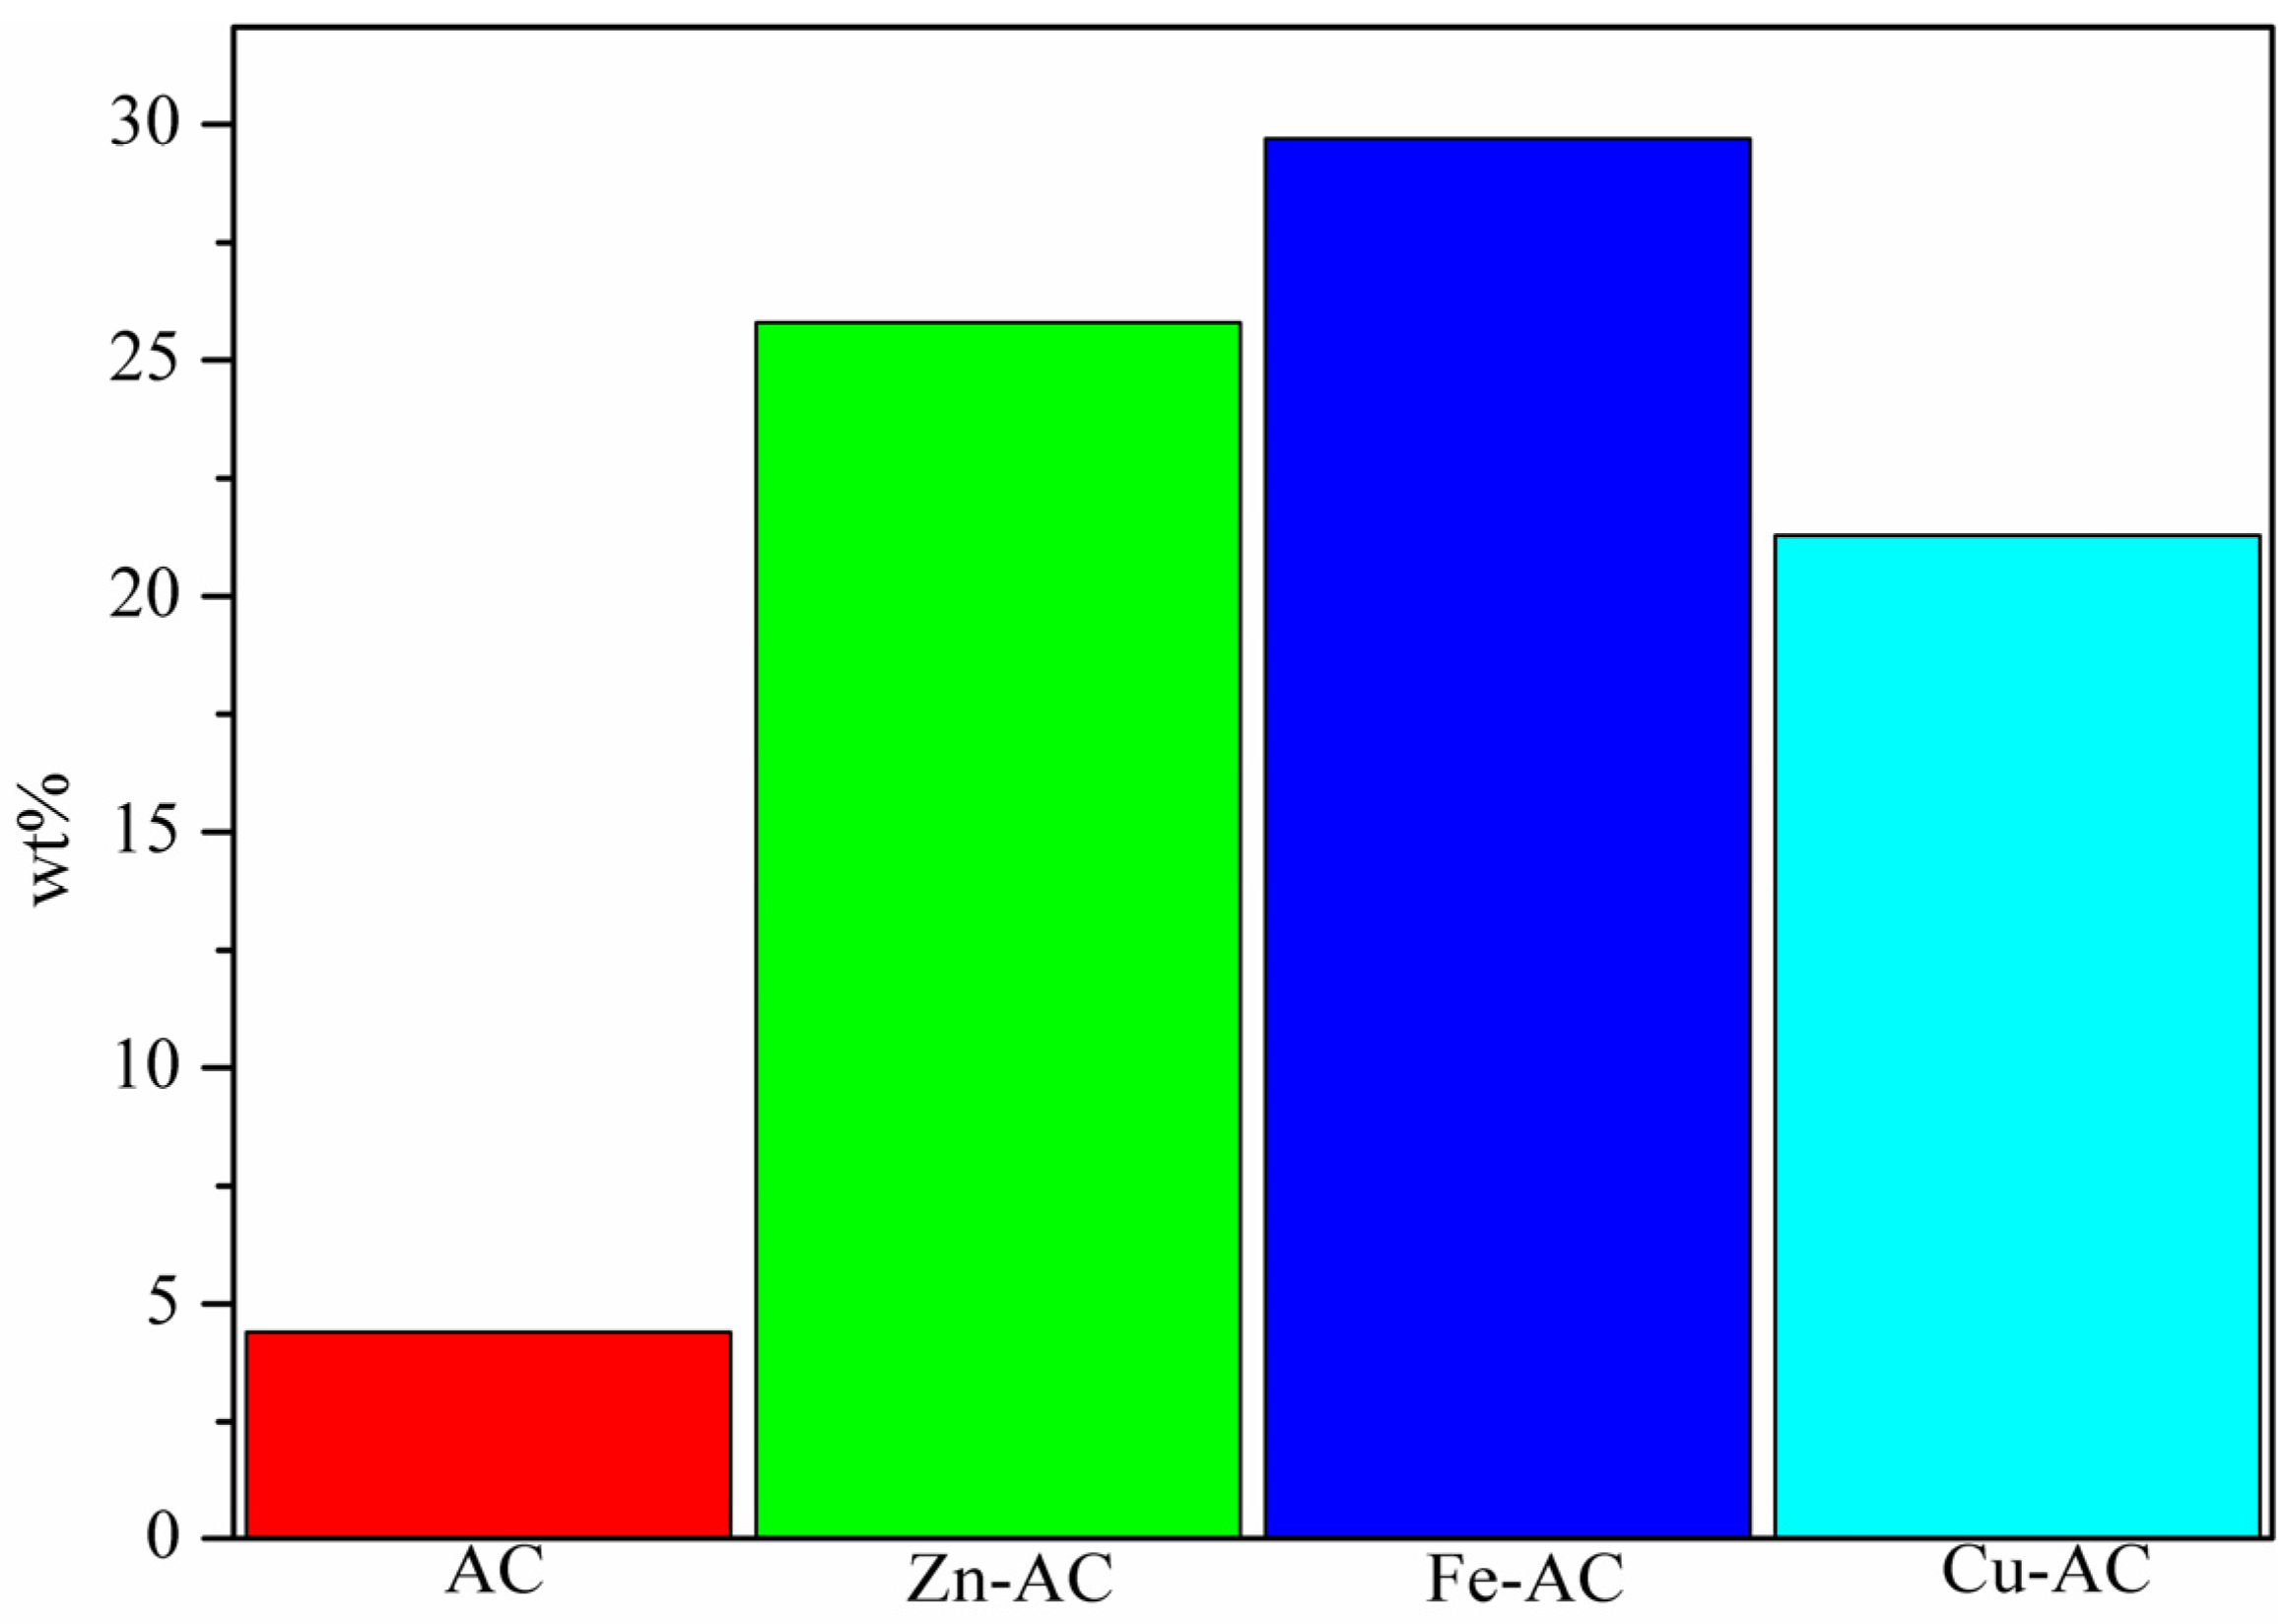
3.1.1. AC Yield

The yields of the four activated carbons are shown in Figure 1 (the experimental results were repeated three times to take the average value to reduce the error), and there is a significant difference in the yields. The yields of AC, Zn-AC, Fe-AC, and Cu-AC were 4.4%, 25.8%, 29.7%, and 21.2%, respectively, indicating that the catalysis of metal salts promotes the yield of solid products. This is because some of the metal ions interact with cellulose or interproducts in cotton to produce stable compounds, and some of the metals produce metal inorganic compounds, distributed on the surface of the solid products [25]. The metal components increase the weight of solid products. The other reason is that the metal ions promote the crosslinking reaction of organic molecules and transform the liquid-phase products into solid-phase products under these pyrolysis conditions [26].

3.1.2. Pyrolysis Process

TG analysis was applied to discuss the pyrolysis process of the CWTs with different metal salts. Moreover, the rule of possible pore development was preliminarily expounded. Figure 2 shows the TG and DTG curves for CWT, Zn-CWT, Fe-CWT, and Cu-CWT, respectively. The mass loss process of CWT comprised three stages, as shown in Figure 2a. The first stage (20–290 °C) was the main moisture removal, where the weight loss rate was 10%. The main weight loss occurred in the second stage (290–400 °C), with a maximum mass loss of 72% and maximum mass loss rate of 18 %/min at 360 °C; this was mainly due to the decomposition of cellulose with the release of volatile compounds [27]. In the third stage (400–800 °C), the mass loss was stable because of the stability of the solid-phase carbide [28].
For Zn-CWT (Figure 2b), the mass loss process mainly included four stages. The first stage (20–189 °C) was mainly the evaporation of water from the CWTs and the dehydration effect of ZnCl2, with a mass loss rate of 10%. The second stage (189–244 °C) was attributed to the catalytic decomposition of cellulose, with a mass loss rate of 27%, and the presence of ZnCl2 decreased the decomposition temperature. Meanwhile, ZnCl2 activation led to the breakage of the lateral bonds in the cellulose molecules and the occurrence of a swelling phenomenon, which promoted the development of pore structures [29]. In the third stage (244–562 °C), the CWTs were continuously carbonized and aromatized, and ZnCl2 vaporized and decomposed in this stage, with a total mass loss rate of 30%. The carbon matrix was rapidly ablated and restructured, along with the development of pores upon the formation of interspaces between carbon layers and the release of low-molecular-mass volatile compounds. In the fourth stage (562–800 °C), the CWTs were further carbonized into a stable structure, along with the release of some volatiles, and the mass loss rate was 7% [30].
Fe-CWT had a complex pyrolysis process (Figure 2c), divided into three stages. The first stage (20–227 °C) included the evaporation of water. The addition of FeCl3 promoted cellulose hydrolysis and lowered the temperature of the initial reaction and the maximum weight loss peak. The reason is that Fe3+ induces the hydronium ions, which attack the glycosidic bonds of cellulose, and promotes the transfer of the glycosidic bonds of cellulose into numerous glucose molecules as the precursor of a carbon matrix. It also promotes the decomposition of cellulose into small molecular volatiles such as CO, CO2, H2O(g), and HCl rather than macromolecular volatiles in the temperature stage [31]. The release of various volatiles led to the development of abundant micropores through the continuous erosion of FeCl3 to CWT, with a mass loss rate of 37%. In the second stage (227–630 °C), the addition of FeCl3 not only further promoted the thermal cleavage of cellulose but also reshaped and altered the carbon structure. The newly formed iron oxides catalyzed the formation of micropore structures, whereas Fe2O3 and Fe3O4 began to deposit on the surface and were gradually wrapped by hydrocarbons, which was beneficial to mesoporous development after acid pickling [32]. The mass loss rate was 27% in this stage. The third stage (630–800 °C) only caused minimal mass loss (6%), which might be attributed to the dehydrogenation of fixed carbon to generate a relatively stable structure. Also, the Fe species might have been reduced to zero-valent [33]. The reactions of FeCl3 in different stages are as follows:
First stage:
F e C l 3 + 2 H 2 O F e O C l H 2 O + 2 H C l g F e O O H + 3 H C l ( g )
Second stage:
2 F e O O H F e 2 O 3 + H 2 O ( g )
6 F e 2 O 3 + C 4 F e 3 O 4 + C O 2
Third stage:
2 F e 2 O 3 + 3 C 4 F e + 3 C O 2
F e 3 O 4 + 2 C 3 F e + 2 C O 2
F e 3 O 4 + 4 C 3 F e + 4 C O
There were also three stages in the pyrolysis process of Cu-CWT (Figure 2d). In the first stage (20–300 °C), the main mass loss was attributed to water evaporation and the hydrolysis of cellulose catalyzed by Cu2+. The mass loss rate in this stage was 36%. The second stage (300–350 °C) had the most intense reaction. Cellulose was quickly thermally decomposed in this temperature range, accompanied by the release of numerous volatile substances. Cu2+ sped up the decomposition of cellulose and advanced the temperature to the maximum. The mass loss rate was 33% in this stage. Cu salt was decomposed by heat in this temperature range. The decomposition reaction is shown in Equations (7) and (8) [34]. In the third stage (350–800 °C), the slow decomposition of the residues occurred after about 350 °C, with a mass loss rate of 10%.
14 C u ( N O 3 ) 2 · 3 H 2 O     4 C u N O 3 2 · 2.5 C u O H 2 + 20 H N O 3 + 22 H 2 O
2 C u N O 3 2 · 2.5 C u O H 2   7 C u O + 4 N O 2 + 5 H 2 O + O 2
As the DTG curves show, the addition of metal salts inevitably changed the pyrolysis process of the CWTs. The maximum weight loss temperature changed from 359 °C for the CWT to 219 °C for Cu-CWT, 141 °C for Fe-CWT, and 335 °C for Zn-CWT, indicating that the metal salts reduced the temperature requirement for CWT decomposition, in which the effect of Fe3+ was the most significant. Also, the pore formation of these porous carbons was closely related to their unique pyrolysis processes.

3.2. AC Characteristics
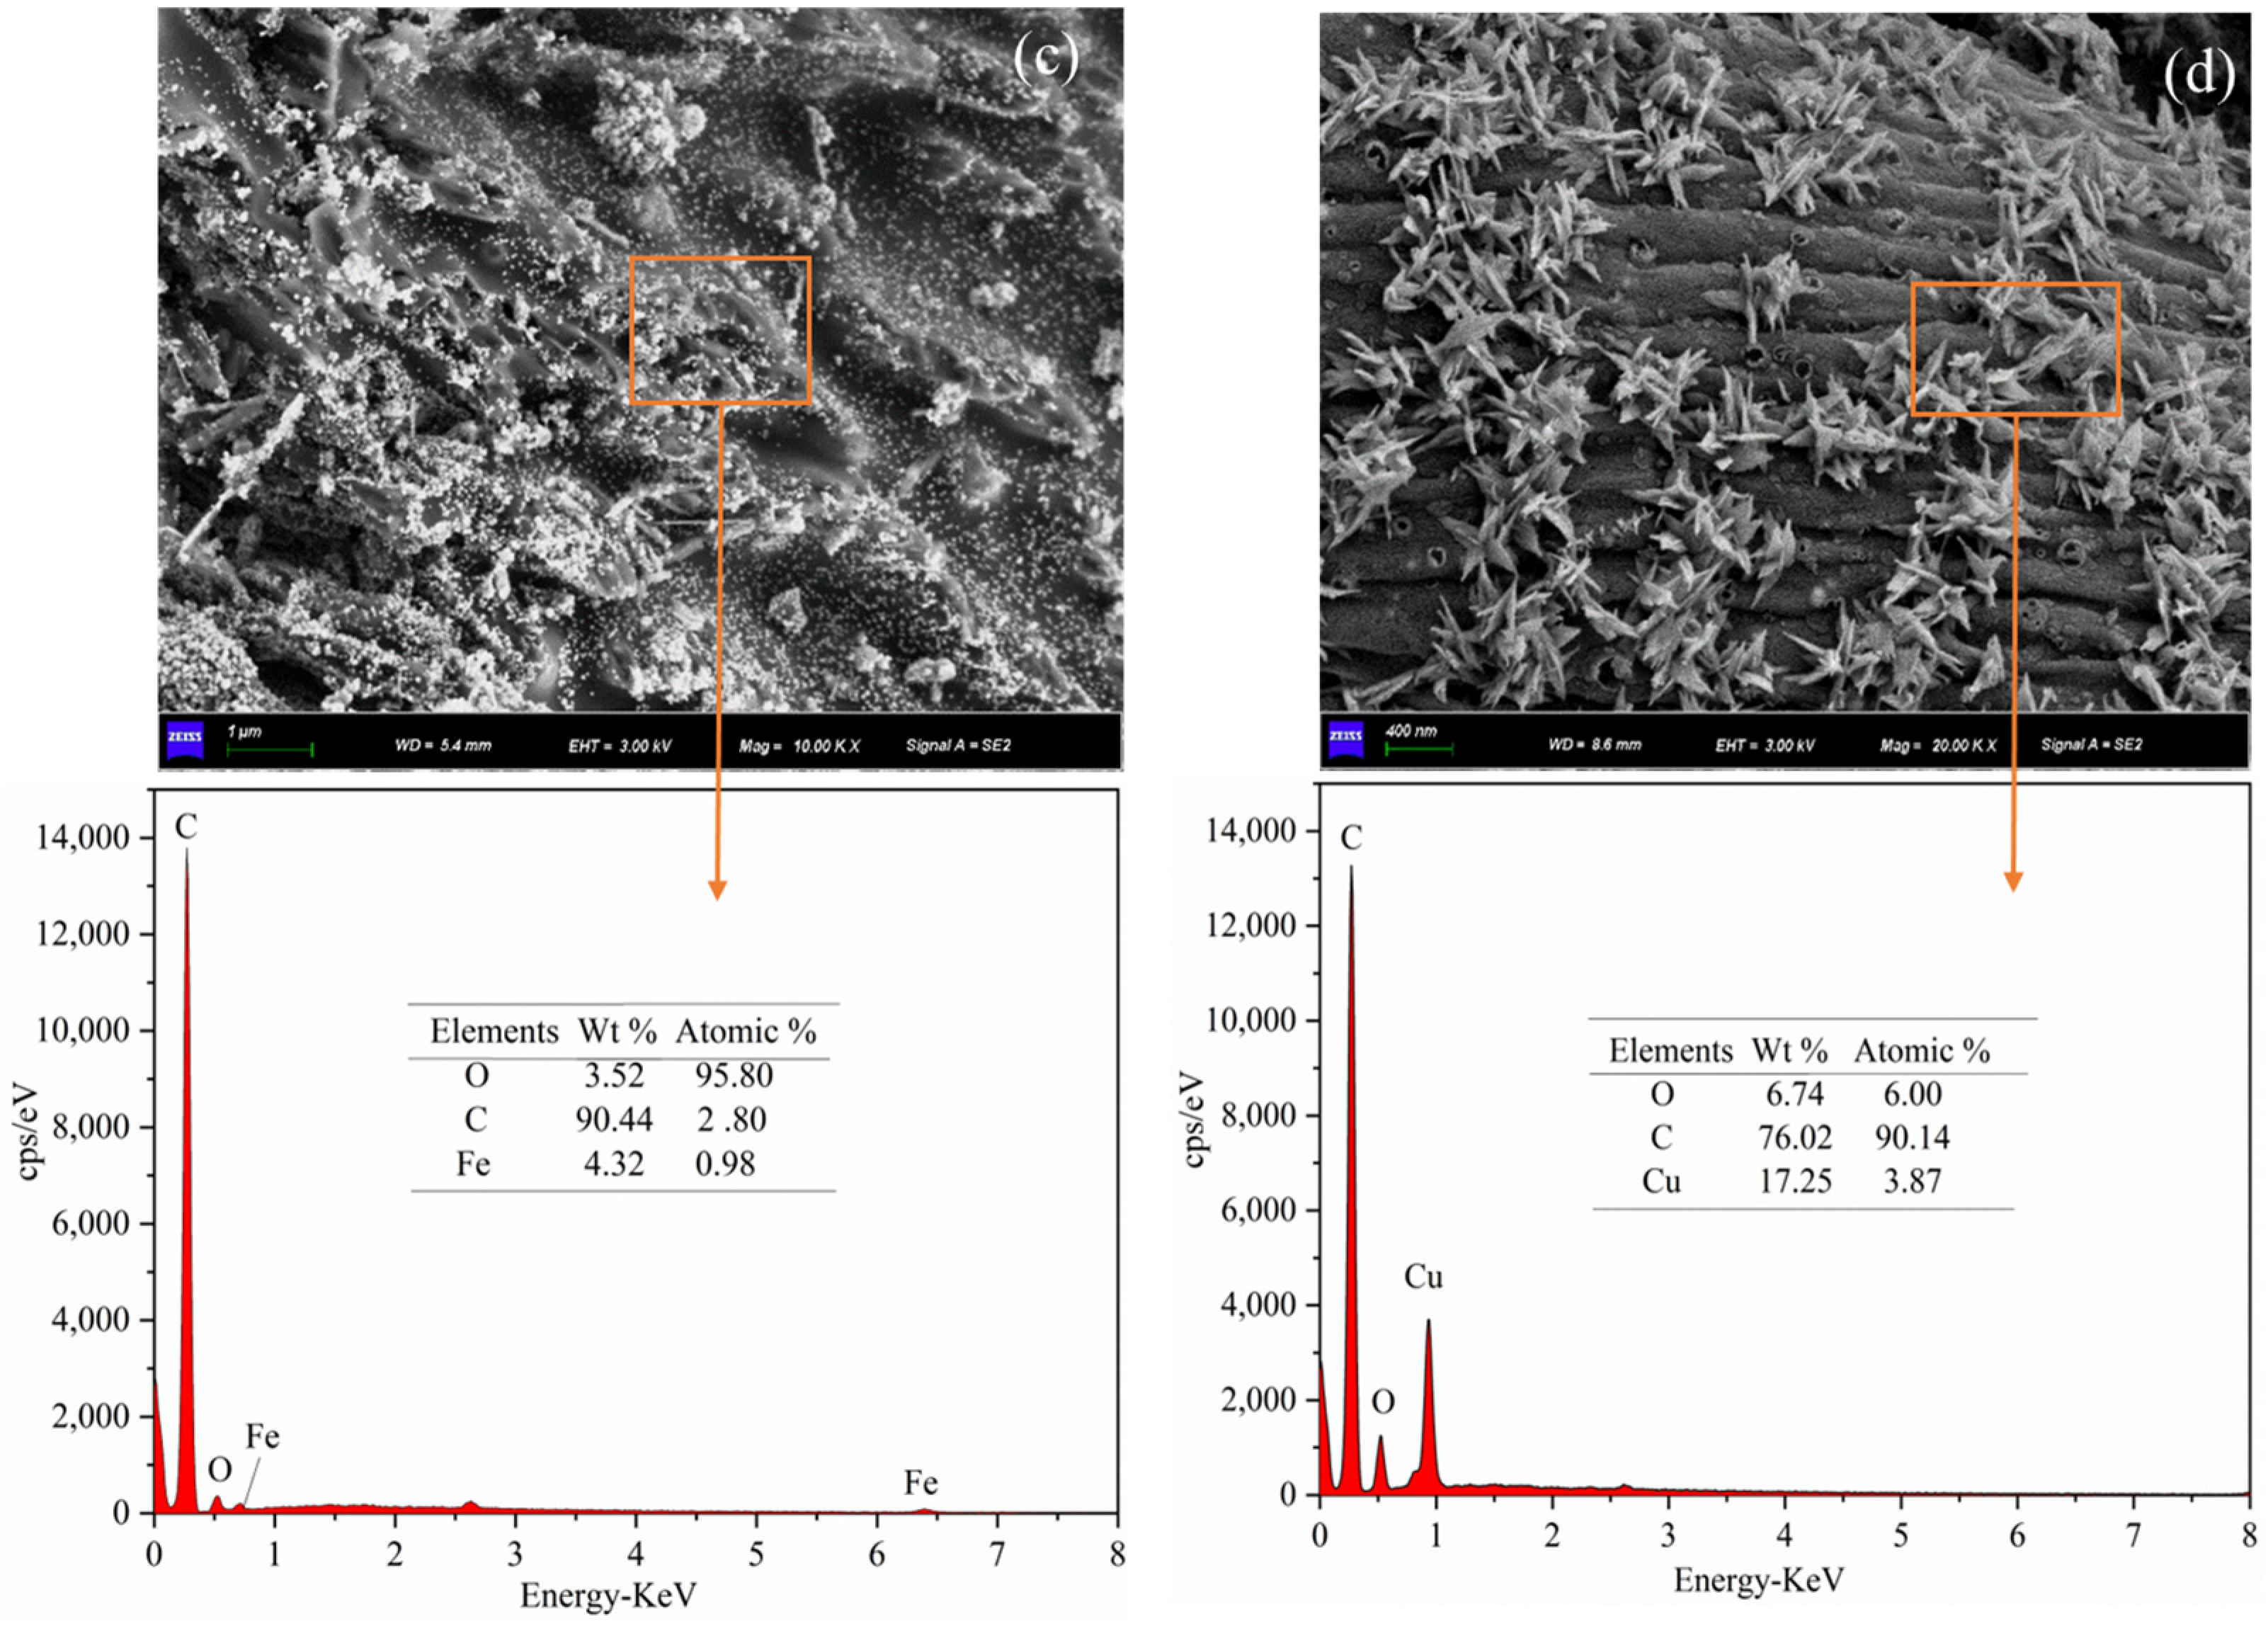
3.2.1. Morphology

SEM was used to detect the surface morphology and aperture distribution characteristics of the ACs (Figure 3). The surfaces of the ACs were relatively smooth and uniform, and they had no significant pore structures. Meanwhile, after the addition of the metal salts, the surfaces of the ACs became rough and uneven, with plenty of pore structures, especially on the surfaces of Zn-AC and Cu-AC. In addition, Cu-AC and Fe-AC had many particles on their surfaces, whereas there were a few particles on the surface of Zn-AC. This was because the Zn-related particles easily evaporated or dissolved in the hydrochloric acid solution, whereas the Cu- and Fe-related particles were not relatively easily dissolved in the hydrochloric acid solution [35]. The dissolution of the Zn-related particles caused the most pores on Zn-AC.
In the EDS spectra of the four samples shown in Figure 3, the components of AC were mainly C and O, with wt% values of 96.63% and 3.37%, respectively. Zn-AC also mainly consisted of C and O, with wt% values of 89.85% and 10.15%, respectively. No Zn was observed therein, further indicating that ZnCl2 evaporated in the pyrolysis process or dissolved in the HCl solution during the washing period. However, the wt% value of O increased and that of C decreased after activation by ZnCl2. This illustrates that ZnCl2 changed the path of the cellulose decomposition, leading to more carbon-contained gas or oil release [35]. The main elements that Fe-AC contained were C, O, and Fe, with wt% values of 95.80%, 2.80%, and 0.98%, respectively. This shows that Fe catalyzed the pyrolysis reaction process, part of which was still deposited on the surface of the carbon. The components of Cu-AC were C, O, and Cu, with Cu accounting for a large proportion. This is in accordance with what the SEM image shows.

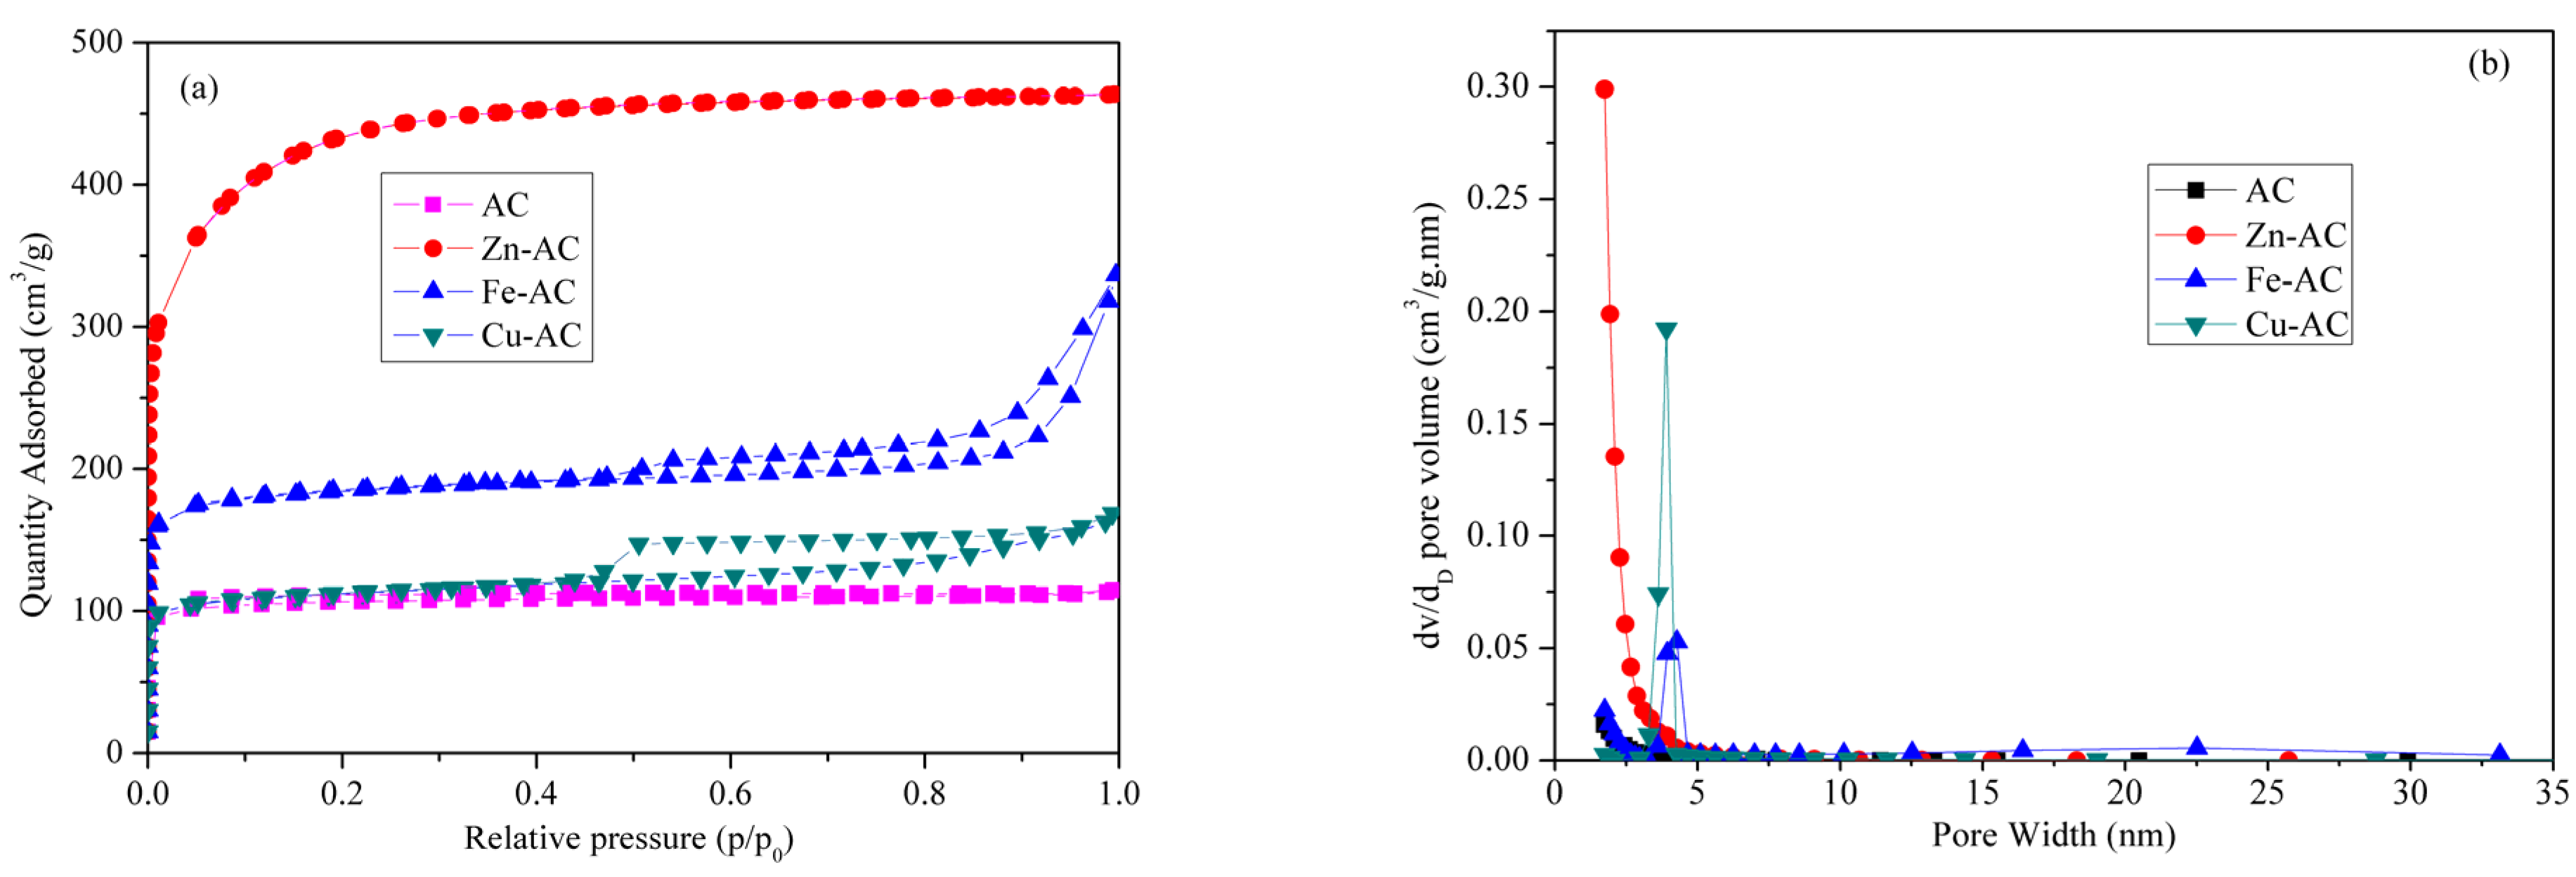
3.2.2. Specific Surface Area and Aperture Distribution

The BET method was used to detect the specific surface areas and aperture distributions of the samples. As Table 1 shows, the specific surface areas of AC, Zn-AC, Fe-AC, and Cu-AC were 422.95, 1621.53, 436.58, and 712.05 m2/g, respectively, showing that the catalysis of metal salts increased the specific surface areas of the samples, and ZnCl2 had the best catalytic effect in this aspect. In addition, the micropore specific surface areas represented most of the proportion, accounting for 90.46%, 64.75%, 84.77%, and 80.73%, respectively. This indicates that the main pore structures of the four samples were micropores, which are generated by the gas release during the pyrolysis process. AC (without addition) had the greatest proportion of micropores because nearly all Zn-related, partly Fe-related, and Cu-related particles dissolved in the hydrochloric acid solution; the space these particles occupied appeared as pores after they dissolved, mainly as mesopores and macropores. Thereby, the more the particles dissolved, the greater the decrease in microporosity. The total pore volumes (Vt) of AC, Zn-AC, Fe-AC, and Cu-AC were 0.17, 0.72, 0.39, and 0.24, respectively, corresponding to micropore volumes (Vmic) of 0.15, 0.42, 0.23, and 0.13, respectively. The range of these values is consistent with that of the specific surface areas, with higher Vt values offering more adsorption sites for the target pollutant. The average pore diameters (Dp) of the four materials were 1.63, 1.76, 2.18, and 2.18 nm, respectively. The diameters of most heavy metals are lower than these sizes. Thus, the ACs may act as adsorbents for the removal of heavy metals by adsorbing them into the pore structures.
The N2 adsorption/desorption isotherms and the corresponding pore distributions of all samples are shown in Figure 4. Figure 4a shows that AC and Zn-AC both had type I isotherms with no hysteresis, which is often considered a marker of adsorption in micropores or mesopores with sizes close to those of micropores [36]. The combination of the values of Smic/SBET further indicated that the pore structure on AC was mainly microporous, whereas that on Zn-AC was mainly microporous and mesoporous, with the mesopores having sizes close to those of the micropores. Meanwhile, Fe-AC had a type II isotherm with H4 hysteresis, indicating that Fe-AC had a mixture of micropores and mesopores; these pores were mainly narrow slit pores. Cu-AC had a type IV isotherm with H3 hysteresis, suggesting slit-shaped pores on the surface [37]. The steep uptake of N2 mainly occurred at 0.1 and 0.8, implying the pores were mainly micropores and large mesopores. The pore size distributions of the different samples are depicted in Figure 4b. AC showed a low porosity, which was mainly associated with microporous structures. After the addition of metal salts, the porosity of the ACs apparently increased. The order of the porosity of the three ACs is as follows: Zn-AC > Cu-AC > Fe-AC. Zn-AC displayed rich micropores and narrow 2 to 3 nm mesopores, and Fe-AC and Cu-AC displayed narrow 3 to 5 nm mesopores.

3.2.3. Surface Functional Groups

FTIR spectra were used to detect changes in the surface functional groups of the samples before and after catalysis. As shown in Figure 5a, the peak at 3448 cm−1 could be assigned to the –OH stretching vibration of carboxyl and phenol [38]. The band near 2920 cm−1 could be attributed to the stretching vibration of C–H in –CH–, –CH2, and –CH3 [39]. The peaks of AC and Zn-AC in this band were very weak, indicating that they had fewer C–H groups on their surfaces, with higher degrees of carbonization and aromatic condensation [40]. Fe3+ and Cu2+ were favorable for the formation of C–H during pyrolysis. The peak at 1632 cm−1 could be attributed to the C–O of ketone, aldehyde, and carboxyl [41]. The band at around 1100 cm−1 could be attributed to the C=O and C–C of the alcohol, phenol, and carboxyl groups [42]. The intensity of the band in this area was the strongest for Fe-AC mostly because of carboxyls and phenols. The bands located at around 600–1000 cm−1 could be attributed to the alkenes, aromatic ring structures, or inorganic mineral components on the surface of the carbons [43]. Peaks near 586 cm−1 for Fe-AC and near 601 cm−1 for Cu-AC appeared, which could be attributed to iron oxide and copper oxide, respectively. This shows that there were iron oxides on the surface of Fe-AC and copper oxides on the surface of Cu-AC.

3.2.4. Surface Molecular Structures and Atomic Valence States

The XPS spectra of the samples with different metal salts were investigated in more detail to further explore the differences in their functional groups. The total survey spectrum (Figure 5b) shows that the main elements of AC were C and O, with atomic percentage values of 92.39% and 7.61%, respectively. After catalysis, Fe-AC had the elements C, O, and Fe, and the atomic percentage values were 86.07%, 10.80%, and 3.13%, respectively. Cu-AC had the elements C, O, and Cu, and the atomic percentage values were 79.17%, 14.04%, and 6.80%, respectively. This indicates that Cu2+ and Fe3+ interacted with the CWTs during the pyrolysis process, and Fe and Cu compounds attached to the surfaces of Fe-AC and Cu-AC, respectively. Besides C and O, with atomic percentage values of 93.93% and 6.06%, respectively, no Zn was observed in Zn-AC, further indicating that ZnCl2 evaporated during the pyrolysis process or Zn compounds formed during the pyrolysis process totally dissolved in the hydrochloric acid solution.
The C1s and O1s peaks of AC and Zn-AC; C1s, O1s, and Fe2p peaks of Fe-AC; and C1s, O1s, and Cu2p peaks of Cu-AC from the XPS spectra were used to quantitatively analyze the evolution of the elements on the surfaces of the four samples to better understand the role of activating reagents in the pyrolysis process. As shown in Figure 5c, the C1s peaks of AC, Zn-AC, Fe-AC, and Cu-AC were divided into three peaks, corresponding to C–C, C–O, and C=O, with the proportions 58.75%, 32.12%, and 9.13% for AC; 58.69%, 30.70%, and 10.61% for Zn-AC; 61.36%, 29.80%, and 8.83% for Fe-AC; and 55.87%, 34.69%, and 9.44% for Cu-AC. These values show that the constitution of the carbon-containing functional groups had no obvious changes after activation.
As shown in Figure 5d, the O1s peaks of AC and Zn-AC were divided into two single peaks, corresponding to C–O–H/C–O–C and C=O. The O1s peaks of Fe-AC were divided into three single peaks, corresponding to C–O–H/C–O–C, C=O, and Fe3O4. The O1s peaks of Cu-AC were also divided into three single peaks, corresponding to C–O–H/C–O–C, C=O, and CuO. The proportion of the oxygen-containing functional groups varied with different metal salts, which caused the pollutant adsorption capacity differences of the four samples. As shown in Figure 5e, the Fe2p peaks of Fe-AC were divided into two doublet peaks, showing that Fe on the surface of AC had two species. The peaks at 717.49 and 724.88 eV were attributed to the characteristic Fe (III) species, and the peaks at 711.78 and 730.29 eV corresponded to Fe (II) species, confirming the uniformly dispersed Fe3O4 on the surface of Fe-AC.
On the basis of the FTIR and XPS analyses, it is clear that abundant acidic surface functional groups were generated during the pyrolysis of the CWTs in the presence of active reagents, which are favorable for the selective adsorption of pollutants. The Fe3O4 on the surface of Fe-AC and CuO on the surface of Cu-AC also added adsorption sites for pollutant removal.

4. Conclusions

This study discussed the effects of the catalysis of Zn, Fe, and Cu salts on CWTs. The pyrolysis properties of raw materials with different metal salts were studied, and the surface morphologies, pore structures, and surface functional groups of the ACs (Zn-AC, Fe-AC, and Cu-AC) were confirmed. (1) The addition of the three metal salts reduced the decomposition temperature of the CWTs, where the effect of Fe3+ was the most significant. (2) The ACs presented well-developed pore structures and high specific surface areas: Zn-AC mainly possessed micropores and narrow mesopores, Fe-AC and Cu-AC possessed micropores and mesopores, and Zn-AC had the greatest surface area, reaching 1621.53 m2/g. (3) Abundant acidic surface functional groups (C–O–H/C–O–C and C=O) were generated on the surfaces of the ACs, which were favorable for the selective adsorption of pollutants. Fe-AC had the most C=O groups on its surface. Fe3O4 was generated on the surface of Fe-AC, and CuO was generated on the surface of Cu-AC, which increased the number of adsorption sites for pollutant removal.

Author Contributions

Conceptualization, Y.Z. and X.Z.; methodology, Y.Z.; software, Y.Z.; validation, X.Z.; formal analysis, X.Z.; investigation, X.Z.; resources, Y.Z.; data curation, Y.Z. and S.C.; writing—original draft preparation, Y.Z.; writing—review and editing, Y.Z. and S.C.; visualization, Y.Z.; supervision, S.C.; project administration, S.C.; funding acquisition, S.C. All authors have read and agreed to the published version of the manuscript.

Funding

This research was supported by the National Natural Science Foundation of China, grant number 52100161.

Data Availability Statement

The datasets used and/or analyzed during the current study are available from the corresponding author upon reasonable request.

Conflicts of Interest

The authors declare no conflicts of interest.

References

  1. Pensupa, N.; Leu, S.Y.; Hu, Y.Z.; Du, C.Y.; Liu, H.; Jing, H.D.; Wang, H.M.; Lin, C.S.K. Recent Trends in Sustainable Textile Waste Recycling Methods: Current Situation and Future Prospects. Top. Curr. Chem. 2017, 375, 76. [Google Scholar] [CrossRef] [PubMed]
  2. Tian, X.; Ma, H.R.; Li, Z.; Yan, S.C.; Ma, L.; Yu, F.; Wang, G.; Guo, X.H.; Ma, Y.Q.; Wong, C.P. Flute type micropores activated carbon from cotton stalk for high performance supercapacitors. J. Power Sources 2017, 359, 88–96. [Google Scholar] [CrossRef]
  3. Lopatina, A.; Anugwom, I.; Blot, H.; Conde, A.S.; Mänttäri, M.; Kallioinen, M. Re-use of waste cotton textile as an ultrafiltration membrane. J. Environ. Chem. Eng. 2021, 9, 105705. [Google Scholar] [CrossRef]
  4. DeVoy, J.E.; Congiusta, E.; Lundberg, D.J.; Findeisen, S.; Bhattacharya, S. Post-Consumer textile waste and disposal: Differences by socioeconomic, demographic, and retail factors. Waste Manag. 2021, 136, 303–309. [Google Scholar] [CrossRef]
  5. Rago, Y.P.; Surroop, D.; Mohee, R. Torrefaction of textile waste for production of energy-dense biochar using mass loss as a synthetic indicator. J. Environ. Chem. Eng. 2018, 6, 811–822. [Google Scholar] [CrossRef]
  6. Bert, V.; Allemon, J.; Sajet, P.; Dieu, S.; Papin, A.; Collet, S.; Gaucher, R.; Chalot, M.; Michiels, B.; Raventos, C. Torrefaction and pyrolysis of metal-enriched poplars from phytotechnologies: Effect of temperature and biomass chlorine content on metal distribution in end-products and valorization options. Biomass Bioenergy 2017, 96, 1–11. [Google Scholar] [CrossRef]
  7. Yuan, H.R.; Lu, T.; Zhao, D.D.; Huang, H.Y.; Noriyuki, K.; Chen, Y. Influence of temperature on product distribution and biochar properties by municipal sludge pyrolysis. J. Mater. Cycles Waste Manag. 2013, 15, 357–361. [Google Scholar] [CrossRef]
  8. Du, Y.F.; Lu, T.Y.; Meng, Y.; Han, S.Y.; Jiang, J.G. Pyrolysis characteristics of excavated waste and generation mechanism of gas products. J. Clean. Prod. 2022, 370, 133489. [Google Scholar] [CrossRef]
  9. Jerzak, W.; Acha, E.; Li, B. Comprehensive Review of Biomass Pyrolysis: Conventional and Advanced Technologies, Reactor Designs, Product Compositions and Yields, and Techno-Economic Analysis. Energies 2024, 17, 5082. [Google Scholar] [CrossRef]
  10. Fang, S.W.; Yu, Z.S.; Lin, Y.; Lin, Y.S.; Fan, Y.L.; Liao, Y.F.; Ma, X.Q. Effects of additives on the co-pyrolysis of municipal solid waste and paper sludge by using thermogravimetric analysis. Bioresour. Technol. 2016, 209, 265–272. [Google Scholar] [CrossRef] [PubMed]
  11. Kwon, D.; Yi, S.; Jung, S.; Kwon, E.E.; Eilhann, E. Valorization of synthetic textile waste using CO2 as a raw material in the catalytic pyrolysis process. Environ. Pollut. 2021, 268, 115916. [Google Scholar] [CrossRef] [PubMed]
  12. Wu, Y.; Wen, C.; Chen, X.P.; Jiang, G.D.; Liu, G.N.; Liu, D. Catalytic pyrolysis and gasification of waste textile under carbon dioxide atmosphere with composite Zn-Fe catalyst. Fuel Process. Technol. 2017, 166, 115–123. [Google Scholar] [CrossRef]
  13. Hanoğlu, A.; Çay, A.; Yanık, J. Production of biochars from textile fibres through torrefaction and their characterization. Energy 2019, 166, 664–673. [Google Scholar] [CrossRef]
  14. Tan, M.T.; Li, Y.Q.; Chi, D.C.; Wu, Q. Efficient removal of ammonium in aqueous solution by ultrasonic magniesium-modified biochar. Chem. Eng. J. 2023, 461, 142972. [Google Scholar] [CrossRef]
  15. Shan, Y.; Yang, W.; Li, Y.; Liu, Y.X.; Pan, J.F. Preparation of microwave-activated magnetic bio-char adsorbent and study on removal of elemental mercury from flue gas. Sci. Total Environ. 2019, 697, 134049. [Google Scholar] [CrossRef]
  16. Lee, C.G.; Cho, Y.J.; Song, P.S.; Kang, Y.; Kim, J.S.; Choi, M.J. Effects of temperature distribution on the catalytic pyrolysis of polystyrene waste in a swirling fluidized-bed reactor. Catal. Today 2003, 79–80, 453–464. [Google Scholar] [CrossRef]
  17. Pinto, F.; Lopes, H.; Andre, R.N. Effect of catalysts in the quality of syngas and by-products obtained by co-gasification of coal and wastes. 2: Heavy metals, sulphur and halogen compounds abatement. Fuel 2007, 86, 2052–2063. [Google Scholar] [CrossRef]
  18. Li, S.H.; Luo, C.; Yan, F.; Yang, Y.; Guo, B.; Wang, L.; Xu, S.Q.; Wu, F.; Ji, P.H. Remediation of Pb(II) and Cd(II) in polluted waters with calcium thioglycolate-modified straw biochar. Environ. Pollut. 2023, 338, 122638. [Google Scholar] [CrossRef]
  19. Xia, Z.J.; Liu, H.Y.; Lu, H.F.; Zhang, Z.K.; Chen, Y.F. High Selectivity of Cyclohexane Dehydrogenation for H2 Evolution Over Cu/SBA-15 Catalyst. Catal. Lett. 2017, 147, 1295–1302. [Google Scholar] [CrossRef]
  20. Emara, M.M.; Ali, S.H.; Kassem, T.S.E.; Van Patten, P.G. Catalysis of sugarcane-bagasse pyrolysis by Co, Ni, and Cu single and mixed oxide nanocomposites. J. Nanoparticle Res. Interdiscip. Forum Nanoscale Sci. Technol. 2020, 22, 31. [Google Scholar] [CrossRef]
  21. Yuan, Z.H.; Xu, Z.H.; Zhang, D.F.; Chen, W.F.; Zhang, T.Q.; Huang, Y.X.; Gu, L.; Deng, H.X.; Tian, D.Q. Box-Behnken design approach towardsoptimization of activated carbon synthesized by co-pyrolysis of waste polyester textiles and MgCl2. Appl. Surf. Sci. 2018, 427, 340–348. [Google Scholar] [CrossRef]
  22. Kim, S.; Park, C.Y.; Lee, J. Reduction of polycyclic compounds and biphenyls generated by pyrolysis of industrial plastic waste by using supported metal catalysts: A case study of polyethylene terephthalate treatment. J. Hazard. Mater. 2020, 392, 122464. [Google Scholar] [CrossRef] [PubMed]
  23. Lv, Q.W.; Wang, L.; Jiang, J.J.; Ma, S.D.; Liu, L.Y.; Zhou, Z.L.; Liu, L.; Wang, X.; Bai, J. Catalytic pyrolysis of oil-based drill cuttings over metal oxides: The product properties and environmental risk assessment of heavy metals in char. Process Saf. Environ. Prot. 2022, 159, 354–361. [Google Scholar] [CrossRef]
  24. Zhou, L.; Zhong, M.Q.; Wang, T.; Liu, J.X.; Mei, M.; Chen, S.; Li, J.P. Study on the Pyrolysis and Adsorption Behavior of Activated Carbon Derived from Waste Polyester Textiles with Different Metal Salts. Materials 2023, 15, 7112. [Google Scholar] [CrossRef]
  25. Chen, H.H.; Zhang, H.P.; Yan, Y. Gradient porous Co–Cu–Mn mixed oxides modified ZSM-5 membranes as high efficiency catalyst for the catalytic oxidation of isopropanol. Chem. Eng. J. 2014, 111, 313–323. [Google Scholar] [CrossRef]
  26. Feng, D.D.; Guo, D.W.; Shang, Q.; Zhao, Y.J.; Zhang, L.Y.; Guo, X.; Cheng, J.; Chang, G.Z.; Guo, Q.J.; Sun, S.Z. Mechanism of biochar-gas-tar-soot formation during pyrolysis of different biomass feedstocks: Effect of inherent metal species. Fuel 2021, 293, 120409. [Google Scholar] [CrossRef]
  27. Rufford, T.E.; Hulicova-Jurcakova, D.; Zhu, Z.H.; Lu, G.Q. A comparative study of chemical treatment by FeCl3, MgCl2, and ZnCl2 on microstructure, surface chemistry, and double-layercapacitance of carbons from waste biomass. J. Mater. Res. 2010, 25, 1451–1459. [Google Scholar] [CrossRef]
  28. Shimada, N.; Kawamoto, H.; Saka, S. Different action of alkali/alkaline earth metal chlorides on cellulose pyrolysis. J. Anal. Appl. Pyrolysis 2008, 81, 80–87. [Google Scholar] [CrossRef]
  29. Tazibet, S.; Velasco, L.F.; Lodewyckx, P.; M’Hamed, D.A.; Boucheffa, Y. Systematic study of the role played by ZnCl2 during the carbonization of a chemically activated carbon by TG–MS and DSC. J. Therm. Anal. Calorimetrt 2018, 134, 1395–1404. [Google Scholar] [CrossRef]
  30. Xing, X.J.; Jiang, W.; Li, S.; Zhang, X.W.; Wang, W.Q. Preparation and analysis of straw activated carbon synergetic catalyzed by ZnCl2-H3PO4 through hydrothermal carbonization combined with ultrasonic assisted immersion pyrolysis. Waste Manag. 2019, 89, 64–72. [Google Scholar] [CrossRef] [PubMed]
  31. Xu, Z.H.; Sun, Z.H.; Zhou, Y.W.; Chen, W.F.; Zhang, T.Q.; Huang, Y.X.; Zhang, D.F. Insights into the pyrolysis behavior and adsorption properties of activated carbon from waste cotton textiles by FeCl3-activation. Colloids Surf. A Physicochem. Eng. Asp. 2019, 582, 123934. [Google Scholar] [CrossRef]
  32. Zhu, X.D.; Liu, Y.C.; Luo, G.; Qian, F.; Zhang, S.C.; Chen, J.M. Facile Fabrication of Magnetic Carbon Composites from Hydrochar via Simultaneous Activation and Magnetization for Triclosan Adsorption. Environ. Sci. Technol. 2014, 48, 5840–5848. [Google Scholar] [CrossRef]
  33. Solak, A.; Rutkowski, P. Bio-oil production by fast pyrolysis of cellulose/polyethylene mixtures in the presence of metal chloride. J. Mater. Cycles Waste Manag. 2014, 16, 491–499. [Google Scholar] [CrossRef]
  34. Terakado, O.; Amano, A.; Hirasawa, M. Explosive degradation of woody biomass under the presence of metal nitrates. J. Anal. Appl. Pyrolysis 2009, 85, 231–236. [Google Scholar] [CrossRef]
  35. Zhong, M.Q.; Chen, S.; Wang, T.; Liu, J.X.; Mei, M.; Li, J.P. Co-pyrolysis of polyester and cotton via thermogravimetric analysis and adsorption mechanism of Cr(VI) removal by carbon in aqueous solution. J. Mol. Liq. 2022, 354, 118902. [Google Scholar] [CrossRef]
  36. Li, Z.T.; Liu, D.M.; Cai, Y.D.; Wang, Y.P.; Teng, J. Adsorption pore structure and its fractal characteristics of coals by N2 adsorption/desorption and FESEM image analyses. Fuel 2019, 257, 116031. [Google Scholar] [CrossRef]
  37. Mel, M.S. Application of the simple Bayesian classifier for the N2 (77 K) adsorption/desorption hysteresis loop recognition. Adsorption 2023, 29, 199–208. [Google Scholar] [CrossRef]
  38. Fu, K.F.; Yue, Q.Y.; Gao, B.Y.; Wang, Y.; Li, Q. Activated carbon from tomato stem by chemical activation with FeCl2. Colloids Surf. A Physicochem. Eng. Asp. 2017, 529, 842–849. [Google Scholar] [CrossRef]
  39. Pezoti, O.; Cazetta, A.L.; Bedin, K.C.; Souza, L.S.; Martins, A.C.; Silva, T.L.; Júnior, O.O.S.; Visentainer, J.V.; Almeida, V.C. NaOH-activated carbon of high surface area produced from guava seeds as a high-efficiency adsorbent for amoxicillin removal: Kinetic, isotherm and thermodynamic studies. Chem. Eng. J. 2016, 288, 778–788. [Google Scholar] [CrossRef]
  40. Wang, T.; Chen, Y.C.; Li, J.P.; Xue, Y.J.; Liu, J.X.; Mei, M.; Hou, H.B.; Chen, S. Co-pyrolysis behavior of sewage sludge and rice husk by TG-MS and residue analysis. J. Clean. Prod. 2020, 250, 119557. [Google Scholar] [CrossRef]
  41. Chiu, K.L.; Ng, D.H.L. Synthesis and characterization of cotton-made activated carbon fiber and its adsorption of methylene blue in water treatment. Biomass Bioenergy 2012, 46, 102–110. [Google Scholar] [CrossRef]
  42. Liu, L.; Sun, J.S.; Li, M.; Wang, S.H.; Pei, H.S.; Zhang, J.S. Enhanced enzymatic hydrolysis and structural features of corn stover by FeCl3 pretreatment. Bioresour. Technol. 2009, 100, 5853–5858. [Google Scholar] [CrossRef] [PubMed]
  43. Naik, D.K.; Monika, K.; Prabhakar, S.; Parthasarathy, R.; Satyavathi, B. Pyrolysis of sorghum bagasse biomass into bio-char and bio-oil products: A thorough physicochemical characterization. J. Therm. Anal. Calorimetrt 2017, 127, 1277–1289. [Google Scholar] [CrossRef]
Figure 1. The yields of the ACs.
Textiles 05 00004 g001
Figure 2. The TG–DTG curves of (a) CWT, (b) Zn-CWT, (c) Fe-CWT, and (d) Cu-CWT.
Textiles 05 00004 g002
Figure 3. The SEM-EDS maps of the four samples: (a) AC; (b) Zn-AC; (c) Fe-AC; (d) Cu-AC.
Textiles 05 00004 g003aTextiles 05 00004 g003b
Figure 4. (a) N2 adsorption/desorption isotherms and (b) pore size distributions of the samples.
Textiles 05 00004 g004
Figure 5. FIIR and XPS curves of the four samples: (a) FTIR curves; (b) XPS total survey curves; (c) C1s; (d) O1s; (e) Fe2p of Fe-AC.
Textiles 05 00004 g005
Table 1. The specific surface areas and aperture distributions of the four samples.
SampleSBET
(m2/g)
Smic (m2/g)Smic/SBET (%)Sext (m2/g)Sext/SBET
(%)
Vt (cm3/g)Vmic (cm3/g)Dp
(nm)
AC422.95382.5890.4640.369.540.170.151.63
Zn-AC1621.531050.0064.75571.5335.250.720.421.76
Fe-AC712.05603.5984.77108.4715.230.390.232.18
Cu-AC436.58352.4380.7384.1519.270.240.132.18
SBET: total specific surface area; Smic: micropore specific surface area; Sext: external (mesopores and macropores) specific surface area; Vt: total pore volume; Vmic: micropore volume; Dp: average pore diameter.
Disclaimer/Publisher’s Note: The statements, opinions and data contained in all publications are solely those of the individual author(s) and contributor(s) and not of MDPI and/or the editor(s). MDPI and/or the editor(s) disclaim responsibility for any injury to people or property resulting from any ideas, methods, instructions or products referred to in the content.

