Article

Wrinkling Controlled Shear and Draping, Based on Hierarchical Textile Models, Weaving Kind and Yarn Properties

1
Fraunhofer Institute for Industrial Mathematics, Fraunhofer-Platz 1, 67663 Kaiserslautern, Germany
2
Institut für Textiltechnik, RWTH Aachen University, 52074 Aachen, Germany
*
Authors to whom correspondence should be addressed.
Textiles 2024, 4(4), 582-595; https://doi.org/10.3390/textiles4040034
Submission received: 26 October 2024 / Revised: 30 November 2024 / Accepted: 18 December 2024 / Published: 23 December 2024

Abstract

:
This paper covers the mechanical simulation of woven textiles on the yarn level with an investigation of the influence of the sliding between yarns and changing yarn cross-sections under loading. An experimental validation of the simulation tools for a range of chosen woven structures with different weaving types and thicknesses of multifilament glass fibre yarns is provided. The main focus of the paper is the classification of the folding mechanisms in textiles.

Graphical Abstract

1. Introduction

State-of-the-art mechanical modelling methods for textiles follow a multi-scale approach. Concerning the simulation of wovens, as well as textiles and textile composites in general, a three-stage hierarchy has been established in the textile modelling community; see [1,2]. While simulations on the smallest scale typically focus on the effective tensile behaviour of individual yarns by resolving individual fibres, the meso-scale models displacement, strain, and stresses of representative units of the textile with the finest resolution on the yarn level. utilising homogenisation and dimension reduction approaches, simulations on this yarn scale provide effective mechanical parameters that are input for macro-scale models, which capture the mechanical behaviour of entire textile products. The focus of this work is on simulations performed on the meso-scale, for which textiles can be described as thin periodic structures, consisting of slender, continuous rovings or yarns in frictional contact; see, e.g., [3,4,5]. In the specific case of wovens, the weaving unit is considered, which is constructed by interlacing warp and weft yarns at right angles.
Reasons for the textile folding can be macroscopic coupling between tension-bending due to the non-linearity of stretchable yarns, or, e.g., by reaching the critical shear angles for the structure, when the weft and warp yarns are locked and cannot rotate or slide any more. Due to its importance both in the prediction of mechanical properties as well as in the realistic virtual rendering of fabrics, the effect is of research interest for a vast range of communities in structural mechanics, computer visuals, and applied mathematics. Concerning computer models, macro-scale approaches capturing the folding date back to Provot’s mass-spring models; see [6,7], and extensions thereof; see, e.g., [8] utilising a finite difference discretisation of a continuum mechanics model. Moreover, finite element approaches with plate and shell models have been widely used since the beginning of the century; see, e.g., [9]. To further increase physical accuracy, more recent approaches additionally consider the geometric influence of the yarns on the meso-scale; see [3,5] and references therein.
Currently, the state of the art for the prediction of the shear folding, i.e., the critical locking shear angles for each textile, is still commonly determined by trial and error through expensive experimental tests. However, simulations and modelling that work with textiles are also known; see, e.g., [10,11,12,13]. Also, there are numerical works on the simulation of beams in sliding contact; see, e.g., [14,15].
The main modelling issue for textiles, especially woven fabrics, is the contact between yarns, which changes the macroscopic behaviour of the pre-forming textiles; see, e.g., advanced modelling papers [16,17]. They show that higher gradients and rotations along one or another direction join the constitutive equations, which, up to the authors knowledge, is not included in any commercial software tool now. Contact issues between yarns are properly modelled in various works of Durville; see, e.g., [18].
Correct modelling should account for the interaction of the bending and sliding of the rovings. The latter depends on the structure and properties of the rovings and the type of macroscopic loading. In many papers of the Boisse group, different types of loadings and problems with textile reinforcements are considered. The group is developing phenomenological models based on mechanical modelling and integrating them into the finite element approach; see, e.g., [10].
The reason for fabric folding is the coupling between the effective tension, shear, bending, and torsion. It can arise under shear loading due to the frictional coupling of yarns, as discussed in [12,19,20,21,22,23,24] and shown in the left-hand side of, or be the result of the non-linear behaviour of the stretchable structural parts; see [25] and the centre of Figure 1. It can also be an effect of large bending due to the boundary conditions [26]; see the right-hand side of Figure 1.
The first bending/buckling in Figure 1 is under the shear loading due to the locking of yarns, the second is due to the coupling of the tension and bending for stretchable textiles, and the third image shows wrinkling under large bending due to constraints.
TexMath software (V 1.5.0) [27] is employed for textile simulations. It is based on homogenisation and dimension reduction algorithms for shells, yarns, and contacts. Different one-dimensional interpolation methods are behind this software, depending on the yarn’s properties. The tool works with parametrised elliptic cross-sections. For flexible yarns, such as glass fibre or carbon, the computational algorithm ignores changes in the yarn’s cross-section. However, the effective shell properties significantly depend on the shell thickness. In this paper, we will experimentally investigate if the cross-section of such stiff and flexible yarns compresses significantly under the shear loading and if the computational assumptions are correct for glass fibres.
In this paper, TexMath shear-test and wrinkling simulations are validated by some chosen material datasets. For these reasons, six different woven fabrics made of glass fibre are chosen. The textiles are subjected to tensile and shear tests on the macro-scale.

2. Main Parameters Influencing the Textile Behaviour

The main textile properties influencing the effective textile behaviour are:
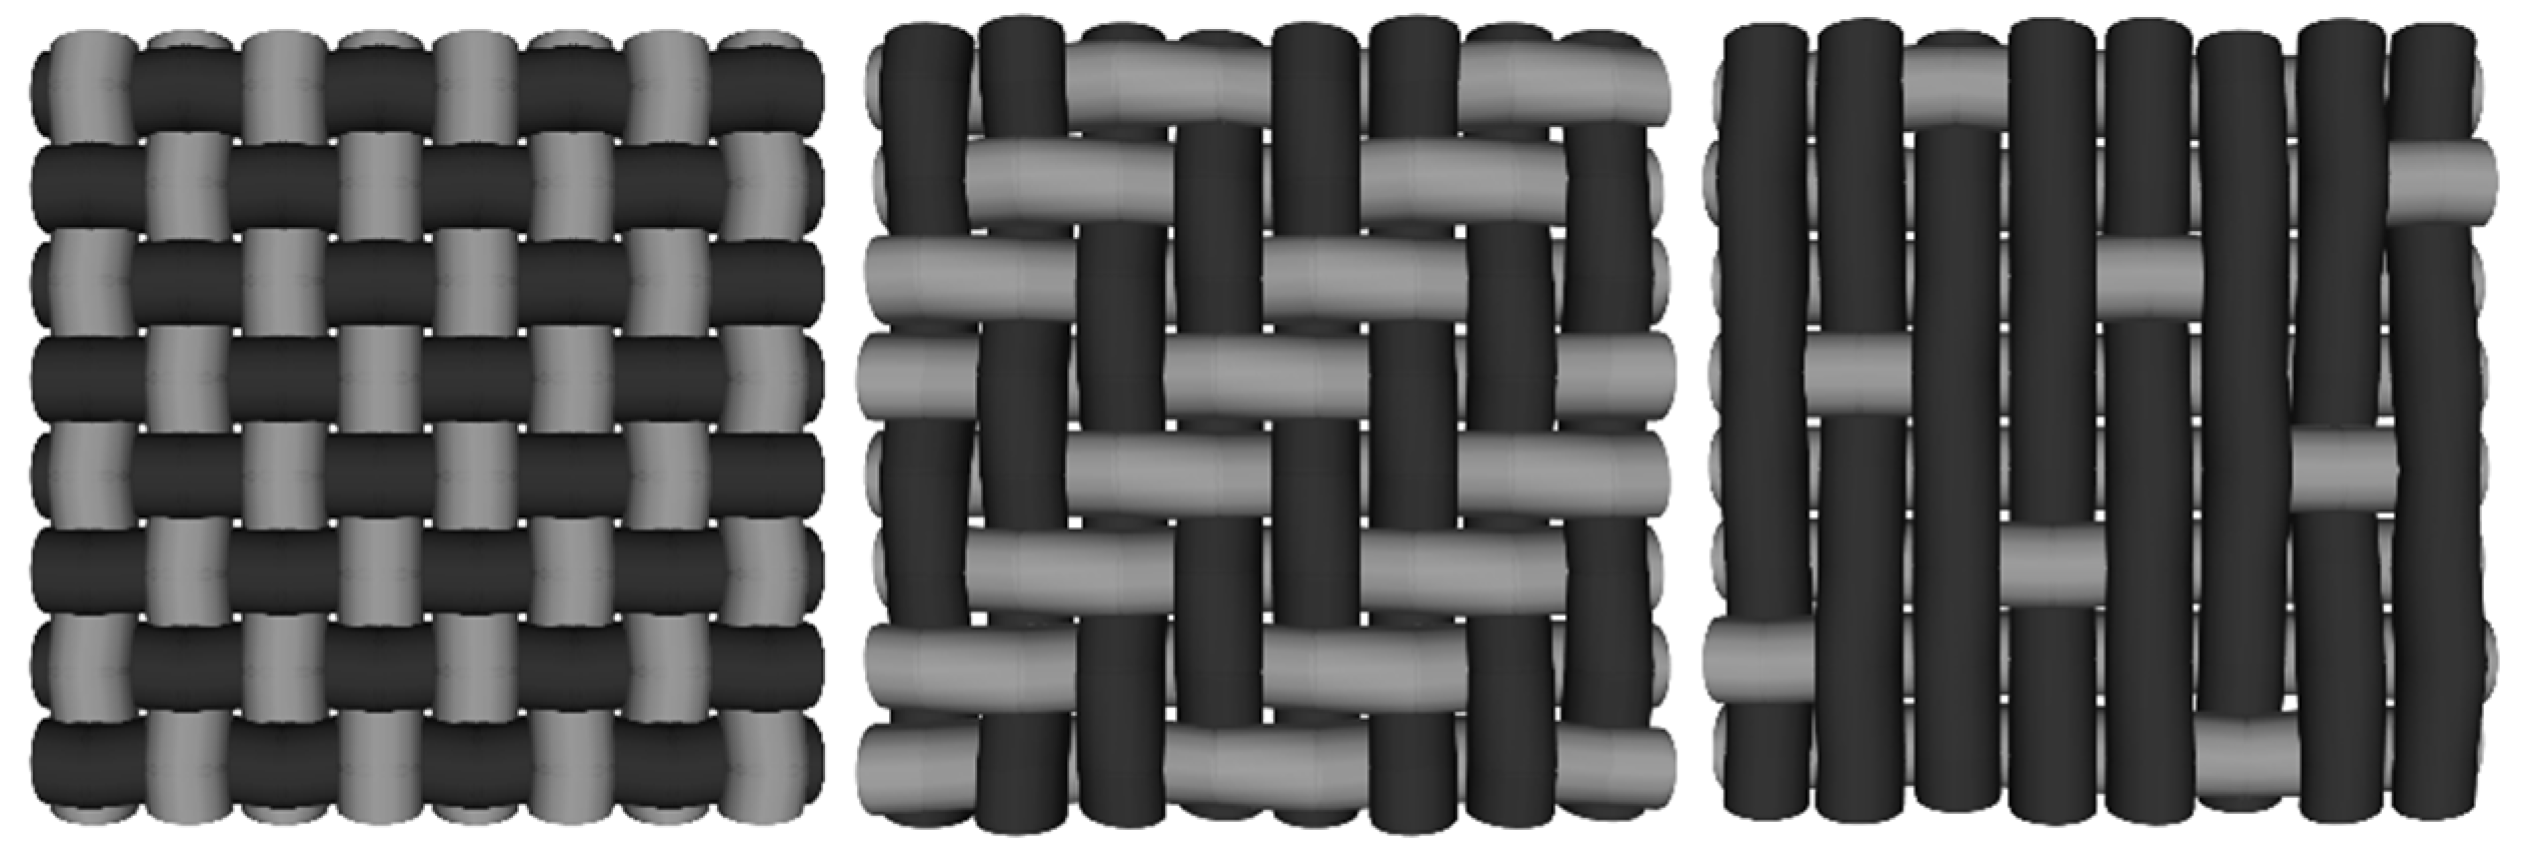
  • The textile pattern;
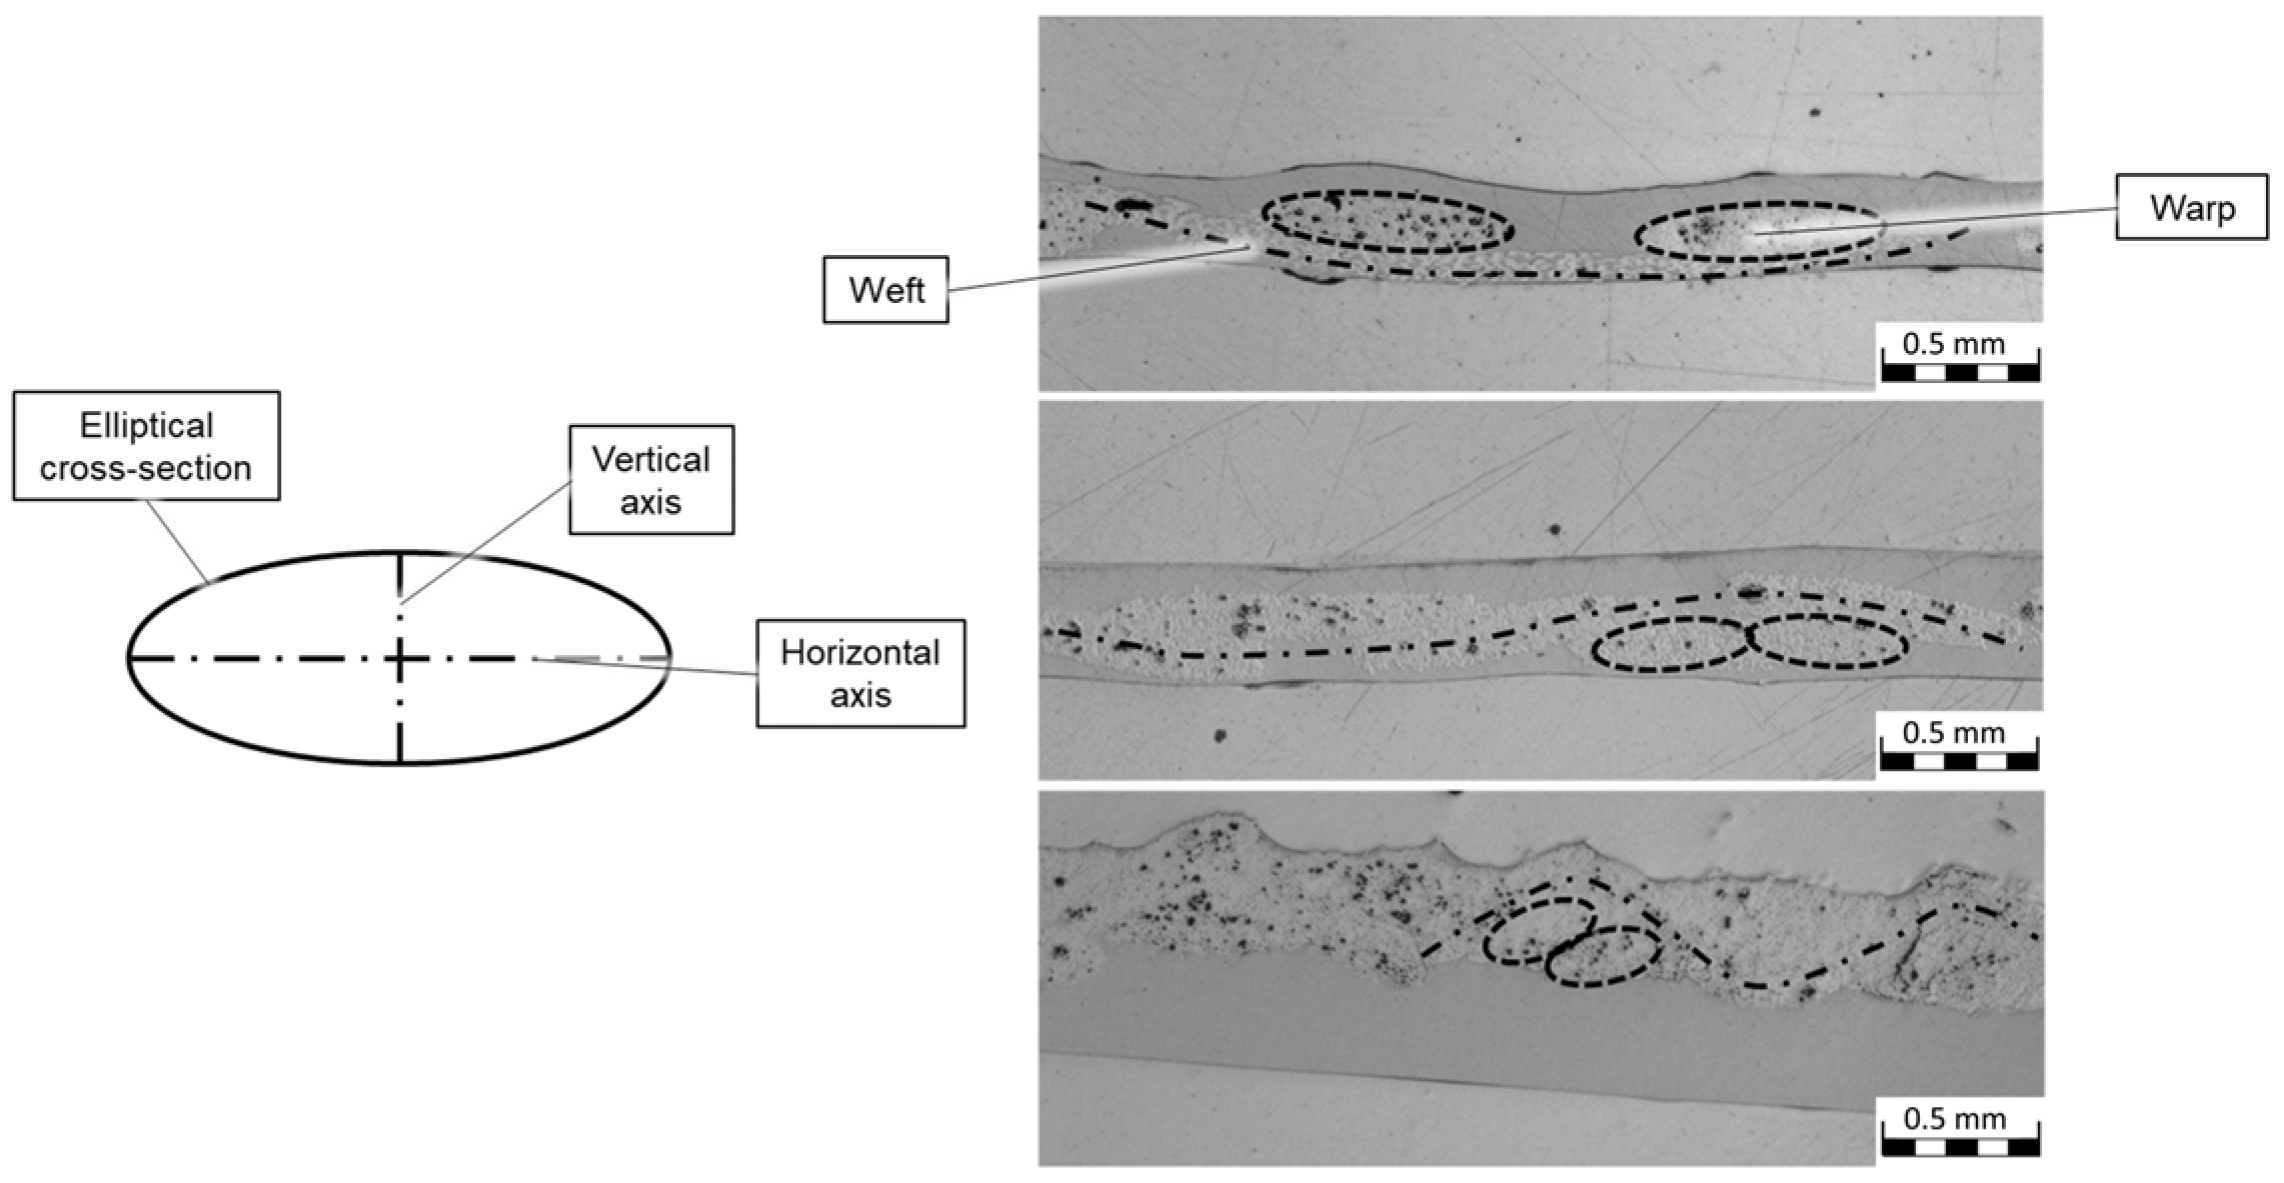
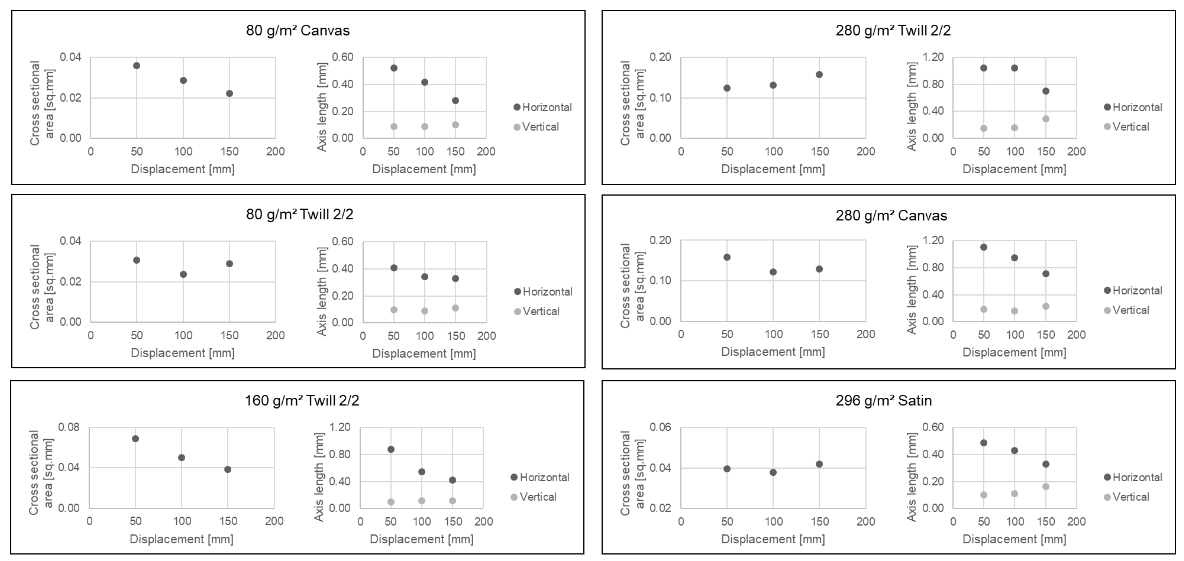
  • The yarn’s cross-sectional shape and size;
  • The yarn’s elastic properties;
  • The friction coefficient between fibres or rovings.
Textiles made of stretchable yarns provide the coupling between tension and transverse folding for any type of textile; see [28]. The textiles, made of stiff flexural yarns, such as glass and carbon, are bending-dominated; see [26].
In this paper, the mechanical behaviour of three weaving patterns as shown in Figure 2 is investigated. A total of seven physical samples with varying fabric weights are considered; see Table 1.
The textiles are made of multi-filament glass fibres, which are modelled as monofils with effective elliptical cross-sections and tensile behaviour. In a first step, the cross-sections of the rovings are determined with the help of electron microscopy; see Figure 3.
For multi-filaments, the shape of the cross-section depends on the crimp or pre-strain in the yarns during the weaving process. The diameters of the undeformed yarn’s cross-sections are given in Table 1.
The elastic properties of yarns are measured in a standard tensile test in a Zwick–Roell machine (Zwick–Roell, Ulm, Germany). The considered glass fibres are linear elastic, and their Young’s moduli are given in Table 1.
We finish our input measurements for TexMath simulations by the mesurement of the friction coefficients. The friction coefficients between different yarn pairs are depicted in Table 1 above.
The key parameters obtained from these tests, including friction coefficients and force-deformation behaviour, were used as input data for simulations aimed at predicting the textile behaviour under various conditions. These simulations allow for a more detailed understanding of how each fabric responds to mechanical forces, helping to optimise material selection for specific applications. The combination of experimental data and simulation enhances the accuracy of predicting fabric performance. By incorporating the characteristic values for the yarns and the structure, the physical simulations provide insights into the fabrics’ behaviour during real-world usage. This integrated approach bridges experimental mechanics and predictive modelling for textile engineering. Table 1 depicts the input data for the considered woven structures used for simulation. It should be noted that here the weaving distance describes the distance between yarn centrelines, i.e., the inverse of the thread count.

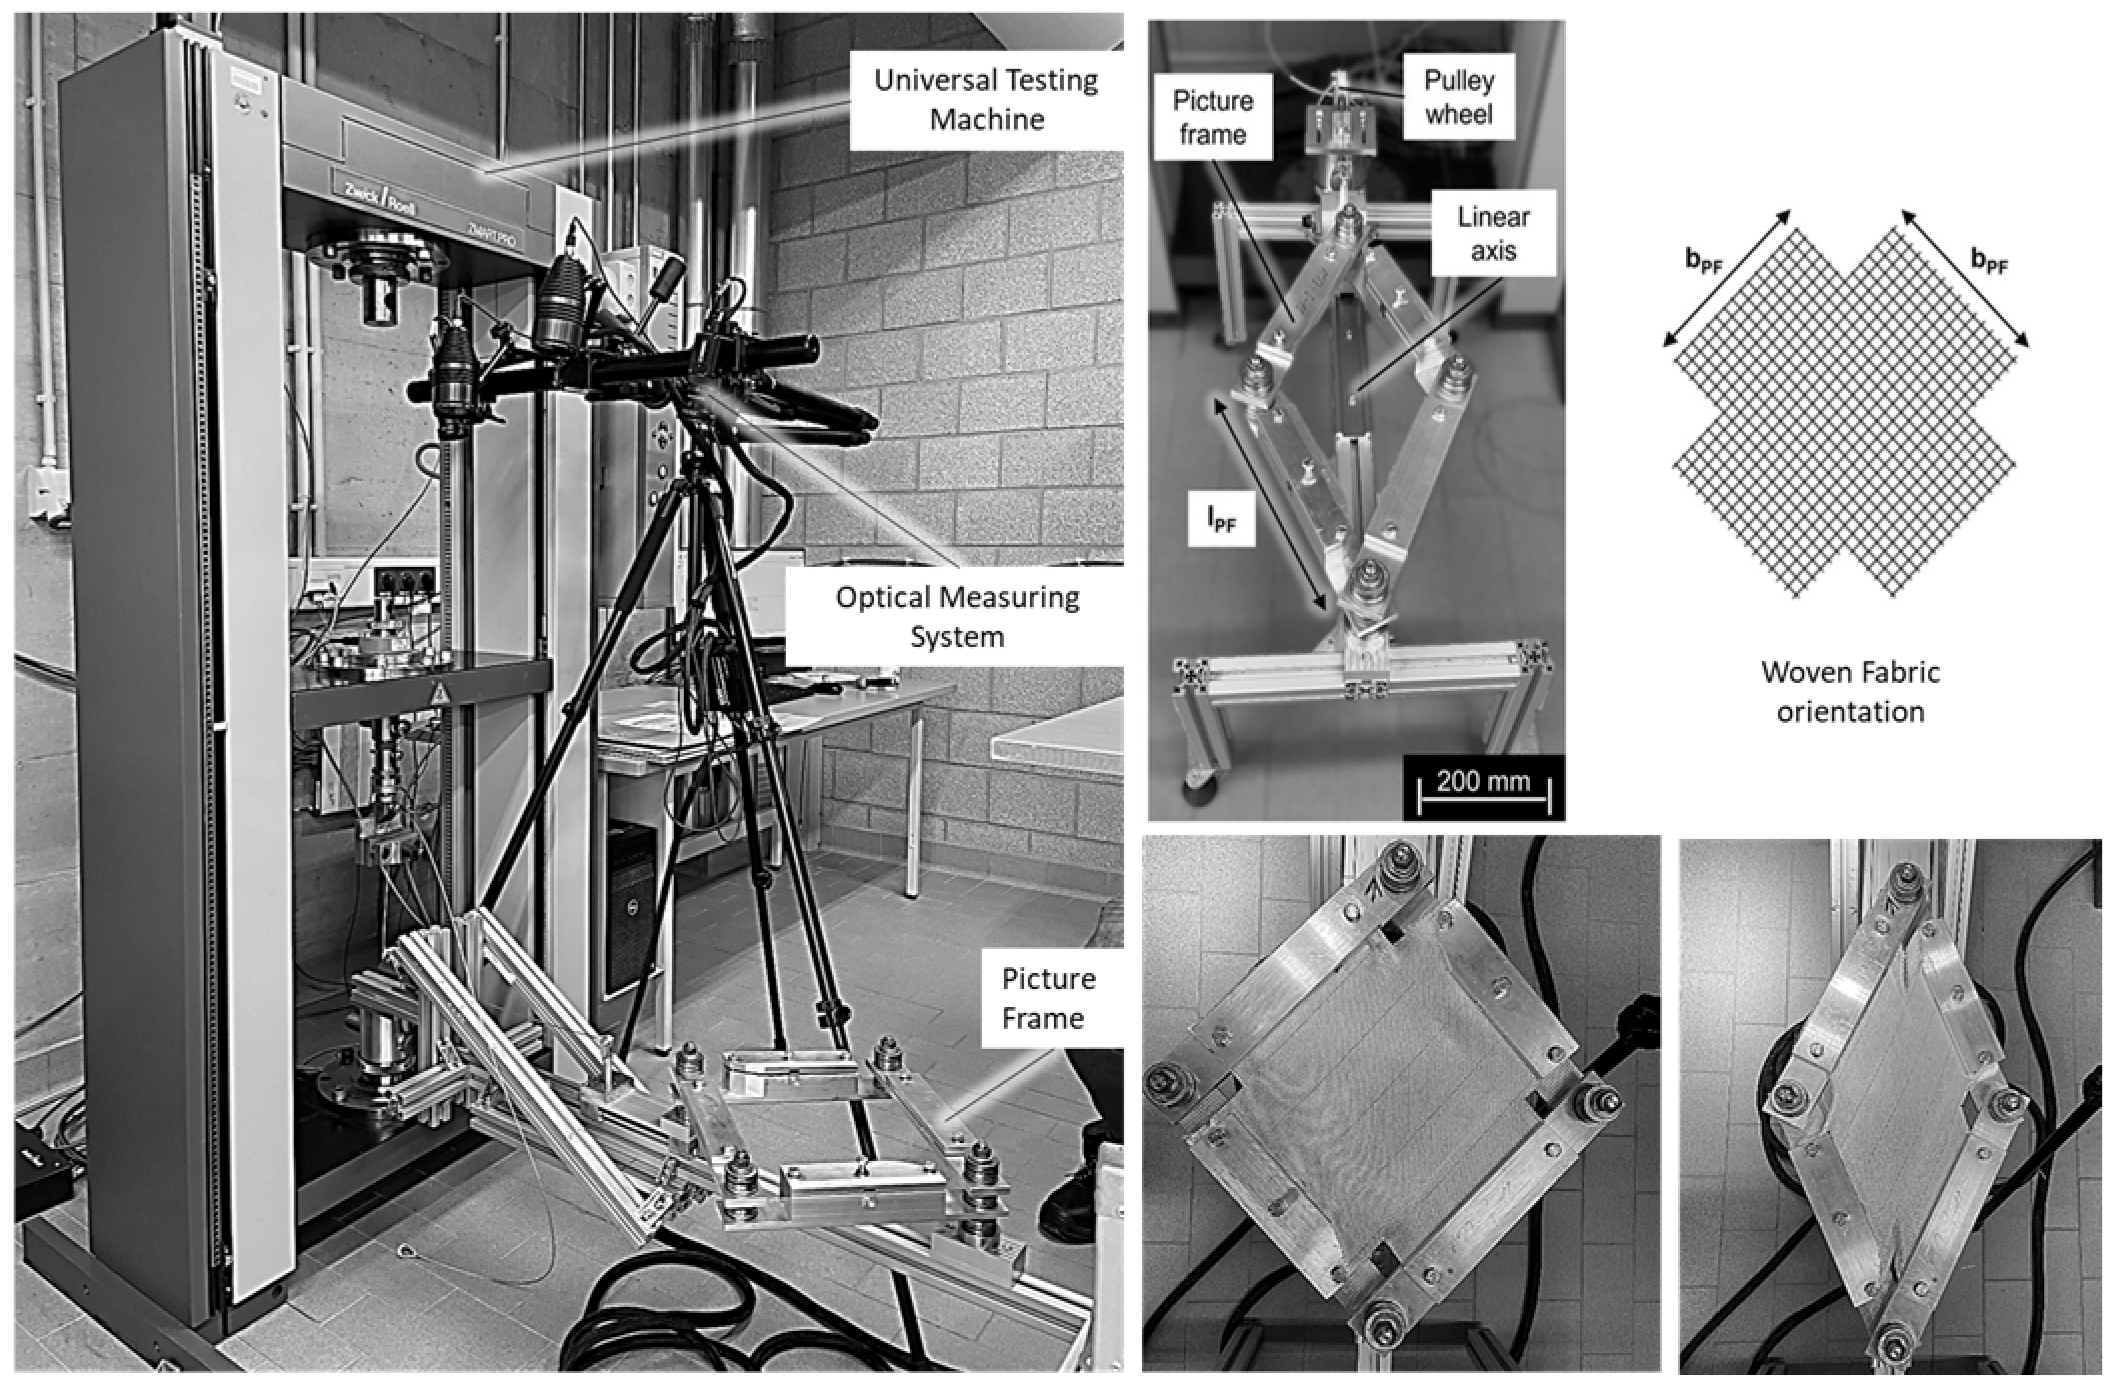
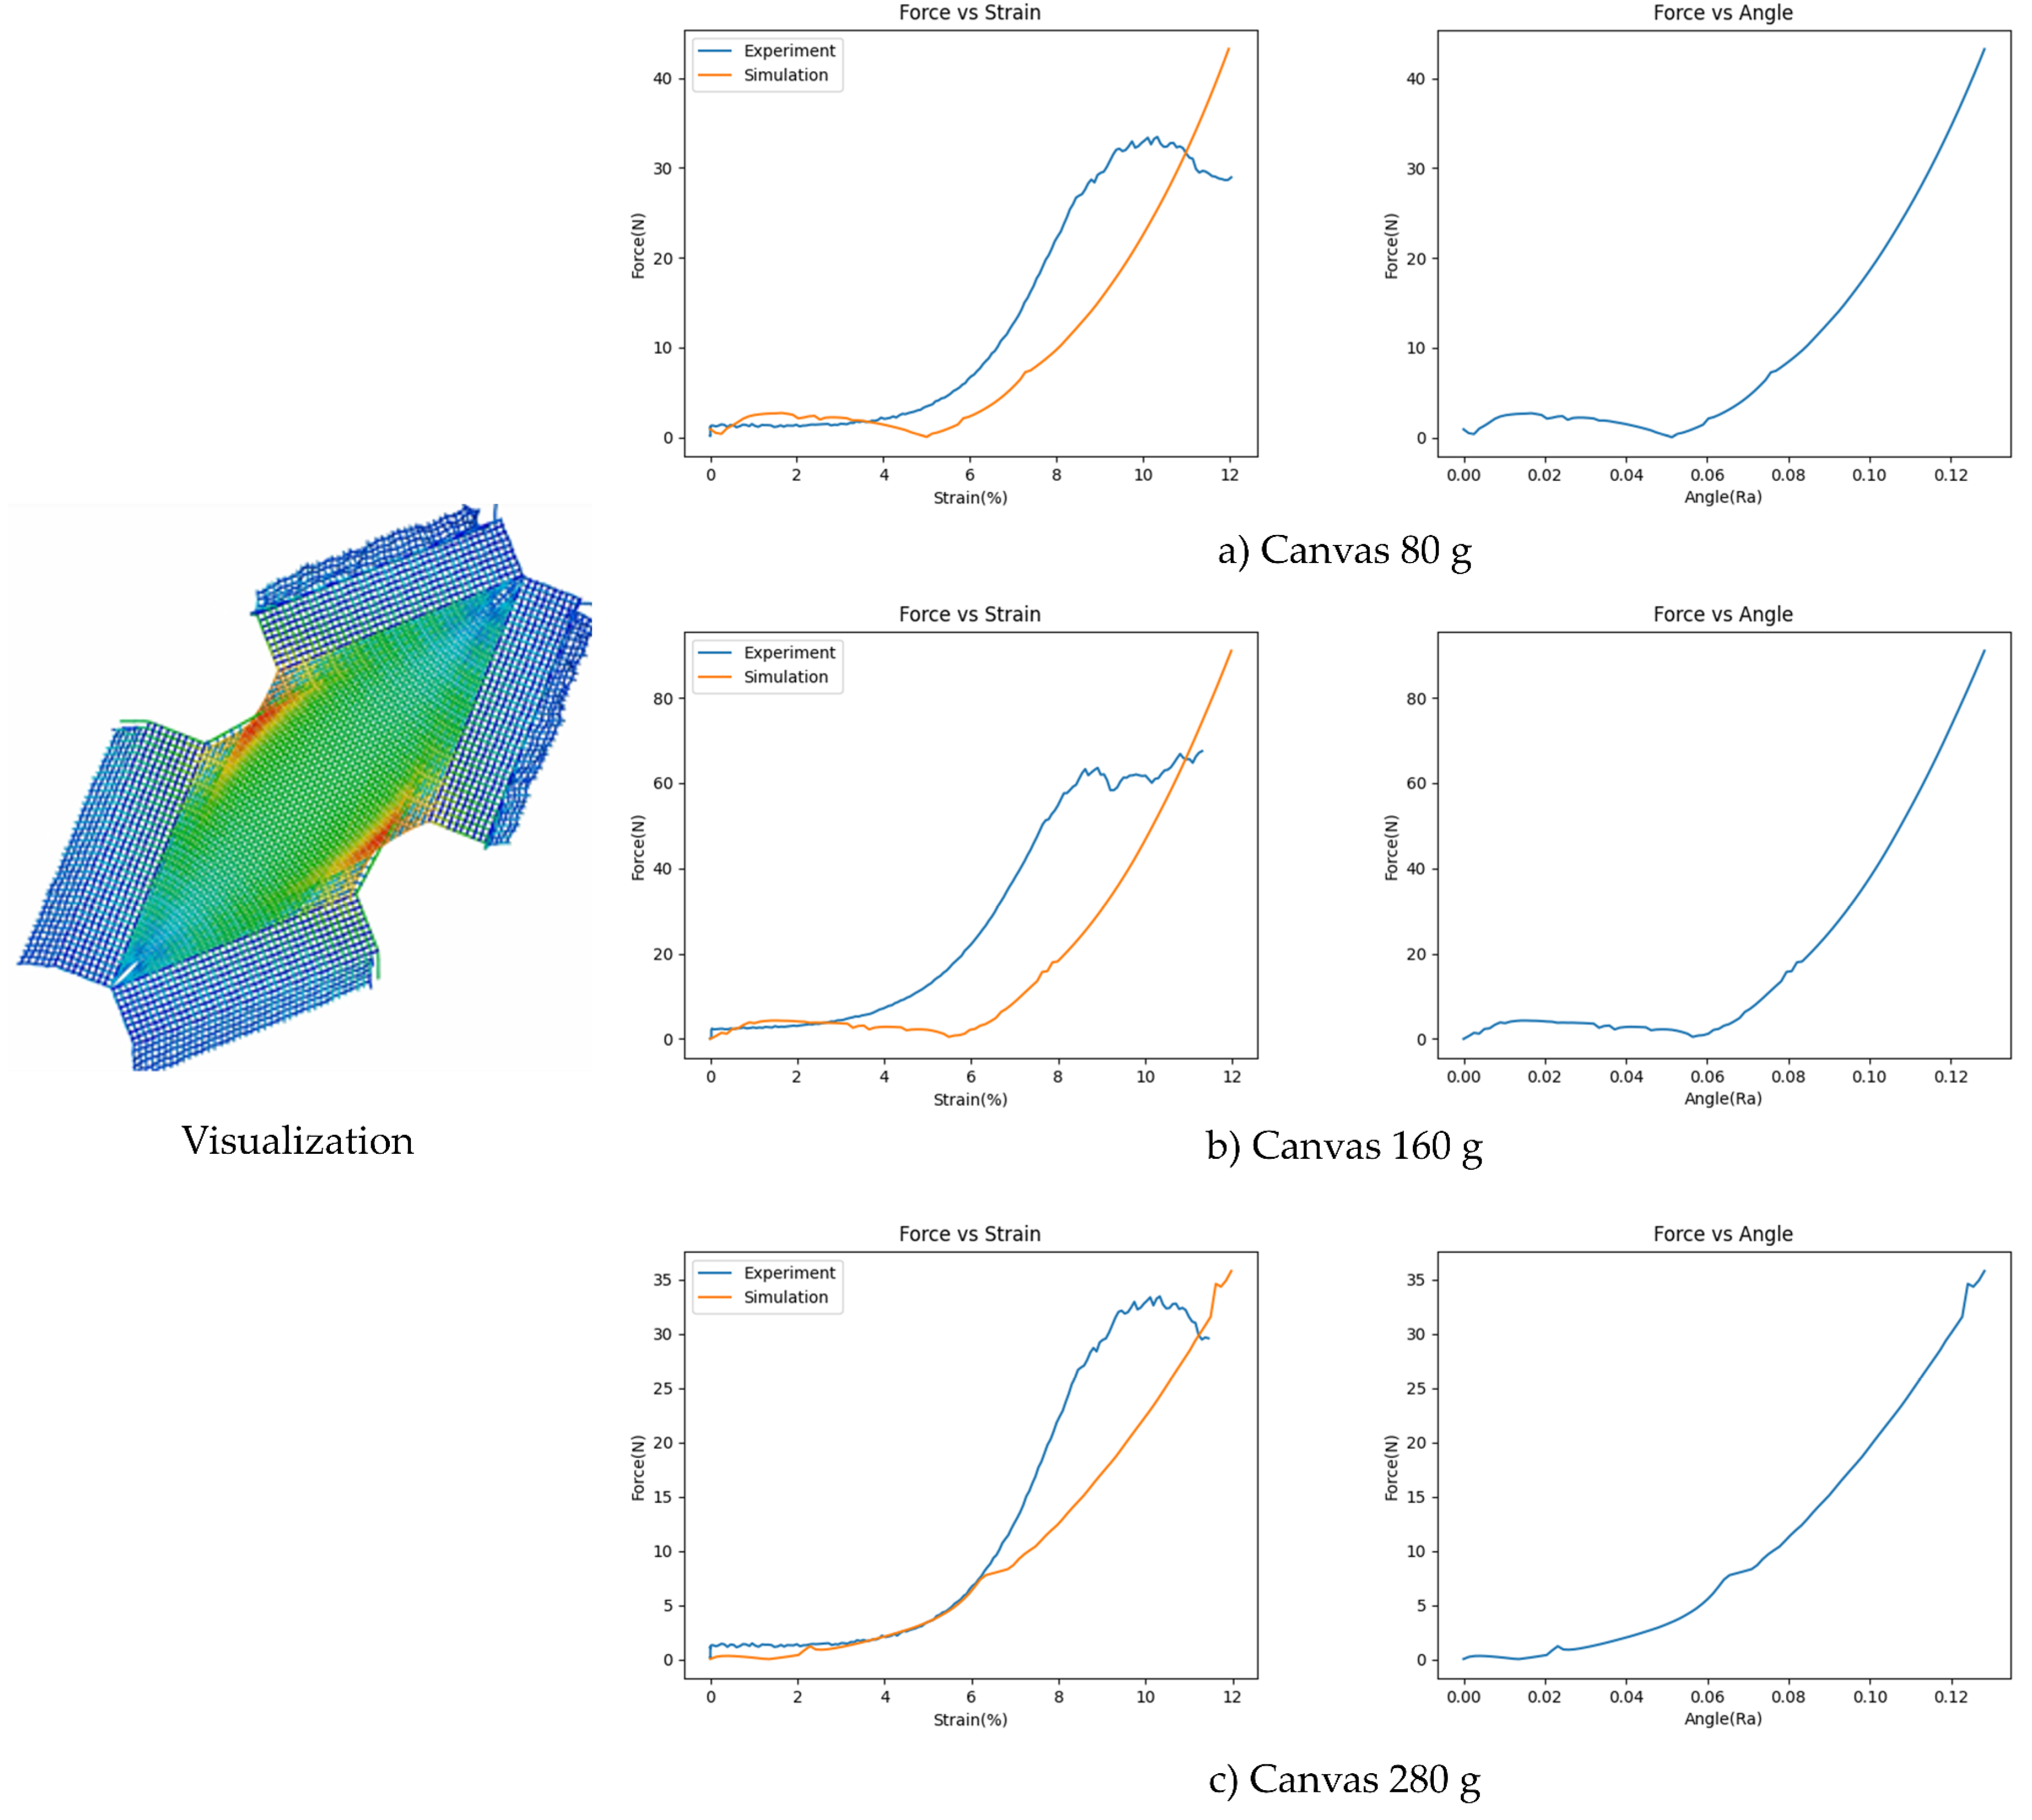
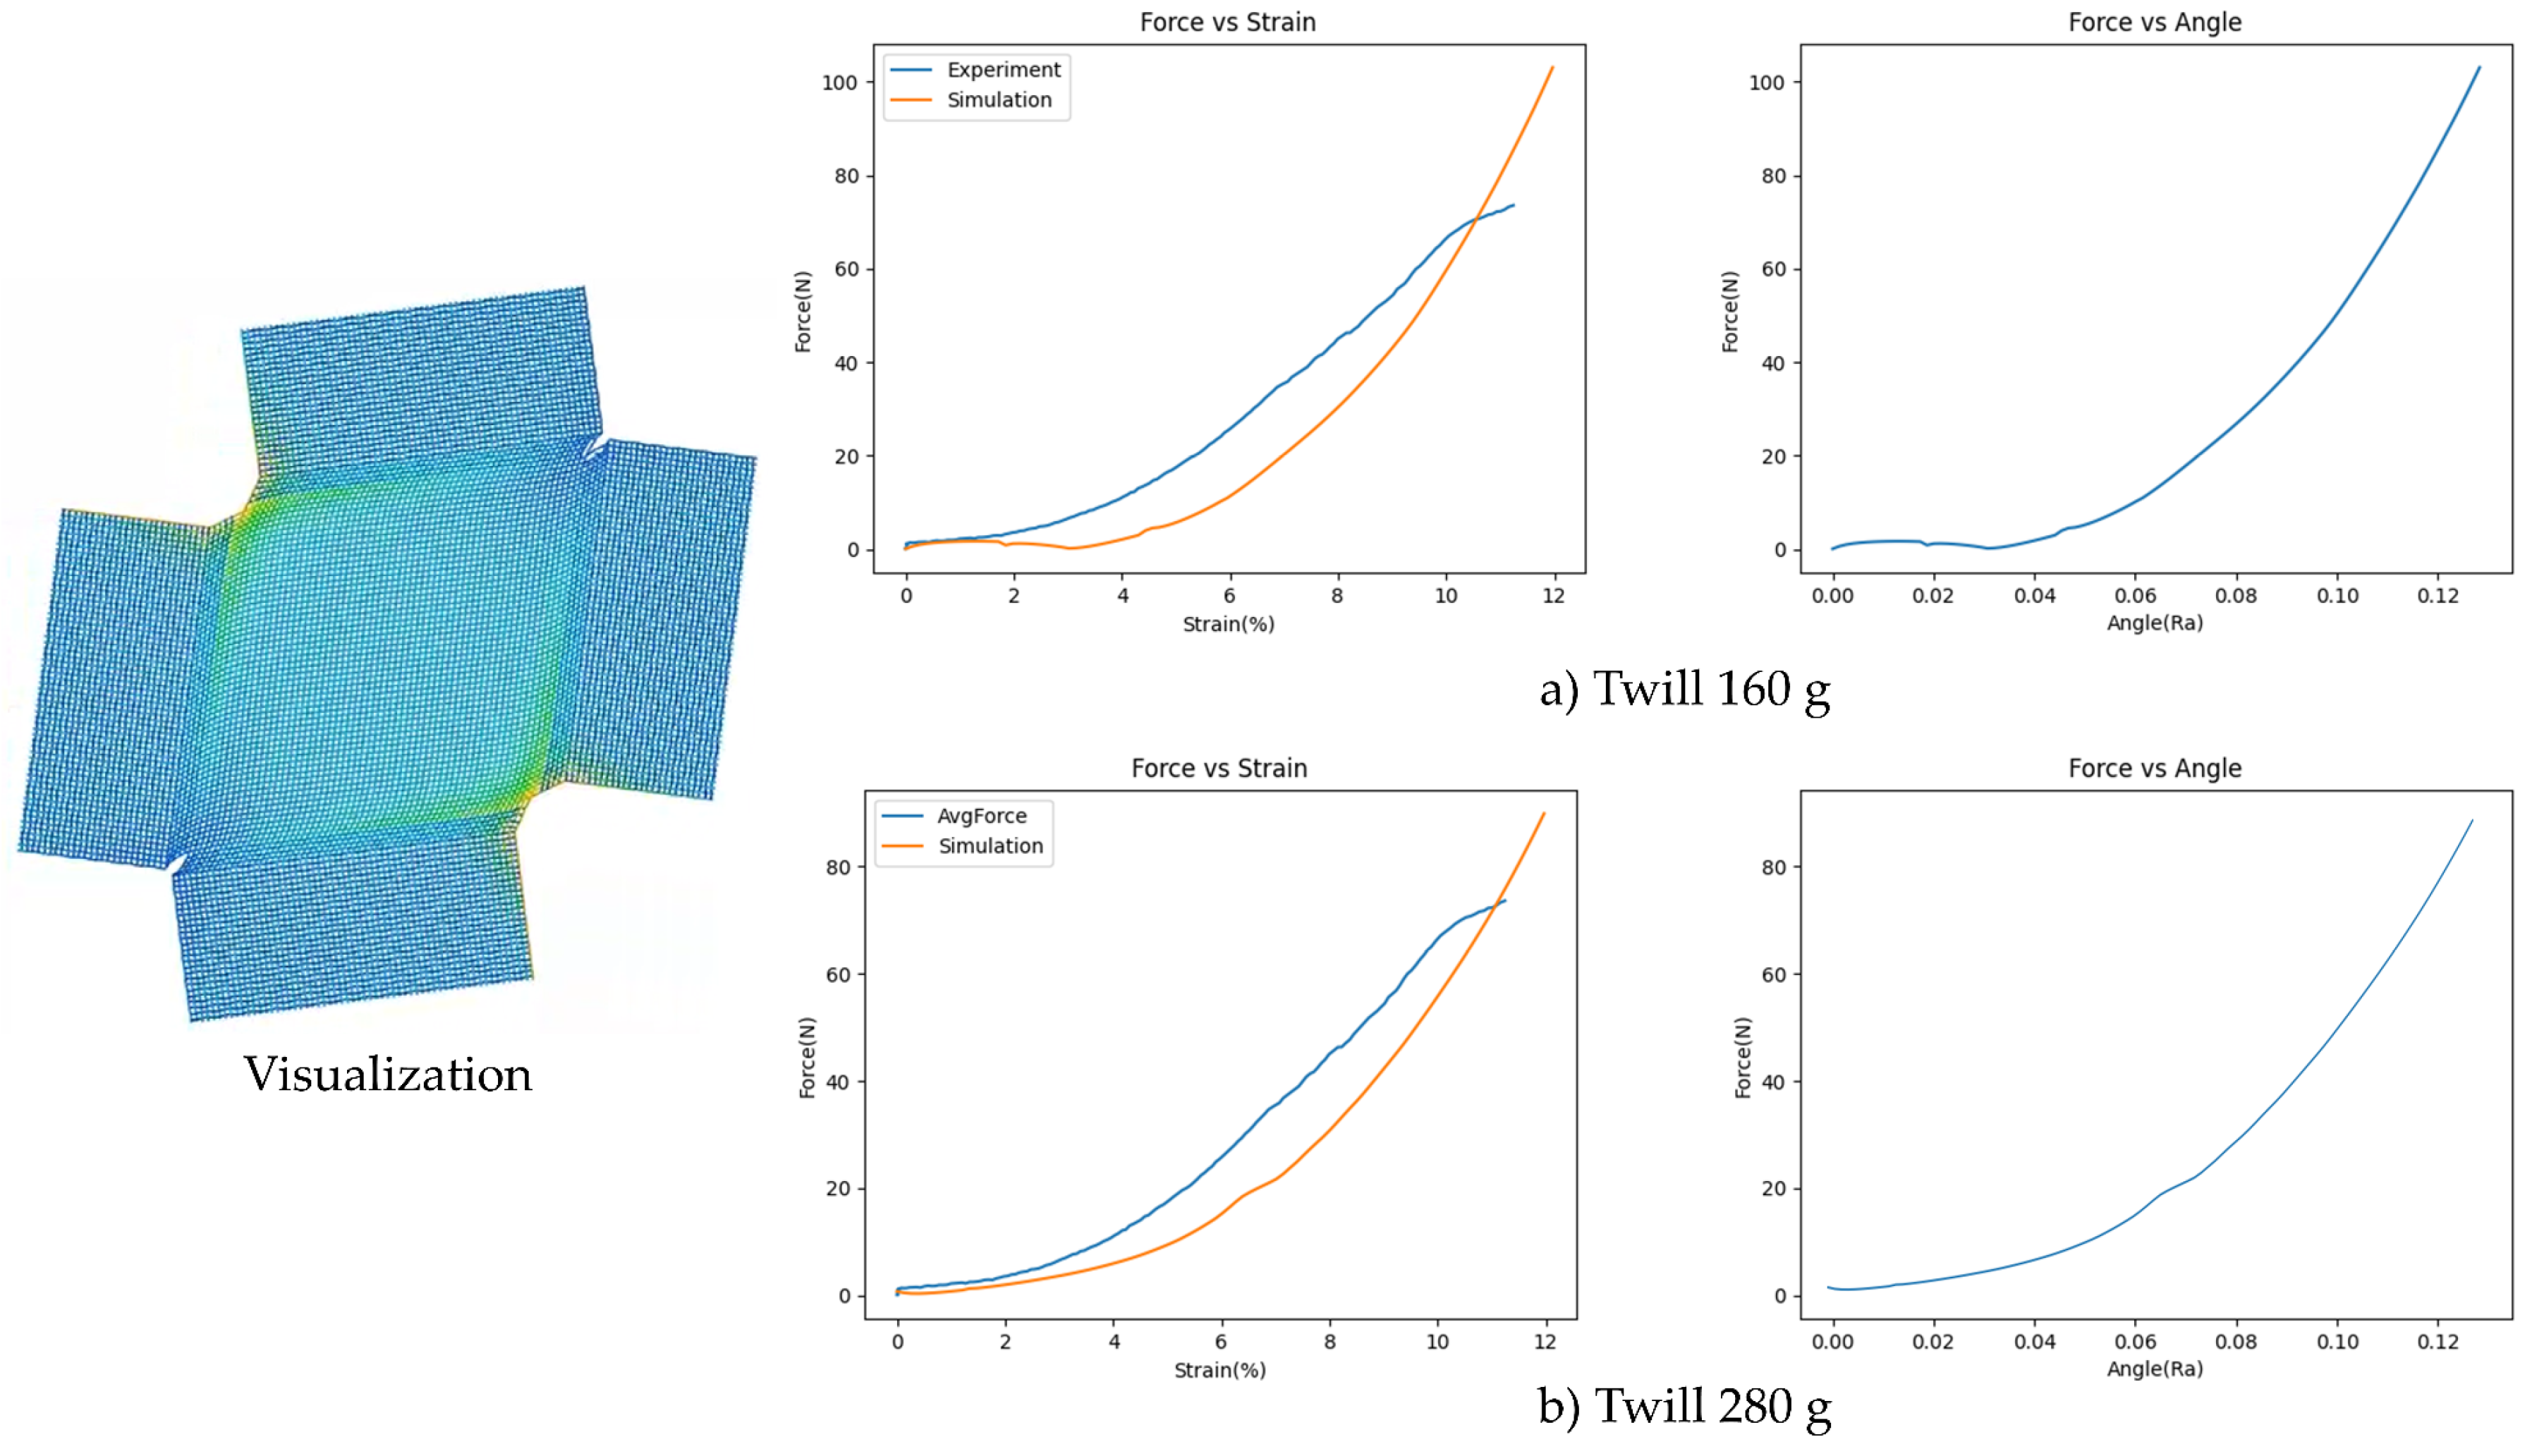
3. Shear Frame Experiment

This section is about the shear test with different woven structures made of glass multifilament fibres. We performed the standard test with several chosen textiles and put them into the shear frame as is schematically shown in Figure 4 below.
An important part of this section is an investigation of the changes in the multi-filament cross-section under tension and in-plane bending of the rovings or yarns. To investigate this, the following strategy was chosen: after some deformation, the yarns were frozen in a resin. Afterwards, the impregnated stiff parts were cut out and investigated under an electron microscope. Figure 3 shows the cross-section with its horizontal and vertical axes, whose evolution is evaluated in Figure 5.
The elongation of the horizontal and vertical diameters of the elliptic cross-section are given in the charts on the right. The displacement in mm is related to the vertical elongation of the shear frame. The most important conclusion from this investigation is that the vertical diameter of the cross-section does not change, that is, the thickness of the textile plate remains the same during the experiment. This proves one of the most significant assumptions for the simulation with the reduced dimension model.
The force-deformation curves of the woven textiles subjected to shear tests are depicted in Figure 6 and Figure 7.

4. Shear Test Simulation and Validation

We generated a corresponding virtual textile structure in the TexMath software with the known material and frictional properties of the rovings.
In the figures below, the simulation and experimental results for the selected textile examples are compared. The left sides of Figure 6 and Figure 7 show this comparison. The right side of the figure panels presents the simulation results for the shear force versus the shear angle.
The figures show a comparison between the experimental and simulation results for different textile fabrics, including canvas 160 g, canvas 280 g, twill 160 g, twill 280 g, and satin 296 g. For each fabric, the left panels depict the force versus strain curves, highlighting discrepancies between the experimental data and the simulations.
The simulations and experiments in the left columns show two different behaviours for the force–strain curves. First, two textile plates, spanned on the yarns in the weft and in the warp directions, slide on the contact surfaces between yarns and rotate with just a small resistance, induced by the friction between yarns and the yarns’ in-plane bending. However, in all the experiments, at a certain point that is called the critical shear angle, the warp and weft yarns lock each other, and the sliding and rotation stop. The textile structure becomes stable in-plane, and its elastic response and resistance increase significantly.
On the right panels, the force versus angle results from the simulation show the expected trend, with the shear force increasing as the yarn angle changes during shear deformation. This is consistent across all fabric types, demonstrating that the model accurately predicts the relationship between force and angle. However, since no experimental shear angle data are provided for comparison, it is difficult to evaluate the accuracy of these predictions.
The visualisations of the fabrics during shear deformation on the left side suggest that the simulation can represent the general deformation patterns well. Differences between the experimental and simulated force–strain curves may arise from material non-linearities or interactions that are not fully captured by the simulation model. For example, fabric structure, yarn slippage, or friction could contribute to the observed variations. Overall, the simulation offers a useful approximation of the fabrics’ behaviour, but further refinement is needed to improve alignment with experimental data, especially for higher strain regions.

5. Draping Simulation: Relation Between Load Value and Yarn Thickness and Stiffness

While the previous sections dealt with specific materials and yarns, this section starts very generally, discussing a class of all woven textiles made of not very stretchable yarns (yarn materials, like elastin, are excluded here). It provides more modelling and simulation results, and experimental validation is performed qualitatively at the end.

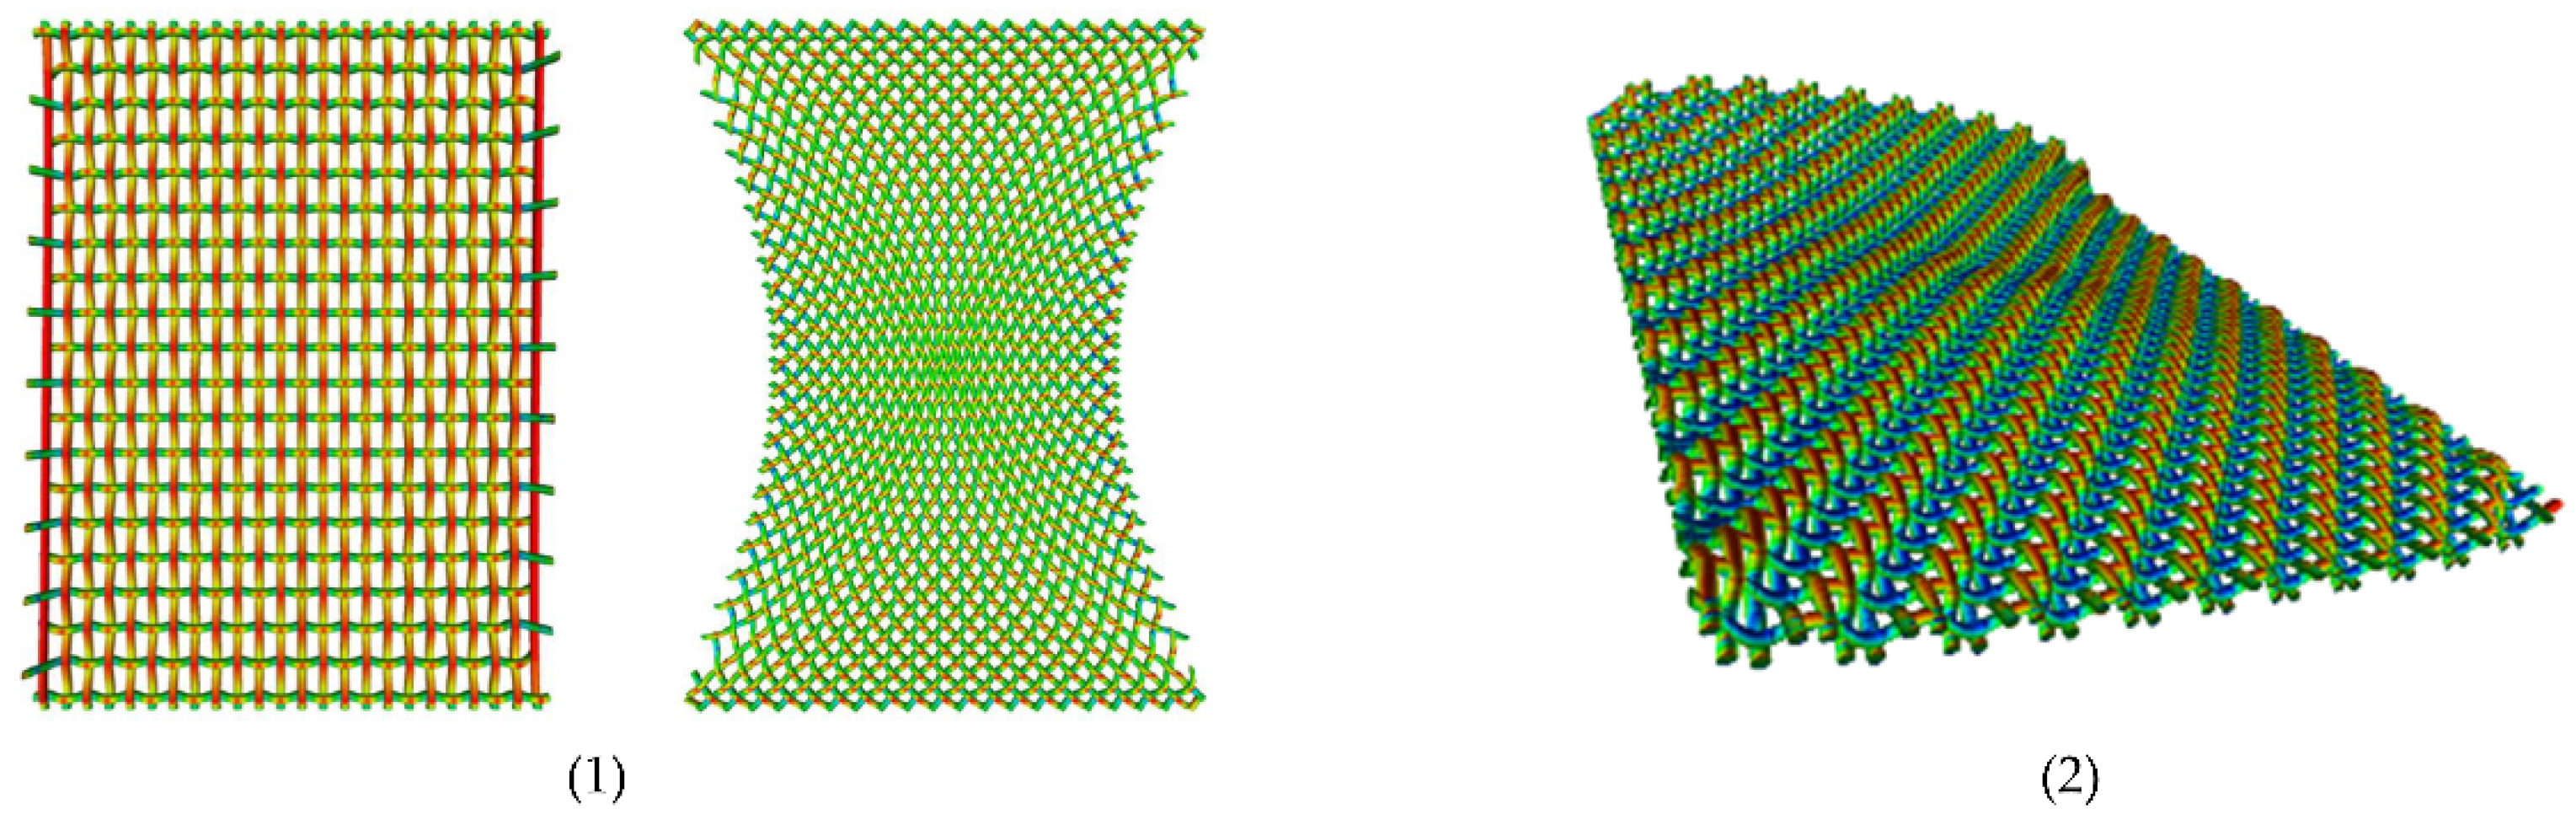
5.1. Hierarchical Textile Models

Classifying folding mechanisms helps in designing textiles that meet specific functional requirements. Folded textiles are used in various practical applications, such as antennas in aerospace and reinforcement in construction. Understanding folding mechanisms is crucial for both utilising and avoiding folds. For instance, in draping applications, finding the right weaving or knitting pattern, adjusting distances between yarns, and selecting appropriate yarns can help avoid unwanted folding or wrinkling under specific loads.
The wrinkling or folding of textiles can be classified by only four driving mechanisms, described in the following subsections.
We investigate how the weaving pattern influences coupling between different deformation modes, like tension and bending or bending and torsion. To discuss this aspect, we first briefly describe the mathematical asymptotic analysis employed to reduce the multiple contact problem in 3D textile structures to 2D anisotropic plate models. This was performed in our various mathematical works [20,21,26,28,29]. Depending on the range of applied forces, we obtain different two-dimensional plate models. However, after finishing all the analysis work, the results can be unified into one general model presented at the end of the section with comments on how this model evolves with increasing load, summarised in Table 2.
The solution of such a 2D problem, the three-dimensional displacement field U of the textile mean-plane, is the minimiser of the energy functional
J v K h o m U = 1 2 Ω a α β α β h o m Z α β Z α β + b α β α β h o m Z α β α β U 3 + c α β α β h o m α β U 3 α β U 3 d x Ω f U d x
with
Z α β = e α β U + 1 2 α U 3 β U 3 .
Additionally, the solution needs to satisfy the clamping condition (displacements and bending angles are zero on some clamped parts of the textile boundary). In this functional, e denotes the in-plane strain tensor, f is the vector of applied forces to the plate, the 4th-order tensor of coefficients A h o m denotes the anisotropic membrane properties (tension-shear), C h o m is the, in general, anisotropic, tensor of bending-torsion plate coefficients, and B h o m induces a coupling between the in-plane and outer-plane degrees of freedom in the plate.
Frictional coupling between yarns and structural asymmetries imply the presence of these mixed energy terms. This is controlled by the textile structural topology (weaving type) and yarn surface preparation. An impregnation of multi-filaments reduces their friction. This reduces the coupling, while using winded yarns increases their roughness and the friction; see [22].
One can find in [28] how these effective plate membranes, mixed and outer-plane coefficient tensors, A h o m ,   B h o m and C h o m are computed from the smallest periodic unit of the woven structure.
Asymmetries in the woven pattern give rise to the coupling A h o m and B h o m terms and appear, e.g., due to an inhomogeneous production pre-strain as in Figure 8, or due to the weaving pattern as in Figure 9.
When increasing the loading value, some terms appear and disappear from the plate energy functional above. The loading starts usually in a small strain regime, and the plate is linear elastic. The corresponding mathematical analysis can be found in [29], in the part about the perforated plate.
In this linear regime, the coupling of in-plane and outer-plane displacement induced by the Z term disappears, that is, only the strain tensor remains. After increasing the load, all terms in Z are present, and the effective textile plate becomes slightly non-linear. Moreover, a coupling between the membrane and bending degrees of freedom is present; see analysis in [28]. This is the regime in which wrinkles appear.
If one increases the load more, the first energy term in the von-Karman energy, written above, is dropped from the energy and enters as an isometry condition in the set of admissible minimisers. That is, the solution not only needs to satisfy the clamping condition at the boundary but is additionally required to preserve the initial area of the textile mean surface after displacement. In numerical methods, the isometry condition is often introduced as a penalty term, which is similar to the first term in the Karman energy written above.
In the case of large bending, the last term in the energy above should account for the local rotations R of the plate fragments with respect to the initial plane state:
J B V = Ω c α β α β h o m R V e 3 α β V R V e 3 α β V d x Ω f V I d d x .
The effective coefficients are the same in all types of loading and depend on the yarn elastic properties, the textile weaving pattern, and the friction between yarns. The mathematical analysis for homogenisation and dimension reduction in textiles in a large bending regime can be found in [26]. In the next subsections, the different introduced regimes are illustrated with practical examples.

5.2. Shear Compliance Due to Sliding on the Yarn Level

Here, the case with sliding on the contact surfaces is considered first; see [21]. This sliding helps to avoid folding.
In Figure 10, the influence of the contact parameters is studied, starting with high friction and then reducing or removing friction. The first figure demonstrates a textile with high friction between yarns, with almost no sliding between them. This case was studied in [20]. This simulation gives an impression of the textile behaviour looking on the plane corner. In the main simulation, the friction is removed; only non-penetration contact conditions are preserved, and the yarns can slide and rotate freely at the contact points. This is the case in the analysis in [21], which also corresponds to the experiment shown in the last picture in Figure 10.
We can conclude that for stiff flexural fibres, like glass, it is possible to drape a surface without folding only if flexural fibres have a plane cross-section (that prevents torsion), a very smooth surface, or are coated by some smoothing material that removes the friction on their contacts; see also [24].

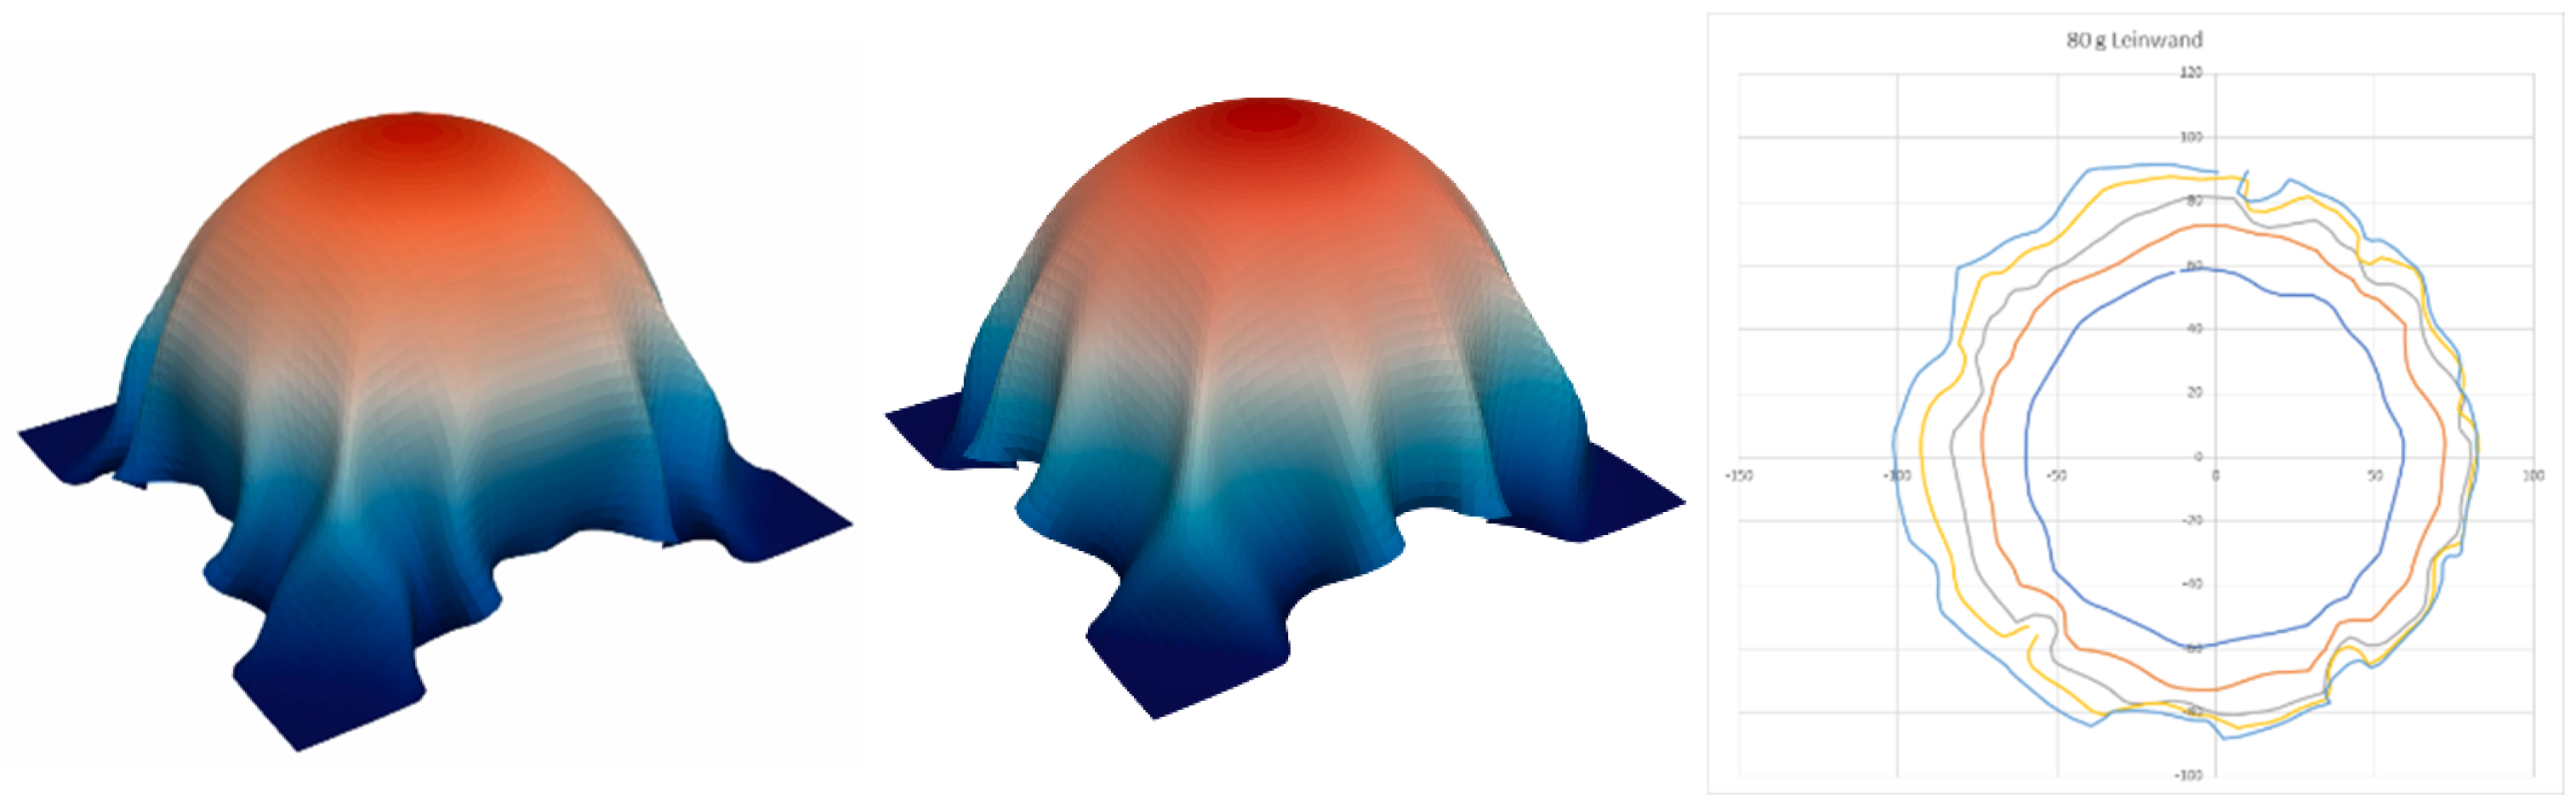
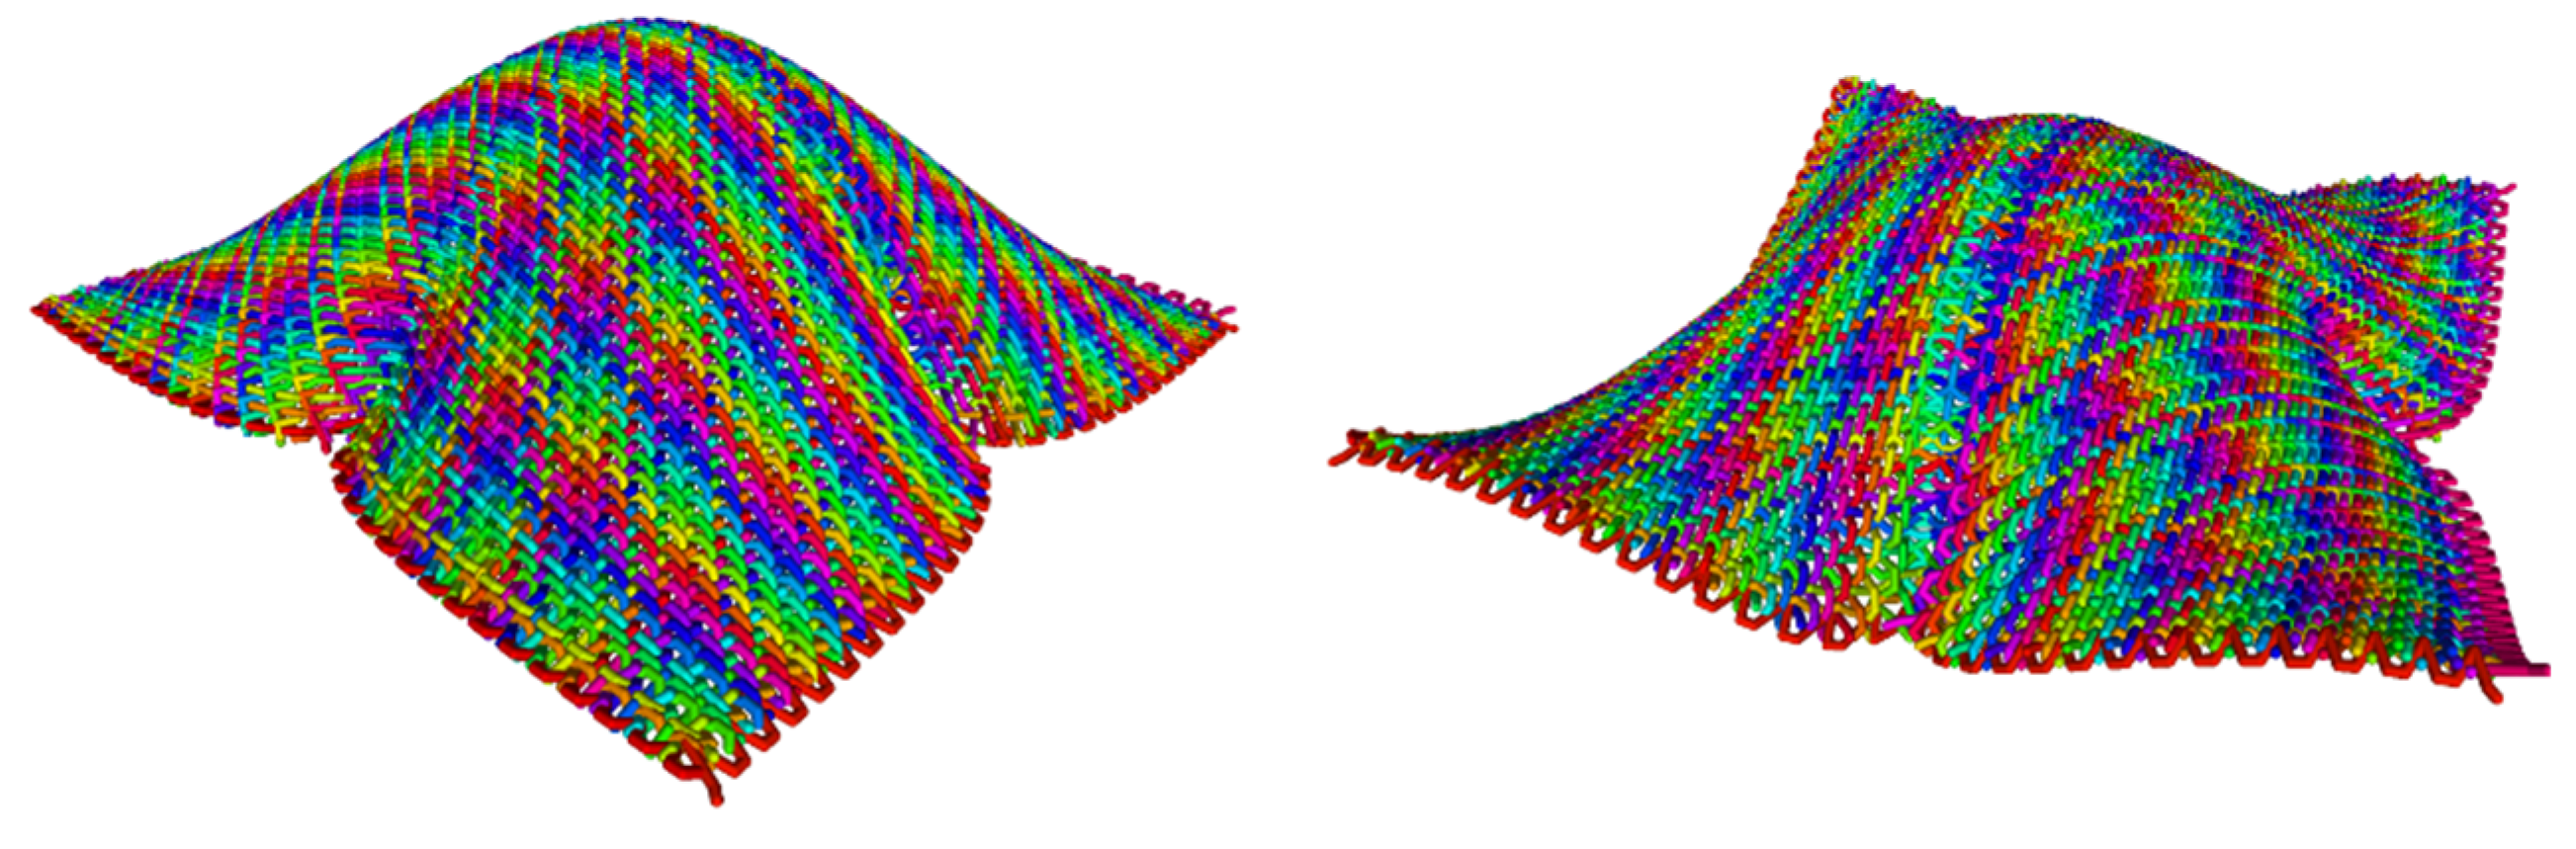
5.3. Wrinkling of the Effective 2D Plate

The next example in Figure 11 shows a simulation and an experiment with textiles in the Karman regime; see [28] and Table 2. This Karman phenomenon is related to the non-linear coupling between the plate tension and bending, which leads to wrinkling. This regime can appear in any textile shell with a certain relation between the applied tensile load related to the effective tensile stiffness in the direction of this load and the plate thickness, as explained in Table 2 below. The simulation is performed for a thin and slightly stretchable textile under its weight, while the experiment shows the press-in experiment with one of the considered glass-fibre wovens using the negative form shown in Figure 12.
The folding is non-unique, which we can see in the first two images. In the figure on the right, the folds are measured using camera imaging. In the figure on the right, the folding image was drawn of the simple woven textile 80 g/m2 described above, at heights of 12.5 mm, 25 mm, 50 mm, and 62.5 mm in the semi-sphere after the forming. This figure does not provide a real validation, because the draping in the simulation was performed using the positive part of the punch, while in the experiment, it was performed using the negative part of the punch. However, it gives an impression about fold heights, widths, number, and distribution, which can roughly be compared.

5.4. Dense Textiles in the Large Bending Regime

We continue our considerations and analysis of the folding phenomenology by considering a dense woven with an isotropic crimp, made of not very stretchable, thick, linear elastic yarns, e.g., from glass or carbon. We consider them in a rather dense structure with a symmetric cross-section, such that not much sliding on the contacts is possible. The shell on a large bending regime is considered in Table 2 below. The theoretical investigations from [26] as well as the experiment in Figure 13 show that in the draping test under their own weight, such textiles make just one fold and show no wrinkles.
As before, a half-sphere is draped virtually with the help of TexMath. The main issue that should be mentioned here is that the result strongly depends on the way we put the fabric on, i.e., on the fixation, which we did not apply in the real experiment above. In the images in Figure 14 below, the textile is stitched to the sphere along a cross. In the first image we pull or stretch the corners to the table; in the second figure, we left the corners free.

5.5. Textile in the Large Membrane Tension Regime

To complete all possible textile regimes, let us consider the example shown in Figure 15. It presents a simulation of a mask, made of stretchable non-linear yarns, containing elastan and its large extension deformation by putting it onto a face. The effective fabric is a stretchable membrane; see [25] for modelling and analysis.
In the simulation, the colours show the axial stresses in the yarns; the highest are red, while the lowest are blue. The left figure is simulated with a one-piece fabric, while the right figure is the optimised fabric, consisting of parts or subdomains with different stiffness. The wrinkling that we see on the right figure is due to the different pre-stretching in different parts.

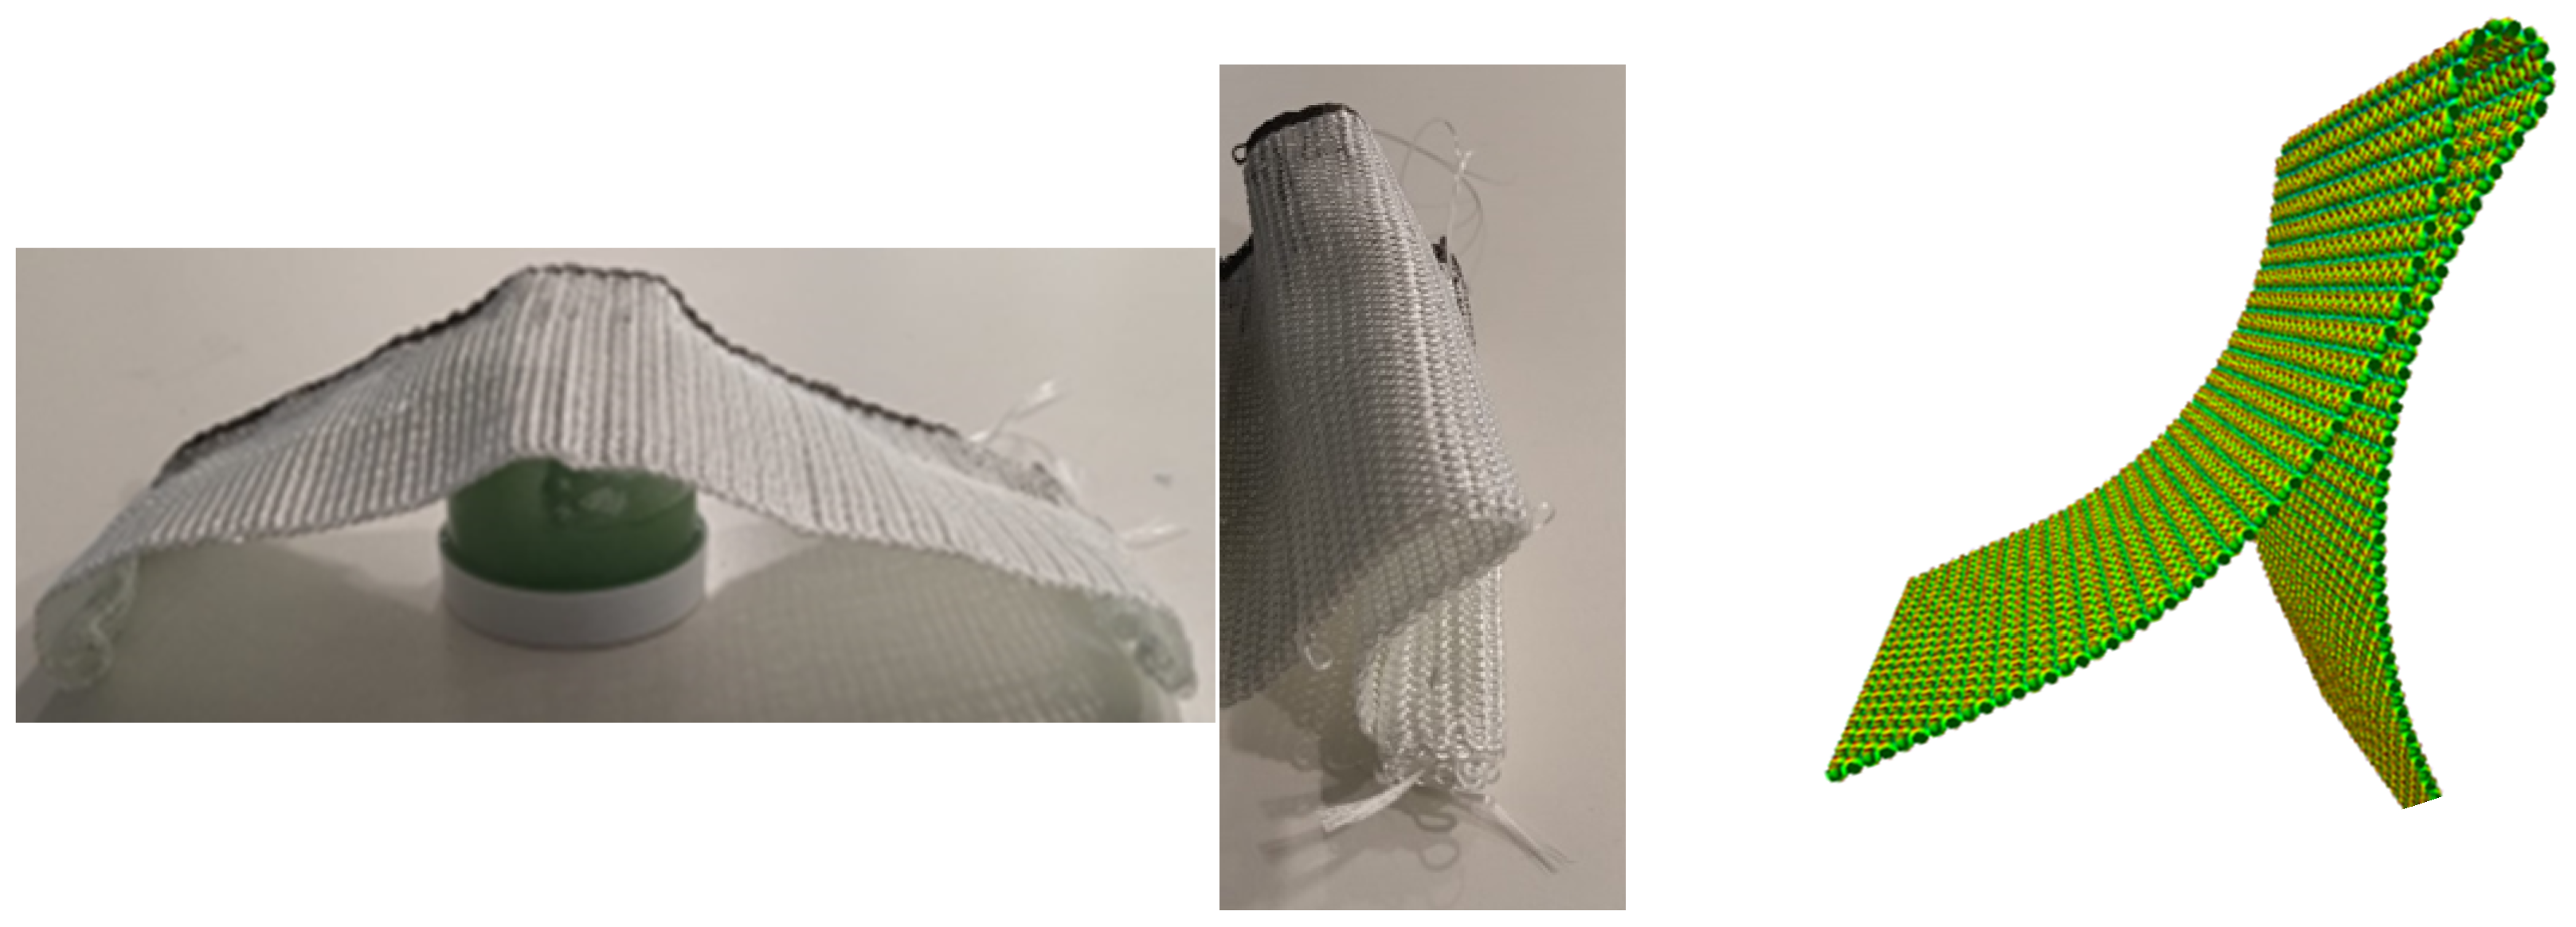
5.6. Penetration Test

We conclude the paper with a penetration test with a dense woven textile made of not very stretchable yarns. We do not want to specify the yarn’s material in order to demonstrate to the reader how relative the words “stiff”, “flexural”, and “stretchable” are. We start with a table, providing the basics for our modelling and computational algorithms, which are different for different regimes. We denote by ε the 1.5 yarn thickness in the vertical direction in Table 2. This table provides, for each textile with a known yarn thickness, the relation between the applied force and the yarn stiffness that determines the effective textile plate behaviour.
To illustrate this, we consider the penetration test in Figure 16, where a dense textile made of non-stretchable yarns, e.g., cotton or glass, is fixed on a table over a hole and then pressed into this hole using a spherical punch.
Figure 16 demonstrates that each textile undergoes different regimes under increasing applied load. Starting with a small strain and linear bending, it approaches the coupled stretching and bending in the Karman regime that implies wrinkling. In the next range of the applied force, one can see large bending effects at the boundary where the textile is fixed to the table. The loading finishes with the large membrane tension under the punch. This example demonstrates that the initially “stiff” textile behaves in the second stage, under a larger force, in the same way as a stretchable T-shirt textile under a much smaller load. This is an explanation of Figure 14, in which the weight of the simulated textile (which is the only loading, actuating the virtual experiment) was smaller than the load in the real experiment, where the textile was pressed into the form. So, to obtain a wrinkling and not just one fold, as in Figure 15, under one’s own weight in the draping of a positive sphere, one needs to choose a thinner textile with slightly stretchable yarns.

6. Conclusions

In the paper, a tool, TexMath, for the simulation of textiles on the yarn level was validated on examples of shear tests with several woven textiles with glass multifilament yarns or rovings. The assumption regarding the cross-sections, that they do not lose their heights under the tension in this test, was experimentally validated. All the input data for the simulation, the physical and structural properties of the yarns and textiles, were measured in the mechanical tests for all the woven textiles. Even the frictional properties between all the yarn pairs were measured and used in the simulations.
First, the wrinkling and locking of woven textiles in a shear experiment was investigated experimentally and simulated. It was shown that the textiles first slide and rotate with a little resistance till the yarns are locked. Then, the stiffness is increased.
In the next part of the paper, the hierarchical plate models are explained and generalised. This part was more general and theoretical. Finally, draping experiments were simulated and classified with respect to the yarn-textile properties. The folding of textiles was classified and shown in Table 2 and Figure 16.
In complex loading, an overlapping of the different mechanisms happens. However, by understanding how different parameters influence the folding or wrinkling, simulative tools can account for the correct models on all the details; e.g., the simulation tool TexMath [27] consists of different solvers, corresponding to the hierarchical textile models and draping. This tool allows for controlling and predicting textile behaviour by simulating the effects of different yarns, patterns, and boundary conditions.
Using those models and computational tools, designers can optimise material usage, reducing waste and enhancing performance, as in [30,31].

Author Contributions

Conceptualization, J.O. and S.B. (Sebastian Backes); methodology, J.O. and T.G.; software, D.N. and M.K.; validation, S.B. (Shantanu Bhat), M.K. and S.B. (Sebastian Backes); formal analysis, J.O.; investigation, J.O. and T.G.; resources, S.B. (Sebastian Backes) and K.S.; writing—original draft preparation, J.O.; writing—review and editing, M.K.; visualisation, D.N. and M.K.; supervision, J.O. and S.B. (Sebastian Backes); project administration, J.O. and S.B. (Sebastian Backes); funding acquisition, J.O. and T.G. All authors have read and agreed to the published version of the manuscript.

Funding

This research was funded by DFG, the German Research Foundation, grant number OR 190/10-1, in collaboration with the ITA textile institute at the Technical University of Aachen.

Data Availability Statement

The data that support the findings of this study are available within the article.

Acknowledgments

The Fraunhofer ITWM authors acknowledge the many-year collaboration with Georges Griso and his support in the analysis as well as the analysis work of PhD students Riccardo Falconi and Stephan Wackerle.

Conflicts of Interest

The authors declare no conflicts of interest.

References

  1. Vassiliadis, S.; Kallivretaki, E.; Domvoglou, D.; Provatidis, C. Mechanical Analysis of Woven Fabrics:The State of the Art. In Advances in Modern Woven Fabrics Technology; InTech: Rijeka, Croatia, 2011; pp. 41–64. [Google Scholar]
  2. Takano, N.; Uetsuji, Y.; Kashiwagi, Y.; Zako, M. Hierarchical modelling of textile composite materials and structures by the homogenization method. Model. Simul. Mater. Sci. Eng. 1999, 7, 207–231. [Google Scholar] [CrossRef]
  3. Kargar, M.; Payvandy, P.; Mozafary, V. Simulation of Draping Behavior of Woven Fabrics with an Optimized Yarn-Level Numerical Model. Fibers Polym. 2023, 24, 2503–2519. [Google Scholar] [CrossRef]
  4. Cirio, G.; Lopez-Moreno, J.; Miraut, D.; Otaduy, M.A. Yarn-level simulation of woven cloth. ACM Trans. Graph. 2014, 33, 1–11. [Google Scholar] [CrossRef]
  5. Kaldor, J.; James, D.; Marschner, S. Simulating knitted cloth at the yarn level. ACM Trans. Graph. 2008, 27, 1–9. [Google Scholar] [CrossRef]
  6. Provot, X. Deformation Constraints in a Mass-Spring Model to Describe Rigid Cloth Behavior. In Proceedings of the Graphics Interface, Quebec, QC, Canada, 17–19 May 1995. [Google Scholar]
  7. Baraff, D.; Witkin, A. Large steps in cloth simulation. In Proceedings of the Computer Graphics Proceedings, Orlando, FL, USA, 19–24 July 1998. [Google Scholar]
  8. Etzmuss, O.; Gross, J.; Strasser, W. Deriving a Particle System from Continuum Mechanics for the Animation of Deformable Objects. IEEE Trans. Vis. Comput. Graph. 2003, 9, 538–550. [Google Scholar] [CrossRef]
  9. Etzmuss, O.; Keckeisen, M.; Strasser, W. A fast finite element solution for cloth modelling. In Proceedings of the 11th Pacific Conference on Computer Graphics and Applications, Canmore, AB, Canada, 8–10 October 2003. [Google Scholar]
  10. Boisse, P.; Borr, M.; Buet, K.; Cherouat, A. Finite element simulations of textile composite forming including the biaxial fabric behavior. Compos. Part B Eng. 1997, 28, 453–464. [Google Scholar] [CrossRef]
  11. Böhm, H.; Zhang, H.; Gröger, B.; Hornig, A.; Gude, M. Characterization and Numerical Modelling of Through-Thickness Metal-lic-Pin-Reinforced Fibre/Thermoplastic Composites under Bending Loading. J. Compos. Sci. 2020, 4, 188. [Google Scholar] [CrossRef]
  12. Cioranescu, D.; Damlamian, A.; Orlik, J. Two-scale analysis for homogenization of multi-scale contact problems in elasticity. Asymptot. Anal. 2013, 82, 201–232. [Google Scholar]
  13. Cherif, C. Drapierbarkeitssimulation von Verstärkungstextilien für den Einsatz in Faserverbundkunststoffen mit der Finite-Elemente-Methode; Shaker: Aachen, Germany, 1999. [Google Scholar]
  14. Wriggers, P. Computational Contact Mechanics; Springer: Berlin/Heidelberg, Germany, 2006. [Google Scholar]
  15. Zavarise, G.; Wriggers, P. Contact with friction between beams in 3-d space. Int. J. Numer. Methods Eng. 2000, 49, 977–1006. [Google Scholar] [CrossRef]
  16. Barbagallo, G.; Madeo, A.; Azehaf, I.; Giorgio, I.; Morestin, F.; Boisse, P. Bias extension test on an unbalanced woven composite reinforcement: Experiments and modeling via a second gradient continuum approach. J. Compos. Mater. 2016, 51, 153–170. [Google Scholar] [CrossRef]
  17. Boisse, P.; Hamila, N.; Madeo, A. The difficulties in modeling the mechanical behavior of textile composite reinforcements with standard continuum mechanics of Cauchy. Some possible remedies. Int. J. Solids Struct. 2018, 154, 55–65. [Google Scholar] [CrossRef]
  18. Durville, D. Modeling frictional contact interactions in fibre assemblies. In Proceedings of the 3rd International Conference on Computational Contact Mechanics, Lecce, Italy, 10–12 July 2013. [Google Scholar]
  19. Bare, D.; Orlik, J.; Panasenko, G. Asymptotic dimension reduction of a Robin-type elasticity boundary value problem in thin beams. Appl. Anal. 2013, 93, 1217–1238. [Google Scholar] [CrossRef]
  20. Griso, G.; Orlik, J.; Wackerle, S. Asymptotic behavior for textiles. SIAM J. Math. Anal. 2020, 52, 1639–1689. [Google Scholar] [CrossRef]
  21. Orlik, J.; Falconi, R.; Griso, G.; Wackerle, S. Asymptotic behavior for textiles with loose contact. Math. Methods Appl. Sci. 2023, 46, 17082–17127. [Google Scholar] [CrossRef]
  22. Orlik, J.; Andrä, H.; Argatov, I.; Staub, S. Does the weaving and knitting pattern of a fabric determine its relaxation time? Q. J. Mech. Appl. Math. 2017, 70, 337–361. [Google Scholar] [CrossRef]
  23. Orlik, J.; Krier, M.; Neusius, D.; Pietsch, K.; Sivak, O.; Steiner, K. Recent efforts in modeling and simulation of textiles. Textiles 2021, 1, 322–336. [Google Scholar] [CrossRef]
  24. Wackerle, S.; Orlik, J.; Hauck, M.; Lykhachova, O.; Steiner, K. The Way to Design a Textile with Required Critical Folding Deformation. Procedia Manuf. 2020, 47, 174–181. [Google Scholar] [CrossRef]
  25. Shiryaev, V.; Orlik, J. A one-dimensional computational model for hyperelastic string structures with Coulomb friction. Math. Methods Appl. Sci. 2017, 40, 741–756. [Google Scholar] [CrossRef]
  26. Falconi, R.; Griso, G.; Orlik, J. Asymptotic behavior for nonlinear textiles with glued yarns. Anal. Appl. 2024. accepted for publication. [Google Scholar] [CrossRef]
  27. Orlik, J.; Neusius, D.; Steiner, K. Modelling and Simulation of Technical Textiles by TexMath. Fraunhofer Institute for Industrial Mathematics. 2023. [Online]. Available online: https://www.itwm.fraunhofer.de/de/abteilungen/sms/produkte-und-leistungen/texmath.html (accessed on 3 December 2024).
  28. Griso, G.; Orlik, J.; Wackerle, S. Asymptotic behavior for textiles in von-Kármán regime. J. Math. Pures Appl. 2020, 144, 164–193. [Google Scholar] [CrossRef]
  29. Griso, G.; Khilkova, L.; Orlik, J.; Sivak, O. Homogenization of perforated elastic structures. J. Elast. 2020, 141, 181–225. [Google Scholar] [CrossRef]
  30. Orlik, J.; Panasenko, G.; Shiryaev, V. Optimization of textile-like materials via homogenization and beam approximations. Multiscale Model. Simul. 2016, 14, 637–667. [Google Scholar] [CrossRef]
  31. Wackerle, S.; Pinnau, R.; Orlik, J. Optimization of buckling for textiles. In Progress in Industrial Mathematics at ECMI; Springer: Budapest, Hungary, 2018. [Google Scholar]
Figure 1. Different nature of wrinkling and folding; simulations using TexMath V 1.5.0 software.
Textiles 04 00034 g001
Figure 2. Weaving patterns: canvas, twill (2/2) and satin (1/7).
Textiles 04 00034 g002
Figure 3. Effective cross-sections measured using electron microscopy.
Textiles 04 00034 g003
Figure 4. Shear frame test.
Textiles 04 00034 g004
Figure 5. Change in the cross-section and length of yarns in the woven fabrics during the shear test.
Textiles 04 00034 g005
Figure 6. Comparison between the experimental and simulation results for different textile fabrics for Canvas 80 g, 160 g, and 280 g.
Textiles 04 00034 g006
Figure 7. Comparison between the experimental and simulation results for different textile fabrics for (a) twill 160 g; (b) twill 280 g; and (c) satin 296 g.
Textiles 04 00034 g007aTextiles 04 00034 g007b
Figure 8. Dense, simple, woven textile with isotropic and anisotropic pre-strain in yarns.
Textiles 04 00034 g008
Figure 9. Uniaxial tension experiment: (1) example of the textile structure’s influence on the Poisson effect in a simple weave, reasoned by a 1122 h o m , (2) example of arising buckling under tension in a twill weave, reasoned by non-zero b 1122 h o m .
Textiles 04 00034 g009
Figure 10. Influence of friction: (1) large friction between yarns, (2) no friction, free sliding on contacts, (3) experiment.
Textiles 04 00034 g010
Figure 11. Simulation and a similar fold building in an experiment. The colours left denote the height and in the right figure do not matter.
Textiles 04 00034 g011
Figure 12. Positive and negative shapes of the punch.
Textiles 04 00034 g012
Figure 13. Draping with a glass-fibre woven under just its own weight and its large bending, with its digital twin simulated using TexMath.
Textiles 04 00034 g013
Figure 14. Influence of the boundary conditions on the draping of textiles in the bending regime.
Textiles 04 00034 g014
Figure 15. Draping with a stretchable textile in the large membrane regime. (Left) Simulation with TexMath. (Right) An optimised knitted mask from the company Myant (Mississauga, ON, Canada).
Textiles 04 00034 g015
Figure 16. Penetration test with a woven fabric. Simulated (blue) vs. experimental (red) curves. Different plate regimes with force evolution.
Textiles 04 00034 g016
Table 1. Textile and effective yarn parameterisation.
Type of
Woven
Yarn’s Cross-Sectional Area [mm²]Yarn’s E-Modulus
[GPa]
Yarn
Diameter
[mm]
Weaving
Distance
[mm]
Friction
Coefficient [1]
Canvas 80 g0.0331.3330.20.580.3
Twill 80 g0.0333.2830.20.550.31
Canvas 160 g0.0532.8870.240.410.26
Twill 160 g0.0627.2220.290.470.3
Canvas 280 g0.1236.7090.390.610.4
Twill 280 g0.1332.8040.410.720.28
Satin 296 g0.0532.6670.250.250.34
Table 2. Hierarchical textile models.
Strain Normalised   Force   Magnitude ,   f ε / E 2D-Plate Model
e u < ε 2 f ε , 3 E = ε 3 f 3 Kirchhoff plate
e u ~ ε 2 f ε , α E = ε 2 f α ,     α = 1,2 Karman plate
e ( u ) ~ ε 1 f ε , 3 E = ε f 3 Large bending deformation
e ( u ) ~ O 1 f ε , α E = ε 0 f α ,     α = 1,2 Large membrane deformation
Disclaimer/Publisher’s Note: The statements, opinions and data contained in all publications are solely those of the individual author(s) and contributor(s) and not of MDPI and/or the editor(s). MDPI and/or the editor(s) disclaim responsibility for any injury to people or property resulting from any ideas, methods, instructions or products referred to in the content.

