Article

Process Optimization Using Experimental and Statistical Modeling in Biodiesel Production from Palm Oil

1
Department of Mechanical Engineering, Cooch Behar Government Engineering College, Cooch Behar 736170, West Bengal, India
2
Department of Chemistry and Environmental Science, New Jersey Institute of Technology, Newark, NJ 07102, USA
*
Author to whom correspondence should be addressed.
Physchem 2025, 5(4), 52; https://doi.org/10.3390/physchem5040052
Submission received: 3 July 2025 / Revised: 7 September 2025 / Accepted: 3 November 2025 / Published: 20 November 2025
(This article belongs to the Section Theoretical and Computational Chemistry)

Abstract

The optimization of biodiesel production through experimental design and statistical modeling carries significant industrial and economic benefits. The utilization of Response Surface Methodology (RSM) and statistical modeling permits accurate manipulation of the crucial process parameters. In this work, a statistical model was effectively applied to optimize two major process parameters (namely reaction time and reaction temperature) for the production of biodiesel during the transesterification of palm oil. The transesterification of palm oil was studied using experiments designed through RSM to determine the optimal reaction conditions. Based on the statistical model generated by RSM, the optimal parameters for maximizing methyl ester yield were identified as a reaction time of 343 min and a temperature of 58.3 °C. Under these conditions, the model predicted a methyl ester yield of 83.57%. Experimental validation under the same conditions resulted in a yield of 83.80%, closely aligning with the predicted value and confirming the model’s reliability.

1. Introduction

Energy is indispensable for meeting our daily fundamental necessities. Fossil fuel reserves, one of the major energy resources, are decreasing sharply on a day-to-day basis. The shortage of fossil fuel, the rising energy costs associated with it, and its impact on the environment are steering the search for alternative green energies [1,2,3]. Biofuel is a sustainable energy resource known as an alternative to conventional fuels. Recently, there has been increasing interest in the research and development of improved and efficient transesterification-based reaction methods for biodiesel production from edible and non-edible oils, which are capable of mitigating the energy crisis and maintaining a balanced environmental footprint [4,5,6,7].
Biodiesel can be obtained from vegetable oil or animal fats through a transesterification reaction using primary alcohols in the presence of an acid, alkali, or enzyme as a catalyst [8,9,10]. Considering the process economy, base-catalyzed transesterification stands out to be the best among the various available options [11,12,13]. However, its applications are limited only to the case of feedstock containing low amounts of free fatty acids [14,15,16]. The first biodiesel produced from palm oil was developed in 1937, when a Belgian patent was granted to Chavanne by the University of Brussels for a “Procedure for the transformation of vegetable oils for their uses as fuels” [17,18,19]. Nowadays, it is commonly produced in countries like America, Germany, France, Italy, Australia, Brazil, Argentina and Malaysia, where there are numerous fuel stations selling biodiesel blends along with other grades of fuels [20]. Recent years have seen many government programs implementing and mandating the selling of fuels as appropriate biodiesel blends [21,22].
The optimization tool is an essential criterion these days for its extensive use in industrial areas. A computational analysis reduces the incurred costs and saves time. It provides a prediction about the nature of the experimental investigation. Response surface methodology (RSM) is an effective statistical method that has been used for the optimization of process parameters in chemical reactions [23,24,25,26].
A number of studies have been conducted in recent years in optimizing the process parameters for transesterification reactions. Silitonga et al. [27] optimized four process parameters (methanol/oil ratio: 0.60, potassium hydroxide catalyst concentration: 0.84 (w/w), stirring speed: 800 rpm, and reaction time: 388 s) in the microwave-assisted transesterification of Ceibapentandra biodiesel using the cuckoo search (CS) algorithm in extreme learning machine (ELM). Under the process, using the optimized conditions, the achievement of a maximum ester yield of 96.19% with an average ester yield of 95.42% was reported. Aslan and Eryilmaz [28] applied the polynomial regression method (PRM) for a comprehensive comparative investigation on the yield maximization of alkyl (methyl as well as ethyl) ester using alkali (sodium as well as potassium) hydroxide catalyst from black mustard seed oil, considering catalyst quantity, alcohol amount, reaction temperature, and reaction time as the reaction parameters. Particular concentrations of ethanol–potassium–hydroxide combinations exhibited a minimum yield of 96.229% ester, whereas another particular concentration of methanol–potassium–hydroxide combinations showed a maximum yield of 97.335% ester, according to their report.
Reports on the comparative combined application of response surface methodology (RSM) and artificial neural networks (ANNs) are also available [29], in which targeted synthesis of biodiesel from rubber seed oil using calcined eggshells as a heterogeneous catalyst has been conducted; ANN showed better results based on quantified analysis for continuous production. Zhang et al. [30] reported the maximum yield of 97.65% palm oil methyl ester while carrying out methanolysis using a NaAlO2/γ-Al2O3 heterogeneous nanocatalyst. The catalyst activity was noticeably retained, as a 93.29% ester yield was reported for the sixth reused cycle.
Recent advancements in process optimization for biodiesel production from palm oil have led to the significant integration of experimental designs and statistical modeling techniques. These methodologies aim to enhance biodiesel yield, reduce costs, and improve sustainability [31].

1.1. Experimental Design and Statistical Modeling Techniques

  • Response Surface Methodology (RSM): RSM remains a cornerstone in optimizing biodiesel production. Techniques such as Central Composite Design (CCD) and Box–Behnken Design (BBD) are extensively used to model the effects of variables such as catalyst concentration, methanol-to-oil ratio, and reaction time. Studies have demonstrated that RSM can achieve biodiesel yields exceeding 90% from palm oil feedstocks [32,33,34].
  • Machine Learning Approaches: Machine Learning (ML) models, including Artificial Neural Networks (ANNs), Adaptive Neuro-Fuzzy Inference Systems (ANFISs), and ensemble methods like AdaBoost, have been employed to predict and optimize biodiesel production. For instance, AdaBoost regression has shown high accuracy in modeling biodiesel yield and free fatty acid conversion, offering a promising alternative to traditional methods [35,36].
  • Hybrid Modeling Techniques: Combining RSM with ML algorithms enhances predictive accuracy and process optimization. For example, integrating ANN with RSM has been utilized to model biodiesel production from palm oil, improving yield predictions and process understanding [37,38].

1.2. Feedstock Considerations and Process Optimization Strategies

While palm oil is a primary feedstock, alternative sources such as waste cooking palm oil (WCPO) are gaining attention due to sustainability concerns. Studies have applied RSM to optimize biodiesel production from WCPO, achieving high yields with novel catalysts like sulfonated palm seed cake (SO3H-PSC).
Optimization efforts focus on maximizing biodiesel yield while minimizing energy consumption and environmental impact. Techniques such as Definitive Screening Design (DSD) combined with ANN have been used to achieve biodiesel yields up to 96.06%, along with significant reductions in engine emissions and vibrations, indicating a holistic approach to process and performance optimization [39].

1.3. Future Directions

  • Integration of Computational Tools: Utilizing software like Design-Expert and Statistica for data analysis and model validation.
  • Advanced Hybrid Models: Developing more sophisticated hybrid models combining RSM, ML, and optimization algorithms to further enhance prediction accuracy.
  • Sustainability Metrics: Incorporating environmental and economic assessments into optimization models to promote sustainable biodiesel production practices.
Thus, the field of biodiesel production from palm oil has evolved with the incorporation of advanced experimental designs and statistical modeling techniques. These advancements contribute to more efficient, cost-effective, and sustainable biodiesel production processes.
In the present work, an analytical validation of experimental results on the effects of selected reaction parameters, such as reaction temperature (T) and reaction time (t), for transesterification (methanolysis) of palm oils was performed using response surface methodology to predict the optimal reaction conditions for methyl ester synthesis. A (22) factorial central composite design was selected for conducting the optimization. The analysis of variance and optimization procedure is discussed in detail in the appropriate sections. This work concludes with the results obtained from the analysis.

2. Experimental Configuration and Procedures

In this experiment, palm oil (Oil Palm India Limited, Kottayam, Kerala, India) was used for transesterification to create alkyl ester, commonly known as biodiesel. A 250 mL three-necked round bottom flask was used as the reaction chamber, where the feedstock and the methyl alcohol (CDH Pvt. Ltd., New Delhi, India) reacted. A schematic diagram of the reactor setup is shown in Figure 1. The flask was mounted on a temperature-controlled hot plate with a magnetic stirrer. A small magnetic bar was used to ensure proper mixing of the oil and the alcohol. A 500 mm spiral rod glass condenser was utilized to condense the vaporized alcohol and a thermometer was used to monitor the reaction temperature. Sodium hydroxide (NaOH) was selected as the catalyst due to its easy availability. NaOH pellets, isopropyl alcohol, phenolphthalein indicator and other reagent grade chemicals are procured from Segma sales (Silchar, Assam, India). A conventional experimental approach was followed. Transesterification is a temperature-dependent process. Lower temperatures reduce molecular collisions and kinetic energy, slowing down the reaction rate. Elevated temperature favors reaction rate. However, at elevated temperature alcohol evaporates and comes out of the reaction phase. A reflux system in Soxhlet apparatus fitted with a condenser was used to avoid evaporation loss of alcohol from the reaction mixture at elevated temperature. Some experimental test runs were conducted to monitor the reaction temperature and reaction time. The parameters were recorded during the conduction of experiments.

2.1. Design Computation of the Model

A Central Composite Design (CCD) model was used to study the property of predetermined independent variables, counting the reaction temperature (T) and reaction time (t), on the yield of methyl esters produced by transesterification of palm oil. The experiments were conducted randomly to avoid noise or errors. For a two-variable central composite design, a total of 13 runs were generated. These thirteen (13) runs included five (5) at the center point, four (4) at the factorial point, and another four (4) at the axial point.
Initially, a first-order model of the form shown in Equation (1) was adopted:
y = βo + (β1·T) + (β2·t)
where y is denoted as the response variable (% methyl esters of palm oil) and βo, βi (where i = 1, 2, .... so on) are denoted as the regression coefficients. The percentages of methyl esters produced in the palm oil transesterification with the aid of methanol under a combination of different reaction conditions were obtained. Considering those initial working conditions, regression analysis was performed to obtain a relation between the individual parameters.

2.2. Nomenclatures/Interpretations of Statistical Terminologies

  • F-value is the ratio of variance between group means to the variance within the groups. value is a key statistic in Analysis of Variance (ANOVA), used to determine whether there are significant differences between the means of three or more groups. A large F-value suggests that at least one group mean significantly differs from the others. A small F-value implies the group means are similar, and observed differences are likely due to chance.
  • p-value is a statistical metric used to evaluate the strength of evidence against the null hypothesis in hypothesis testing. It reflects the probability of obtaining results as extreme as those observed, assuming the null hypothesis is true. A p-value < 0.05 typically indicates statistical significance, leading to rejection of the null hypothesis. On the other hand, p-value > 0.05 suggests insufficient evidence to reject the null hypothesis (example: a p-value of 0.03 in a comparison between two treatments implies a 3% chance that the observed difference is due to random variation, indicating a statistically significant effect).
  • Box–Cox Plot: A graphical tool to identify the optimal λ that best normalizes the data by maximizing the log-likelihood function. The Box–Cox transformation is a technique used to stabilize variance and make data more normally distributed.
  • λ (Lambda): Determines the power to which data is transformed, with λ = 1 for No transformation, λ = 0 for Log transformation, λ = 0.5 for Square root transformation, and λ = −1 for Reciprocal transformation. If the confidence interval for λ includes 1, transformation is not required. Or else if λ significantly differs from 1, transformation is recommended to improve normality.
These statistical tools are essential for hypothesis testing, model validation, and data transformation, ensuring robust and reliable analysis outcomes.

3. Results and Discussions

The experimental percentage of ester yield in a dissimilar experimental run is shown in the second column of Table 1. A factorial combination representing the center point had a temperature of 45 °C and reaction time of 45 min. Applying the F-test of the first-order model showed the significance of pure quadratic terms, indicating that the first-order model was not sufficient to provide appropriate results. From this observation, the path of the steepest-descent was established and the design of the experiment was adjusted accordingly. It was also recognized that the maximum yield point would occur when a step size for 15 min reaction time was accompanied with 0.71 °C change in temperature; however, due to experimental limitations, 0.71 °C was considered as equivalent to 1 °C.
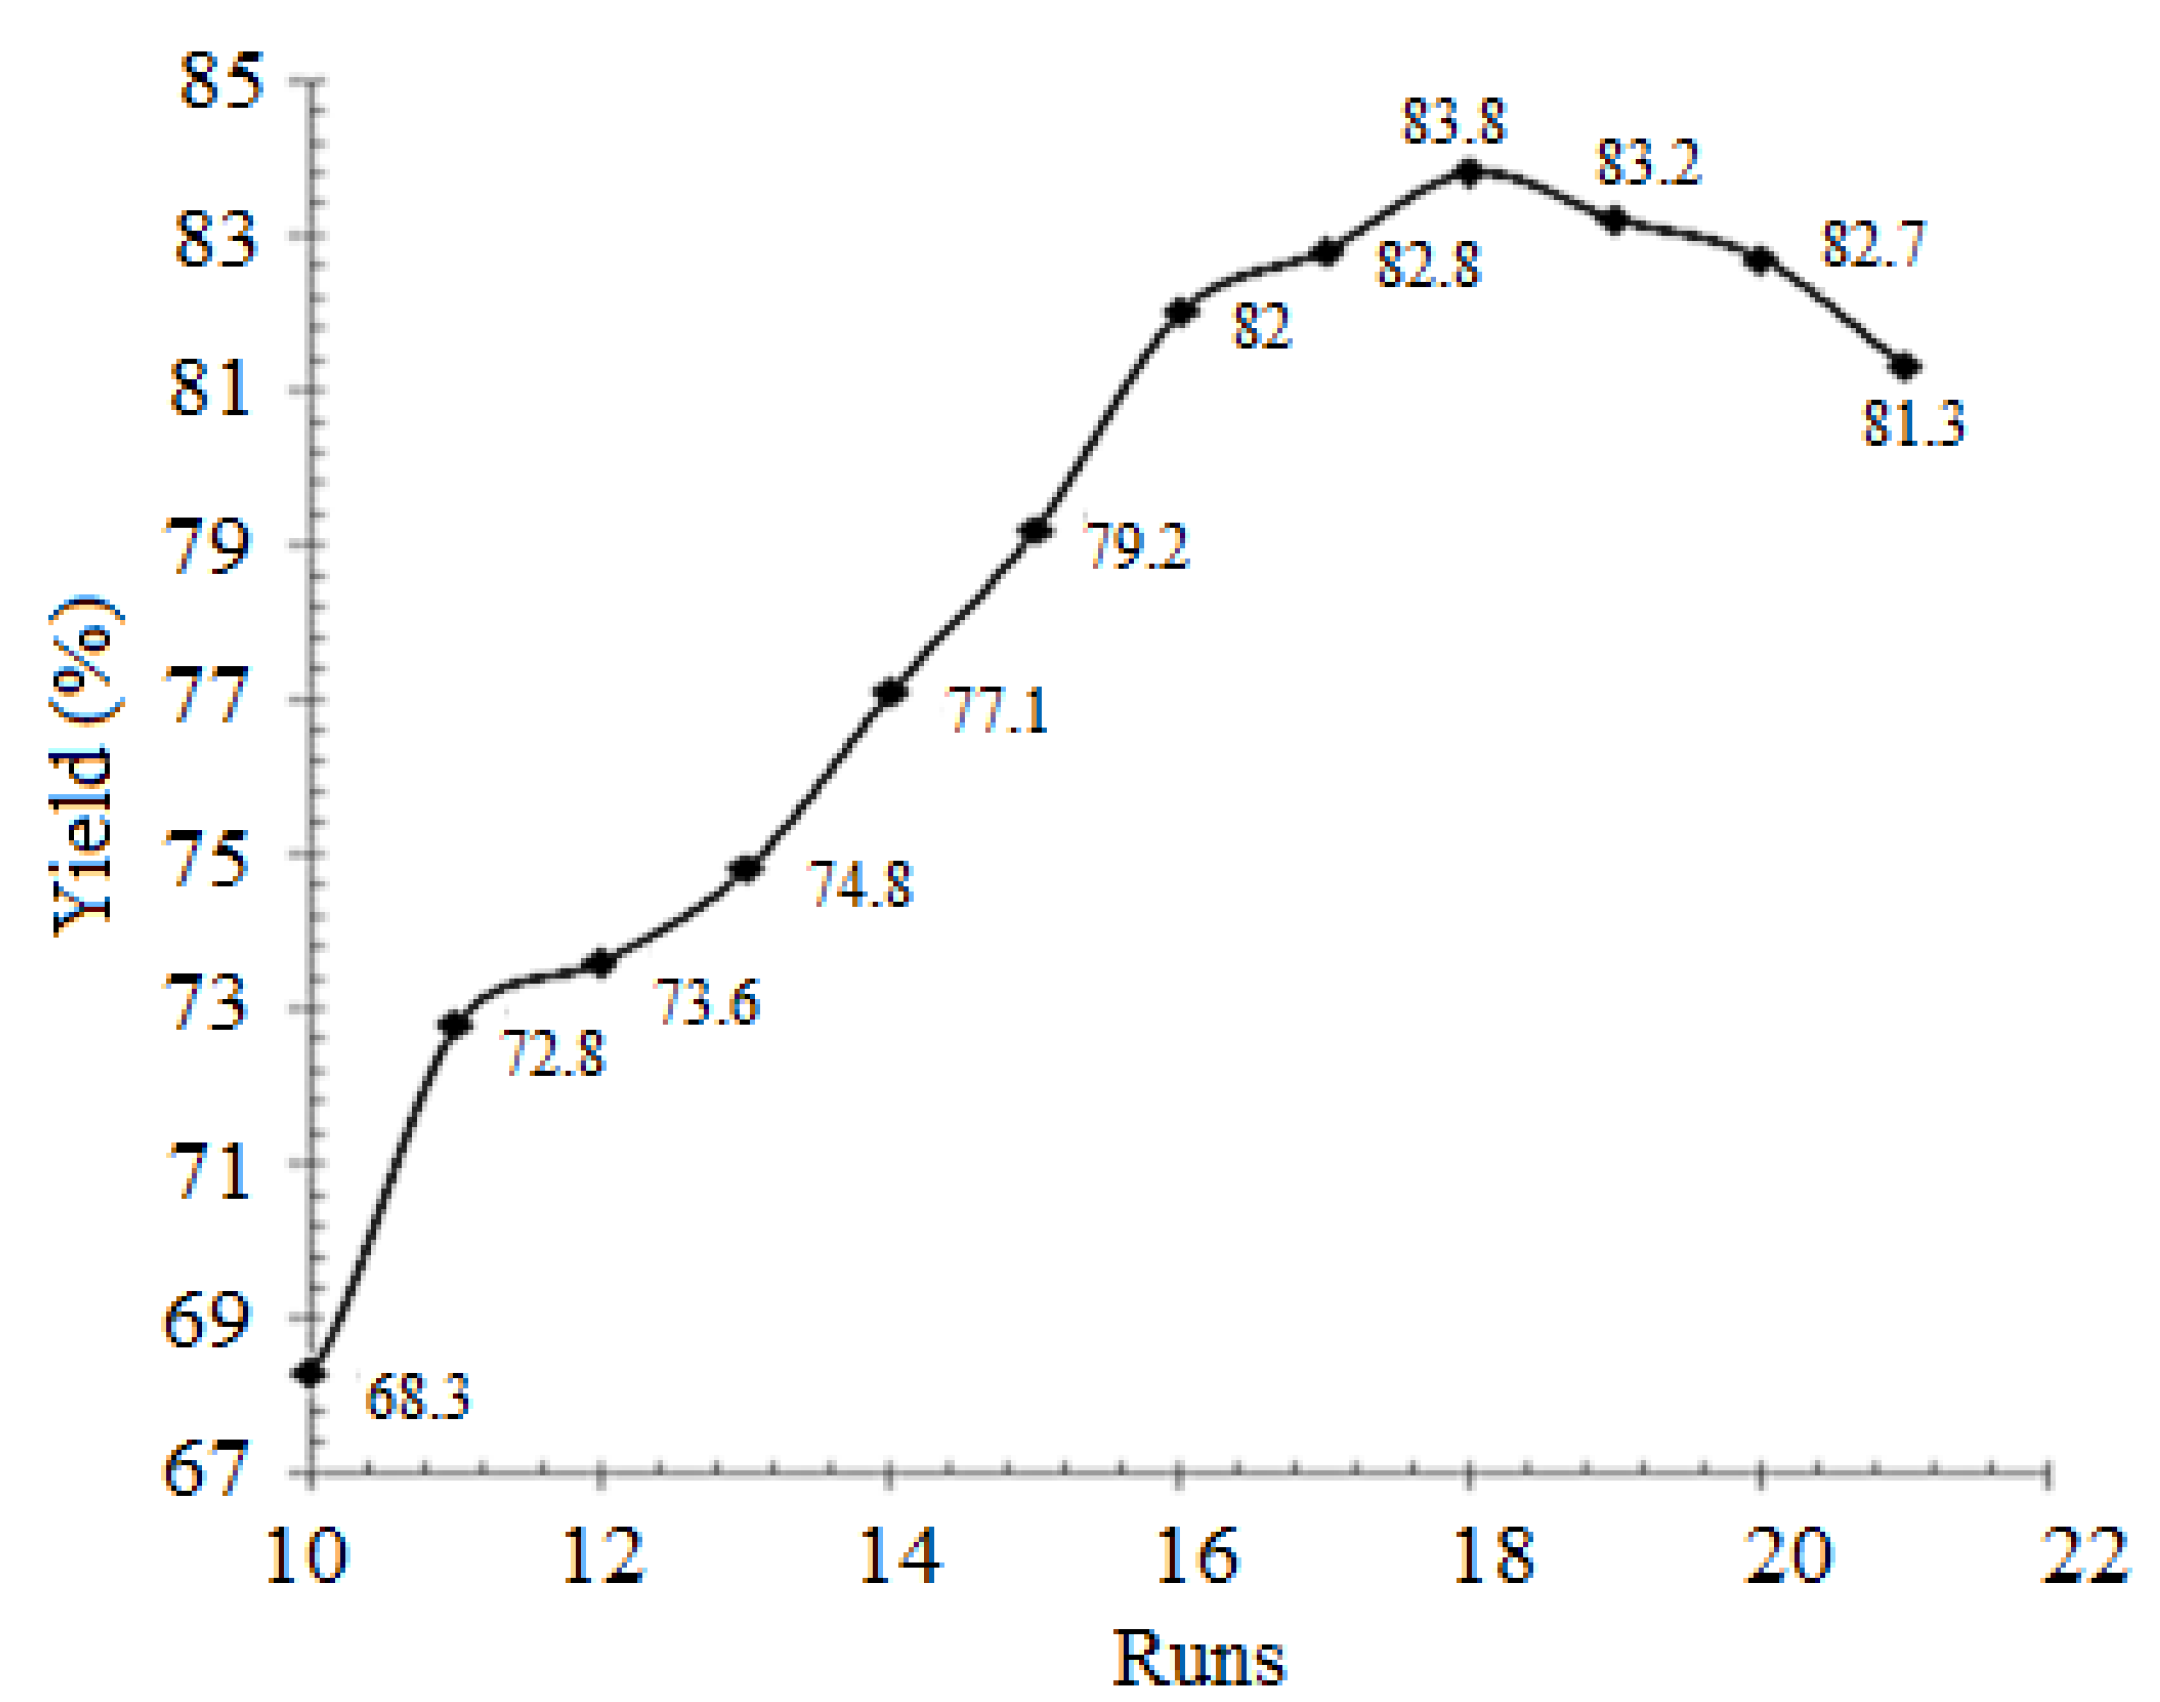
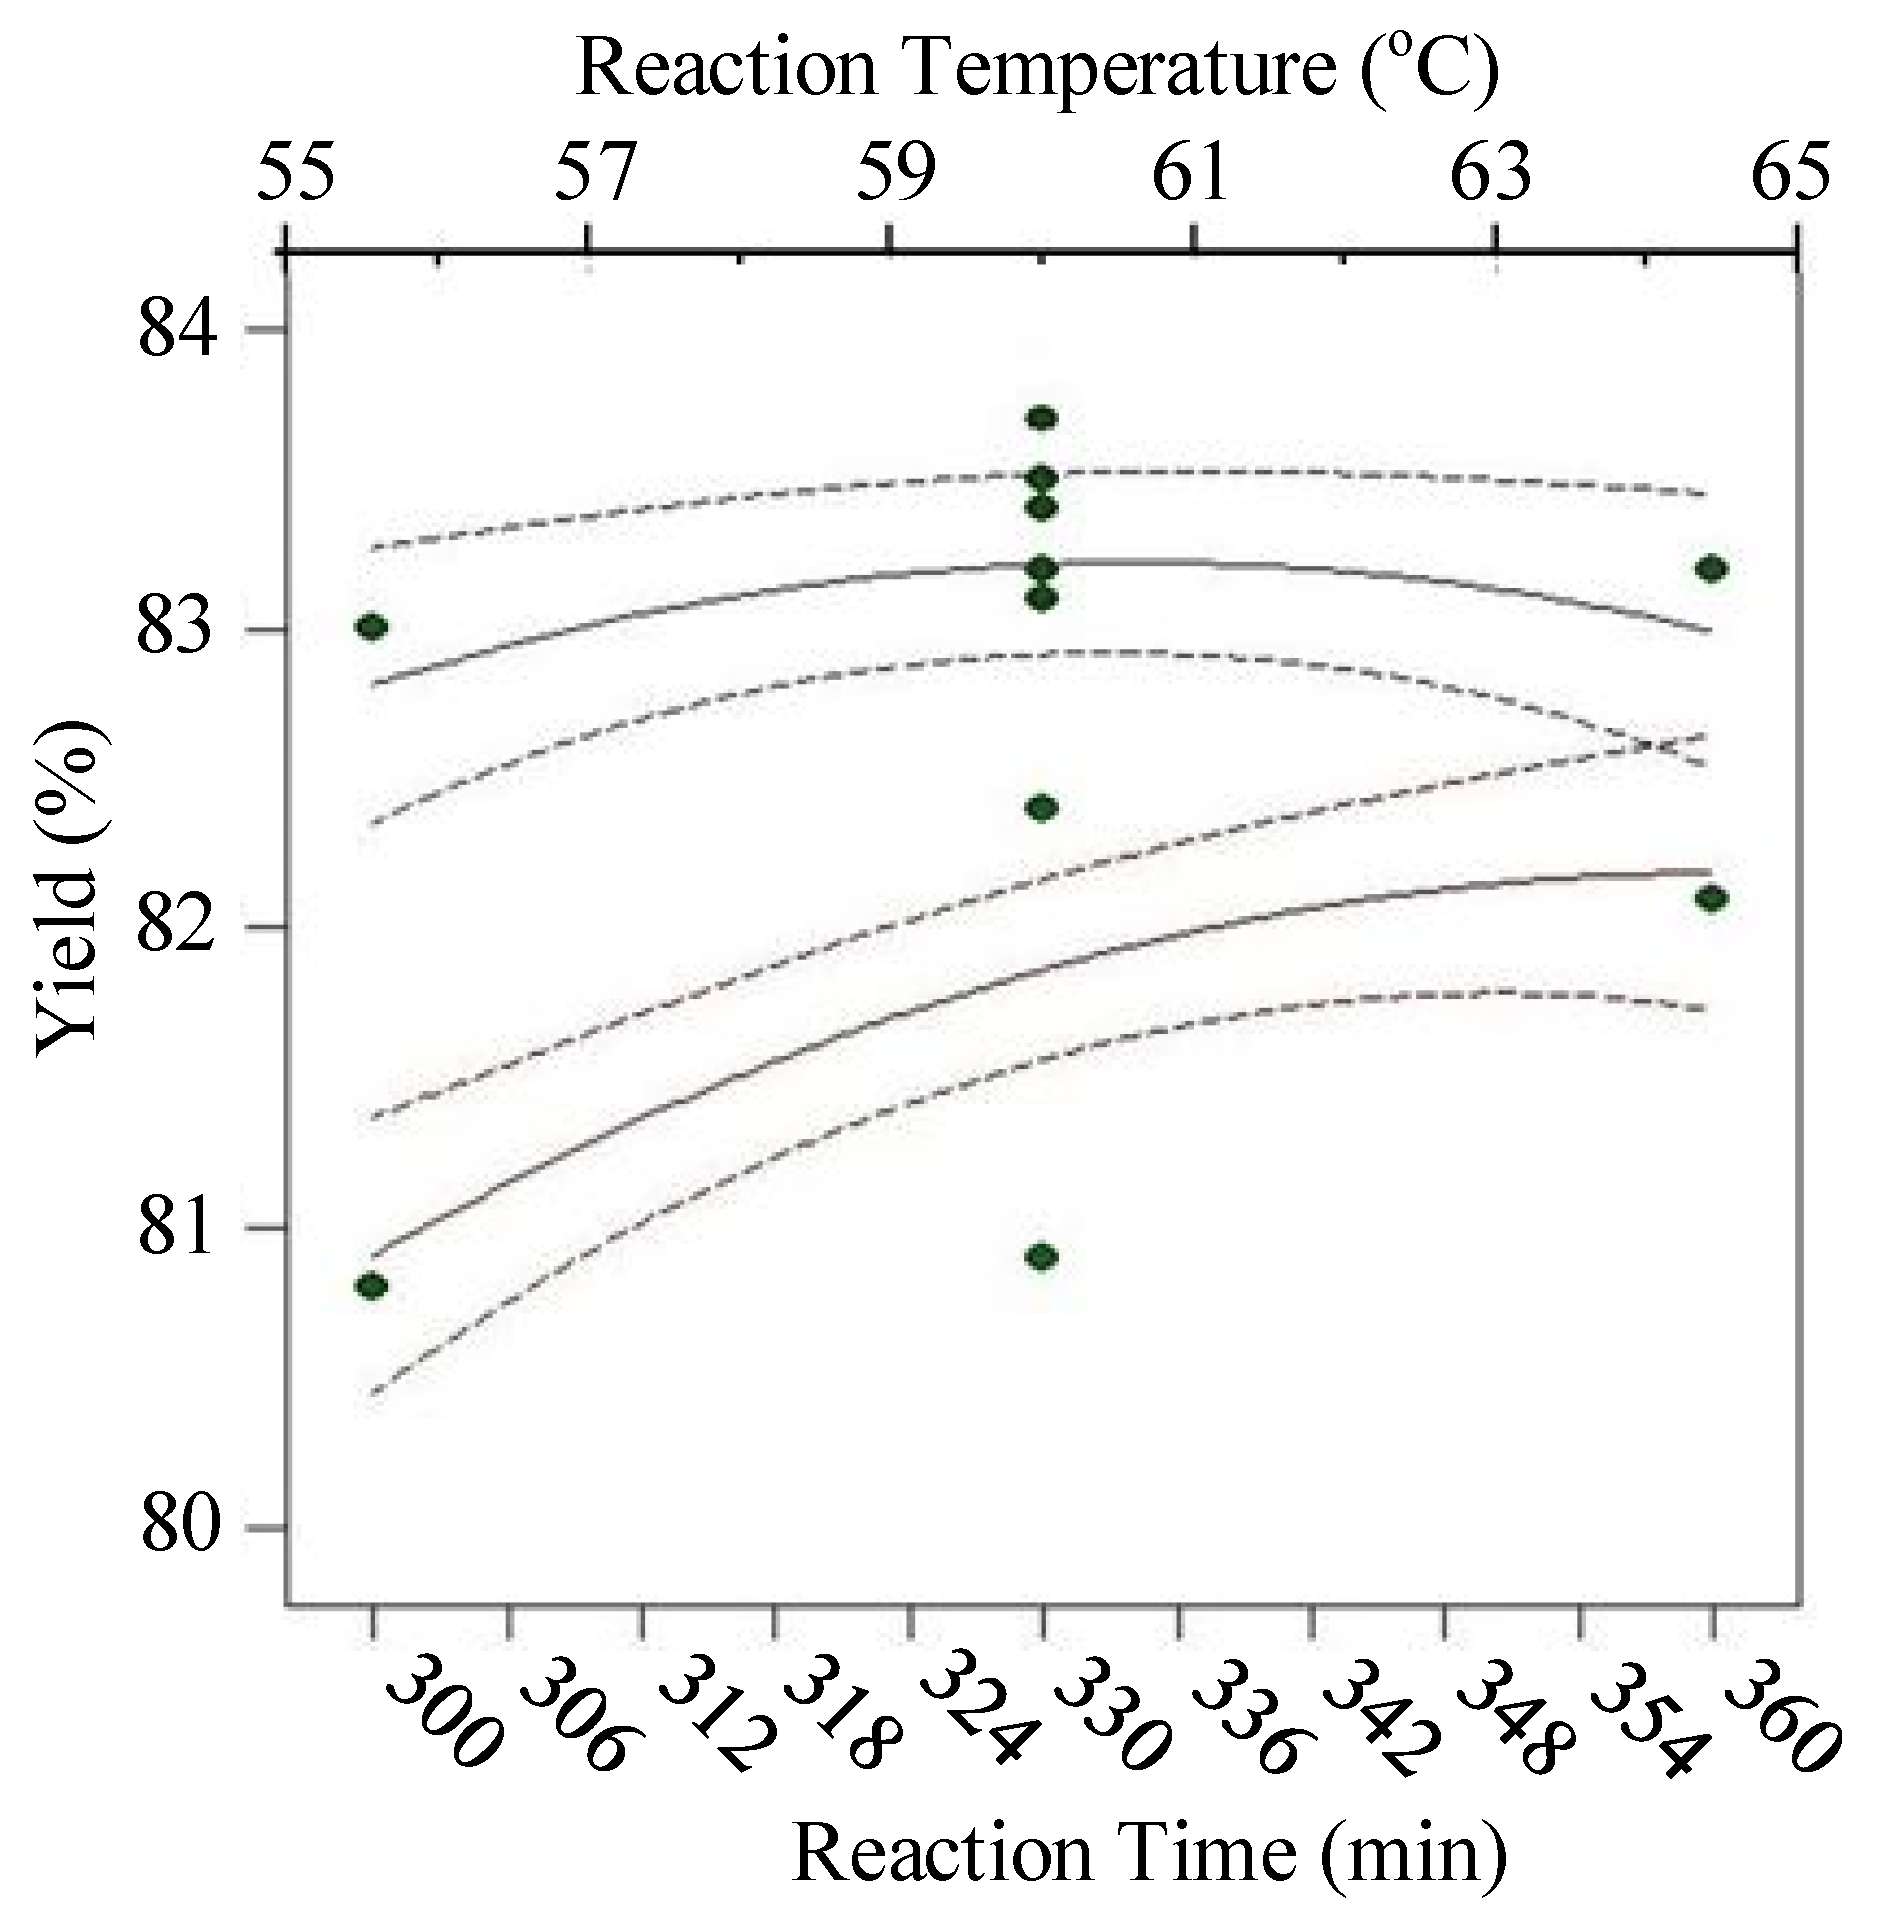
According to the experimental design, it was observed that the yield remains constant after reaching a certain point. As can be seen in Figure 2, at 330 min and 60 °C, ester yield attained a value of 83.8%. To find the maximum yield point, further investigation was required; therefore, a central composite design was employed to study this region. The new center point was set at 330 min and 60 °C in temperature. The low and high levels of temperature was set at 55 °C and 65 °C, and for time at 300 min and 360 min, respectively. A total of 13 runs were conducted, including 5 runs at the center point. These data were further analyzed to determine the optimum condition.
For comparative purposes, the predicted y values (percentage yield ethyl esters) from Equation (1) are listed in Table 1, and it is evidenced that the values agree well with experimental data. The impact of removing a particular observation is measured by Cook’s distance, a commonly used estimate of the influence of a data point in least-squares regression analysis. Cook’s distance is based on the sum of the differences for each observation between the predicted response using the full data set and the predicted response using the “leave one observation” set. It is believed that the analysis requires a closer look at points with a large Cook distance [40].
The regression model residual divided by the adjusted standard error yields the Studentized residual. Additionally, residuals can be calculated by subtracting the observed target value for each row of data from the target value predicted by the regression model. In a regression model, the differences between observed and predicted target values can be compared across a range of predictor values to Studentized residuals. To determine the residual size, they can also be compared with established distributions [41,42].
The optimum condition of all the data obtained is given in Table 2. The response surface analysis showed that the variables tested, time and temperature, had significant effects (significance level p < 0.05) on the response (% alkyl esters). Optimal synthetic conditions were set to be in the range from 300 min at 55 °C to 360 min at 65 °C by canonical analysis and resulted in the stationary point (central point) given in Table 2.

4. Statistical Modeling on the Experimental Results

The model was evaluated using the sum of squares value, and a quadratic model was selected with degree-of-freedom (DOF)-2, an F-value of 43.13 and a p-value of 0.0001. An F-value of the model being 43.13 implies that the model is significant and there is only 0.01% possibility that this value could occur due to noise. Similarly a, p-value below 0.0500 indicates that the model terms are significant. In this case, the parameters of temperature and time are the model provisions. The lack of fit testing produced an F-value of 1.14, which implies that the lack of fit is irrelevant in this case. There is only a 0.13% chance that a lack of fit value this small could occur due to noise. A significant lack of fit is not desirable, as the model must fit, and hence the model with inconsequential lack of fit is customary. The summary statistics of the model were also tested, where the value of standard deviation was low, and the model exhibited a high coefficient of determination (R2 = 0.9321), which is in reasonable agreement with a predicted R2 of 0.8369. The tests exhibited significant values of sum of squares, F-value, p-value, and degree of freedom for a quadratic model, justifying its selection. The chosen model showed an insignificant lack of fit, making it appropriate for further investigation.
The regression (R2 = 0.9321) equation to fit the experimental data and that yielded the estimated regression coefficients is shown in Equation (2).
y = 35.27006 + 0.13314 t + 3.29147 T + 0.0018333 t T 0.00035 t 2 0.0336 T 2
Analysis of Variance (ANOVA) tools were used, which showed that the quadratic model is significant, with an F-value of 33.94 and a p-value of 0.0001. This implies that there is a 0.01% chance this F-value could occur due to noise. A p-value less than 0.0500 indicates that the model terms are insignificant. In this case, the parameters of time, temperature, and their square terms are significant. F-values greater than 0.1000 indicate that the model term is insignificant and entail improvement to the model. The product of time and temperature term showed a p-value of 0.0602; therefore, further improvement is not required, and the variation in this term has a negligible effect on the response. The lack of fit value of 1.14 indicates that the lack of fit is not significant relative to pure error, and there is a 43.47% chance that such a large lack-of-fit value could occur due to noise. An insignificant lack of fit is desirable. Passable precision course is defined by the signal-to-noise ratio. The ratio 15.806 shows that the signal is passable and the noise is negligible. The value of passable precision that is greater than four is considered desirable.
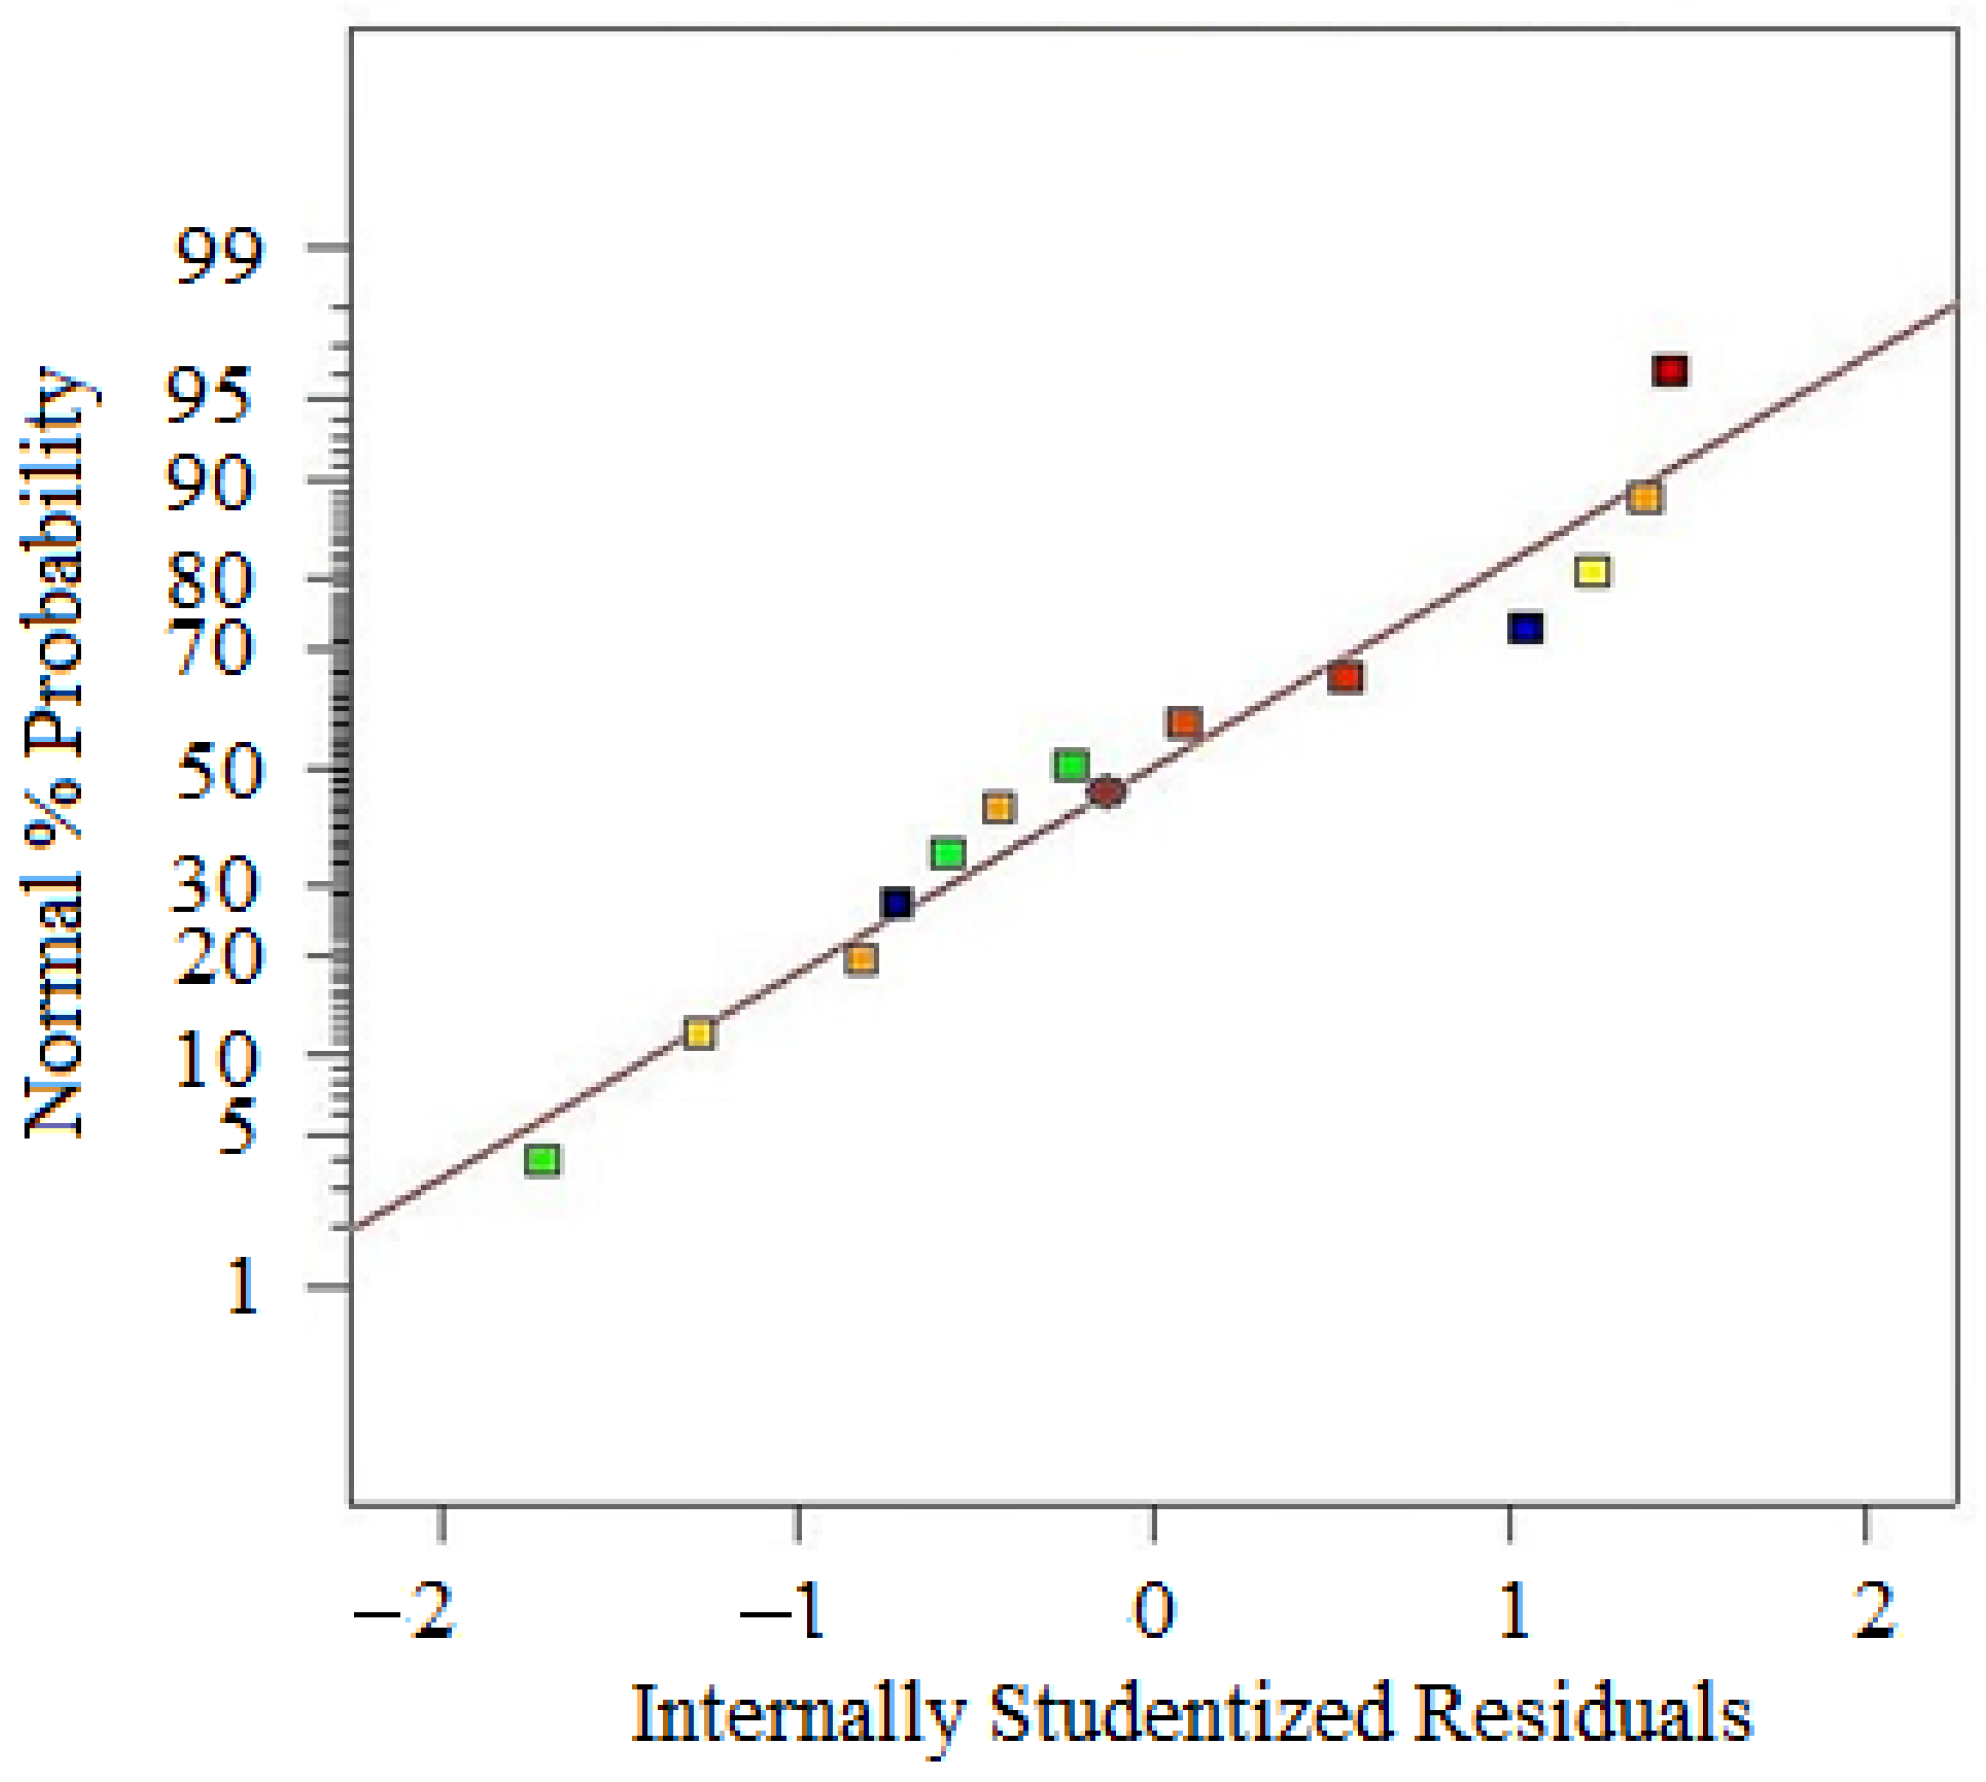
The normal probability plot versus residuals is presented in Figure 3. The graph indicates whether the residual follows a normal distribution. Desirably the points must lie in or around a straight line. Scattered data would require transformation. Since the present model fits well in this plot, no transformation was required.
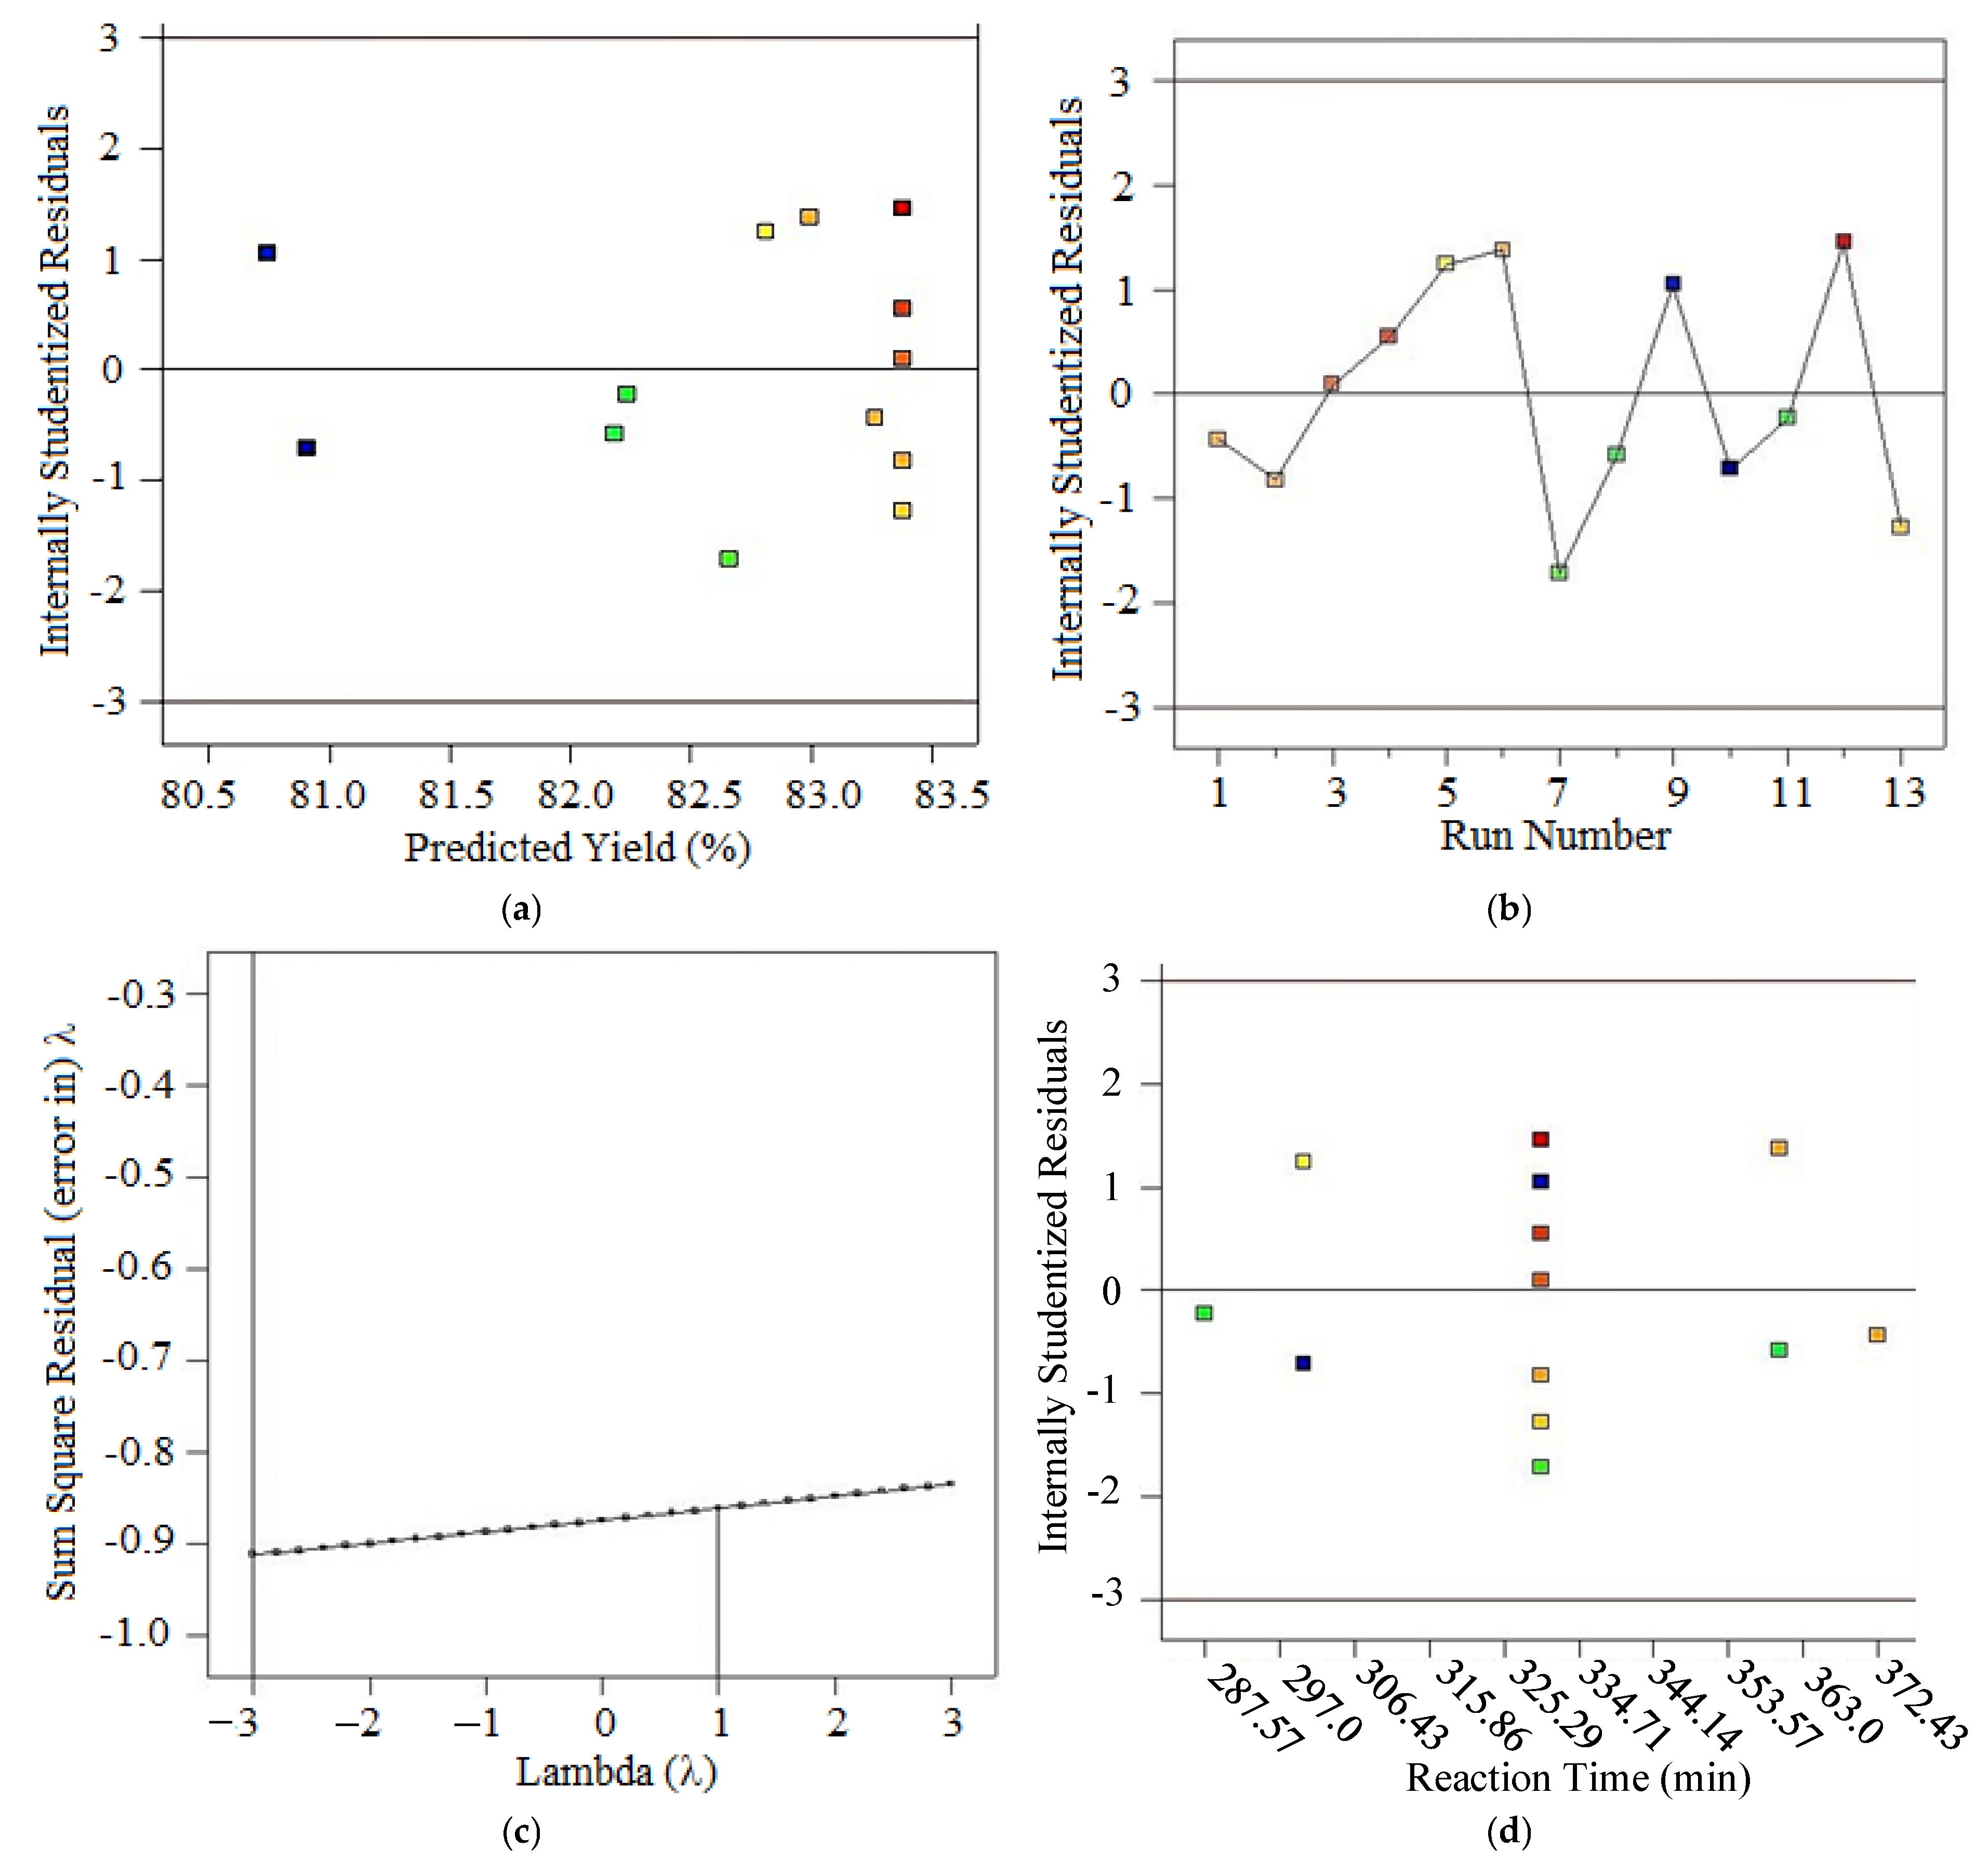
In Figure 3, the normality plot shows the trend of the residuals against the ascending predicted response values. The plot exhibits a cluster of randomly scattered points, which is desirable, as an expanding variance of megaphone pattern implies that transformation is required. This test showed that the range of residuals across the graph is constant as there is no point outside the limit of variance. The plot is presented in Figure 4a. The predicted values lie within a very small range of variance, indicating that the model is suitable for prediction.
During trial runs, various factors may influence the response or the yield. In order to identify such effects, the residuals versus run is plotted. This plot checks for such factors that may have influenced the ester yield during the experiment. The plot in Figure 4b shows randomly scattered points, which is desirable. Any visible trend would indicate the influence of a time-related factor. Randomization is essential to avoid such trends. The Box–Cox plot illustrates the relationship between the natural logarithm of the sum of squares (SSs) of the residuals and the λ value. The optimal λ value was found to be −3 and the current λ value was 1, as can be seen in Figure 4c. The software did not recommend any transformation as the confidence level was well within the range. This plot actually helps in selecting the power transformation if required. In Figure 4d, the residuals versus time plot also shows a scattered prototype, indicating that there is no time-related hindrance affecting the yield.
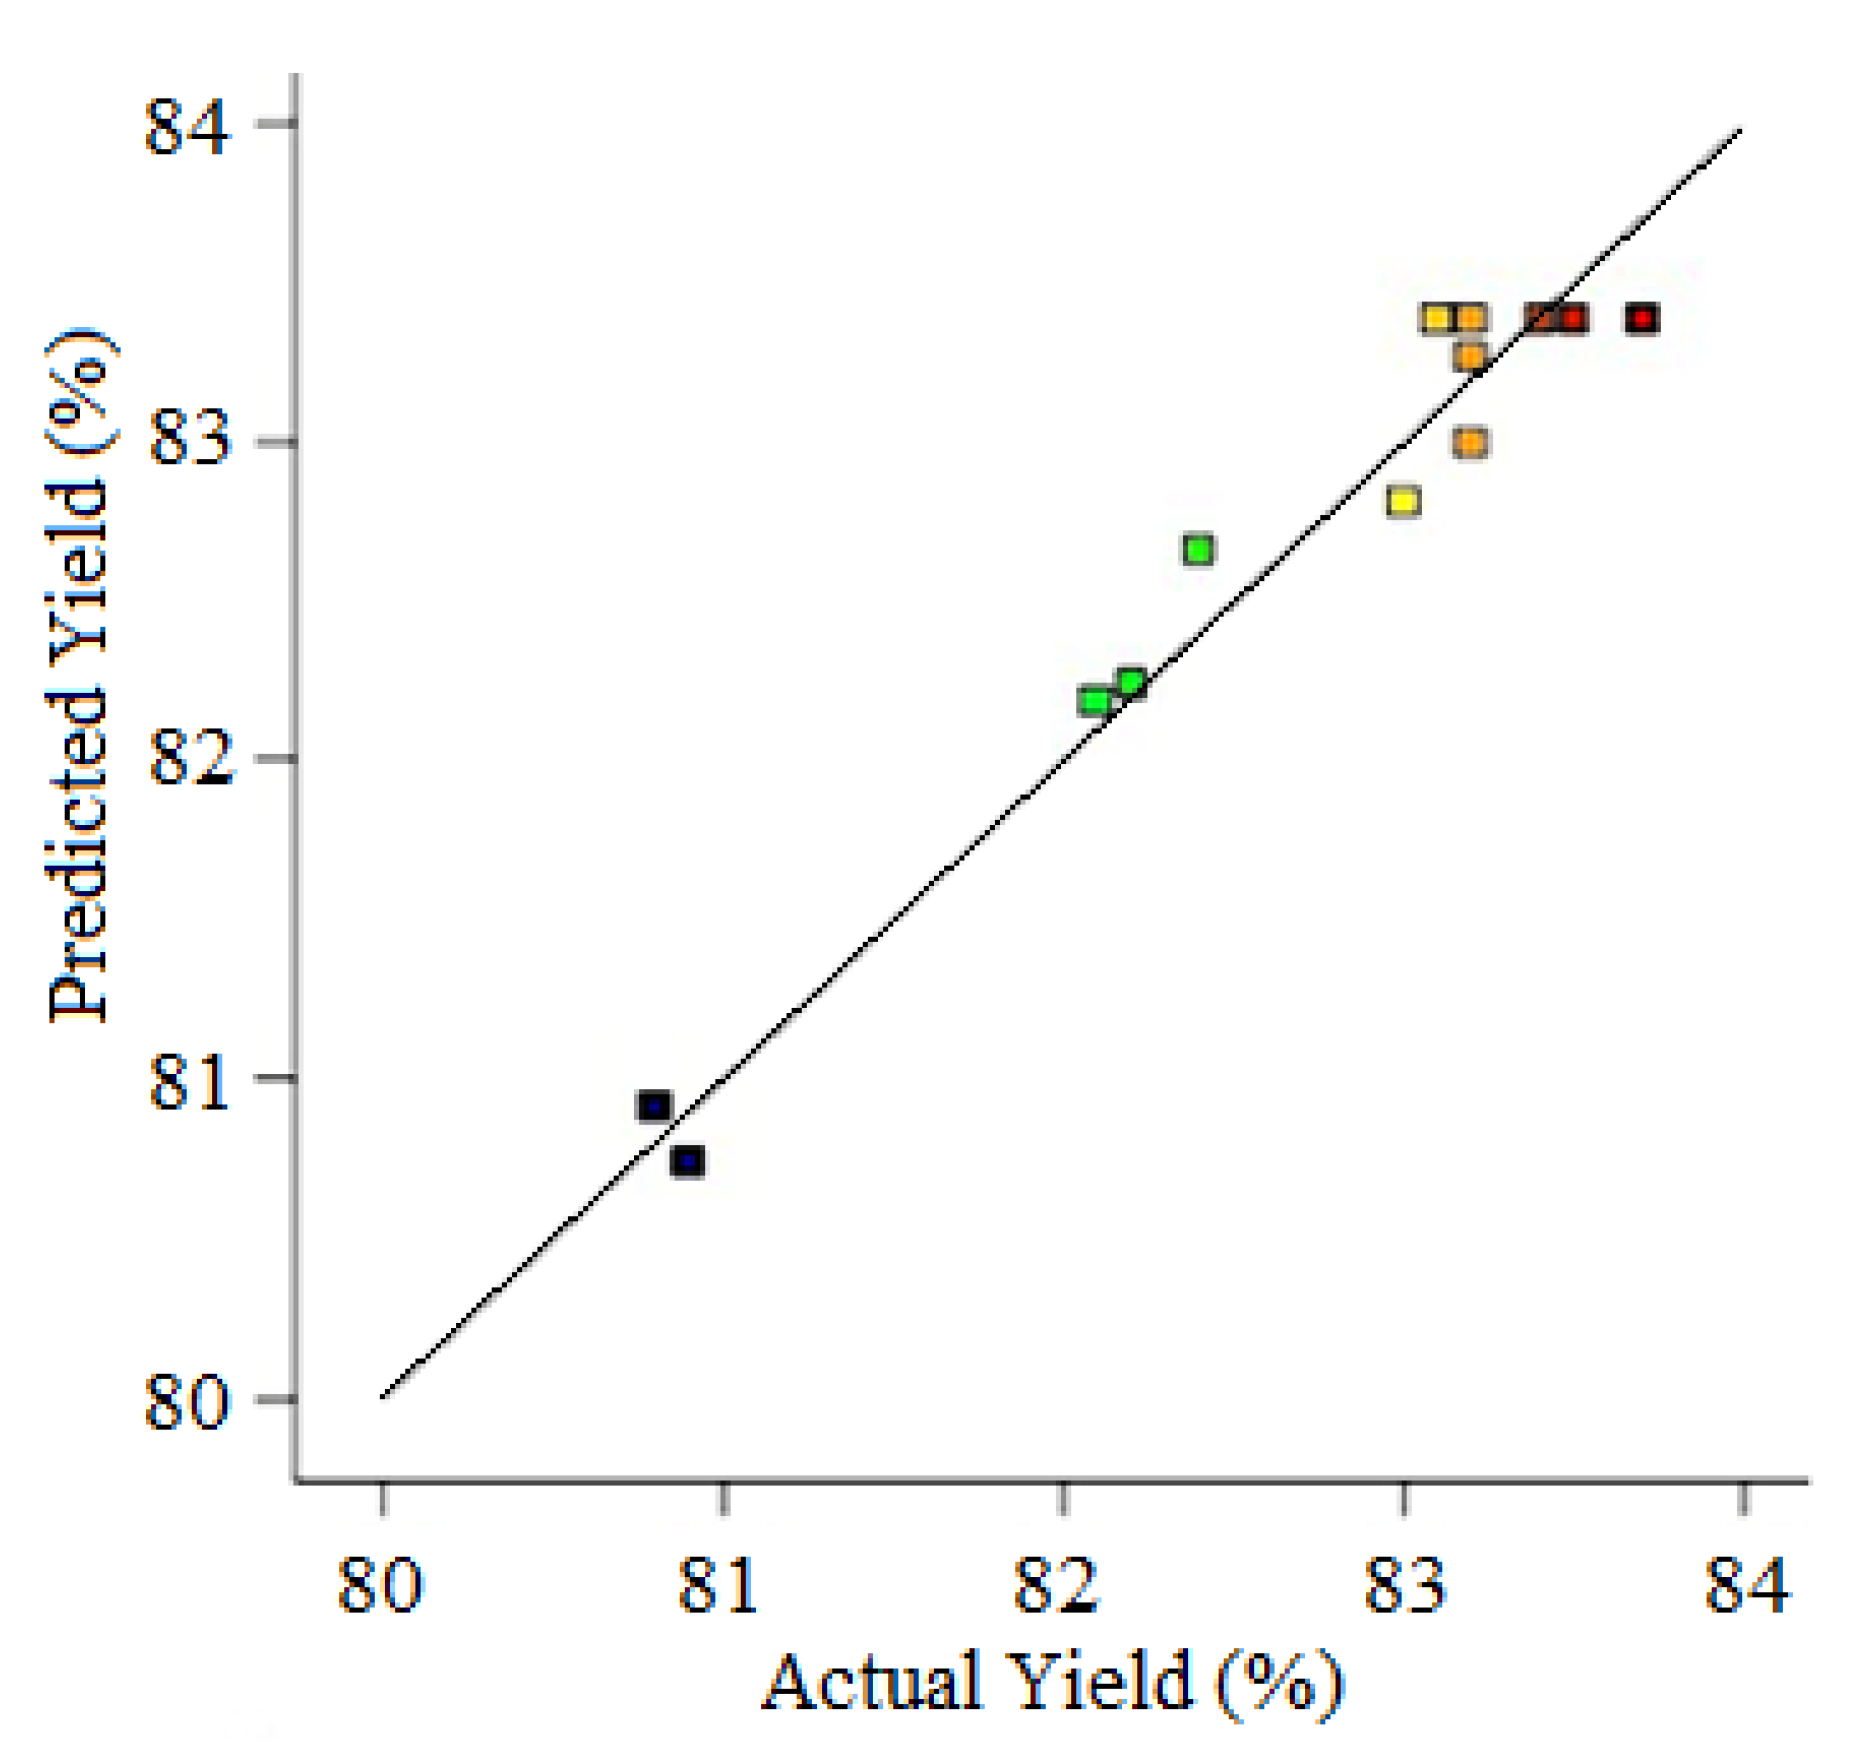
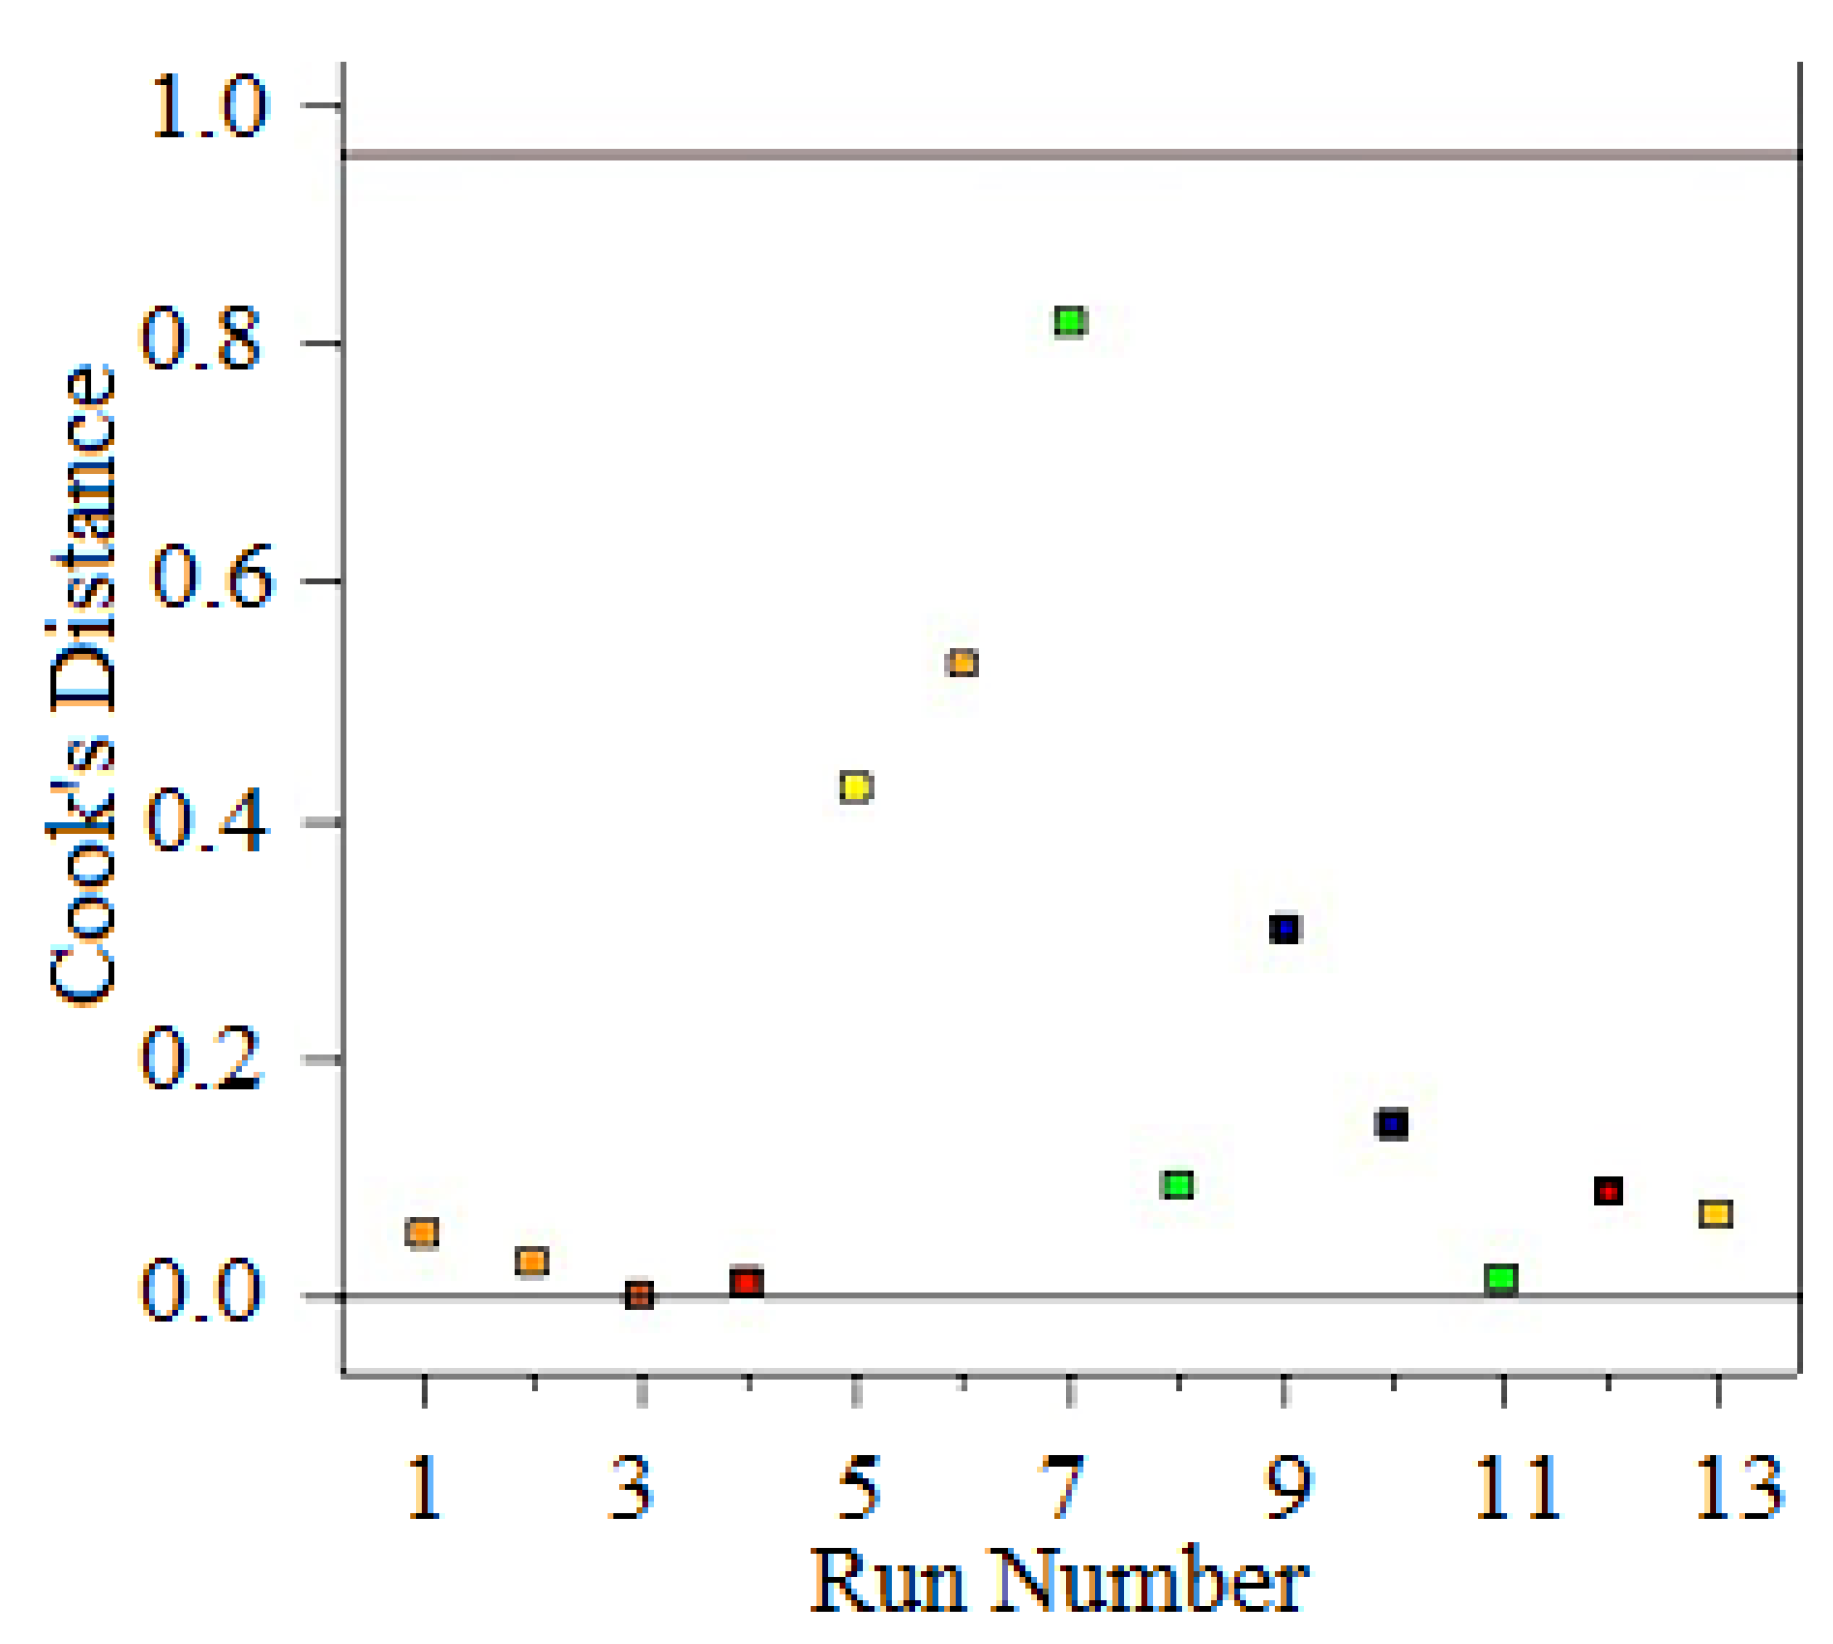
The predicted versus actual graph is presented in Figure 5. Here, if the variation is very large, the model requires improvement. However, this plot implies that the values lie within the acceptable range and hence the model is suitable for further analysis. This plot also helps to determine the ethics that could not be easily predicted by the model. Cook’s distance is the measure of variation in the prediction if that particular run is mislaid from the analysis. A point with elevated distance value relative to the other points needs to be investigated. The points must not pursue any trend and lie randomly in a scattered manner within certain limits.
The impact of eliminating a specific observation is measured by Cook’s distance. The Cook’s distance plot against the number of runs is shown in Figure 6. In this analysis, points having a high Cook’s distance are more significant. In experimental run number 7, there is the maximum deviations among the actual yield (82.40%) and the predicted yield (82.66%). This run corresponds to the maximum relative deviation (−0.315%) and the highest Cook’s distance (0.819). Consequently, its studentized residual is also the largest (−1.717). Therefore, this particular data point has the least weighted significance among the set of observations.
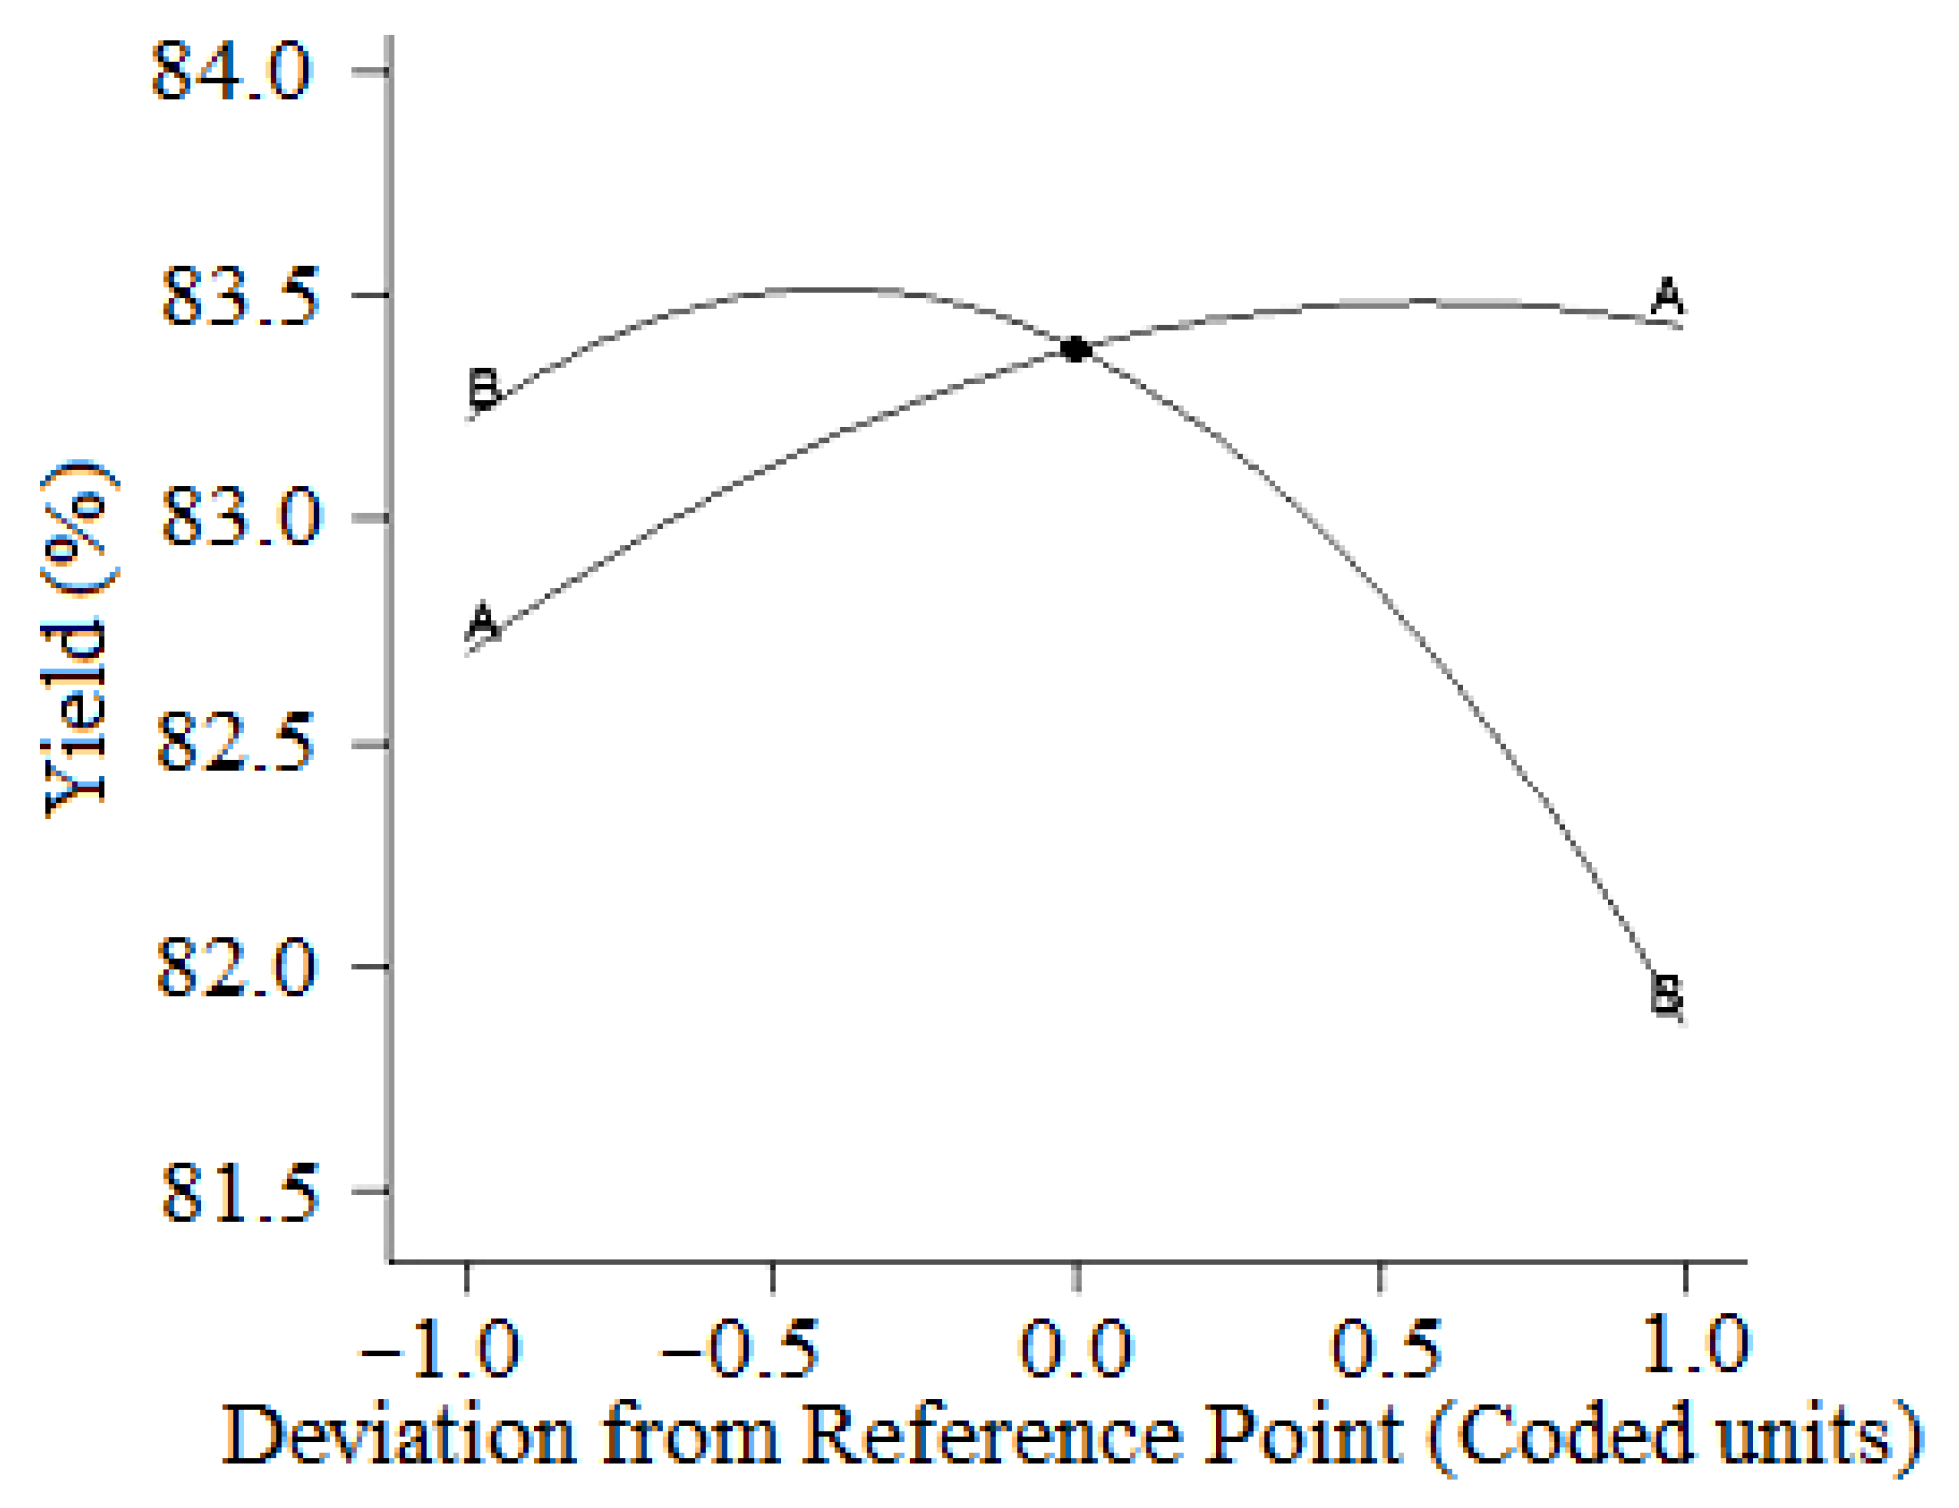
In the perturbation plot, the response is plotted by varying only a single factor at a time over its range while holding all the other factors constant as shown in Figure 7. In this figure, parameter ‘A’ corresponds to time and parameter ‘B’ corresponds to temperature. Thus, the number of curves in this graph is equal to the number of factors involved in the design. This plot allows a comparison between the effects of all the factors on the defer. A steep slope indicates that the response is sensitive to that factor, whereas a relatively flat line indicates insensitivity to change in that particular factor. In a design model with more than one factor, it is necessary to learn the interaction between the variables.
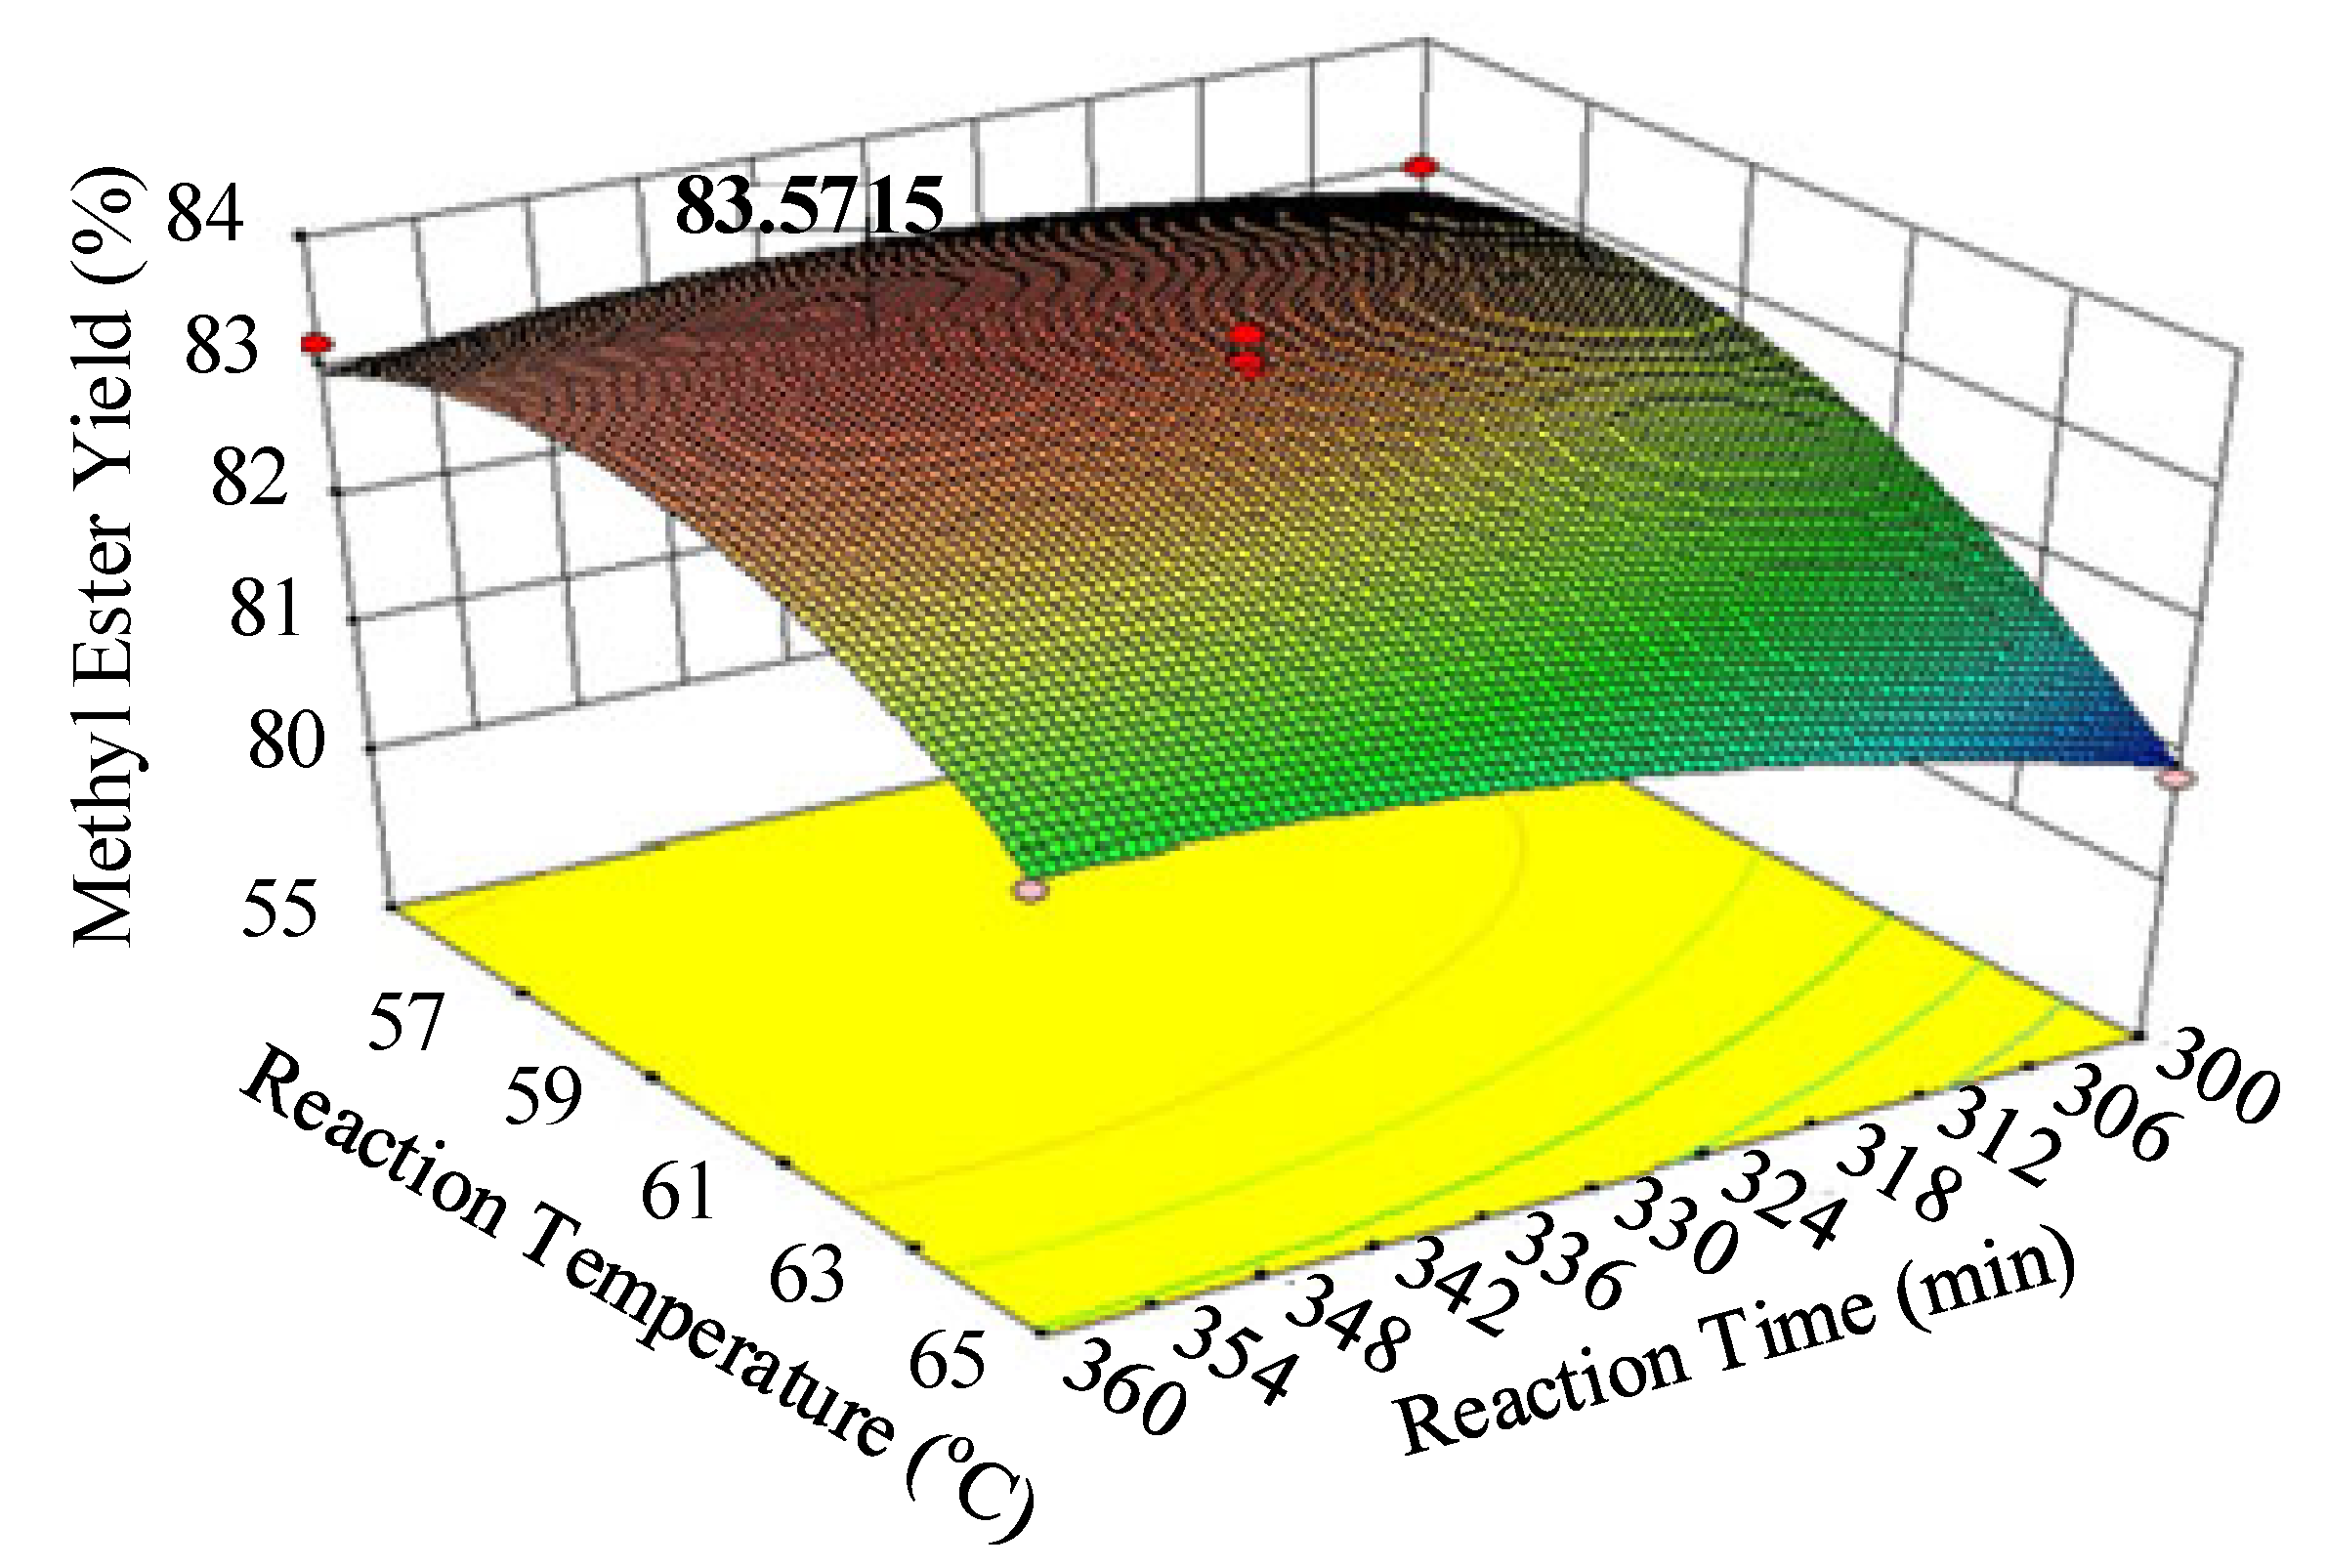
A three-dimensional response surface contour plot is shown in Figure 8, where the base displays the parameter time (A) in minutes and temperature (B) in °C, and the dependent variable, which is the percentage of ester yield, is plotted along the vertical axis.
The experimental values are represented in Figure 8 by the spikes with pyramidal heads. There was the indication that the predicted response surface of the stationary point was formed like a saddle without a unique optimum.
A saddle-shaped response surface indicates significant interaction between the factors and implies that the behavior of the response with respect to temperature depends on the values of the time factor. The response surface itself is only an approximation model used to explain the trends in yield over an experimental region. The fact that the surface turns out to be saddle-shaped has no negative implications, but tells us that we do not have a situation where there is either a linear increase in yield with all the independent variables of the others or a curved surface with a unique maximum.
Therefore, from the results of the regression equation and our model observations, it was evident that the deferred amount of yield of methyl esters would not exceed 0.85 (i.e., 85%) within the parameter ranges established for transesterification.
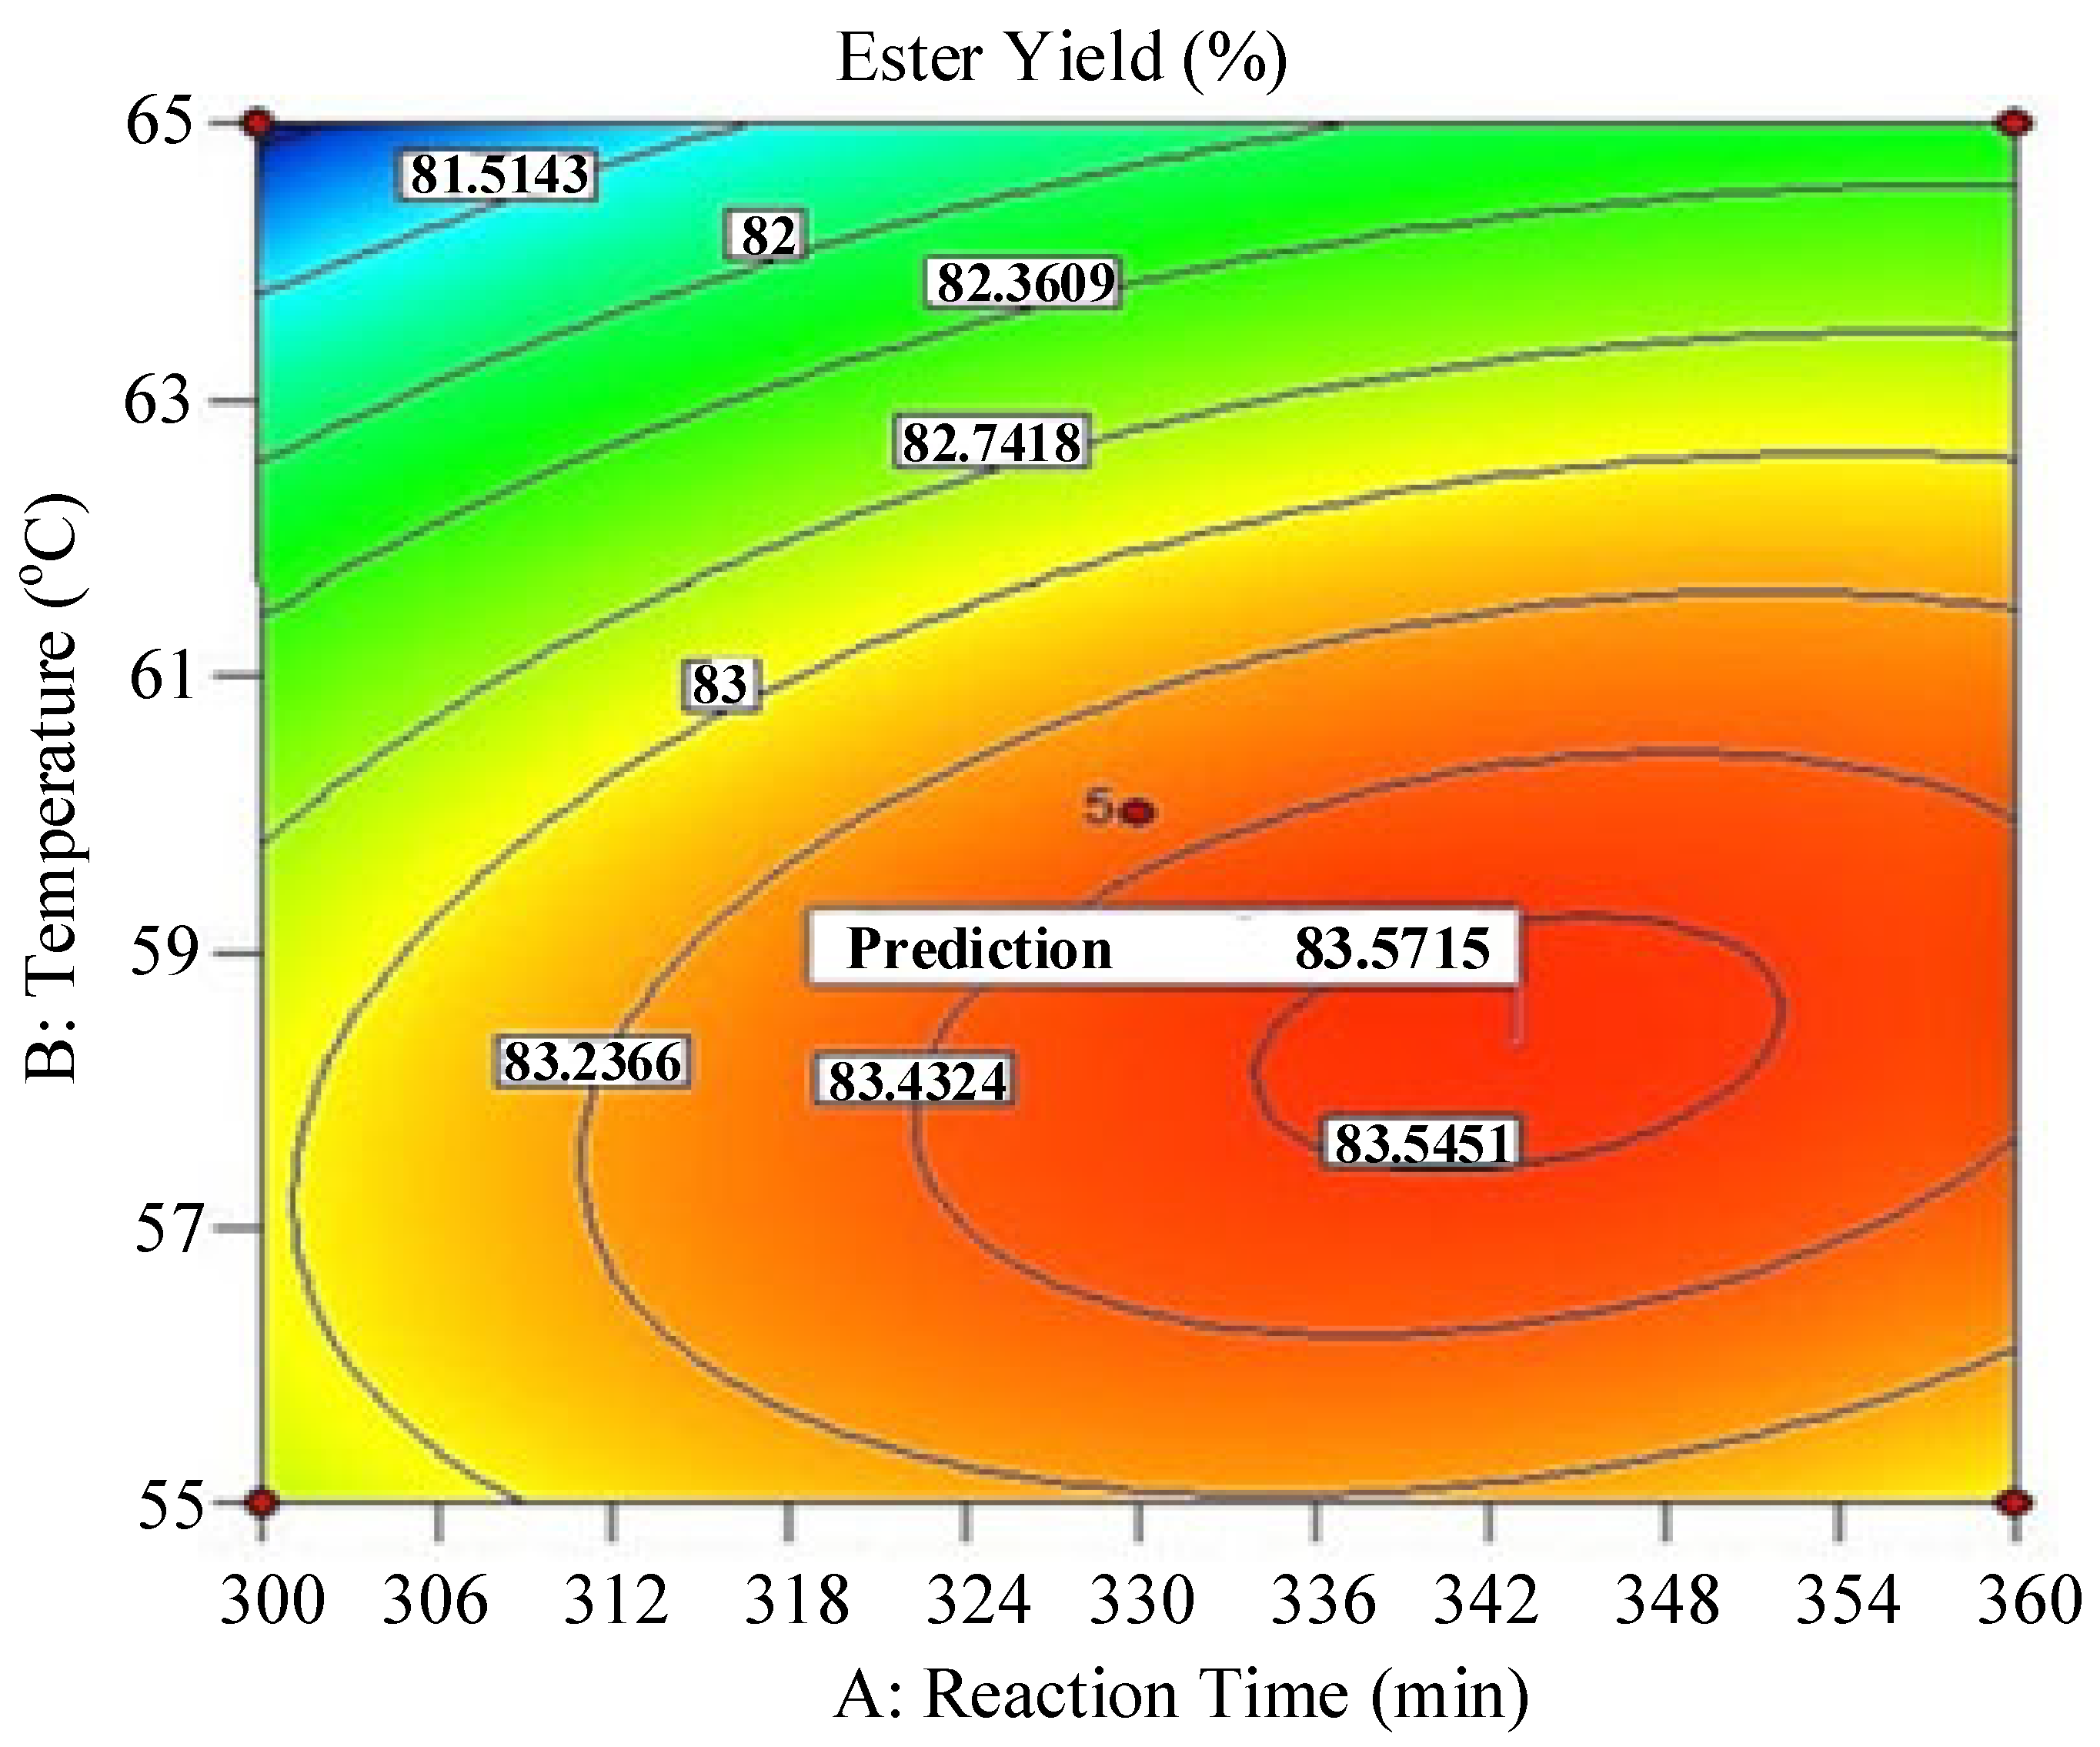
The two-dimensional projected values (of the contour as shown in Figure 8) of response of yield with the variation of time and temperature are shown in Figure 9. In the figure, it shows the contour plot of time and temperature on the response at the center point. It can also be seen from the figure that the predicted value (83.57%) closely approaches the observed value (83.80%).
Results of this experiment are comparable with the results of others as shown in Table 3 [4,5,6,7,8,12,13,27,28,29,43].
Figure 10 shows the interaction plot between the two independent variables: reaction time (minutes) and reaction temperature (°C). This can also be interpreted from Figure 8 as two-dimensional projected values. The plot illustrates the interaction between the factors; this indicates how the response varies depending on the selection of the two factors. The curve appears like two non-parallel lines, implying that the effect of one factor depends on the level of the other factor. Likewise, as seen in Figure 7, here also the parameter ‘A’ corresponds to reaction time and the parameter ‘B’ corresponds to the reaction temperature.
A time–temperature response plot for biodiesel yield helps identify the optimal reaction conditions for biodiesel production. Increasing the temperature generally increases the rate at which biodiesel is produced; however, increasing the temperature beyond the optimum can reduce biodiesel yield. This occurs because higher temperatures can accelerate the saponification of triglycerides [24,44,45].

5. Conclusions

The optimization of biodiesel production from palm oil through experimental design and statistical modeling conveys meaningful industrial and cost-effective advantages, particularly as industries strive for greater efficiency, sustainability, and profitability. Utilizing Response Surface Methodology (RSM) and statistical modeling allows for precise control over key process variables such as temperature, catalyst concentration, and reaction time. This leads to higher conversion efficiency of palm oil to biodiesel, minimizes side reactions, and reduces waste. Furthermore, it helps to reduce significant amounts of resource consumption and improve process design and scalability. The major economic impacts include cost reduction, increased yield and profitability, shorter payback period for investments, market competitiveness, and improved policy and subsidy leverage.
Biodiesel production was optimized using the statistical tool Response Surface Methodology (RSM), which has been widely validated in previous studies for its accuracy in prediction and optimization. A 22 full factorial central composite design was employed for the experimental setup. ANOVA results indicated that a quadratic model (R2 = 0.9321) was suitable for the optimization process. Regression analysis was then used to develop a predictive model, which identified optimal conditions at 58.34 °C and 343 min, yielding 83.57% methyl ester. A long optimal reaction time of 343 min may be attributed to inefficient stirring and mixing of the viscous reaction products, lack of pre-treatment, and monitoring solely the glycerol moiety to measure the reaction progress. Additionally, long-chain triglycerides or sterically hindered esters react slowly, and the presence of reaction products in the reaction mixture may further slow down the reaction process due to the reversible nature of the transesterification reaction. A confirmatory experimental test under these conditions resulted in an 83.8% yield, closely matching the predicted value. These findings demonstrate that the RSM-derived model reliably predicts experimental outcomes and can be effectively applied for scaling up palm biodiesel production.

Author Contributions

Conceptualization, S.C. and S.R.; Methodology, S.C. and S.R.; Software, S.C.; Validation, S.C.; Formal analysis, S.C.; Investigation, S.C.; Writing—original draft, S.C. and S.R.; Visualization, S.R.; Supervision, S.C. All authors have read and agreed to the published version of the manuscript.

Funding

Swami Vivekananda Research Grant Award. Sponsored by: West Bengal State Council of Science & Technology (WBSCST), Department of Science and Technology and Biotechnology (DSTBT), Government of West Bengal. Sanction Order No. and Date: 228/STBT-l 20 I 4/23/2021-WBSCST SEC-Dept. of STBT, dated 26 April 2022.

Data Availability Statement

Data is contained within the article.

Acknowledgments

The authors acknowledge Anindita Sengupta for her contribution at the initial stage of this work.

Conflicts of Interest

The authors declare no conflicts of interest.

References

  1. Zhang, Z.; Karimi, M.S.; Weerasinghe, N.M.; Bilan, Y.; Shahzad, U. Interplay between economic progress, carbon emissions and energy prices on green energy adoption: Evidence from USA and Germany in context of sustainability. Renew. Energy 2024, 232, 121038. [Google Scholar] [CrossRef]
  2. Hassan, Q.; Viktor, P.; Al-Musawi, T.J.; Ali, B.M.; Algburi, S.; Alzoubi, H.M.; Al-Jiboory, A.K.; Sameen, A.Z.; Salman, H.M.; Jaszczur, M. The renewable energy role in the global energy Transformations. Renew. Energy Focus 2024, 48, 100545. [Google Scholar] [CrossRef]
  3. Avesh, M.; Hossain, I.; Sharma, R.C. Revolutionizing Transportation: The Future Impact of Green Energy. In Dynamics of Transportation Ecosystem, Modeling, and Control; Springer: Berlin/Heidelberg, Germany, 2024; pp. 261–293. [Google Scholar]
  4. Bahani, N.; El Kourdi, S.; Abderafi, S. Argan cake oil transesterification kinetics and an optimized choice of a high-performance catalyst for biodiesel production. Waste Biomass Valorization 2024, 15, 2591–2610. [Google Scholar] [CrossRef]
  5. Mansoorsamaei, Z.; Mowla, D.; Esmaeilzadeh, F.; Dashtian, K. Sustainable biodiesel production from waste cooking oil using banana peel biochar-Fe2O3/Fe2K6O5 magnetic catalyst. Fuel 2024, 357, 129821. [Google Scholar] [CrossRef]
  6. Chatterjee, S. An experimental investigation on preparation and performances of two diesel blends of karanj oil methyl ester. Int. J. Oil Gas Coal Technol. 2024, 35, 442–475. [Google Scholar] [CrossRef]
  7. Yusuff, A.S.; Thompson-Yusuff, K.A.; Igbafe, A.I. Synthesis of biodiesel via methanolysis of waste frying oil by biowaste-derived catalyst: Process optimization and biodiesel blends characterization. Biomass Convers. Biorefinery 2024, 14, 1781–1792. [Google Scholar] [CrossRef]
  8. Chua, S.Y.; Goh, C.M.H.; Tan, Y.H.; Mubarak, N.M.; Kansedo, J.; Khalid, M.; Walvekar, R.; Abdullah, E. Biodiesel synthesis using natural solid catalyst derived from biomass waste—A review. J. Ind. Eng. Chem. 2020, 81, 41–60. [Google Scholar] [CrossRef]
  9. Dhivya Priya, N.; Thirumarimurugan, M. Biodiesel—A review on recent advancements in production. In Bioresource Utilization and Bioprocess; Springer: Berlin/Heidelberg, Germany, 2020; pp. 117–129. [Google Scholar]
  10. Mahlia, T.; Syazmi, Z.; Mofijur, M.; Abas, A.P.; Bilad, M.; Ong, H.C.; Silitonga, A. Patent landscape review on biodiesel production: Technology updates. Renew. Sustain. Energy Rev. 2020, 118, 109526. [Google Scholar] [CrossRef]
  11. McCarthy, S.M.; Melman, J.H.; Reffell, O.K.; Gordon-Wylie, S.W. Synthesis and partial characterization of biodiesel via base-catalyzed transesterification. In Bioenergy; Elsevier: Amsterdam, The Netherlands, 2020; pp. 519–524. [Google Scholar]
  12. Galusnyak, S.C.; Petrescu, L.; Cosprundan, A.M.; Cormos, C.-C. Biodiesel production using various methanol sources and catalytic routes: A techno-environmental analysis. Renew. Energy 2024, 232, 121051. [Google Scholar] [CrossRef]
  13. Farouk, S.M.; Tayeb, A.M.; Abdel-Hamid, S.M.; Osman, R.M. Recent advances in transesterification for sustainable biodiesel production, challenges, and prospects: A comprehensive review. Environ. Sci. Pollut. Res. 2024, 31, 12722–12747. [Google Scholar] [CrossRef]
  14. Meher, L.C.; Sagar, D.V.; Naik, S.N. Technical aspects of biodiesel production by transesterification—A review. Renew. Sustain. Energy Rev. 2006, 10, 248–268. [Google Scholar] [CrossRef]
  15. Kivevele, T.; Kichonge, B. Techno-economic evaluation of transesterification processes for biodiesel production from low quality non-edible feedstocks: Process design and simulation. Energy 2024, 297, 131302. [Google Scholar] [CrossRef]
  16. Pasha, M.K.; Rahim, M.; Dai, L.; Liu, D.; Du, W.; Guo, M. Comparative study of a two-step enzymatic process and conventional chemical methods for biodiesel production: Economic and environmental perspectives. Chem. Eng. J. 2024, 489, 151254. [Google Scholar] [CrossRef]
  17. Xiao, G.; Gao, L. First generation biodiesel. In Biofuel Production-Recent Developments and Prospects; Intechopen: London, UK, 2011. [Google Scholar]
  18. Yuan, W.; Yang, F. Chemical conversion process for biodiesel production. In Biomass to Renewable Energy Processes; CRC Press: Boca Raton, FL, USA, 2017; pp. 299–374. [Google Scholar]
  19. Knothe, G. History of vegetable oil-based diesel fuels. In The Biodiesel Handbook; Elsevier: Amsterdam, The Netherlands, 2010; pp. 5–19. [Google Scholar]
  20. Garg, R.; Sabouni, R.; Ahmadipour, M. From waste to fuel: Challenging aspects in sustainable biodiesel production from lignocellulosic biomass feedstocks and role of metal organic framework as innovative heterogeneous catalysts. Ind. Crops Prod. 2023, 206, 117554. [Google Scholar] [CrossRef]
  21. Muhammad, M.; Wibert Victor Hasudungan, H. Analyzing the market conditions and long-term dynamics in the biodiesel industry. Biofuels 2025, 16, 32–41. [Google Scholar] [CrossRef]
  22. Miftah, F.K.; Mutta, D. Potential markets and policies for sustainable liquid biofuel production with emphasis to Eastern Africa countries: A review. Energy Sustain. Soc. 2024, 14, 1. [Google Scholar] [CrossRef]
  23. Shafiq, F.; Mumtaz, M.W.; Mukhtar, H.; Touqeer, T.; Raza, S.A.; Rashid, U.; Nehdi, I.A.; Choong, T.S.Y. Response surface methodology approach for optimized biodiesel production from waste chicken fat oil. Catalysts 2020, 10, 633. [Google Scholar] [CrossRef]
  24. Asaad, S.M.; Inayat, A.; Ghenai, C.; Shanableh, A. Response surface methodology in biodiesel production and engine performance assessment. Int. J. Thermofluids 2024, 21, 100551. [Google Scholar] [CrossRef]
  25. Veza, I.; Spraggon, M.; Fattah, I.R.; Idris, M. Response surface methodology (RSM) for optimizing engine performance and emissions fueled with biofuel: Review of RSM for sustainability energy transition. Results Eng. 2023, 18, 101213. [Google Scholar] [CrossRef]
  26. Hasan, M.; Rasul, M.; Jahirul, M.; Khan, M. Fast pyrolysis of macadamia nutshell in an auger reactor: Process optimization using response surface methodology (RSM) and oil characterization. Fuel 2023, 333, 126490. [Google Scholar] [CrossRef]
  27. Silitonga, A.S.; Shamsuddin, A.H.; Mahlia, T.M.I.; Milano, J.; Kusumo, F.; Siswantoro, J.; Dharma, S.; Sebayang, A.H.; Masjuki, H.H.; Ong, H.C. Biodiesel synthesis from Ceiba pentandra oil by microwave irradiation-assisted transesterification: ELM modeling and optimization. Renew. Energy 2020, 146, 1278–1291. [Google Scholar] [CrossRef]
  28. Aslan, V.; Eryilmaz, T. Polynomial regression method for optimization of biodiesel production from black mustard (Brassica nigra L.) seed oil using methanol, ethanol, NaOH, and KOH. Energy 2020, 209, 118386. [Google Scholar] [CrossRef]
  29. Sai, B.A.; Subramaniapillai, N.; Mohamed, M.S.B.K.; Narayanan, A. Optimization of continuous biodiesel production from rubber seed oil (RSO) using calcined eggshells as heterogeneous catalyst. J. Environ. Chem. Eng. 2020, 8, 103603. [Google Scholar] [CrossRef]
  30. Zhang, Y.; Niu, S.; Lu, C.; Gong, Z.; Hu, X. Catalytic performance of NaAlO2/γ-Al2O3 as heterogeneous nanocatalyst for biodiesel production: Optimization using response surface methodology. Energy Convers. Manag. 2020, 203, 112263. [Google Scholar] [CrossRef]
  31. Awogbemi, O.; Kallon, D.V.V. Application of machine learning technologies in biodiesel production process—A review. Front. Energy Res. 2023, 11, 1122638. [Google Scholar] [CrossRef]
  32. Rajali, N.A.; Radzi, S.M.; Rehan, M.M.; Amin, N.A.M. Optimization of the biodiesel production via transesterification reaction of palm oil using response surface methodology (RSM): A review. Malays. J. Sci. Health Technol. 2022, 8, 58–67. [Google Scholar] [CrossRef]
  33. Anjaneya, G.; Sunil, S.; Manjunatha, N.; Giri, J.; Al-Lohedan, H.A.; Sathish, T.; Prasad, C.D. Performance analysis and optimization of thermal barrier coated piston diesel engine fuelled with biodiesel using RSM. Case Stud. Therm. Eng. 2024, 57, 104351. [Google Scholar] [CrossRef]
  34. Kolakoti, A.; Tadros, M.; Ambati, V.K.; Gudlavalleti, V.N.S. Optimization of biodiesel production, engine exhaust emissions, and vibration diagnosis using a combined approach of definitive screening design (DSD) and artificial neural network (ANN). Environ. Sci. Pollut. Res. 2023, 30, 87260–87273. [Google Scholar] [CrossRef] [PubMed]
  35. Gupta, K.K.; Kalita, K.; Ghadai, R.K.; Ramachandran, M.; Gao, X.-Z. Machine learning-based predictive modelling of biodiesel production—A comparative perspective. Energies 2021, 14, 1122. [Google Scholar] [CrossRef]
  36. Ajao, J.; Akanbi, O.; Akinwole, I.; Adedokun, A.; Ogunsakin, O.; Ige, A. Research Advances on Machine Learning Technologies for Enhanced Biodiesel Production: A Comprehensive Review. Pet. Coal 2024, 66, 1–29. [Google Scholar]
  37. Ishola, N.B.; Epelle, E.I.; Betiku, E. Machine learning approaches to modeling and optimization of biodiesel production systems: State of art and future outlook. Energy Convers. Manag. X 2024, 23, 100669. [Google Scholar] [CrossRef]
  38. Corral-Bobadilla, M.; Lostado-Lorza, R.; Sabando-Fraile, C.; Íñiguez-Macedo, S. An artificial intelligence approach to model and optimize biodiesel production from waste cooking oil using life cycle assessment and market dynamics analysis. Energy 2024, 307, 132712. [Google Scholar] [CrossRef]
  39. Buasri, A.; Sirikoom, P.; Pattane, S.; Buachum, O.; Loryuenyong, V. RSM Process Optimization of Biodiesel Production from Waste Cooking Palm Oil in the Presence of SO3H-PSC Catalysts. Eng. Proc. 2023, 37, 73. [Google Scholar]
  40. Díaz-García, J.A.; González-Farías, G. A note on the Cook’s distance. J. Stat. Plan. Inference 2004, 120, 119–136. [Google Scholar] [CrossRef]
  41. Easton, P.D.; Sommers, G.A. Scale and the scale effect in market-based accounting research. J. Bus. Financ. Account. 2003, 30, 25–56. [Google Scholar] [CrossRef]
  42. Choudhary, S.; Satija, R. Comparison and evaluation of statistical error models for scRNA-seq. Genome Biol. 2022, 23, 27. [Google Scholar] [CrossRef]
  43. Ortiz-Martínez, V.; Salar-García, M.; Palacios-Nereo, F.; Olivares-Carrillo, P.; Quesada-Medina, J.; De Los Ríos, A.P.; Hernández-Fernández, F. In-depth study of the transesterification reaction of Pongamia pinnata oil for biodiesel production using catalyst-free supercritical methanol process. J. Supercrit. Fluids 2016, 113, 23–30. [Google Scholar] [CrossRef]
  44. Chozhavendhan, S.; Singh, M.V.P.; Fransila, B.; Kumar, R.P.; Devi, G.K. A review on influencing parameters of biodiesel production and purification processes. Curr. Res. Green Sustain. Chem. 2020, 1, 1–6. [Google Scholar] [CrossRef]
  45. Ogunkunle, O.; Oniya, O.O.; Adebayo, A.O. Yield response of biodiesel production from heterogeneous and homogeneous catalysis of milk bush seed (Thevetia peruviana) oil. Energy Policy Res. 2017, 4, 21–28. [Google Scholar] [CrossRef]
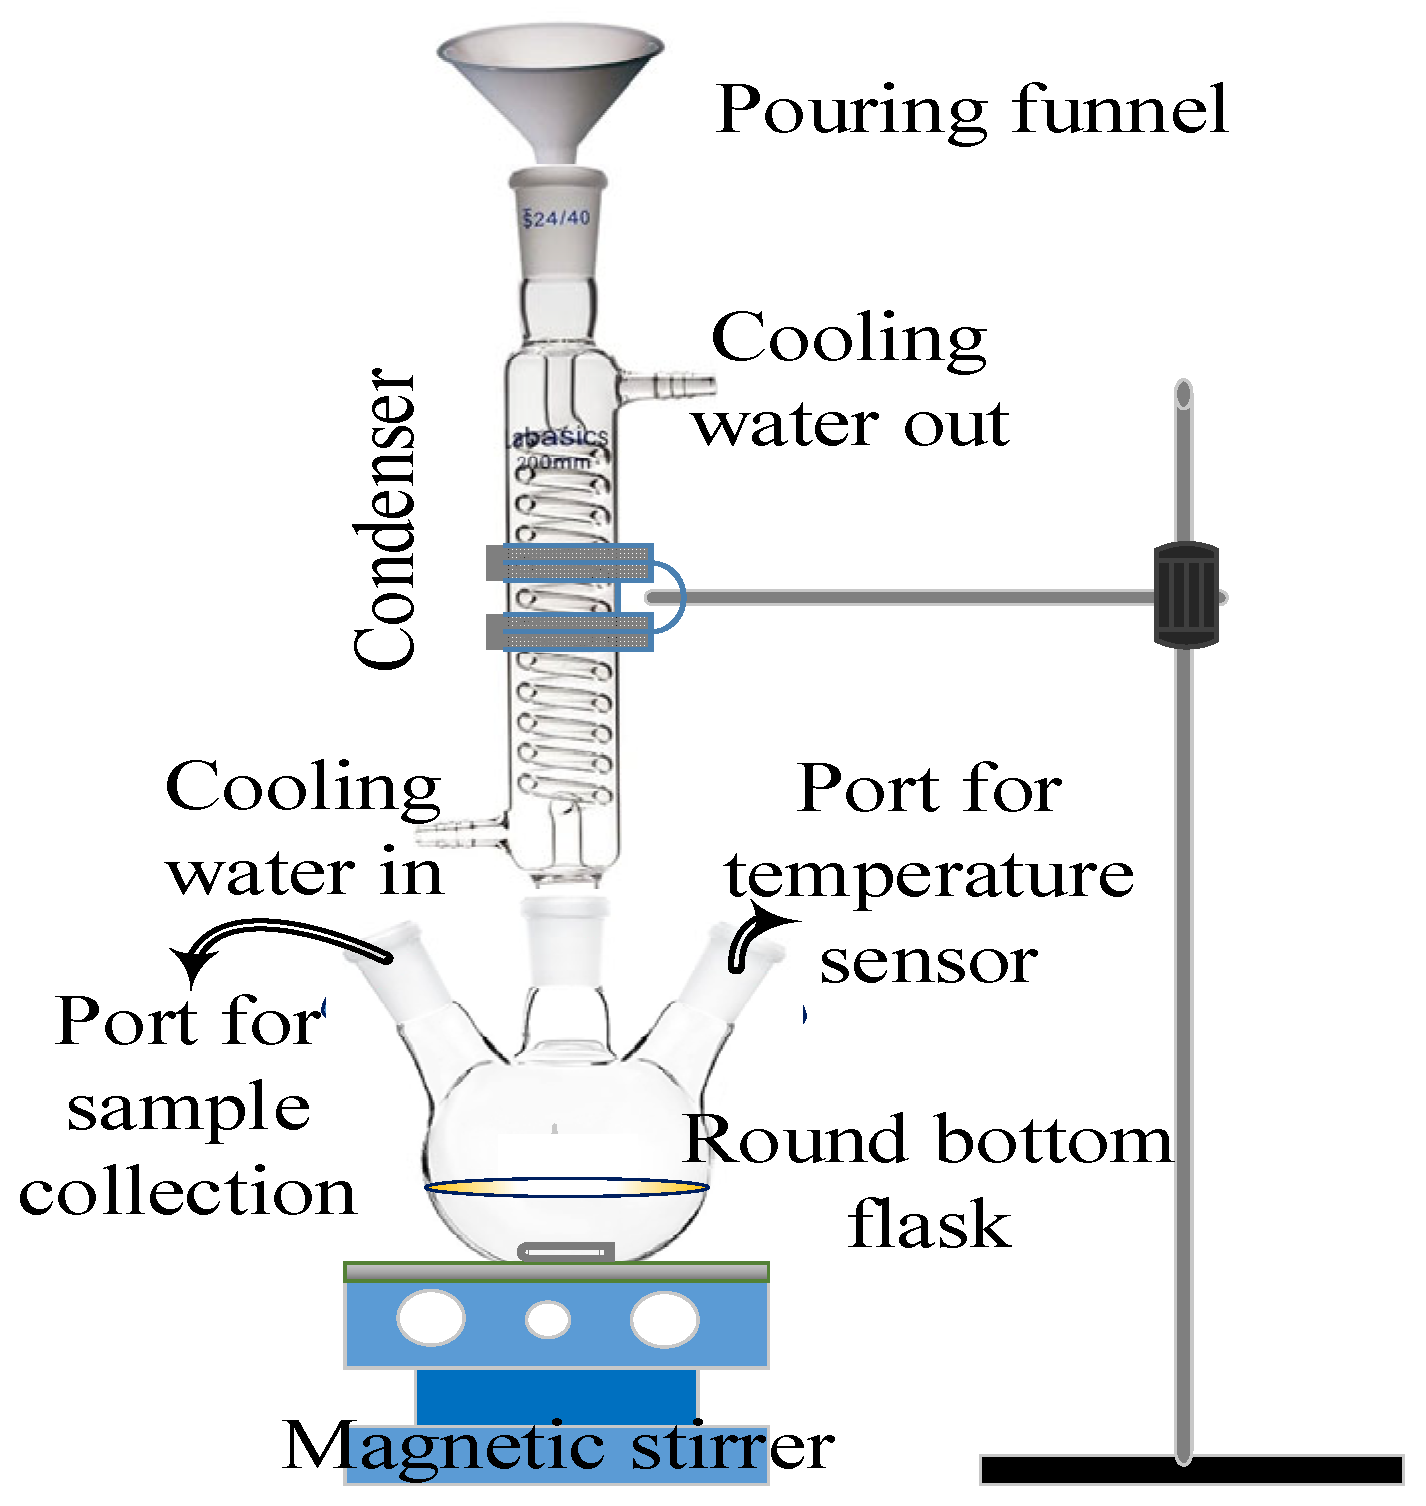
Figure 1. Experimental configuration for transesterification.
Physchem 05 00052 g001
Figure 2. Yield (%) at different runs; trend of steepest ascent.
Physchem 05 00052 g002
Figure 3. Normality plot.
Physchem 05 00052 g003
Figure 4. (a) Residual versus Predicted. (b) Residual versus Run. (c) Figure of Box–Cox plotting. (d) Residual versus Time factor.
Physchem 05 00052 g004
Figure 5. Predicted yield versus actual yield values.
Physchem 05 00052 g005
Figure 6. Cook’s distance versus Run.
Physchem 05 00052 g006
Figure 7. Perturbation plot (A: Time, B: Temperature).
Physchem 05 00052 g007
Figure 8. Surface plot of 3D figure with respect to reaction time (min) and temperature (°C) against the methyl ester yield (%).
Physchem 05 00052 g008
Figure 9. Contour plot of methyl ester yield (%) with respect to time and temperature.
Physchem 05 00052 g009
Figure 10. Time–temperature interaction plot.
Physchem 05 00052 g010
Table 1. Comparison between actual values and predicted values of ester yield.
RunsActual Yield
(%)
Predicted Yield
(%)
Relative Deviation (%)Cook’s DistanceStudentized Residuals
183.0082.810.2320.4271.240
283.2082.990.2520.5311.383
380.8080.91−0.1360.143−0.718
482.1082.19−0.1090.092−0.576
582.2082.23−0.0360.015−0.232
683.8083.83−0.0390.052−0.433
782.4082.66−0.3150.819−1.717
880.9080.740.1970.3081.053
983.1083.38−0.3370.068−1.274
1083.2083.38−0.2160.028−0.819
1183.7083.380.3820.0881.456
1283.5083.380.1440.0120.546
1383.4083.380.0240.0000.091
Table 2. Optimum conditions for the maximum ester yield.
Time (t-Min)Temperature (T-°C)Predicted Value (Ester Yield-%)
34358.3483.83
Table 3. A comparison between various transesterification reactions.
FeedstockYield (%)Reaction TimeTemperature (°C)Reference
Waste cooking oil with methanol88.83180 min60[5]
Waste frying oil (WFO)90.81180 min50[7]
Castor oil94.2480 min35[8]
Ceiba pentandra 95.42388 s (microwave assisted)~300[27]
Black mustard (Brassica nigra L.) seed oil96.229–97.33556–54.1 min35.4–57.1[28]
Rubber seed oil (RSO)97.84240 min65[29]
Karanja oil81.1590 min300[44]
Palm oil83.57343 min58.3This work
Disclaimer/Publisher’s Note: The statements, opinions and data contained in all publications are solely those of the individual author(s) and contributor(s) and not of MDPI and/or the editor(s). MDPI and/or the editor(s) disclaim responsibility for any injury to people or property resulting from any ideas, methods, instructions or products referred to in the content.