Abstract
Gellan gum (Gellan), a versatile polysaccharide applied in gel formation and prebiotic formulations, is often processed to tailor its molecular properties. Previous studies employed gamma irradiation and chemical hydrolysis, though without addressing systematic scaling behavior. This study investigates the structural and conformational modifications of Gellan in dilute aqueous salt solutions using a safer and eco-friendly approach: atmospheric low-dose electron beam (e-beam) degradation coupled with viscosity analysis. Native and E-beam-treated Gellan samples (0.05 g/cm3 in 0.1 M KCl) were examined by relative viscosity at varying temperatures, with intrinsic viscosity and molar mass determined via Solomon–Ciuta and Mark–Houwink relations. Molar mass degradation followed first-order kinetics, yielding rate constants and degradation lifetimes. Structural parameters, including radius of gyration and second virial coefficient, produced scaling coefficients of 0.62 and 0.15, consistent with perturbed coil conformations in a good solvent. The shape factor confirmed preservation of an ideal random coil structure despite irradiation. Conformational flexibility was further analyzed using theoretical models. Transition state theory (TST) revealed that e-beam radiation lowered molar mass and activation energy but raised activation entropy, implying reduced flexibility alongside enhanced solvent interactions. The freely rotating chain (FRC) model estimated end-to-end distance (Rθ) and characteristic ratio (C∞), while the worm-like chain (WLC) model quantified persistence length (lp). Results indicated decreased Rθ, increased lp, and largely unchanged C∞, suggesting diminished chain flexibility without significant deviation from ideal coil behavior. Overall, this work provides new insights into Gellan’s scaling laws and flexibility under aerobic low-dose E-beam irradiation, with relevance for bioactive polysaccharide applications.
1. Introduction
Polysaccharides represent a versatile class of biopolymers with broad utility across the food, pharmaceutical, and biomedical sectors [1,2]. Radiation-based processing is frequently applied as a means of modulating their molar mass to suit specific functional requirements [3,4,5]. Among them, gellan gum (Gellan), an anionic polysaccharide, is particularly valued for its gelling, stabilizing, and rheological functions [6]. The molecular behavior and performance of gellan gum are largely governed by structural attributes such as molar mass, intrinsic viscosity, chain conformation, and flexibility in solution [7]. These characteristics are further modulated by environmental factors, including ion concentration, solvent conditions, and external interventions such as irradiation [7,8,9,10,11,12].
Previous studies have shown that irradiation can significantly influence the molecular weight distribution, conformational flexibility, and solubility of Gellan and related polysaccharides [3,4,5,8,11,12]. Depending on the irradiation conditions, both chain scission and intramolecular cross-linking have been reported, altering the rheological properties of the resulting polymer [3,4,5,8,11]. However, most available reports focus on gel formation, high-dose irradiation for sterilization, and gamma degradation combined with acidic hydrolysis for prebiotic production, while limited information is available on how moderate electron-beam (e-beam) doses affect the diluted gellan gum in aqueous salt solutions, particularly its scaling behavior and chain flexibility [3,4,5,8,11].
In this work, relatively low irradiation doses were selected intentionally. Unlike the high doses applied for sterilization of food and pharmaceutical products, our focus was to induce controlled molecular weight reduction and subtle conformational changes, avoiding excessive degradation. This approach allows us to examine the gradual effect of irradiation on solvation, flexibility, and scaling behavior, thereby providing new insights into safely and cleanly tailoring Gellan properties for specific functional applications, with diverse health benefits. The objective of this research was to conduct a systematic investigation into how low-dose e-beam radiation alters the molar mass, scaling behavior, and molecular conformation of aqueous Gellan gum solutions.
2. Materials and Methods
2.1. Materials
Gellan gum, Gellan, was supplied as commercial-grade powder by Glentham Life Sciences Ltd. in Corsham, UK. The Potassium Chloride (KCl) powder was supplied as Commercial-grade powder by Surechem Products Ltd., Needham Market, Suffolk, UK.
2.2. Solution Preparations
Potassium chloride, KCl, was dissolved in double-distilled water to obtain a stock solvent up to 0.1 M. Gellan gum was then dissolved in the solvent to obtain a stock solution up to 0.05 g/cm3. In both dissolution processes, the mixture was gently stirred using a magnetic stirrer to ensure complete dissolution.
2.3. Electron-Beam Irradiation
The solution samples were irradiated using a digital linear accelerator manufactured by Elekta Infinity Company in Sweden, situated at the National Oncology Center in Benghazi, Libya. The irradiation process was conducted in an air atmosphere at room temperature, with electron energy of 6 MeV. The chosen absorbed dose ranged from 50 to 450 Gy, and changes in each sample were assessed through viscosity analysis immediately after irradiation and at various intervals. The absorbed dose rate was 2.5 kGy/min. This ensured a uniform dose distribution and avoided overheating effects during irradiation.
2.4. Characterizations
2.4.1. Viscosity Measurements
Viscosity measurements were performed using a thermostated water bath (TCB-7-Viscometer Bath, 230 V/50–60 Hz, PSL-Rheotek, Granger, IN, USA) maintained at a temperature of 24.99 ± 0.01 °C. The measurements utilized an Ostwald viscometer (YUCHENGTECH, Hangzhou, China) with a capillary diameter of 0.5 mm and a water flow time ranging from 100 to 150 s. Flow times for both the solvent and the solution were measured in triplicate, and their averages were calculated using Equation (1) [13]:
where t, to, ηr, and ηsp represent the solution flow time, solvent flow time, relative viscosity, and specific viscosity, respectively.
ηr = t/to, ηsp = ηr − 1
2.4.2. Intrinsic Viscosity and Molar Mass Determinations
For the native and degraded 0.05 g/cm3 Gellan solutions, the intrinsic viscosity ([η]) was determined by the single-concentration method, using the Solomon–Ciuta equation [14]:
The molar masses Ms of the native and degraded Gellan were calculated, using Mark–Houwink (M-H) equation (Equation (3)) relating to intrinsic viscosity as follows [15,16]:
where the M-H constants of the used polymer-solvent system were given in the literature as [17]: K[η] = 7.48 × 10⁻³ cm3/g and a = 0.91.
[η] = K[η] Mra
2.4.3. Degradation Kinetics
The degradation rate (k) of Gellan in the diluted solution was graphically obtained by using Equation (4) [18]:
where MD is Gellan molar mass at specific radiation dose, MO is the initial Gellan molar mass, and Mu is the monomeric GL molar mass. Furthermore, the rate constant k is related to the first-order lifetime (τ) as follows:
1/MD − 1/MO = k D/Mu
1/k = τ
2.4.4. Scaling Laws
The scaling parameters, including Rg and , were determined using calculations based on Equations (6) and (7), respectively [13,19,20]:
Then, the scaling coefficients ( and ) were, respectively, deduced from the scaling laws [19,20]:
where and are the equations proportionality constants.
2.4.5. Chain Flexibility
The chain flexibility parameters under non-theta conditions, including the shape parameter (), activation energy (), and solution entropy (), were determined using Equations (10)–(12), respectively [13,21,22]:
In the above equations was computed from the relation:
where is the Avogadro constant; , and T are, respectively, the activation energy, Arrhenius–like constant, gas constant, and the temperature in Kelvin; , and are the solvent entropy, solution entropy, relative enthalpy, and the Planck constant, respectively.
Equations (14)–(16) were utilized to determine the characteristic ratio (), end-to-end distance (), and persistence length (), respectively, to assess chain flexibility under theta conditions [4,13,23,24]:
The following relationships were considered during the application of the above equations [13,25,26]:
where , , , and are known as the Flory constant, intrinsic viscosity at theta condition, chain density, and critical concentration, respectively.
3. Results and Discussion
3.1. Electron Beam-Profile of Degraded Gellan Solution
Figure 1 shows how e-beam radiation affects Gellan when it is in a solution. The observed rapid decrease indicates a strong molar mass reduction up to an absorbed dose of 200 Gy. Beyond 200 Gy the rate of molar-mass decrease diminished to ~8 kg mol−1, indicating a lower scission probability once oxygen in the solution was consumed. This behavior happens because of random chain breaks, which are likely to occur at a steady rate during the fast decline part [27]. According to Figure 2, the rate constant was found to be 14.73 µ Gy−1 and the lifetime was 67.90 k Gy.
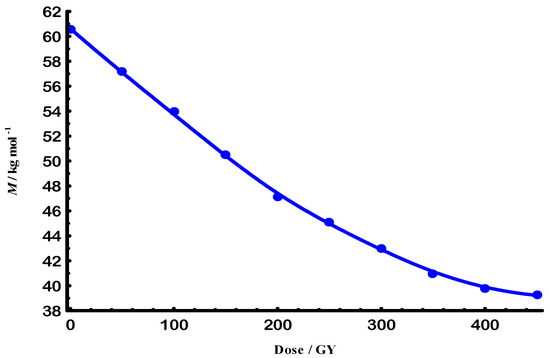
Figure 1.
E-beam exponential decay of degraded molar mass for Gellan samples at 25 °C.
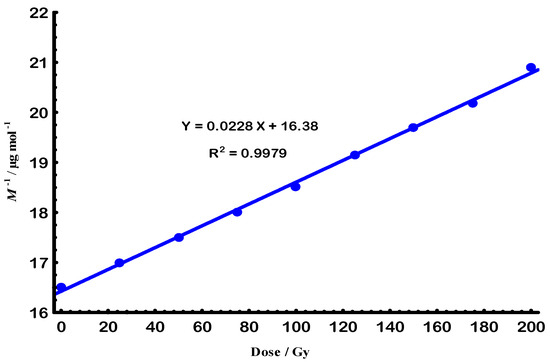
Figure 2.
The linear relationship of the first-order degradation law for Gellan sample by e-beam at 25 °C.
Similarly to the degraded molar masses (Ms) shown in Figure 1, Figure 3 illustrates the effect of e-beam radiation on the size parameter of the polymer–solvent system. A logarithmic plot in Figure 4 was then utilized to derive the corresponding scaling law.
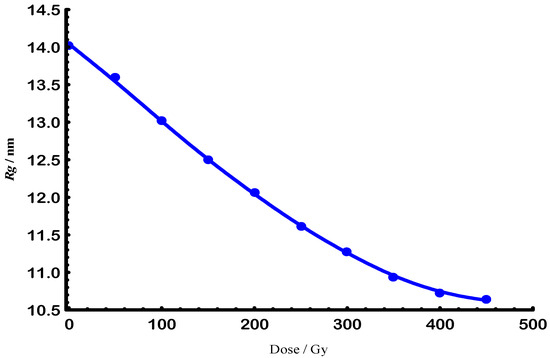
Figure 3.
E-beam exponential decay of degraded radius of gyration for Gellan samples at 25 °C.
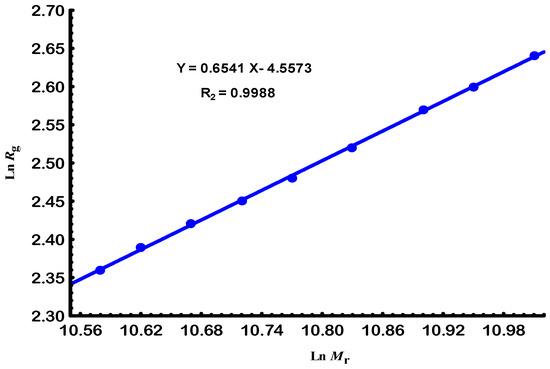
Figure 4.
The linear relationship between radius of gyration and relative molar mass for Gellan samples at 25 °C.
In contrast to the reduction in size observed in Figure 3, Figure 5 highlights the increase in solvation parameters caused by the e-beam radiation, which was used to determine the solvation scaling law through its logarithmic representation Figure 6.
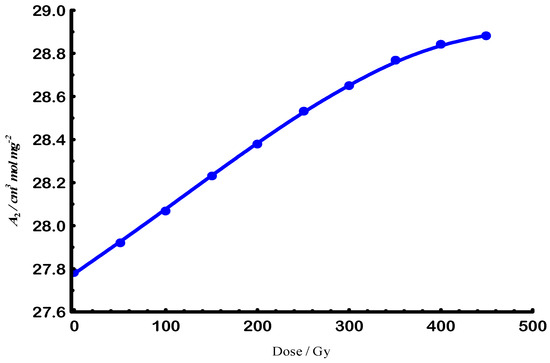
Figure 5.
E-beam exponential growth of second virial coefficient for Gellan samples at 25 °C.
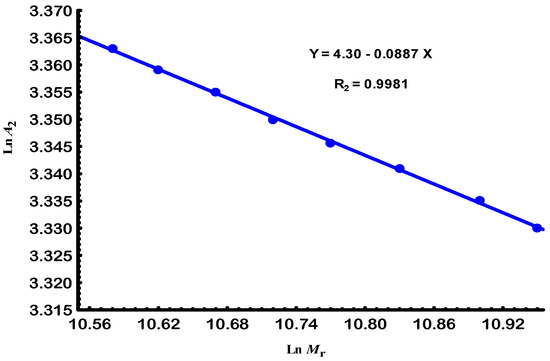
Figure 6.
The linear relationship between the second virial coefficient and relative molar mass of Gellan samples at 25.
The electron-beam irradiation led to a progressive decrease in molar mass and radius of gyration, consistent with chain scission as the dominant mechanism under the applied conditions. Nevertheless, the observed solvation parameters and second virial coefficient suggest that partial intramolecular rearrangements and limited cross-linking may also occur, especially at intermediate doses. These competing processes are influenced by the irradiation atmosphere: under air, oxidative scission is favored, while in inert conditions, stabilization of radical intermediates may promote limited cross-linking [28,29].
The above scaling profile offers valuable frameworks for tailoring the desired and using e-beam radiation. Additionally, their coefficients and , along with the M-H scaling coefficient a, which was calculated as a = 3 − 1 [13,19,23], were employed to predict the real perturbed chain, as summarized in Table 1.

Table 1.
Scaling coefficients of Gellan samples at 25 °C.
The scaling coefficients derived from the logarithmic plots confirm deviations from theta conditions, indicating that chain flexibility is altered by irradiation. The calculated parameters in Table 1 reflect a partially expanded coil conformation in solution [13].
3.2. Gellan Flexibility Under Electron-Beam Radiation
To further examine flexibility, Gellan fractions with high molar mass (HM), medium molar mass (MM), and small molar mass (SM) were analyzed. These correspond to molecular weight ranges of approximately HM > 60.59 kg/mol; MM ≈ 47.81 kg/mol; SM < 39.81 kg/mol. Their different Arrhenius behaviors, in Figure 7 and Figure 8, demonstrate that chain size plays a crucial role in determining segmental mobility and activation energy of conformational transitions [21,22].
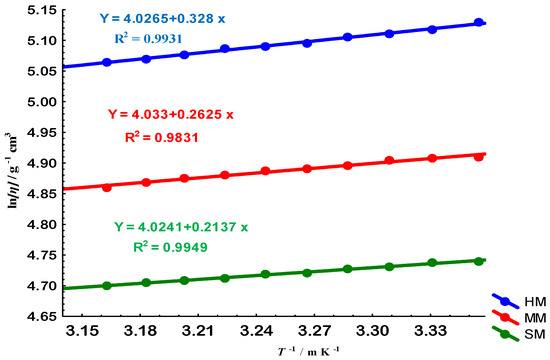
Figure 7.
Arrhenius-like plots for Gellan samples of high (HM, blue circles), medium (MM, red circles), and small (SM, green circles) molar masses. The y-axis represents the natural logarithm of viscosity () and the x-axis is the inverse of temperature (1/T). The solid lines represent linear fits to the data for each molar mass group, with the corresponding regression equations displayed. This plot is used to determine the flow activation energy (), which is proportional to the slope of the lines, revealing the temperature dependence of viscosity for the different Gellan fractions.
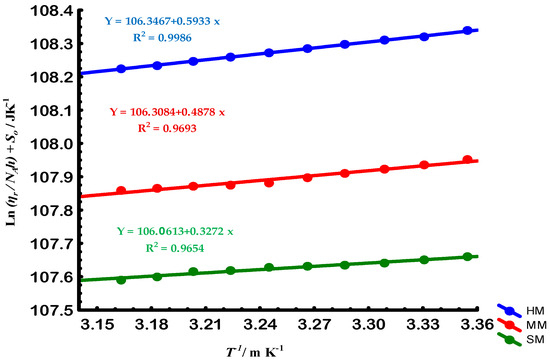
Figure 8.
Kauzmann-Eyring plots for Gellan samples of high (HM, blue circles), medium (MM, red circles), and small (SM, green circles) molar masses. The y-axis represents the solvent entropy () plus (the natural logarithm of relative viscosity () divided by Avogadro’s constant () times Planck’s constant (h)), while the x-axis is the inverse of temperature (1/T). The solid lines represent linear fits to the data for each molar mass group, with the corresponding regression equations displayed. This plot illustrates the relationship between solvent entropy, molar mass, and temperature for the different Gellan fractions.
As summarized in Table 2, electron-beam irradiation decreased the molar mass (Ms) and activation energies () of gellan in solution, while increasing its entropy (). This reduction in caused a decrease in the flexibility of the gellan chain [21,22]. Conversely, the solvent quality (SQ) was enhanced by e-beam radiation due to the increase in its [21]. However, the ideal random coiled structure of Gellan, as defined by its , remained unaffected by e-beam radiation.
Table 2.
Chain characteristics of Gellan samples under non-theta conditions.
Figure 9 and Figure 10 illustrate the relationships between and with , which represents the chain size, for both native and degraded gellan samples under theta () conditions [13,24]. As expected, these characteristics are influenced by the Gellan chain length and related molar mass M, particularly at high values of .
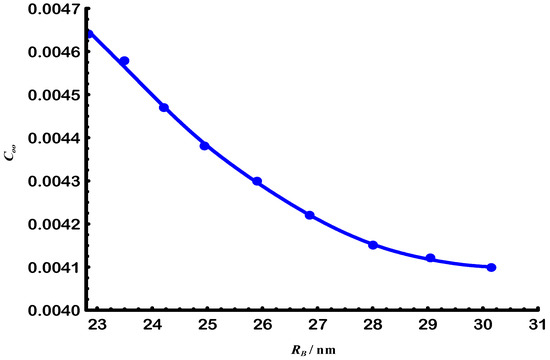
Figure 9.
Proportionality relationship between end-to-end distance and characteristic ratio of Gellan samples at 25 °C.

Figure 10.
Proportionality relationship between end-to-end distance and persistence length of Gellan samples at 25 °C.
The M dependencies of these characteristics are summarized in Table 3. As shown in Table 3, e-beam radiation resulted in a reduction in Ms and of the Gellan samples, while increasing . This increase led to a decrease in chain flexibility and an increase in solution quality of the Gellan samples, as previously discussed. Additionally, the data in Table 3 indicate no deviation from chain ideality, as reflected by , at the molar masses listed in Table 3.
Table 3.
Chain characteristics of Gellan samples under theta conditions.
4. Conclusions
In summary, electron-beam irradiation of gellan gum in dilute aqueous solution induced controlled molecular degradation with a molar mass degradation lifetime of approximately 67.90 kGy. The process resulted in a systematic reduction in radius of gyration and molar mass, accompanied by an increase in the second virial coefficient, reflecting changes in solvation behavior. Scaling analysis yielded coefficients of a = 0.95, = 0.65, and = 0.089, confirming alterations in flexibility and coil expansion relative to theta conditions. The Arrhenius analysis of different molar mass fractions (HM, MM, and SM) revealed distinct energetic requirements for conformational transitions, highlighting the dependence of chain flexibility on molar mass. These findings provide a framework for tailoring gellan gum properties through controlled irradiation, with potential applications in food, pharmaceutical, and biomedical materials.
Author Contributions
Conceptualization, F.E. and L.S.; methodology N.E.; software, N.E.; validation, F.E., L.S., A.E.A.Y. and L.S., investigation, N.E.; resources, A.E.A.Y.; data curation, N.E.; writing—original draft preparation, N.E.; writing—review and editing, F.E.; visualization, N.E.; supervision, F.E.; project administration, L.S. All authors have read and agreed to the published version of the manuscript.
Funding
This research was funded by Universty of Benghazi.
Data Availability Statement
The original contributions presented in this study are included in the article. Further inquiries can be directed to the corresponding author.
Conflicts of Interest
The authors declare no conflict of interest.
References
- Benalaya, I.; Alves, G.; Lopes, J.; Silva, L.R. A review of natural polysaccharides: Sources, characteristics, properties, food, and pharmaceutical applications. Int. J. Mol. Sci. 2024, 25, 1322. [Google Scholar] [CrossRef]
- Lin, Q.; Si, Y.; Zhou, F.; Hao, W.; Zhang, P.; Jiang, P.; Cha, R. Advances in polysaccharides for probiotic delivery: Properties, methods, and applications. Carbohydr. Polym. 2024, 323, 121414. [Google Scholar] [CrossRef]
- Ahmed, M.S.; Islam, M.; Hasan, M.K.; Nam, K.W. A comprehensive review of radiation-induced hydrogels: Synthesis, properties, and multidimensional applications. Gels 2024, 10, 381. [Google Scholar] [CrossRef]
- Hamed, Y.S.; Hassan, K.R.; Salem, M.E.; Shen, M.; Wang, J.; Bu, T.; Cao, Y.; Xia, Q.; Youssef, K.M.; Yang, K. Gamma rays irradiated polysaccharides: A review of the structure, physicochemical properties, biological activities alteration, and future food applications. Carbohydr. Polym. 2025, 323, 123326. [Google Scholar] [CrossRef]
- Wang, L.; Huang, P.; Huang, J.; Xie, H.; Liu, X.; Liu, X.; Cai, Q.; Heng, B.C.; Huang, Y.; Han, Q.; et al. Modeling of molecular weight changes of polysaccharides subjected to irradiation. Carbohydr. Polym. Technol. Appl. 2025, 6, 100815. [Google Scholar] [CrossRef]
- Abdl Aali, R.A.; Al-Sahlany, S.T. Gellan gum as a unique microbial polysaccharide: Its characteristics, synthesis, and current application trends. Gels 2024, 10, 183. [Google Scholar] [CrossRef] [PubMed]
- Kang, D.; Cai, Z.; Wei, Y.; Zhang, H. Structure and chain conformation characteristics of high acyl gellan gum polysaccharide in DMSO with sodium nitrate. Polymer 2017, 128, 147–158. [Google Scholar] [CrossRef]
- Yang, T.; Zhan, X.; Gu, L.; Zhu, L. Effects of gamma-ray irradiation on the molecular weight and gel properties of gellan gum. J. Radiat. Res. Radiat. Process. 2014, 32, 1–10. [Google Scholar]
- Muthukumar, T.; Song, J.E.; Khang, G. Biological role of gellan gum in improving scaffold drug delivery, cell adhesion properties for tissue engineering applications. Molecules 2019, 24, 4514. [Google Scholar] [CrossRef]
- Huang, Y.; Yang, N.; Zhang, Y.; Hou, J.; Gao, Y.; Tian, L.; Jin, Z.; Shen, Y.; Guo, S. The gelling behavior of gellan in the presence of different sodium salts. Int. J. Biol. Macromol. 2021, 193, 768–777. [Google Scholar] [CrossRef]
- Gao, M.; Li, H.; Yang, T.; Li, Z.; Hu, X.; Wang, Z.; Jiang, Y.; Zhu, L.; Zhan, X. Production of prebiotic gellan oligosaccharides based on the irradiation treatment and acid hydrolysis of gellan gum. Carbohydr. Polym. 2022, 279, 119007. [Google Scholar] [CrossRef]
- Mikusheva, N.G.; Zorin, I.M.; Gubarev, A.S.; Ievlev, A.V.; Volina, O.V.; Tsvetkov, N.V. Influence of reduced molar mass of low-acyl gellan gum on weak gel formation and rheological properties. Gels 2025, 11, 398. [Google Scholar] [CrossRef]
- Kulicke, W.M.; Clasen, C. Viscosimetry of Polymers and Polyelectrolytes; Springer: Berlin/Heidelberg, Germany, 2004. [Google Scholar]
- Solomon, O.F.; Ciutǎ, I.Z. Détermination de la viscosité intrinsèque de solutions de polymères par une simple détermination de la viscosité. J. Appl. Polym. Sci. 1962, 6, 683–686. [Google Scholar] [CrossRef]
- Mark, H. Über die Entstehung und eigenschaften hoch polymer festkörper. In Der Festekörper; Sanger, R., Ed.; Hirzel: Leipzig, Germany, 1938; pp. 65–104. [Google Scholar]
- Houwink, R. Zusammenhang zwischen viscosimetrisch und osmotisch bestimmten Polymerisationsgraden bei Hochpolymeren. J. Prakt. Chem. 1940, 157, 15–18. [Google Scholar] [CrossRef]
- Dreveton, E.; Monot, F.; Lecourtier, J.; Ballerini, D.; Choplin, L. Influence of fermentation hydrodynamics on gellan gum physico-chemical characteristics. J. Ferment. Bioeng. 1996, 82, 272–276. [Google Scholar] [CrossRef]
- Şen, M.; Taşkın, P.; Güven, O. Effects of polysaccharide structural parameters on radiation-induced degradation. Hacet. J. Biol. Chem. 2014, 42, 9–21. [Google Scholar] [CrossRef]
- Flory, P.J. Principles of Polymer Chemistry; Cornell University Press: Ithaca, NY, USA, 1953. [Google Scholar]
- Krigbaum, W.R.; Flory, P.J. Statistical Mechanics of Dilute Polymer Solutions. IV. Variation of the Osmotic Second Coefficient with Molecular Weight. J. Am. Chem. Soc. 1953, 75, 1775–1782. [Google Scholar] [CrossRef]
- Moore, W.R. Viscosities of dilute polymer solutions. Prog. Polym. Sci. 1967, 1, 1–43. [Google Scholar] [CrossRef]
- Kauzmann, W.; Eyring, H. The viscous flow of large molecules. J. Am. Chem. Soc. 1940, 62, 3113–3125. [Google Scholar] [CrossRef]
- Flory, P.J. Statistical Mechanics of Chain Molecules; Hanser-Gardner: Cincinnati, OH, USA, 1989. [Google Scholar]
- Lapasin, R. Rheology of Industrial Polysaccharides: Theory and Applications; Springer Science & Business Media: Berlin/Heidelberg, Germany, 2012. [Google Scholar]
- Qian, J.W.; Wang, M.L.; Han, D.L.; Cheng, R.S. A novel method for estimating unperturbed dimension [η]θ of polymer from the measurement of its [η] in a non-theta solvent. Eur. Polym. J. 2001, 37, 1403–1407. [Google Scholar] [CrossRef]
- Graessley, W.W. Polymer chain dimensions and the dependence of viscoelastic properties on concentration, molecular weight and solvent power. Polymer 1980, 21, 258–262. [Google Scholar] [CrossRef]
- Zheng, Y.; Liu, Q.; Luo, H.; Zheng, J.; Li, W. Effect of pretreatment with electron beam irradiation on the deacetylation efficiency of konjac glucomannan and its structural, physicochemical and gel properties. Int. J. Biol. Macromol. 2024, 276, 133887. [Google Scholar] [CrossRef]
- Al-Assaf, S.; Coqueret, X.; Zaman, H.M.D.K.; Sen, M.; Ulański, P. (Eds.) The Radiation Chemistry of Polysaccharides; International Atomic Energy Agency: Vienna, Austria, 2016. [Google Scholar]
- Vohlídal, J. Polymer degradation: A short review. Chem. Teach. Int. 2021, 3, 213–220. [Google Scholar] [CrossRef]
Disclaimer/Publisher’s Note: The statements, opinions and data contained in all publications are solely those of the individual author(s) and contributor(s) and not of MDPI and/or the editor(s). MDPI and/or the editor(s) disclaim responsibility for any injury to people or property resulting from any ideas, methods, instructions or products referred to in the content. |
© 2025 by the authors. Licensee MDPI, Basel, Switzerland. This article is an open access article distributed under the terms and conditions of the Creative Commons Attribution (CC BY) license (https://creativecommons.org/licenses/by/4.0/).