Abstract
Thermal management in heat exchangers is crucial in many industrial, medical, and scientific applications. However, reducing dependency on active energy sources still represents a substantial challenge. In this context, phase change materials (PCMs) offer an effective solution due to their ability to store and release large amounts of latent heat, assisting in passive thermal management. Therefore, this study proposes the use of RT42 PCM inside a box-type shell-and-tube configuration to establish the relationship between flow rate and charging and discharging behavior of PCM. In the proposed system, heat transferring fluid (HTF) water is circulated in the internal tubes at 60 °C, where the temperature is monitored by a series of thermocouples strategically placed inside the box-type configuration. To evaluate the effect of the flow of HTF on the thermal behavior of the PCM, the charging (melting) and discharging (solidification) analysis is performed by varying the water flow rate at three levels: 1.2, 0.8, and 0.4 L/min inside the laminar region (Re < 2300). A thermal camera and two webcams were used to assess the surface temperature distribution and PCM response, respectively. It was determined that increasing the flow rate accelerates charging and discharging with fluctuations in temperature curves during melting.
1. Introduction
Thermal management is of paramount importance across a wide array of industrial and scientific applications, underpinning efficiency and sustainability in modern processes, commercial operations, and residential settings alike [1]. Precise thermal control is critical for optimizing performance in various thermal systems, from general energy consumption to specific uses such as building heating and cooling, and battery thermal management systems [2,3,4].
Despite the crucial demand for efficient thermal management, conventional systems, such as traditional shell-and-tube heat exchangers, often exhibit significant limitations. Continuous heating methods can be energy inefficient, leading to considerable energy losses. Challenges such as a lack of energy efficiency and suboptimal structural designs contribute to substantial energy waste during storage and release processes. Furthermore, internal temperature stratification and the formation of melting dead zones can significantly hinder the overall performance of these systems [5,6]. To address this, studies have shown that optimizing designs, such as a combined shell-and-tube and multi-tube approach, can significantly improve uneven temperature distribution and reduce melting dead zones, leading to rapid heat storage and release [7,8]. For instance, Wu X. et al. [5] discussed an optimized model with layered fins that shortened the full melting duration by 31.6% and the temperature homogenization time by 30.4%, effectively alleviating local overheating and improving liquid PCM accumulation. Moreover, changes in the design contribute to an increase in the overall mass of the system [9]. Therefore, thermal energy storage systems (TES), especially latent heat thermal energy storage systems (LHTES), play a vital role in energy management, improving the efficiency of energy usage, thereby assisting in energy conservation and emissions reduction, and encouraging the resourceful use of renewable energy [10,11].
PCMs have emerged as a highly promising solution for TES systems. PCMs effectively absorb, store, and release substantial amounts of latent heat during their phase transitions, typically from solid to liquid and vice versa, often maintaining a nearly constant temperature [1]. This inherent property offers several distinct advantages, including high energy storage density per unit volume and mass, enhanced stability, high thermal storage efficiency, and environmental friendliness [2,12]. The passive heat storage and release capabilities of PCM-based systems enable them to effectively regulate temperature and mitigate the supply–demand mismatch commonly associated with renewable energy sources, thereby improving overall energy utilization efficiency [13]. These intrinsic thermal properties of PCMs make them suitable for utilization in shell-and-tube heat exchangers.
Among the various thermal energy storage configurations, shell-and-tube heat exchangers are widely adopted due to their robust design, high energy density, and ease of fabrication [14]. In these systems, PCM is typically housed in the shell space, while a heat transfer fluid (HTF) circulates through inner tubes to facilitate heat exchange. Widespread research has explored numerous strategies to enhance the thermal performance of shell-and-tube configurations incorporating PCMs. These include optimizing geometric parameters [15,16], incorporating fins [17,18,19,20], and adding nano-enhanced PCMs (NePCMs) [21,22,23,24]. For instance, studies show that using a triplex tube heat exchanger, compared to double tube heat exchangers, can reduce the melting time of PCM by about 6% [25]. Furthermore, increasing the number of tubes to four can help to reduce the melting time further. For example, Esapour et al. [26] demonstrated that a four-tube heat exchanger reduced melting temperature time by 29%, whereas another study used new fin structures, which improved melting performance by up to 23.87% in triple-tube systems [27]. Similarly, biomimetic fins have been shown to shorten melting time by 45.9% [28]. About the NePCMs and nano-based HTF, Motevali et al. used 1% nano-HTF and 3% nano-enhanced PCM (SWCNT nanoparticles), which decreased the PCM melting rate by about 39% [12].
Widespread research has focused on optimizing the thermal performance of shell-and-tube heat exchangers with PCMs, primarily through enhancing melting/solidification rates via novel fin geometries, nanoparticle integration, or optimizing operational parameters. However, there remains a notable research gap in experimental investigations specifically focused on the active temperature control capabilities of PCM-based heat exchangers under varying operational loads, especially within the laminar flow range for both charging and discharging options. Therefore, the current study addresses this by providing an experimental investigation into a shell-and-tube box-type configuration by using RT42 PCM with varying flow rates (1.2, 0.8, and 0.4 L/min). The main objective of the study is to experimentally study the effectiveness of the commercial PCM RT42 inside a box-type shell-and-tube configuration, both in solidification and melting phases, at various flow rates against time. This specifically contributes to the understanding of PCM-based thermal energy storage systems. Overall, the work offers novel insights into the practical implementation of PCM-based systems for maintaining stable thermal conditions in real-world applications.
The paper is organized as follows: Section 2 (Materials and Methods) details the PCM properties, experimental setup, instrumentation, and testing procedures. Section 3 presents a comprehensive analysis of the results, including both quantitative and qualitative evaluations of the thermal performance.
2. Materials and Methods
2.1. PCM and Materials Used
In this article, commercial RT42 PCM is used, having specifications as per Table 1. Tubes made of aluminum are used inside the box-type shell-and-tube configuration, where distilled water with a specific heat capacity of 4.18 kJ/kg · K is circulating. J-type thermocouples are used to collect temperature data.

Table 1.
Thermophysical properties of RT42 phase change materials [29].
2.2. Description of the Experimental Setup
The entire experimental system was carefully designed to study the thermal behavior of a shell-and-tube configuration under controlled conditions. The apparatus consists of several key components that work together. The temperature of the heat transfer fluid is controlled by a water bath thermostat (Julabo model F32, power supply: 207–253 V/50 Hz, 13A at 230 V), which allows the desired operating conditions to be maintained. The central section of the system is a “box”-type shell-and-tube configuration. The box is made entirely of transparent plexiglass, with dimensions of 200 mm × 200 mm × 40 mm, to facilitate visual observation of the phase transition phenomena. Five cylindrical aluminum tubes, each with an internal diameter of 12 mm, through which the temperature-controlled water flows, are installed.
The system is also equipped with a SICK flow meter to monitor fluid flow and with control valves that allow the inlet flow rate to be varied. Twelve J-type thermocouples were installed to collect thermal data: eight distributed within the box (TC-1, TC-II, TC-III, TC-IV, TC-V, TC-VI, TC-VII, and TC-VIII), one at the fluid inlet (TC-inlet), one at the outlet (TC-exit), one thermocouple positioned on the center of the top outer surface of the glass wall (TC-topG), and one for ambient conditions measurement (TC-amb). The exact location is shown in Table 2. The mentioned thermocouples are strategically placed to monitor the temperature variances for the melting and solidification fronts with respect to the z, y, and x axes, and to examine the impact of distance variation from the tube, inside the shell-and-tube configuration.
Table 2.
Location of thermocouples used in the experimental setup (length units in mm).
Thermal mapping was further supported by an infrared thermal imaging camera (FLIR Thermacam SC3000 model, AAA Testers, Southgate, MI, USA), which allows for real-time thermal image acquisition, and two webcams (Atlantis p015-U970HD rev 20.0) used for continuous visual monitoring of the system. All acquired data were collected and recorded using a multichannel acquisition system (Agilent 34980A), ensuring high precision in reading and analyzing experimental parameters. Figure 1 and Figure 2 illustrate in more detail the overall setup and the structure of the transparent box-type shell-and-tube configuration, and the internal arrangement of the tubes, allowing a clear view of the experimental geometry adopted.
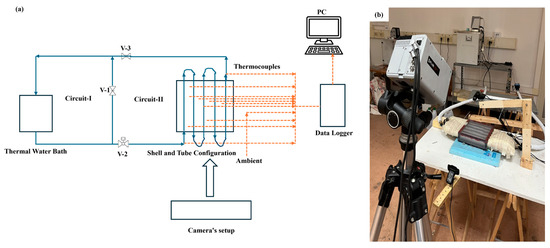
Figure 1.
Experimental setup: (a) block diagram, and (b) real-time setup containing phase change material inside a box-type shell-and-tube configuration.
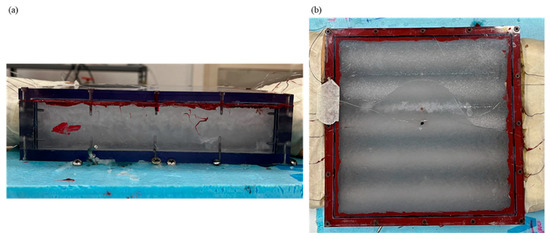
Figure 2.
Box-type shell-and-tube configuration having RT42 phase change materials inside it: (a) side view, and (b) top view.
2.3. Instrumentation
Temperature data were collected using 12 J-type thermocouples (tolerance ±1.5 °C), strategically positioned within the system. Eight of these were placed at selected points in the shell-and-tube configuration to monitor the thermal distribution in detail. One thermocouple was positioned at the inlet and another at the outlet of the heat transfer fluid, while the remaining two were installed on the top of the box and in the surrounding environment, respectively, to monitor external conditions. The signals from the thermocouples were acquired in millivolts using a data acquisition system (Agilent 34980A) and subsequently converted to temperature using the calibration curve for the specific multiplication factor for each thermocouple. In this study, V-T curves obtained during thermocouple calibration are used for converting mV to degrees Celsius.
To visually monitor the charging and discharging process of the phase change material, two webcams (one with a side view and the other with a top view) were used, allowing for real-time observation of the evolution of the phenomenon within the system. Additionally, an infrared thermal imaging camera (FLIR Thermacam SC3000) was used to analyze the surface temperature of the glass wall during the phase transition. The fluid flow rate is regulated using control valves and a flow meter (SICK) (measurement accuracy = ±(2% of measured value + 0.15% of full scale), repeatability ≤0.5%, resolution 0.003 L/min; full scale = 21 L/min), while the temperature of the heat transfer fluid is kept constant thanks to the automatic control provided by the bath thermostat (Julabo F32) (temperature stability ≈ ±0.01–0.02 °C). This system ensures stable and reproducible operating conditions throughout the entire experimental cycle.
2.4. Experimental Procedure
For the experimental tests, well-defined protocols as mentioned below were followed to ensure accurate real-time data acquisition. The PCM used in this study is RT42, selected for its thermal characteristics that are suitable for the temperature range considered. Alongside it, the flow rates are fixed inside the laminar region (Re < 2300), i.e., 1.2, 0.8, and 0.4 L/min. The reason behind it is the lab-scale constraints, such as tube size, HTF operability, and analysis of temperature curves for this defined setup in a laminar flow regime. The flow rates are calculated by using the following set of equations, while the values are discussed in Table 3:
where u is the velocity of water and A is the tube area
Table 3.
Flow rates calculation using Equation (4).
Equation (1) becomes
First, the RT42 is brought to the liquid state using a hot plate (as shown in Figure 3) and then poured into the plexiglass box. The melting temperature is maintained approximately 10 °C above the PCM transition range to ensure uniform filling and avoid voids or inhomogeneities. Once this operation is completed, the system is left to rest in natural environmental conditions, allowing the material to solidify completely.
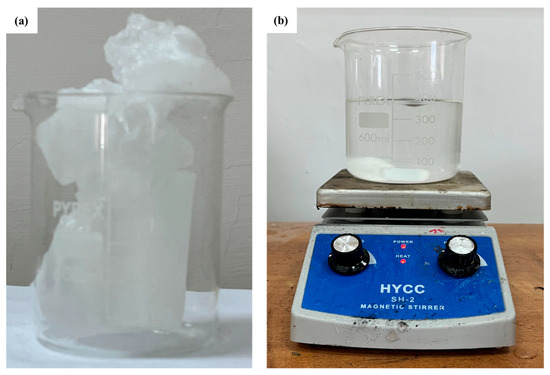
Figure 3.
RT42 PCM: (a) solid PCM in beaker, and (b) melted PCM over hotplate.
Before starting the experiment, the data acquisition system (Agilent 34980A) operates for a few minutes to stabilize the signals and reduce any initial disturbances or fluctuations. In this phase, the temperature of the thermostatic bath (Julabo F32) is set to 60 °C, but the water flow is not yet directed to the box. Instead, the water is circulated through the auxiliary circuit (circuit-I) by opening valve V-1 and keeping V-2 and V-3 closed, as shown in Figure 1a, to allow the desired temperature to be reached and maintained within the system.
Once the temperature has stabilized at 60 °C, the flow is activated by opening the valves V-2 and V-3 while keeping V-1 closed and thus the flow will be regulated in the inlet to the box containing the PCM. Initially, the volumetric flow rate is set to 1.2 L per minute, and simultaneously, data collection for the thermal charging phase (PCM melting) begins. The twelve J-type thermocouples collect data every 5 s, providing a detailed map of the thermal evolution within the shell-and-tube configuration.
At the end of the charging phase, the flow is stopped and the thermal bath temperature is lowered to 30 °C. Once this value is reached, the flow is restarted—still at a rate of 1.2 L/min—to initiate the thermal unloading phase (PCM solidification), during which data acquisition continues using the same methods.
The entire procedure is then repeated for two additional volumetric flow rates: 0.8 and 0.4 L per minute. This allows us to evaluate the influence of the flow regime on the thermal behavior of the PCM during the melting and solidification cycles. The entire process is monitored in real time via two webcams (side and top view) and the infrared thermal camera (FLIR SC3000), which provides additional information on the box’s surface temperature and real-time PCM charging and discharging behavior.
3. Results and Discussion
The results and discussion are divided into two main parts: a quantitative assessment and a qualitative assessment. The quantitative part examined the temperature–time curves relating to the PCM charging and discharging phases, using data acquired from thermocouples deliberately placed within the system. The qualitative assessment, on the other hand, represents the analysis of thermographic images and footage from webcams for better visualization of the spatial dynamics of the phase transition process.
3.1. Quantitative Analysis
3.1.1. Charging Behavior of RT42 PCM
The experiments were carried out at three different flow rates and a constant temperature of 60 °C. RT42 PCM started melting while absorbing thermal energy; in other words, thermal charging started. Figure 4 shows three experiments (1.2 L/min, 0.8 L/min, and 0.4 L/min). For all experiments, it was found that the melting process started initially near the vicinity of the tube. The initial temperature was 30–32 °C, where the water circulation was maintained at 60 °C.
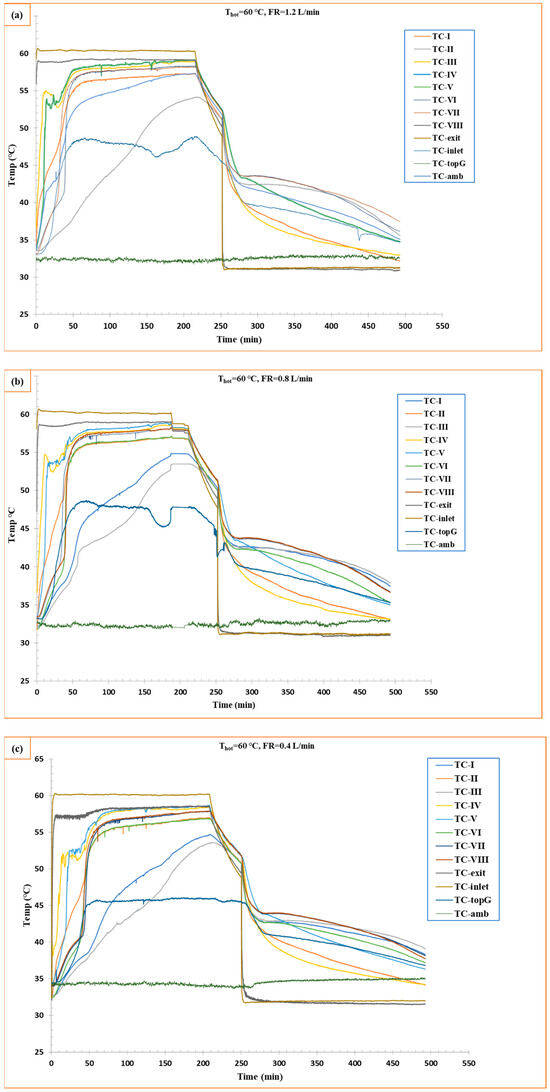
Figure 4.
Temperature vs. time curve for charging and discharging of RT42 PCM: (a) flow rate 1.2 L/min, (b) flow rate 0.8 L/min, and (c) flow rate 0.4 L/min.
At 1.2 L/min, PCM started melting quickly to reach the melting temperature of 42 °C, where the steady state was achieved at ≈140 min. The temperature curves show steeper slopes, more precisely for thermocouples connected at a high y-axis level, because the melted PCM (0.76 kg/L) density is lower than the PCM in the solid state (0.88 kg/L), which causes a rise of melted PCM to the upper level in the box. Furthermore, the PCM near the tubes melted quickly due to the high convection from water to the tube surfaces and then to the RT42 PCM, whereas, at the 0.8 L/min flow rate, the charging was slower compared to the 1.2 L/min flow rate, taking ≈155 min to achieve steady-state temperature. On the other hand, the 0.4 L/min flow rate showed partial melting at the same duration, and it did not reach the temperature where the first two experiments (1.2 and 0.8 L/min) reached (56–57 °C), with a lot of temperature fluctuations. These results support the literature study conducted by Al-Abidi et al. [30], where they found that increasing the mass flow rate of heat transferring fluid (HTF) from 8 kg/min to 32 kg/min can increase the melting rate of the PCM.
Furthermore, the thermal analysis revealed distinct spatial temperature variations, with thermocouples positioned farther from the tubes consistently recording lower temperatures. The system exhibited notable temperature fluctuations, attributed to the dynamic movement of solid PCM flocks from upper to lower levels within the enclosure, causing intermittent thermal disturbances. Temperature fluctuations are caused by the instability of the melting front, when the interfaces of the solid–liquid phase progress, and small detached fragments are produced due to localized melting. The small flocks generate disturbances in the thermal zone, leading to local temperature fluctuations. Moreover, at low flow rates such as 0.4 L/min, weaker convective forces permit these fragments to sustain for longer periods, obstructing heat transfer and thus participating in temperature fluctuations. On the other hand, low thermal conductivity and high latent heat of RT42 PCM slow down heat penetration, which causes non-uniform melting. Similarly, the density difference of the PCM solid and liquid states can contribute to buoyancy-driven motion of these fragments, and can thus amplify the transient behavior. Thermocouple data (TC-topG) demonstrated that higher flow rates resulted in increased heat loss from the top surface of the shell-and-tube configuration to the environment compared to lower flow conditions. This suggests greater convective heat transfer at elevated flow rates, though with associated thermal losses.
Comparative analysis of the three experimental cases confirmed that increasing the heat transfer fluid flow rate through the tubes enhanced overall heat transfer efficiency. This improvement directly reduced the charging time of RT42 PCM, indicating a strong dependence between fluid velocity and phase change dynamics. The observed behavior underscores the importance of flow rate optimization in thermal energy storage system design.
3.1.2. Solidification Performance of RT42 PCM During Discharge
The solidification performance of the PCM during the discharging phase by reducing the HTF in the system temperature to 30 °C is observed in this stage, where the discharging reference temperature was a higher temperature achieved in the charging phase, which was usually 55–56 °C. Figure 4 shows the temperature response at different points as defined by the thermocouples during the cooling process of PCM at three different flow rates of HTF.
At 1.2 L/min, it was observed that the cooling was rapid, especially around the tubes, and further propagated to other parts in the radial direction. The PCM reached a steady temperature of 35.09 °C in around 490 min (including the time for charging ≈ 140 min). This rapid heat removal was caused by a high flow rate. This, in turn, reduced thermocouple temperature with a high slope, reflecting efficient latent heat extraction, while at 0.8 L/min, it showed a slow solidification. Moreover, at 0.4 L/min, it showed a much lower cooling rate, even though it did not reach the temperature that was achieved by 1.2 L/min (35.09 °C). The trend of these results coincides with results obtained by Wang et al. [31].
There is one important consideration: the time to bring the temperature of HTF from 60 to 30, which took 40 min. During this time, PCM started discharging only through heat loss from the uninsulated parts of the shell-and-tube box-type configuration. Notably, the solidification phase exhibited significantly fewer temperature fluctuations compared to charging, indicating more stable heat transfer conditions during discharge. This contrast suggests fundamentally different phase change dynamics—with charging dominated by convective PCM movement causing thermal variability, while discharging proceeds through more uniform conductive heat transfer. These findings highlight the importance of the need for distinct thermal management strategies during each phase of PCM operation.
3.1.3. Average Temperatures Trend
To further explore the thermal behavior of the PCM during charging and discharging cycles, Figure 5 shows the average temperature recorded by eight thermocouples (TC-I, II, III, IV, V, VI, VII, and VIII) chosen from those installed in the shell-and-tube configuration inside the box containing the PCM, for each of the three flow rates analyzed. These curves represent the average thermal progression of the system as a function of time and allow a direct relationship of heat transfer efficiency under different operating conditions.
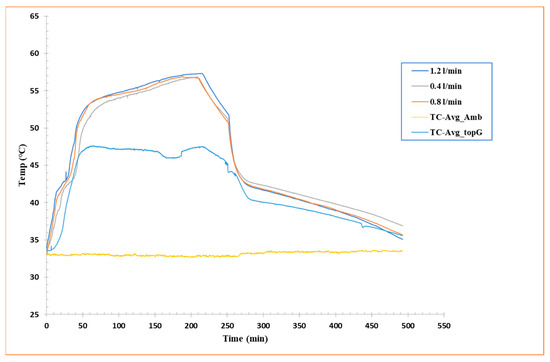
Figure 5.
Average temperature vs. time curves for flow rate 1.2 L/min, flow rate 0.8 L/min, and flow rate 0.4 L/min.
As already highlighted in Section 3.1.1 and Section 3.1.2, a clear dependence of charge/discharge efficiency on HTF flow rate is observed. Particularly, a higher flow rate resulted in a shorter overall heat exchange time, but at the same time, a lower amount of energy stored or released by the RT42 PCM. Inversely, a lower flow rate favored much slower heat transfer into the PCM. The curve for a flow rate of 1.2 L/min, for example, shows a speedy rise during charging and a quick fall during discharging, indicating a high heat transfer rate but a shorter residence time in the PCM phase transition region. This behavior is indicative of a system that responds rapidly to the HTF but may not fully employ the PCM’s latent capacity.
This examination is specifically relevant for real-world applications where a rapid thermal response is required, such as passive cooling systems for electronic components or in buildings to relieve temperature peaks. In conclusion, the analysis of temperature averages supplements the idea that there is an optimum trade-off between fluid flow rate and effective PCM utilization. It will be essential to balance the thermal response rate with the total amount of energy stored or released, considering the geometric constraints and boundary conditions of the system.
3.1.4. Thermal Profile of Equally Positioned Thermocouples
To characterize the horizontal heat distribution patterns within the shell-and-tube system, temperature measurements were recorded along the axial length of the PCM-filled glass enclosure. As shown in Figure 6, data from four centrally positioned thermocouples, aligned at equal vertical height but distributed horizontally, provide comparative temperature profiles across the tested flow rates. A similar kind of trend is followed for melting and solidification vs. flow rates of HTF. This trend can be seen in Figure 6, where 1.2 L/min flow rate reaches a steady temperature faster than the low flow rates (both in charging and discharging phases). This method allows for examination of thermal behavior in the longitudinal path, underlining any asymmetries or inhomogeneities in horizontal heat propagation, a remarkably significant viewpoint in horizontal configurations where natural convection is inadequate.
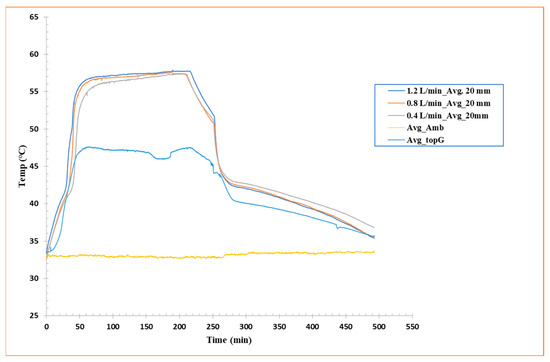
Figure 6.
Average temperature (four thermocouples located at 20 mm height) vs. time curves for flow rate 1.2 L/min, flow rate 0.8 L/min, and flow rate 0.4 L/min.
The data analysis reveals relatively uniform behavior during the discharge phase, with all thermocouples displaying similar thermal behavior and relatively even progressive cooling along the x-axis. This indicates that, during solidification, heat transfer occurs primarily through radial conduction around the tubes, with a fairly consistent diffusion of cold in the longitudinal direction, at least in the central region.
Nevertheless, during the charging phase, the curves show slight fluctuations and phase shifts, indicating that heat accumulation in the PCM is not entirely uniform along the horizontal direction. These variances can be attributed to local conduction and distribution effects of the heat flux from the aluminum tubes, but also to small variations in the internal geometry, tube arrangement, or local thermal conductivity of the PCM caused by the solid/semisolid/liquid state. These horizontal fluctuations, while not staggering, emphasize that even in geometrically symmetric configurations, spatial thermal variations can occur, highlighting the significance of precise probe distribution and 3D modeling for future studies.
Overall, the results indicate good consistency in longitudinal thermal behavior during solidification, while the melting phase is more sensitive to local effects, likely related to the horizontal orientation, the initial condition of the PCM, and the initiation dynamics of heat transfer.
3.1.5. Thermal Stratification and Spatial Effects
The thermal stratification in the horizontally oriented box-type shell-and-tube configuration is observed as presented in Figure 1. Thermocouples located at higher levels, such as TC-IV and TC-V (30 mm and 35 mm, respectively), quickly and consistently reached higher temperatures compared to lower-located thermocouples, as shown in Figure 4. This higher initial temperature gap is caused by weak convection during melting and minimal circulation in these specific locations. From this observation, it is clear that geometric design and orientation can significantly affect thermal uniformity and consistency, which further needs optimization.
3.2. Qualitative Assessment
Two types of visual confirmation are examined, first through thermal camera imaging and second through webcam footage. The thermal camera was positioned to cover the top- and front-side glass surface temperature of the box-type shell-and-tube configuration. On the other hand, two webcams were installed to gather the real-time footage of the top and front views of the system. The setup is shown in Figure 1.
Figure 7, Figure 8 and Figure 9 show the exact melting and solidification process of RT42 PCM through thermography, top-view footage, and front-view footage, respectively. Thermographic images and footage acquired by webcams located at the top and front of the experimental setup played a fundamental role in supplementing the quantitative data provided by the thermocouples. A thermal imaging camera was permitted for real-time visualization of heat propagation during the PCM charging and discharging phases, offering detailed 3D information that would not have been viable from point-by-point thermocouple measurements alone. For information, the box is made of plexiglass with an emissivity coefficient of 0.86.
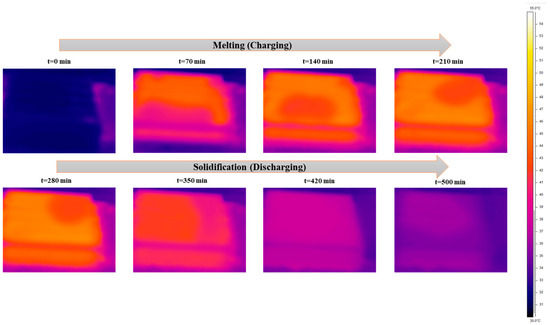
Figure 7.
Temperature distribution images taken through the thermal camera for charging and discharging of the box-type shell-and-tube configuration filled with PCM.
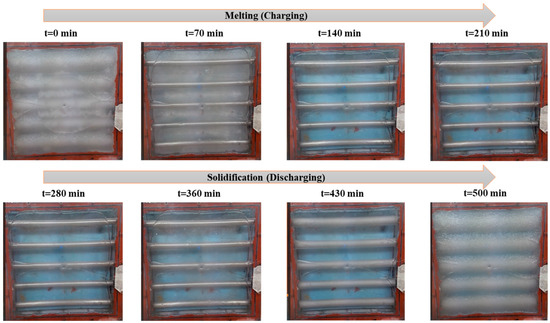
Figure 8.
Real-time PCM charging and discharging behavior; top-view images of the box-type shell-and-tube configuration taken through a webcam.
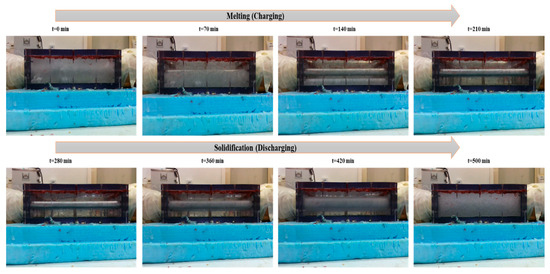
Figure 9.
Real-time PCM charging and discharging behavior front-view images of the box-type shell-and-tube configuration taken through a webcam.
To validate the temperature of glass surfaces measured by a thermal camera, a thermocouple was installed at the top center of the box. This setup allows for the accurate measurement of surface temperature at a single point. It was found that the thermocouple TC-topG shows the same result as the thermal camera at the center point. During the charging (melting) phase, thermography steadily showed that the melting process commenced near the aluminum tubes, where heat was transported directly from the HTF, and then slowly spread toward the outlying regions of the PCM. The initial melting areas acted as hotter areas in the thermal images, which gradually extended over time. These observations prove the predominance of conductive heat transfer in the initial phase, with a partial influence from natural convection, typical of the horizontal configuration adopted. The upper surface of the PCM revealed a faster thermal distribution than the lower surface, visually supplementing the thermal stratification already highlighted by the thermocouple data.
During the discharge (solidification) phase, a reverse evolution was observed as follows: the coldest regions initially formed around the tubes and slowly spread toward the rest of the material, with delayed solidification in the corners and along the edges. These phenomena were steady with the slower thermocouple readings located in those same areas, confirming non-consistent solidification due to the low thermal conductivity of the PCM and the system geometry, which deters complete heat dissipation.
Webcam footage effectively captured phase transition fronts, particularly the development of semisolid (sludgy) regions during intermediate melting stages. In multiple trials, partial melting areas were clearly identifiable, highlighting the value of multimodal monitoring for PCM studies. Combined thermographic and visual data revealed three key behaviors: (1) melting and solidification progressed directionally from tube surfaces outward, (2) localized, partially transformed zones formed at specific locations, and (3) a strong correlation existed between central glass temperatures and corresponding thermocouple readings. This integrated approach provided critical insights into spatiotemporal phase change dynamics that single-method observations might overlook. Additionally, thermography verified the repeatability of the tests, indicating similar thermal behaviors in tests carried out under similar conditions, a decisive characteristic for confirming the steadfastness of the experimental results.
In summary, the combination of thermographic monitoring and visual observation offered a more comprehensive picture of the phase change dynamics and emphasized the understanding of heat transfer mechanisms in the PCM. These approaches are commonly suggested in the literature for studying thermal energy storage systems (Trigui et al. [32], Shu et al. [33]), as they allow for real-time visualization and validation of the phase transition process.
3.3. Future Work
It is not only a single parameter that comes into play; therefore, it is important to develop a balance between parameters while using PCM in real-time applications. The current scenario’s core principle for balancing flow rate against speed and energy efficiency in a shell-and-tube configuration lies between the trade-offs, such as heat transfer (convective) and pumping power. It is evident from the study that the flow rate enhancement of HTF can cause a reduction in the melting and solidification time period, leading to a faster convective heat transfer to and from the PCM. However, this enhances the operational cost, as more power is going to be utilized to maintain higher flow rates. Therefore, it needs to be critically designed for enhancing thermal performance without the need for excessive energy cost.
4. Conclusions
This experimental study investigated the thermal performance of RT42 PCM in a box-type shell-and-tube configuration with five aluminum tubes carrying temperature-controlled water as HTF. A comprehensive monitoring system—including twelve J-type thermocouples (eight internally distributed and four measuring boundary conditions), thermographic imaging, and webcam footage—enabled detailed analysis of phase change dynamics under three flow rates (0.4, 0.8, and 1.2 L/min) at 60 °C (charging) and 30 °C (discharging).
Key findings reveal that higher flow rates (1.2 L/min) significantly enhance thermal transfer, exhibiting steeper temperature–time gradients and faster phase transitions compared to lower rates (0.8 and 0.4 L/min). The melting phase exhibited greater temperature fluctuations than solidification, attributed to convective PCM movement and flock displacement within the enclosure. Multimodal visualization (thermal/optical) further elucidated directional phase progression—from tube surfaces outward—and localized partial melting spots.
These results underscore the critical influence of operational parameters, particularly flow rate, on PCM charging/discharging efficiency. For practical applications, system optimization should balance flow rate selection with thermal stability requirements, while addressing heat loss through improved insulation design. Future work could explore geometric modifications or hybrid enhancement techniques to mitigate phase change heterogeneity.
Author Contributions
I.U.R.: Writing—original draft, writing—review and editing, conceptualization, validation, visualization, methodology, formal analysis, investigation, and data curation. N.K.: Methodology, investigation, writing—review and editing. O.M.: Writing—review and editing, supervision, project administration, conceptualization. B.B.: Funding acquisition, writing—review and editing, project administration, supervision. S.N.: Writing—review and editing, supervision, conceptualization, project administration. All authors have read and agreed to the published version of the manuscript.
Funding
This research is funded under the National Recovery and Resilience Plan (NRRP), Mission 4 Component 2 Investment 1.3, grant No. PE0000021—“Network 4 Energy Sustainable Transition-NEST”, Spoke 6, ENERTERM—UniCampania—Funded by European Union—Next Generation EU, CUP C39J24001340008.
Data Availability Statement
The original contributions presented in this study are included in the article. Further inquiries can be directed to the corresponding author.
Conflicts of Interest
The authors declare no conflicts of interest.
Abbreviations
The following abbreviations are used in this manuscript:
| PCM | Phase Change Material |
| RT42 PCM | Rubitherm 42 PCM |
| Re | Reynolds Number |
| HTF | Heat Transferring Fluid |
| TES | Thermal Energy Storage |
| LHTES | Latent Heat Thermal Energy Storage |
| NePCMs | Nano-enhanced PCM |
| SWCNT | Single-Wall Carbon Nanotubes |
| TC | Thermocouple |
| topG | Top Glass |
| amb | Ambient |
| 3-D | Three Dimension |
| t | Time |
References
- Rahman, I.U.; Nardini, S.; Buonomo, B.; Manca, O.; Khan, H.; Siviero, B. Thermal interface materials: A promising solution for passive heat dissipation in electronic appliances. Therm. Sci. Eng. Prog. 2025, 62, 103673. [Google Scholar] [CrossRef]
- Vyshak, N.R.; Jilani, G. Numerical analysis of latent heat thermal energy storage system. Energy Convers. Manag. 2007, 48, 2161–2168. [Google Scholar] [CrossRef]
- Saha, S.C.; Ahmed, S.F.; Ahmed, B.; Mehnaz, T.; Musharrat, A. A review of phase change materials in multi-designed tubes and buildings: Testing methods, applications, and heat transfer enhancement. J. Energy Storage 2023, 63, 106990. [Google Scholar] [CrossRef]
- Rahman, I.U.; Manca, O.; Buonomo, B.; Bounib, M.; Rehman, S.U.; Salhab, H.; Caggiano, A.; Nardini, S. Assessment of Phase Change Materials Incorporation into Construction Commodities for Sustainable and Energy-Efficient Building Applications. Buildings 2025, 15, 3109. [Google Scholar] [CrossRef]
- Wu, X.; Hao, K.; Chang, Z.; Lv, C.; Cao, S.; Yu, Y.; Tang, S.; Zhang, D. Study on temperature distribution optimization and enhanced heat transfer in shell and tube phase change accumulator. Renew. Energy 2025, 242, 122469. [Google Scholar] [CrossRef]
- Kiyak, B.; Oztop, H.F.; Biswas, N.; Selimefendigil, F. Effects of geometrical configurations on melting and solidification processes in phase change materials. Appl. Therm. Eng. 2025, 258, 124726. [Google Scholar] [CrossRef]
- Kurşun, B.; Balta, M. Evaluation of the different inner and outer channel geometry combinations for optimum melting and solidification performance in double pipe energy storage with phase change material: A numerical study. J. Energy Storage 2023, 65, 107250. [Google Scholar] [CrossRef]
- Anish, R.; Joybari, M.M.; Seddegh, S.; Mariappan, V.; Haghighat, F.; Yuan, Y. Sensitivity analysis of design parameters for erythritol melting in a horizontal shell and multi-finned tube system: Numerical investigation. Renew. Energy 2021, 163, 423–436. [Google Scholar] [CrossRef]
- Abeykoon, C. Improving the performance of shell-and-tube heat exchangers by the addition of swirl. Int. J. Process Syst. Eng. 2014, 2, 221–245. [Google Scholar] [CrossRef]
- Fan, K.; Zong, S.; Gao, H.; Duan, Z. Experimental Study on Thermal Performance of PCM in an Inclined Shell-and-Tube Latent Heat Thermal Energy Storage Unit. Processes 2025, 13, 1557. [Google Scholar] [CrossRef]
- Li, Y.; Liu, P.; Li, P.; Feng, Y.; Gao, Y.; Diao, X.; Chen, X.; Wang, G. Neural network-inspired hybrid aerogel boosting solar thermal storage and microwave absorption. Nano Res. Energy 2024, 3, e9120120. [Google Scholar] [CrossRef]
- Motevali, A.; Hasandust Rostami, M.; Najafi, G.; Yan, W.-M. Evaluation and Improvement of PCM Melting in Double Tube Heat Exchangers Using Different Combinations of Nanoparticles and PCM (The Case of Renewable Energy Systems). Sustainability 2021, 13, 10675. [Google Scholar] [CrossRef]
- Kudachi, B.; Varkute, N.; Mashilkar, B.; Guthulla, S.; Jayaprakash, P.; Aaron, A.; Joy, S. Experimental and computational study of phase change material based shell and tube heat exchanger for energy storage. Mater. Today Proc. 2021, 46, 10015–10021. [Google Scholar] [CrossRef]
- Li, X.; Wang, X.; Feng, G.; Li, J.; Cui, Z. Performance impact analysis of shell and tube PCM heat exchanger based on hemispherical rough elements. J. Build. Eng. 2025, 99, 111521. [Google Scholar] [CrossRef]
- Sajadian, S.; Hosseinzadeh, K.; Akbari, S.; Rahbari, A.; Talebizadehsardari, P.; Keshmiri, A. Discharge optimization in shell-and-tube latent heat storage systems using response surface methodology. Results Eng. 2025, 25, 104157. [Google Scholar] [CrossRef]
- Pignata, A.; Minuto, F.D.; Lanzini, A.; Papurello, D. A feasibility study of a tube bundle exchanger with phase change materials: A case study. J. Build. Eng. 2023, 78, 107622. [Google Scholar] [CrossRef]
- Alqahtani, H.; Selim, M.M. Passive techniques for improvement of freezing within storage system involving nanoparticles. J. Energy Storage 2023, 70, 107870. [Google Scholar] [CrossRef]
- Triscari, G.; Santovito, M.; Bressan, M.; Papurello, D. Experimental and model validation of a phase change material heat exchanger integrated into a real building. Int. J. Energy Res. 2021, 45, 18222–18236. [Google Scholar] [CrossRef]
- Barz, T.; Emhofer, J. Paraffins as phase change material in a compact plate-fin heat exchanger—Part I: Experimental analysis and modeling of complete phase transitions. J. Energy Storage 2021, 33, 102128. [Google Scholar] [CrossRef]
- Nie, C.; Chen, Z.; Li, H.; Liu, X.; Liu, J.; Rao, Z. Petal-shaped fin configurations for enhancing phase change material solidification in a horizontal shell and tube thermal energy storage unit. J. Energy Storage 2025, 113, 115685. [Google Scholar] [CrossRef]
- Zhang, S.; Yan, Y. Evaluation of discharging performance of molten salt/ceramic foam composite phase change material in a shell-and-tube latent heat thermal energy storage unit. Renew. Energy 2022, 198, 1210–1223. [Google Scholar] [CrossRef]
- Wu, X.; Gao, M.; Wang, K.; Wang, Q.; Cheng, C.; Zhu, Y.; Zhang, F.; Zhang, Q. Experimental Study of the Thermal Properties of a Homogeneous Dispersion System of a Paraffin-based Composite Phase Change Materials. J. Energy Storage 2021, 36, 102398. [Google Scholar] [CrossRef]
- Wu, X.-H.; Chen, Y.-N.; Hou, J.-W.; Chang, Z.-J.; Wang, K.; Lv, C.; Liu, H. Performance Characterization of Form-Stable Carbon-based Network Microcapsules for Thermal Energy Storage. Appl. Therm. Eng. 2022, 212, 118632. [Google Scholar] [CrossRef]
- Rahman, I.U.; Mohammed, H.J.; Nardini, S.; Buonomo, B.; Khan, H.; Rehman, S.U.; Manca, O. Graphene-Enhanced Composite Phase Change Materials for Battery Thermal Management. In Recent Progress in Carbon Nanotubes; Rahman, M.M., Chowdhury, M.A., Repon, M.R., Rahman, M.R., Uddin, J., Eds.; IntechOpen: Rijeka, Croatia, 2025. [Google Scholar]
- Başal, B.; Ünal, A. Numerical evaluation of a triple concentric-tube latent heat thermal energy storage. Sol. Energy 2013, 92, 196–205. [Google Scholar] [CrossRef]
- Esapour, M.; Hosseini, M.J.; Ranjbar, A.A.; Pahamli, Y.; Bahrampoury, R. Phase change in multi-tube heat exchangers. Renew. Energy 2016, 85, 1017–1025. [Google Scholar] [CrossRef]
- Huang, X.; Yao, S.; Yang, X.; Zhou, R. Melting performance assessments on a triplex-tube thermal energy storage system: Optimization based on response surface method with natural convection. Renew. Energy 2022, 188, 890–910. [Google Scholar] [CrossRef]
- Liu, X.; Qin, X.; Tian, Y.; Luo, Q.; Yao, H.; Wang, J.; Dang, C.; Xu, Q.; Lv, S.; Xuan, Y. Biomimetic optimized vertically aligned annular fins for fast latent heat thermal energy storage. Appl. Energy 2023, 347, 121435. [Google Scholar] [CrossRef]
- Rubitherm Technologies GmbH. PCM RT-line Versatile Organic PCM for Your Application. Available online: https://www.rubitherm.eu/en/productcategory/organische-pcm-rt (accessed on 27 August 2025).
- Al-Abidi, A.A.; Mat, S.; Sopian, K.; Sulaiman, M.Y.; Mohammad, A.T. Experimental study of PCM melting in triplex tube thermal energy storage for liquid desiccant air conditioning system. Energy Build. 2013, 60, 270–279. [Google Scholar] [CrossRef]
- Wang, W.-W.; Zhang, K.; Wang, L.-B.; He, Y.-L. Numerical study of the heat charging and discharging characteristics of a shell-and-tube phase change heat storage unit. Appl. Therm. Eng. 2013, 58, 542–553. [Google Scholar] [CrossRef]
- Trigui, A.; Abdelmouleh, M. Improving the Heat Transfer of Phase Change Composites for Thermal Energy Storage by Adding Copper: Preparation and Thermal Properties. Sustainability 2023, 15, 1957. [Google Scholar] [CrossRef]
- Shu, G.; Xiao, T.; Guo, J.; Wei, P.; Yang, X.; He, Y.-L. Effect of charging/discharging temperatures upon melting and solidification of PCM-metal foam composite in a heat storage tube. Int. J. Heat Mass Transf. 2023, 201, 123555. [Google Scholar] [CrossRef]


Disclaimer/Publisher’s Note: The statements, opinions and data contained in all publications are solely those of the individual author(s) and contributor(s) and not of MDPI and/or the editor(s). MDPI and/or the editor(s) disclaim responsibility for any injury to people or property resulting from any ideas, methods, instructions or products referred to in the content. |
© 2025 by the authors. Licensee MDPI, Basel, Switzerland. This article is an open access article distributed under the terms and conditions of the Creative Commons Attribution (CC BY) license (https://creativecommons.org/licenses/by/4.0/).