3.1. Experimental Results
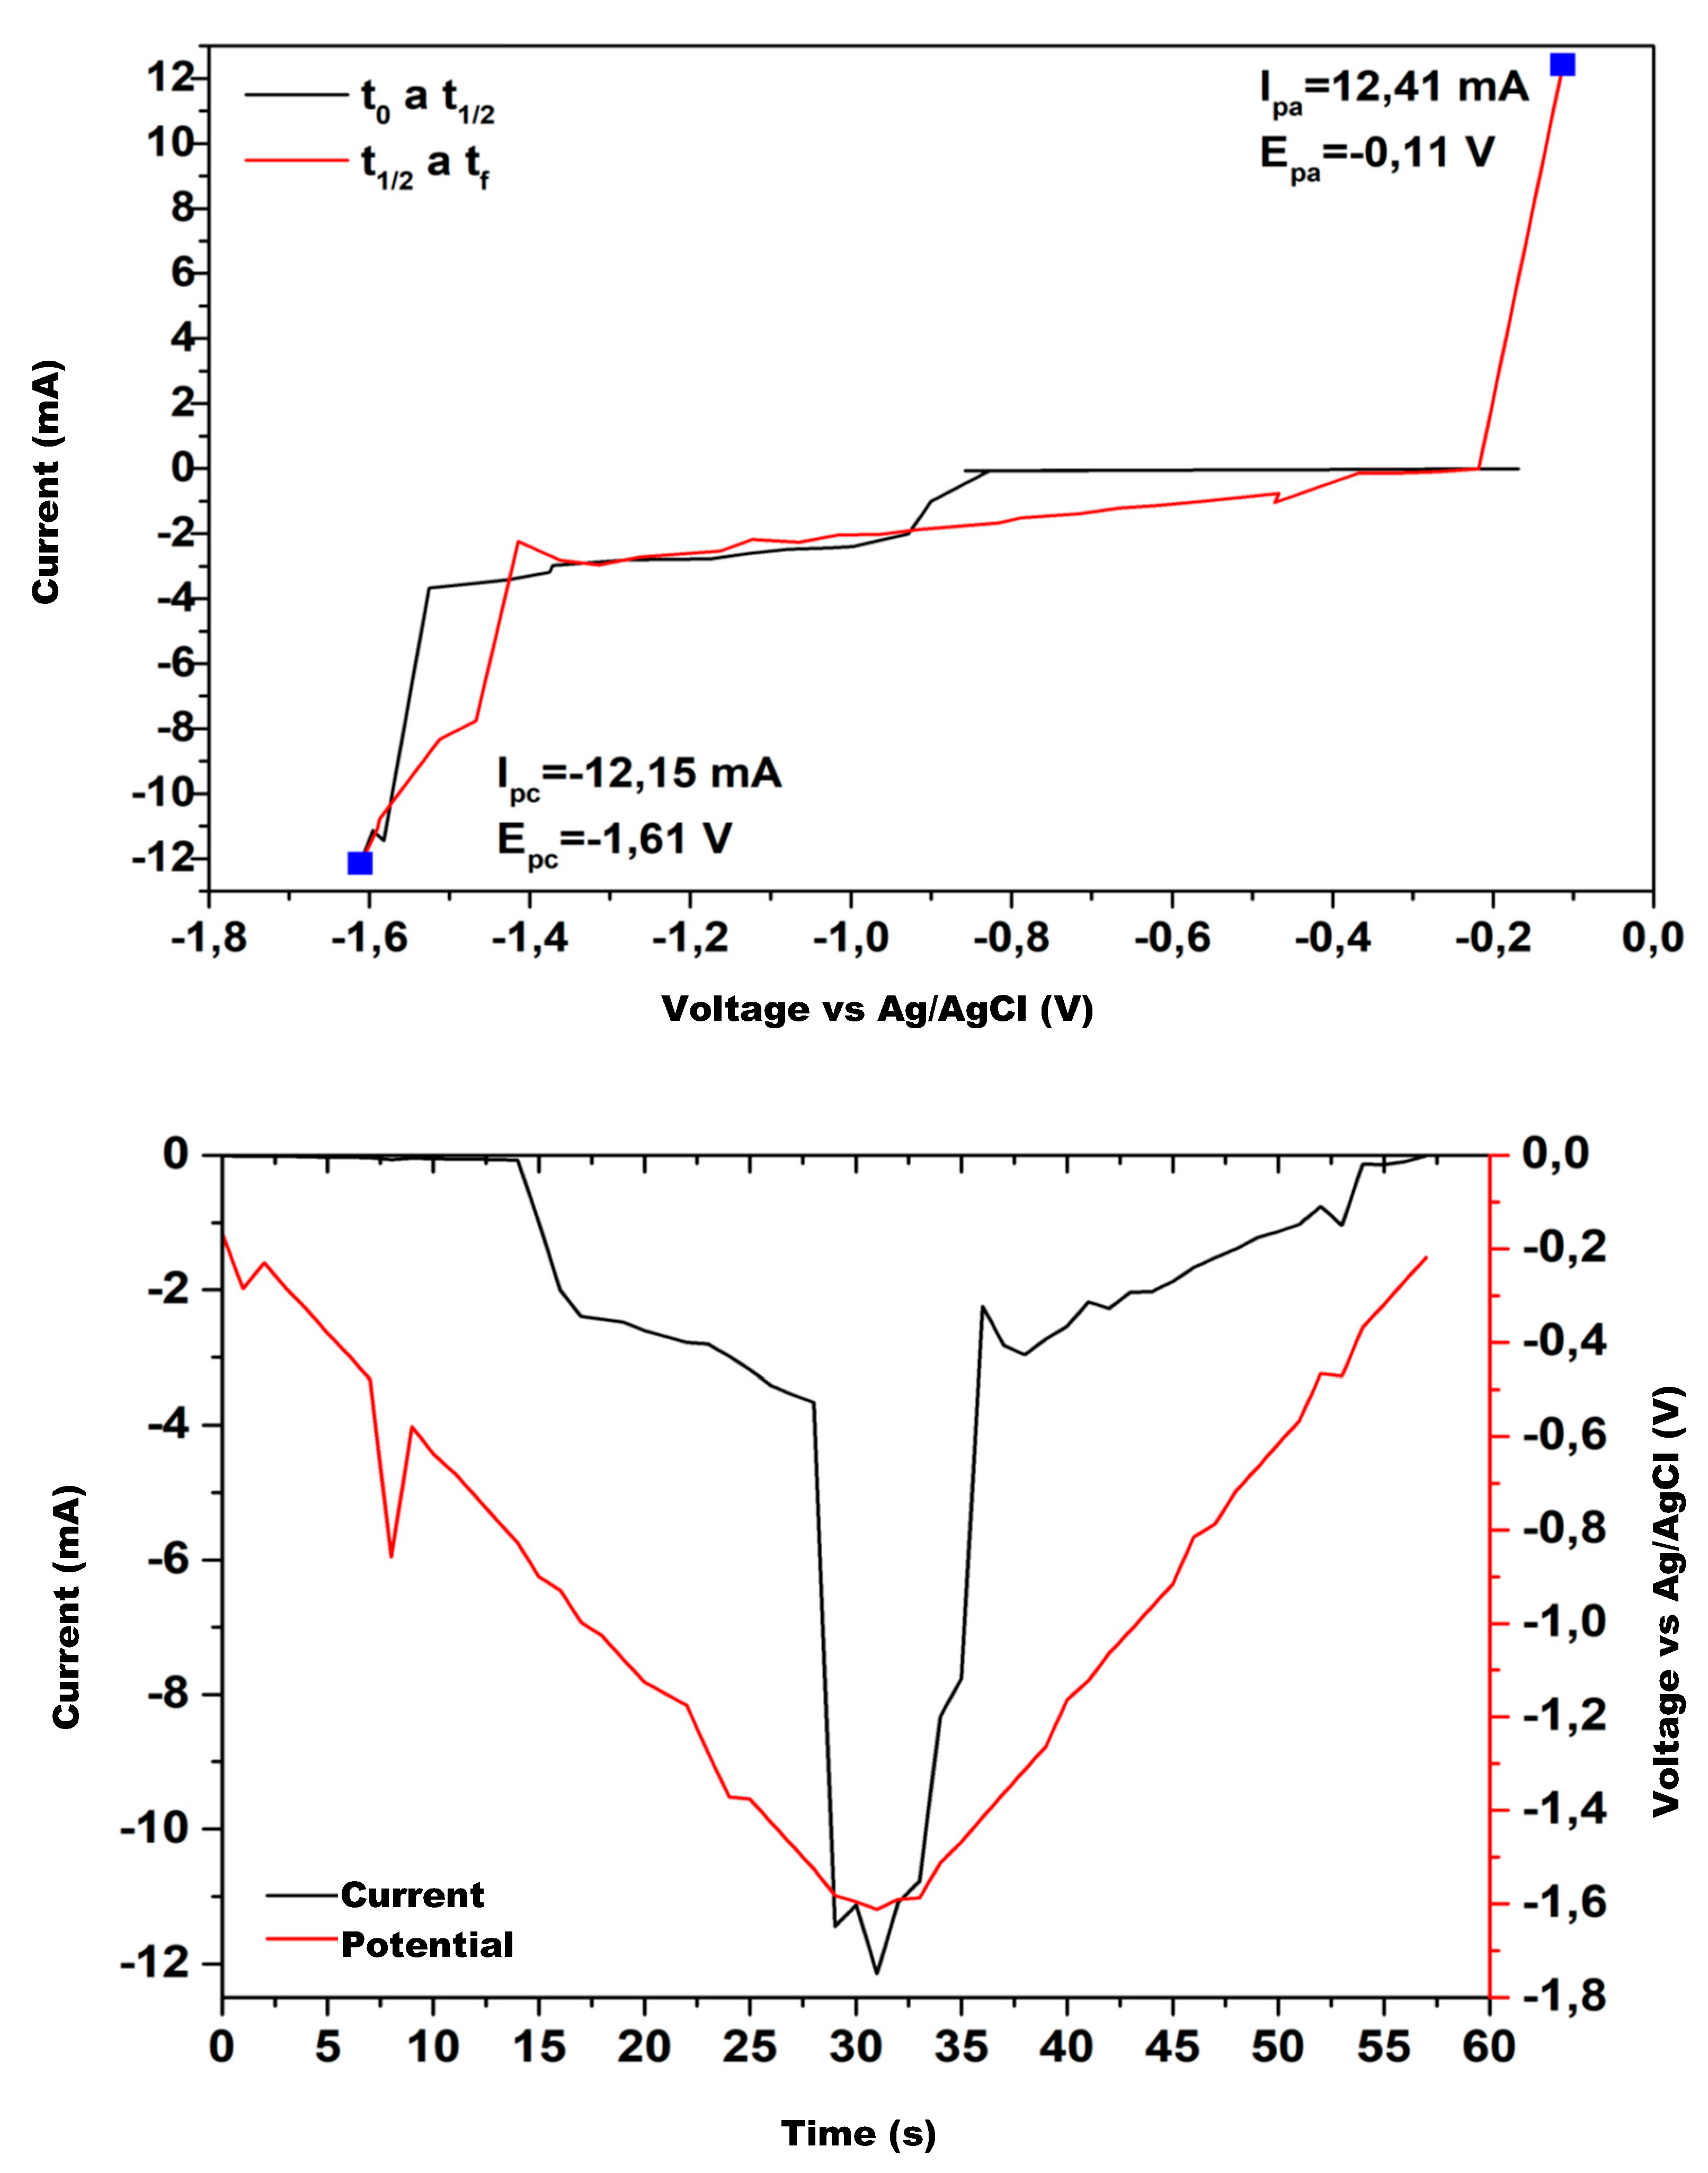
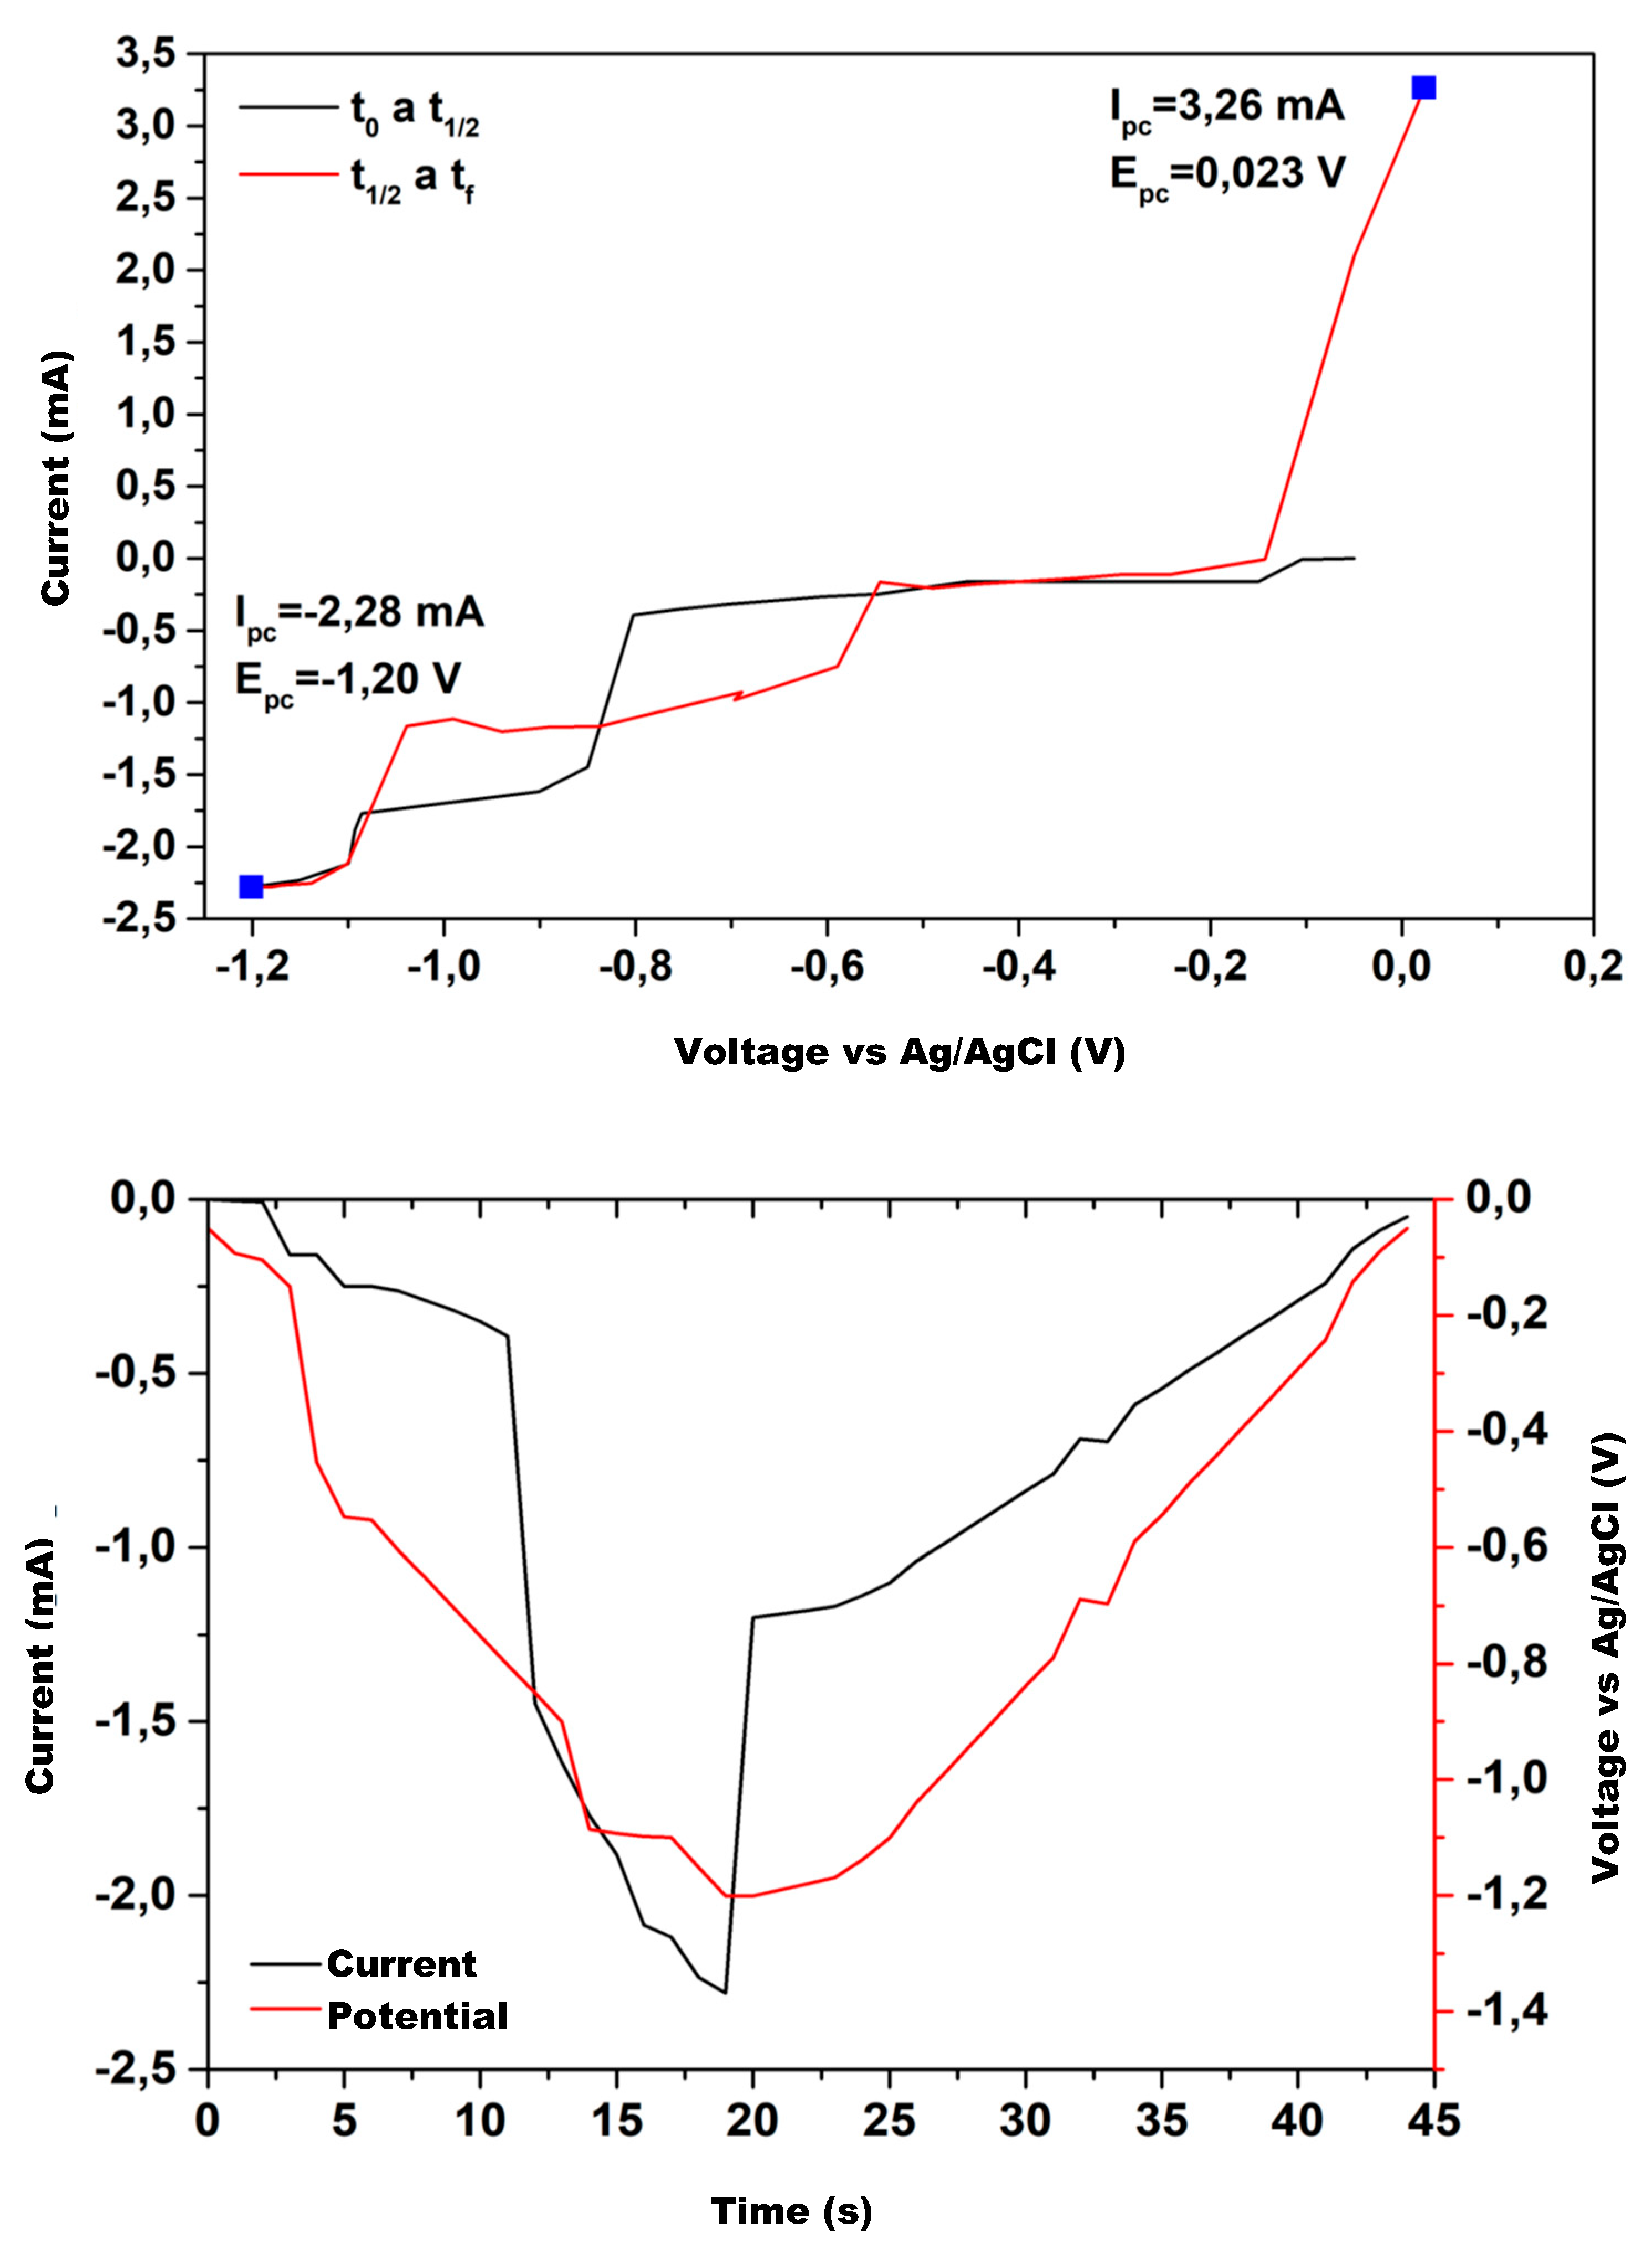
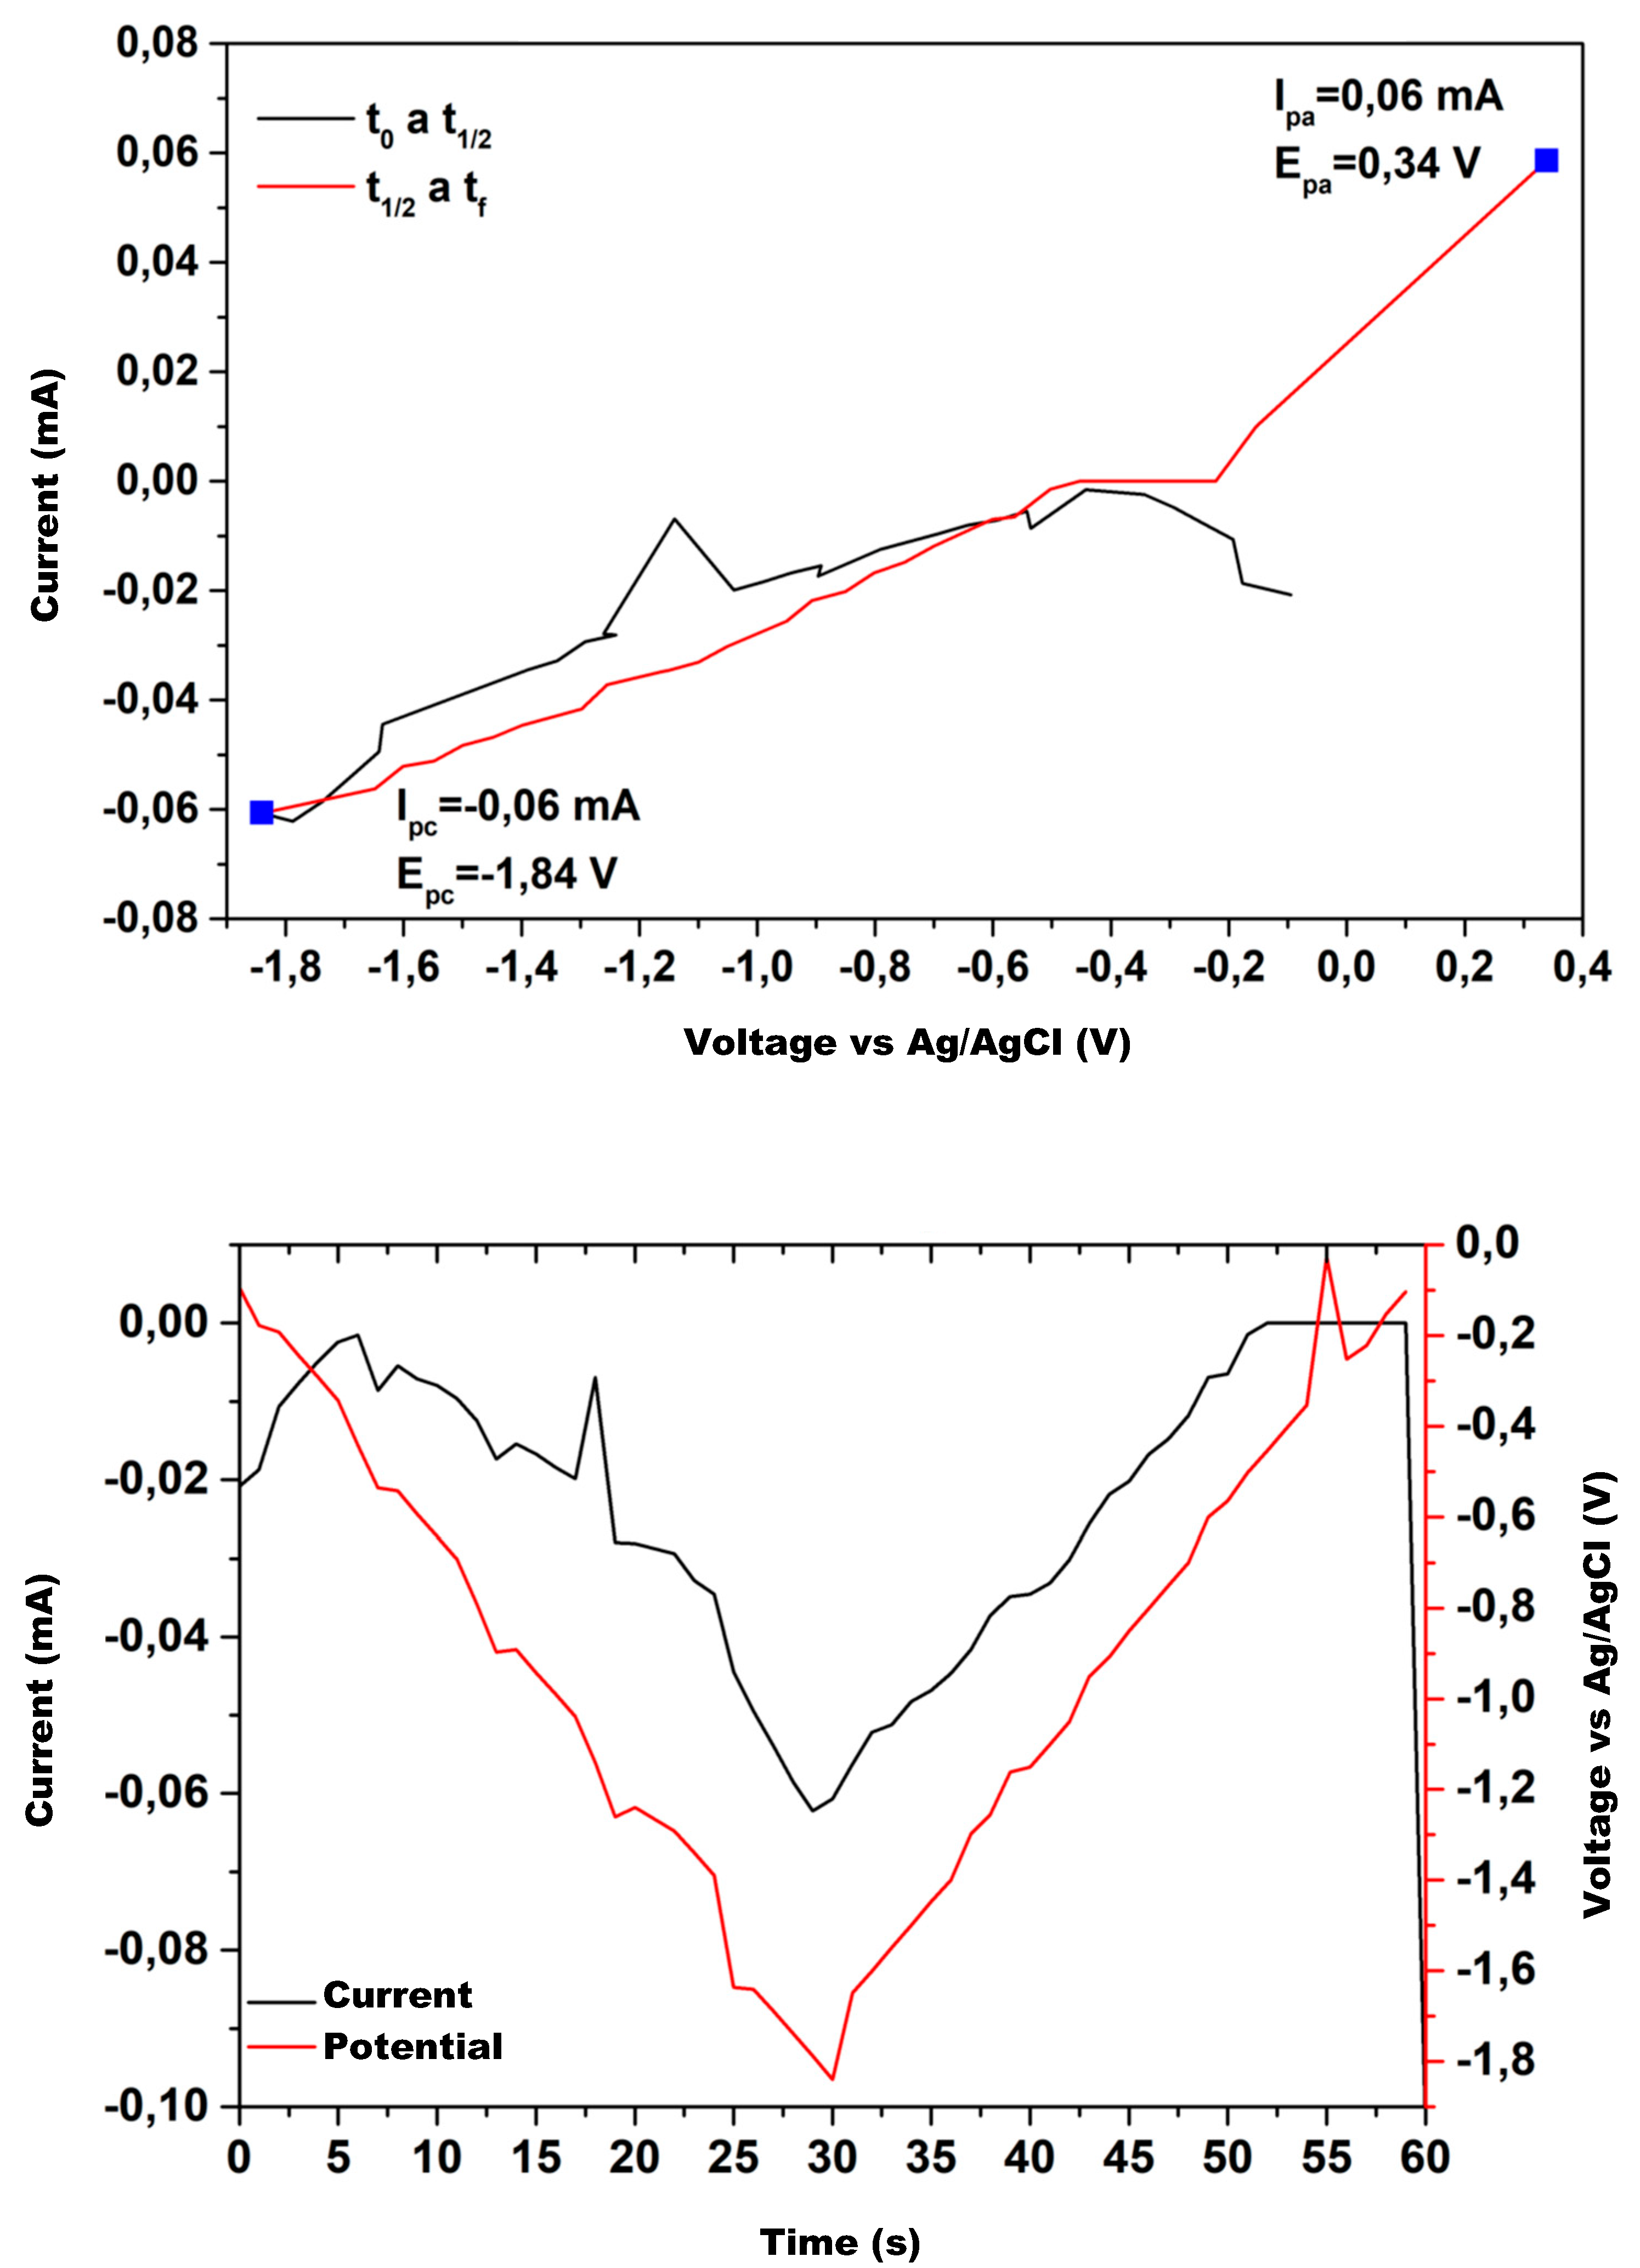
Figure 7,
Figure 8,
Figure 9,
Figure 10,
Figure 11 and
Figure 12 show the cyclic voltammetry for the various catalysts used in the experimental tests. The graph on the upper side corresponds to I–V curve, while the one on the lower shows the current and potential time evolution.
The upper hand side of
Figure 7,
Figure 8,
Figure 9,
Figure 10,
Figure 11 and
Figure 12 shows the electroanalytical response to a programmed voltage evolution regarding the reference electrode (Ag/AgCl). The current evolution is the result of the electrochemical reaction, with a first step representing the concentration gradient effect and a second step where the concentration stabilizes, maintaining a constant density current. If the current continues changing over the entire voltage range, the concentration gradient remains, and the system does not reach a steady state. Low variations in the stabilized current value are acceptable because the system’s redox reactions may provoke slight changes in the concentration at the double layer zone when ions exchange charge with the electrode.
Analyzing
Figure 7,
Figure 8,
Figure 9,
Figure 10,
Figure 11 and
Figure 12, the obtained results show that the current evolution with time is similar for all electrode types when the process starts, with a gray line corresponding to the time interval and slight differences for the Al electrode where the plateau never appears. The plateau means that the current remains constant from a voltage threshold, whose value depends on the electrode type (
Table 5).
Aluminum working electrode does not show a plateau (
Figure 11); therefore, no value is included in
Table 5 for this electrode.
Therefore, we realize that the Cu electrode requires a lower voltage to reach the plateau, while the Zn and Cu2O electrodes require nearly double the voltage. CuS and CuO electrodes require an intermediate voltage threshold for the onset value.
According to the voltage threshold data in
Table 3, when starting the process, the Cu electrode is the most suitable because it requires a lower voltage to reach the zero current value; however, Zn and Cu
2O are not recommended.
As the process evolves, as shown by the red line, the obtained results show that the copper mixture electrodes, CuS, Cu2O, and CuO, maintain the current values for the same voltage range. The pure copper electrodes tend to reproduce the current evolution but show noticeable differences in the first half of the voltage range. The Zn electrode exhibits a significant difference, and Al does not maintain a constant current at any voltage value.
The current evolution over the entire time-lapse shows that electrodes with a copper mixture have a higher performance; therefore, they are more suitable for methanol production.
On the other hand, the right side of
Figure 7,
Figure 8,
Figure 9,
Figure 10,
Figure 11 and
Figure 12 shows the electric potential well due to the potential barrier in the double layer, generated by the concentration gradient in that area. The potential well peak occurs at a similar time for each electrode, with a slight difference between them. The current time evolution shows a similar behavior because of the electrical relations between current and voltage.
Comparing the performance of the electrodes used, we find that for plain copper or a copper–copper mixture, the current behaves close to the potential, with the peak value close to the one for the potential, indicating that these electrodes are suitable for methanol production; however, for Al and Zn electrodes, the current does not reach the peak of the well, reinforcing the assertion that these electrodes are not suitable for methanol production under current operating conditions.
Table 6 shows the relevant parameter values for the experimental tests.
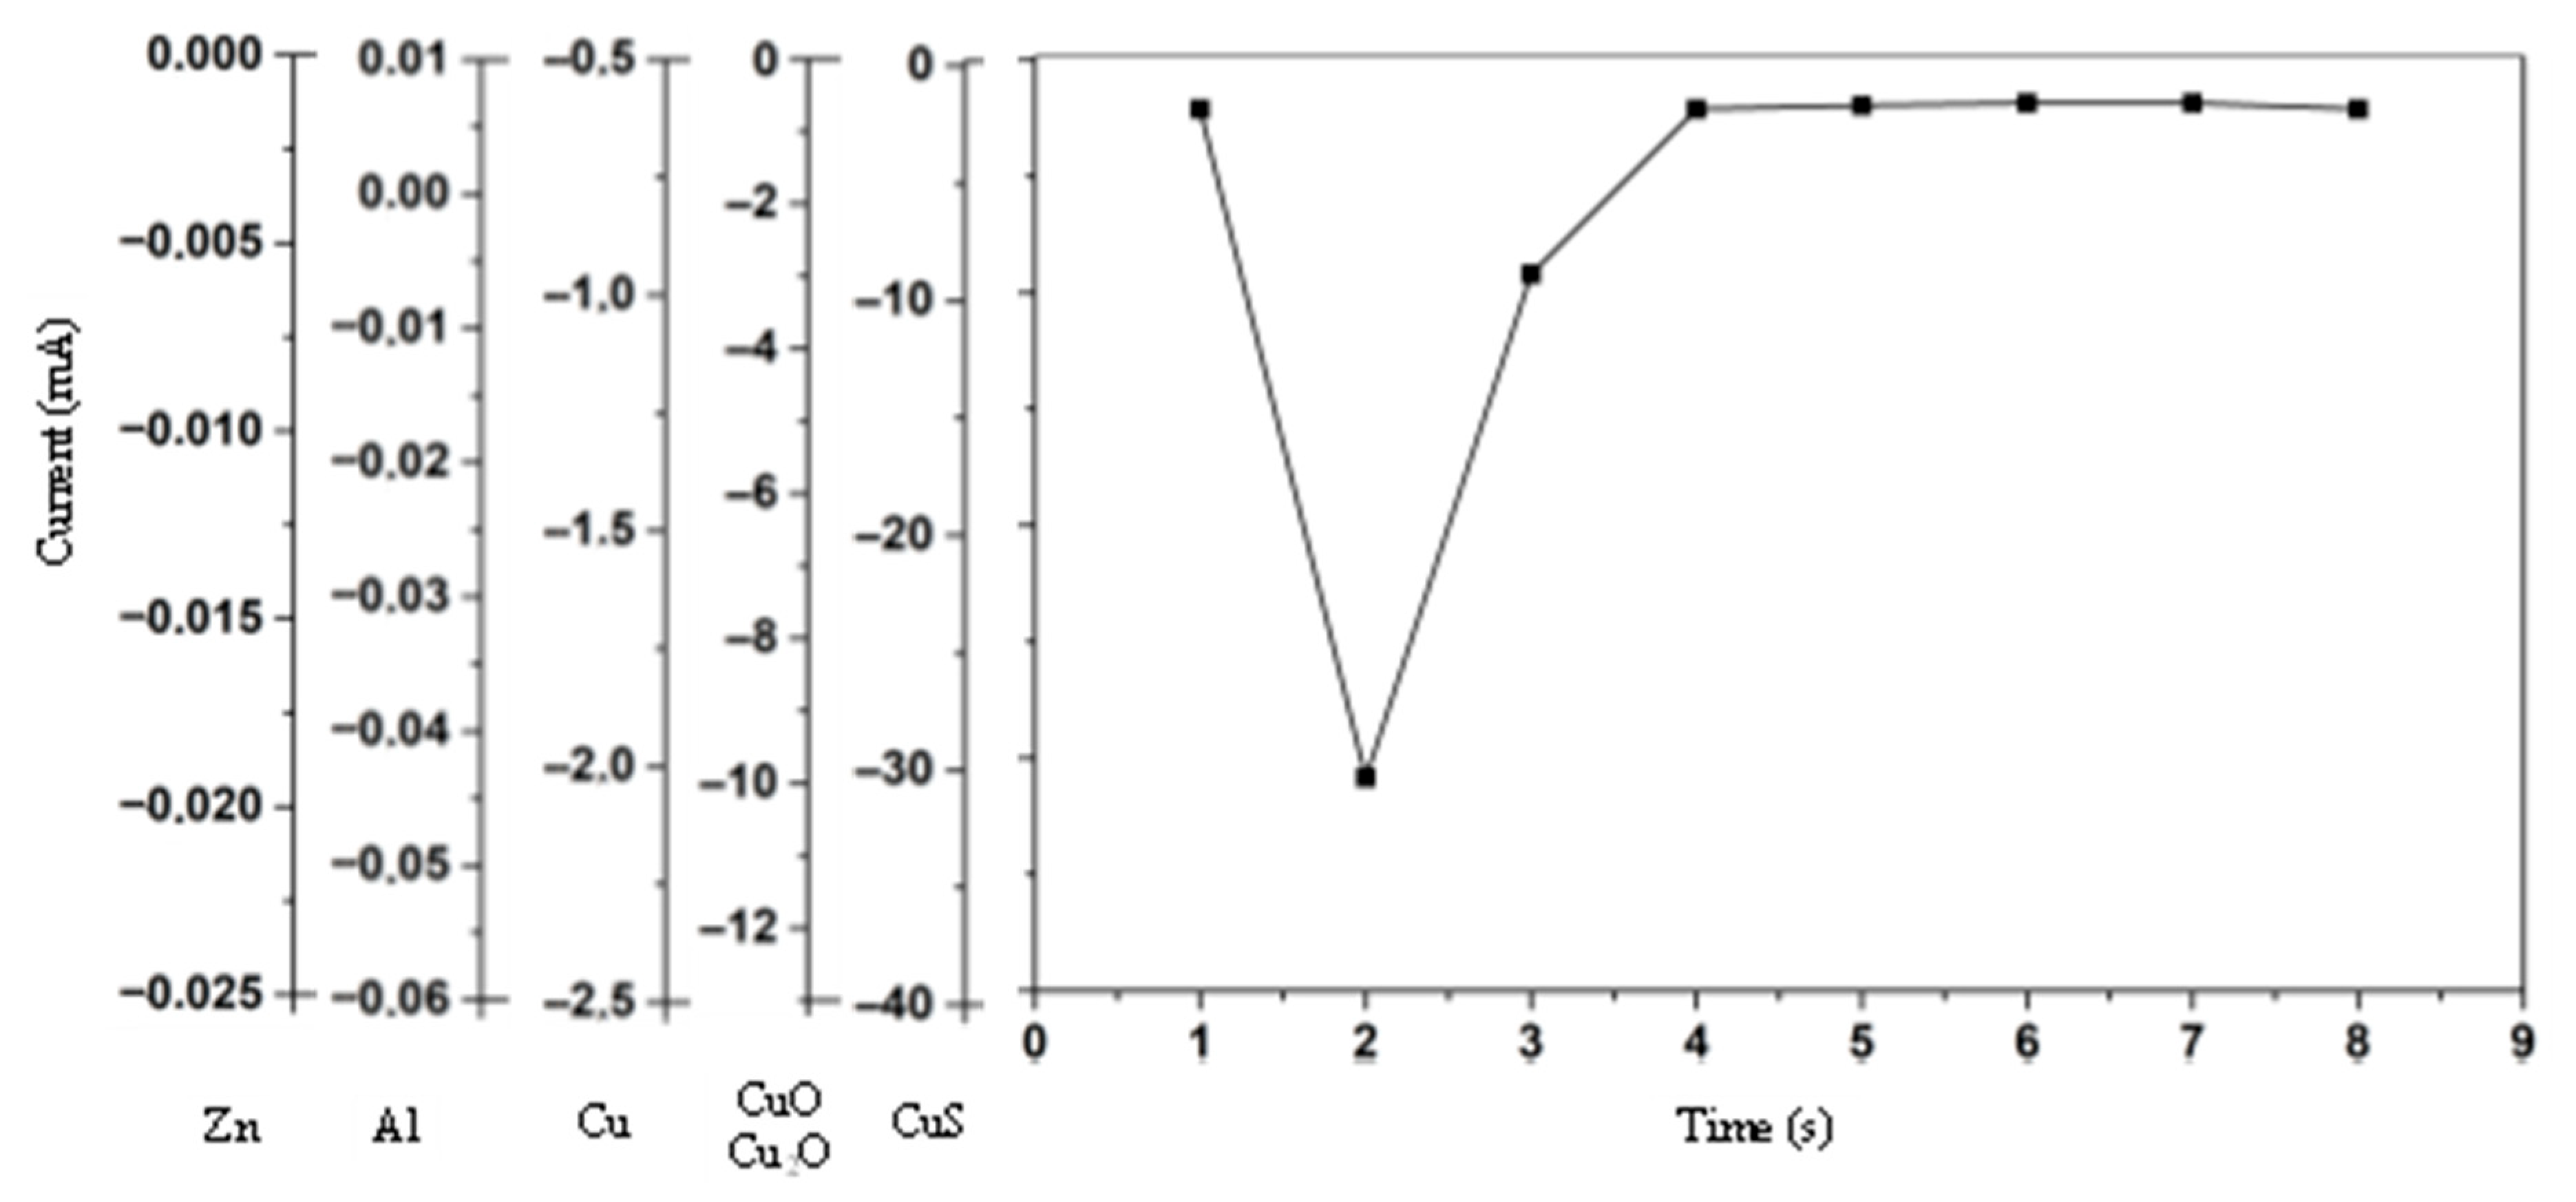
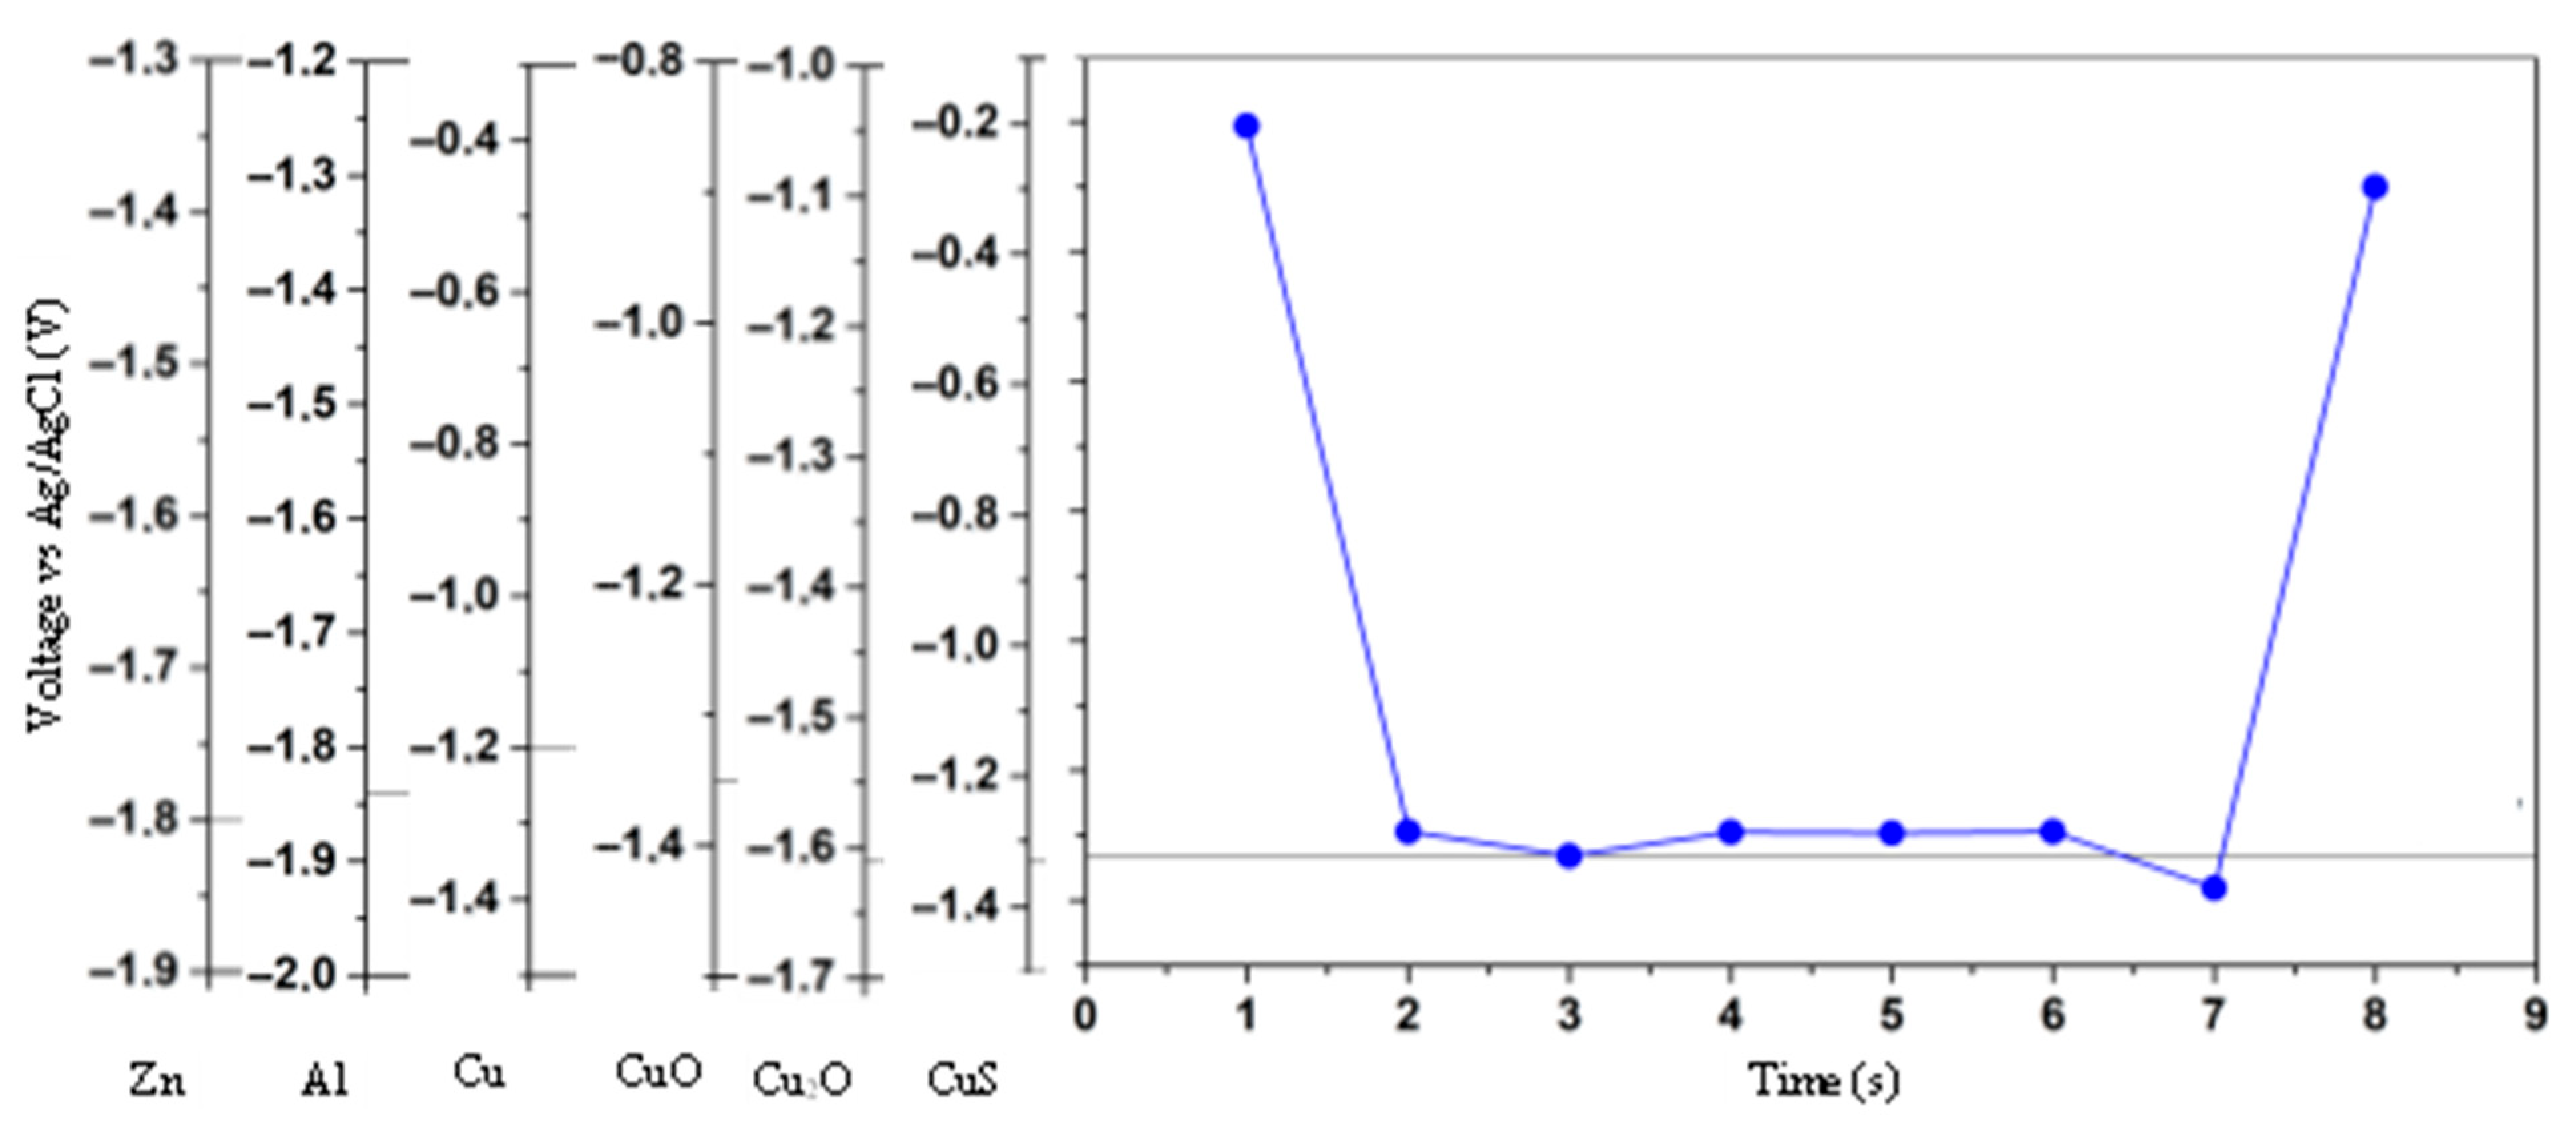
Now, representing the chrono-amperometry for the different working electrodes, we have (
Figure 13 and
Figure 14):
Y-axis scale in
Figure 13 and
Figure 14 corresponds to the working electrode shown at the bottom.
The obtained results show that in the experimental tests, the current shows a common trend, with a lowering peak at 2 s, then recovering to the previous value at 4 s, and maintaining this value for the rest of the test. Concerning the related applied voltage jump, the trend is also common, lowering from the initial value to the minimum at t = 2 s, maintaining this minimum value for 5 s, and recovering back to the initial value at the time equal to 8 s.
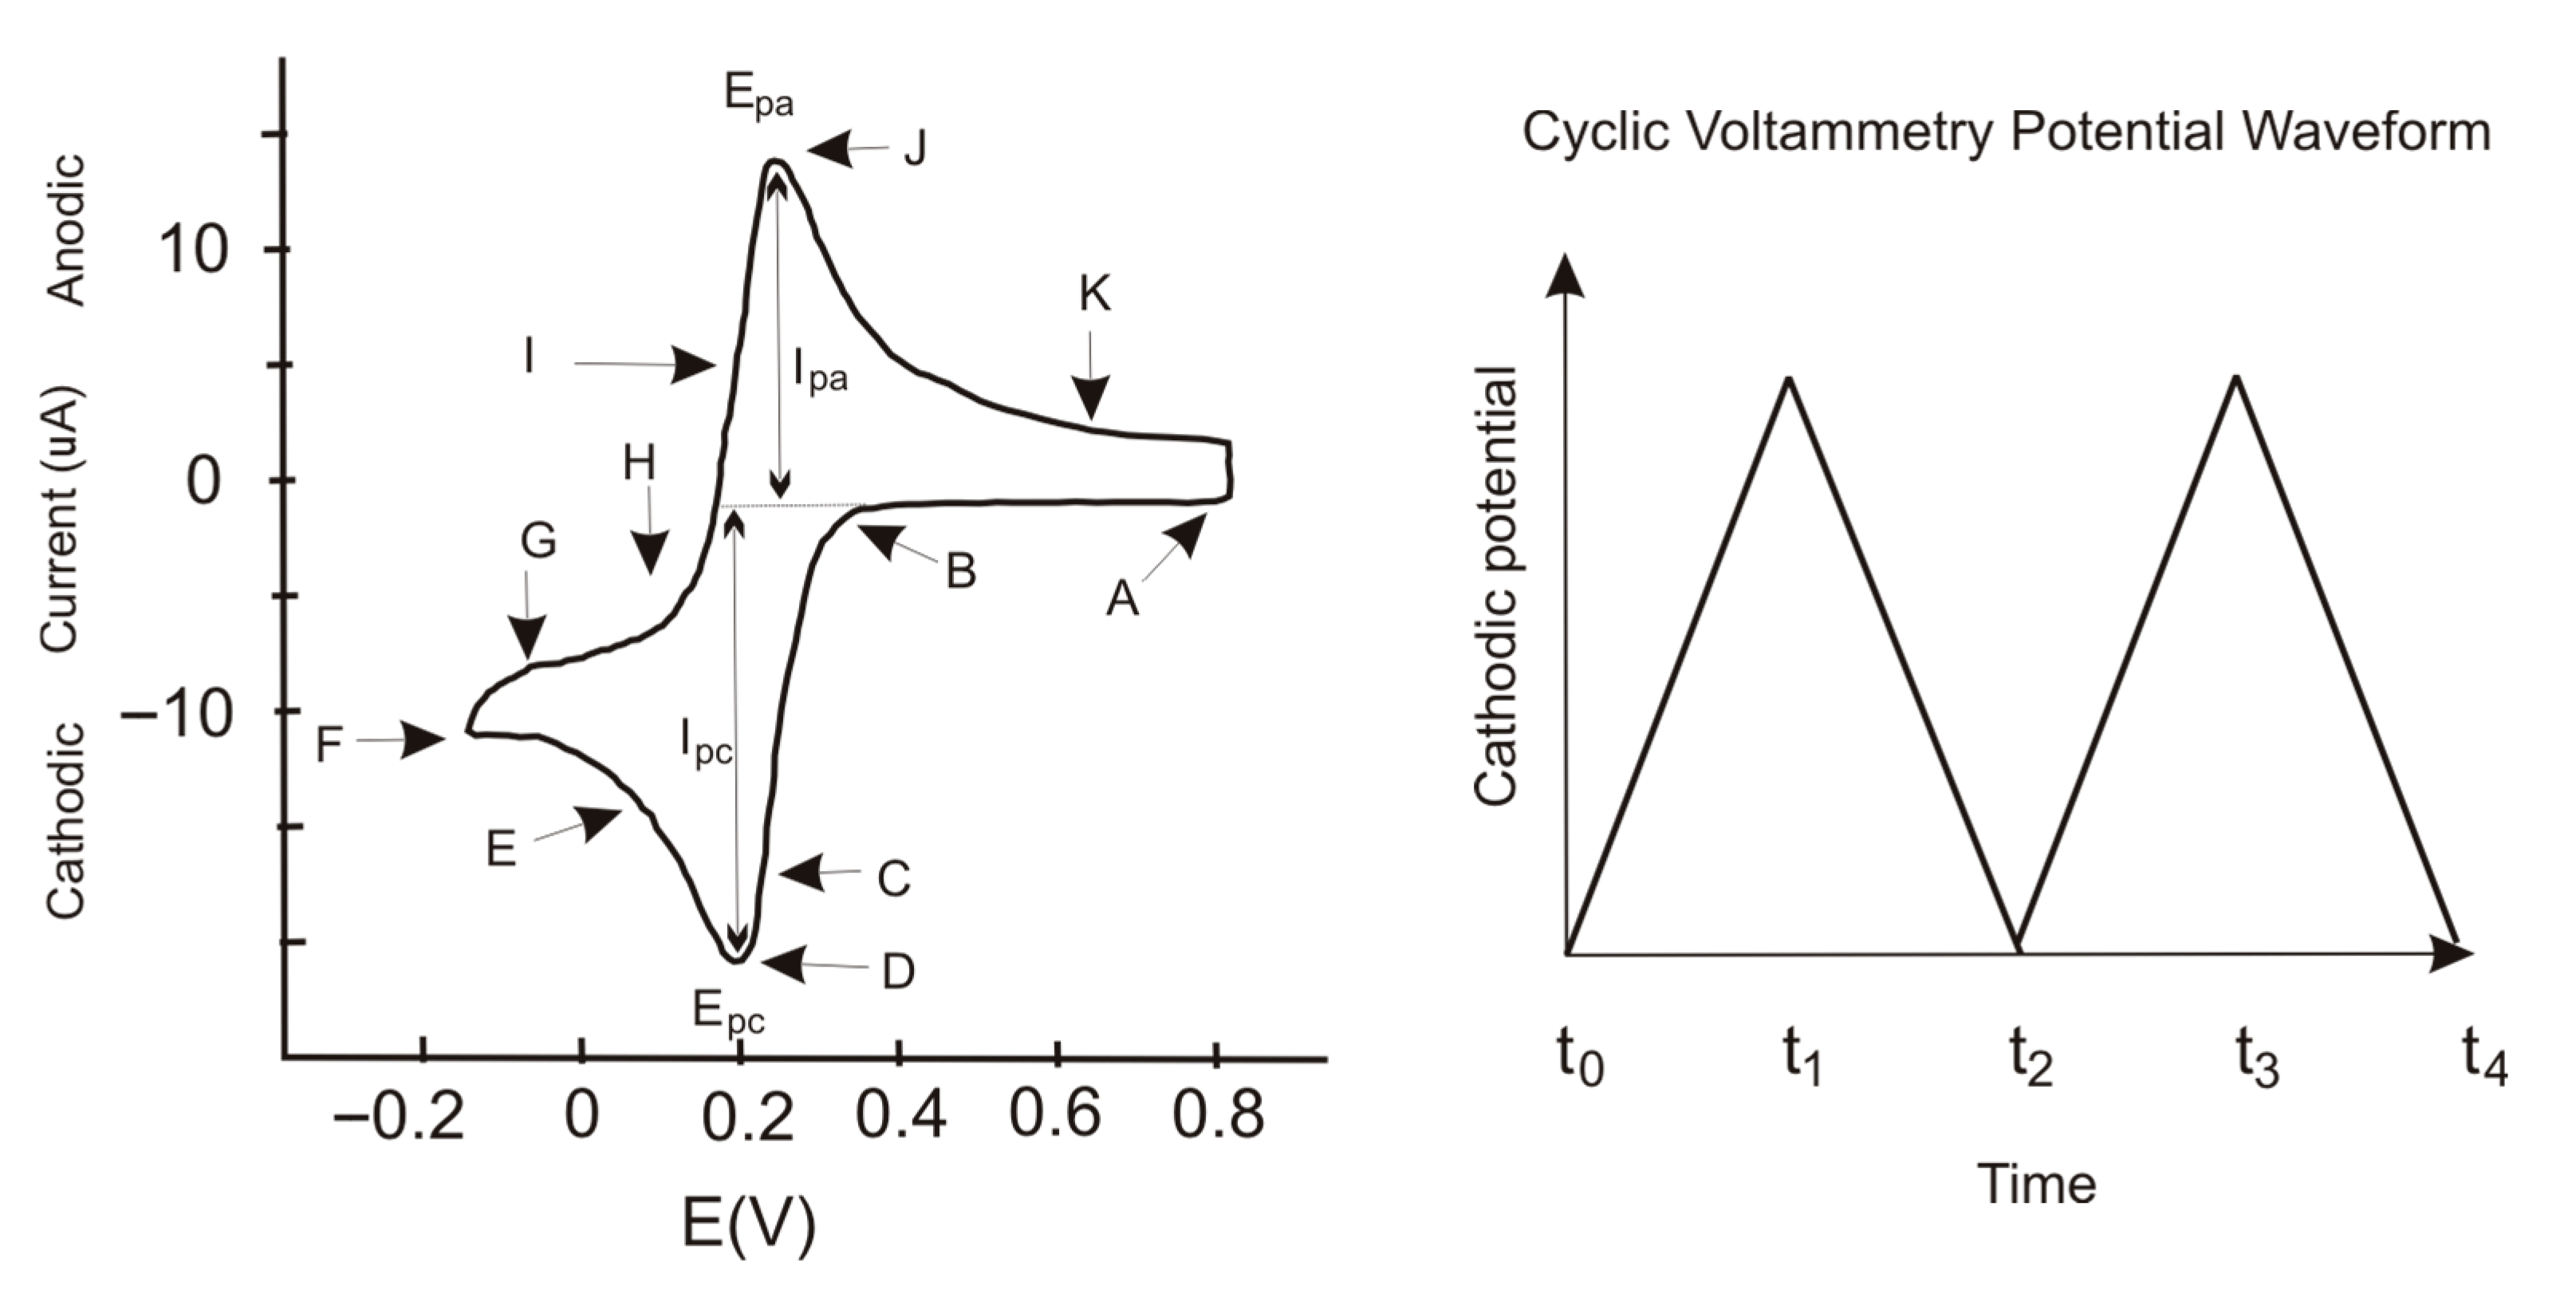
The carbon dioxide in the bulk solution arrives at the electrode surface by natural diffusion at a potential value of Epc. The kinetics of the reduction reaction exceed the mass contribution by diffusion, causing a decrease in the CO2 concentration at the catalytic surface and, therefore, a decrease in the current passing through the working electrode. However, the decrease is not immediate but progressive. The diffusion-limited regions, where the diffusion rate is still higher than the kinetics of the reduction reaction, are located from the maximum cathodic current until the current reaches a lower and stable value.
At t = 2 s, the carbon dioxide concentration becomes null, represented by the current drop in
Figure 13. This phenomenon is in close agreement with the applied potential jump drop shown in
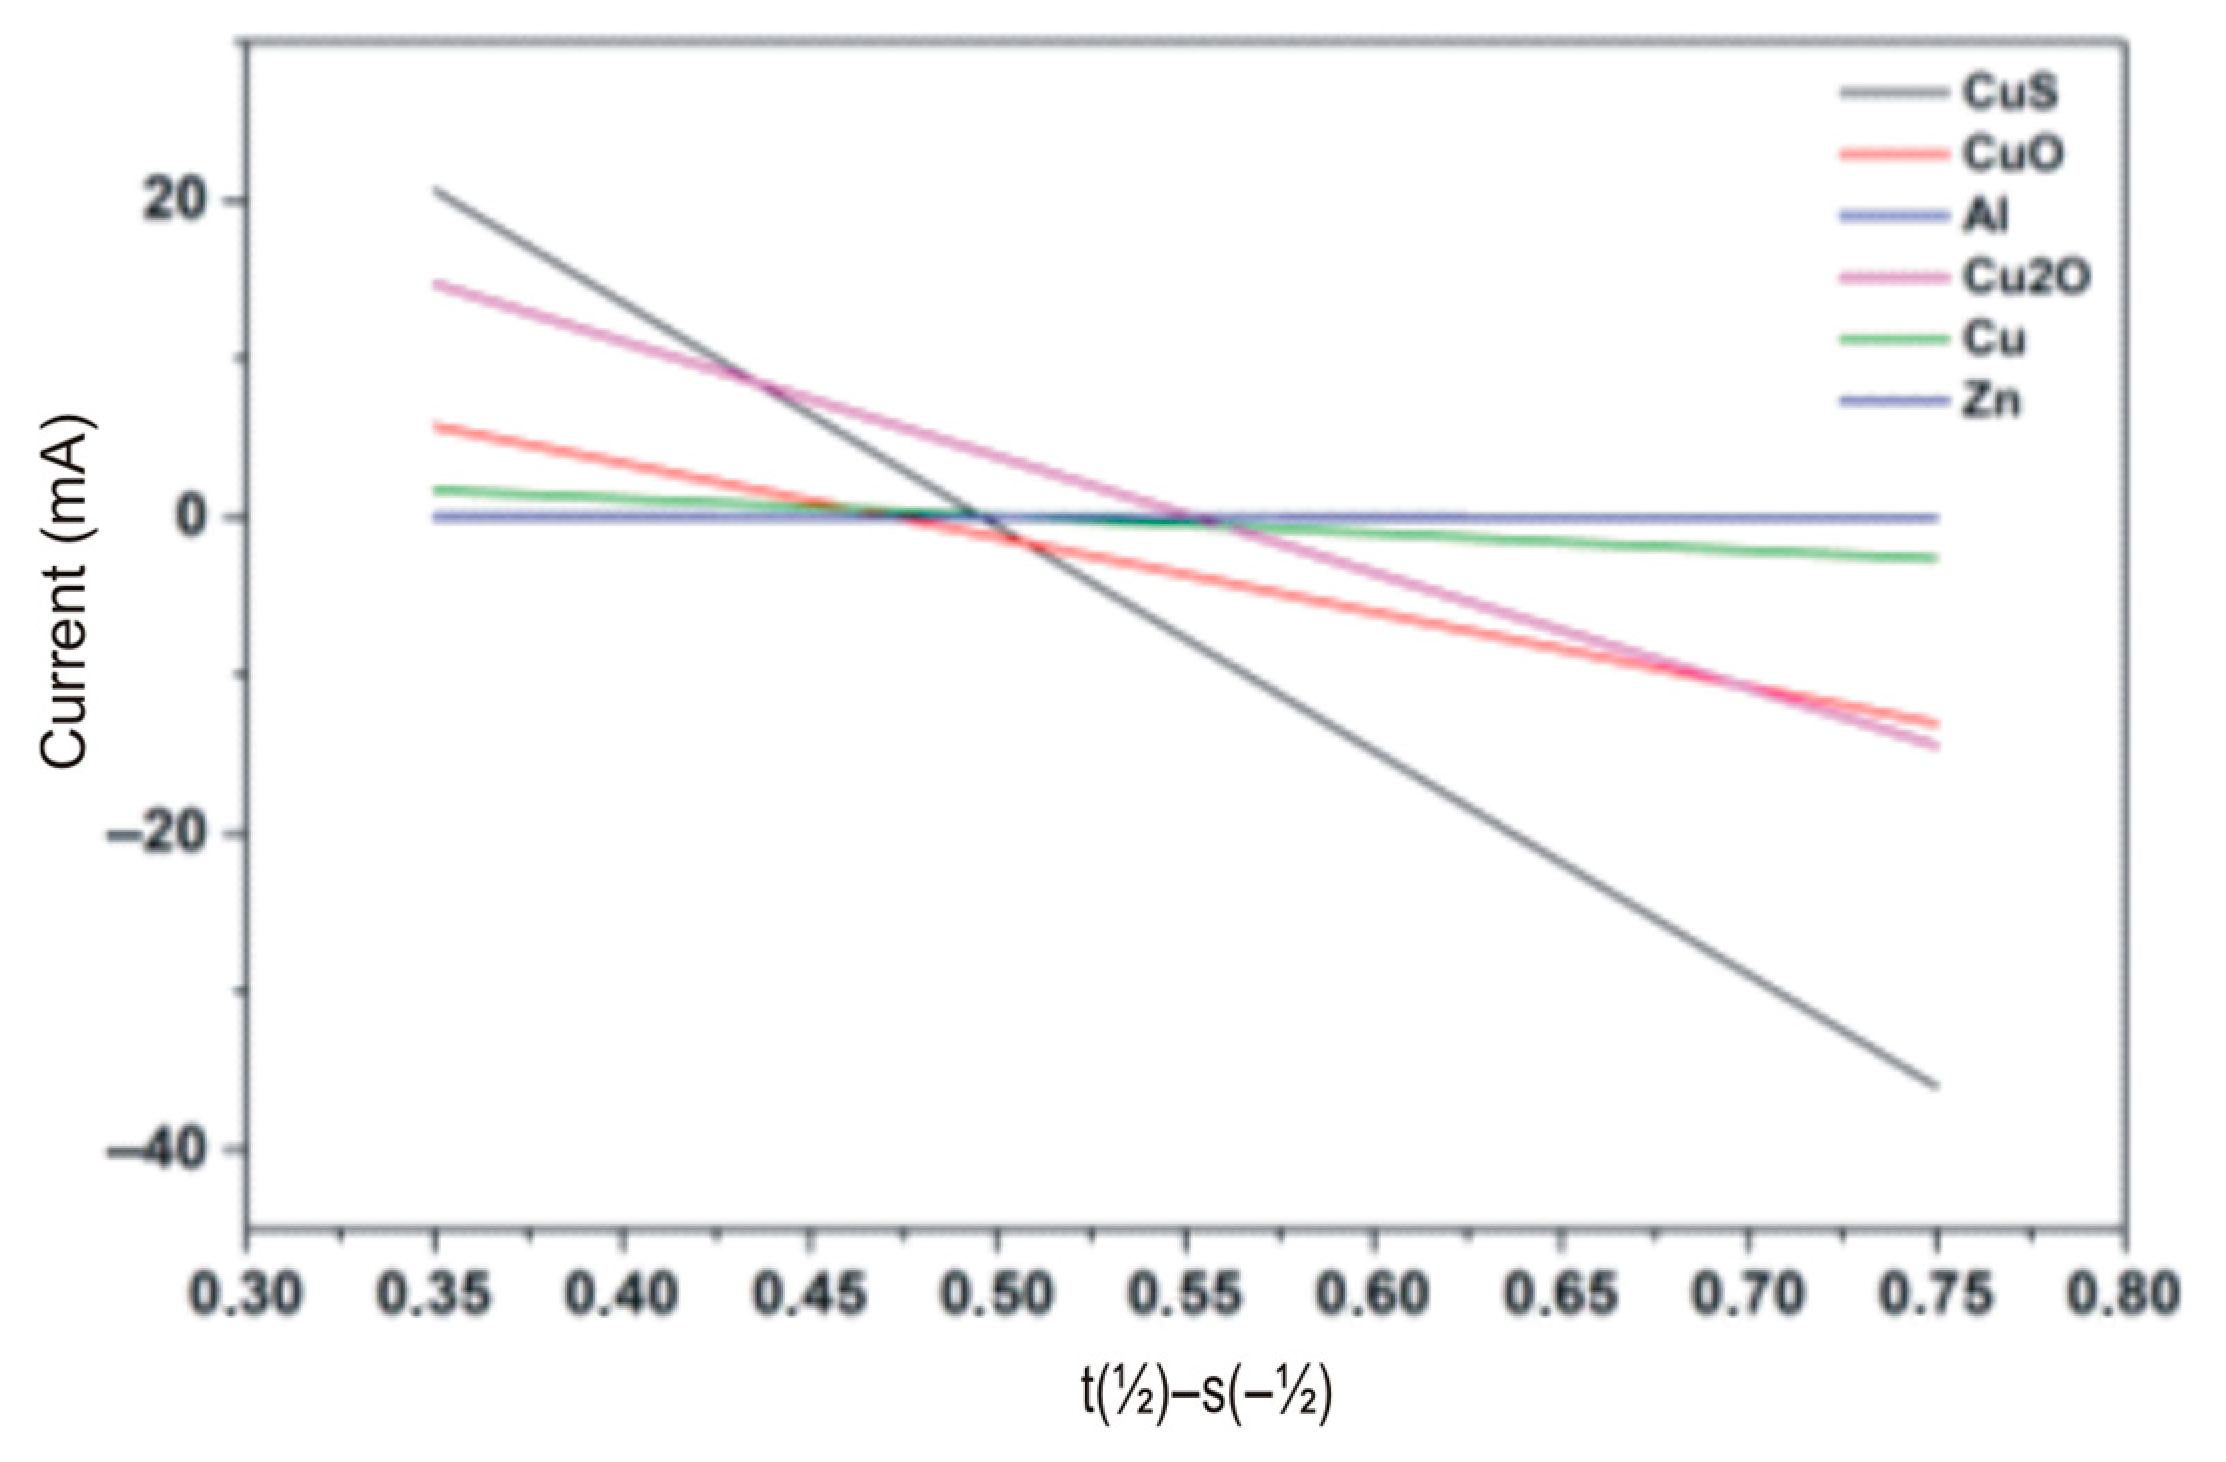
Figure 14. We can model the diffusion current using the Cotrell equation; therefore, representing the recorded current as a function of time, we have the linear correlation (
Figure 15).
The slope of the curve corresponds to the
K-coefficient in Equation (5).
Table 8 shows the
K-values for the different working electrodes.
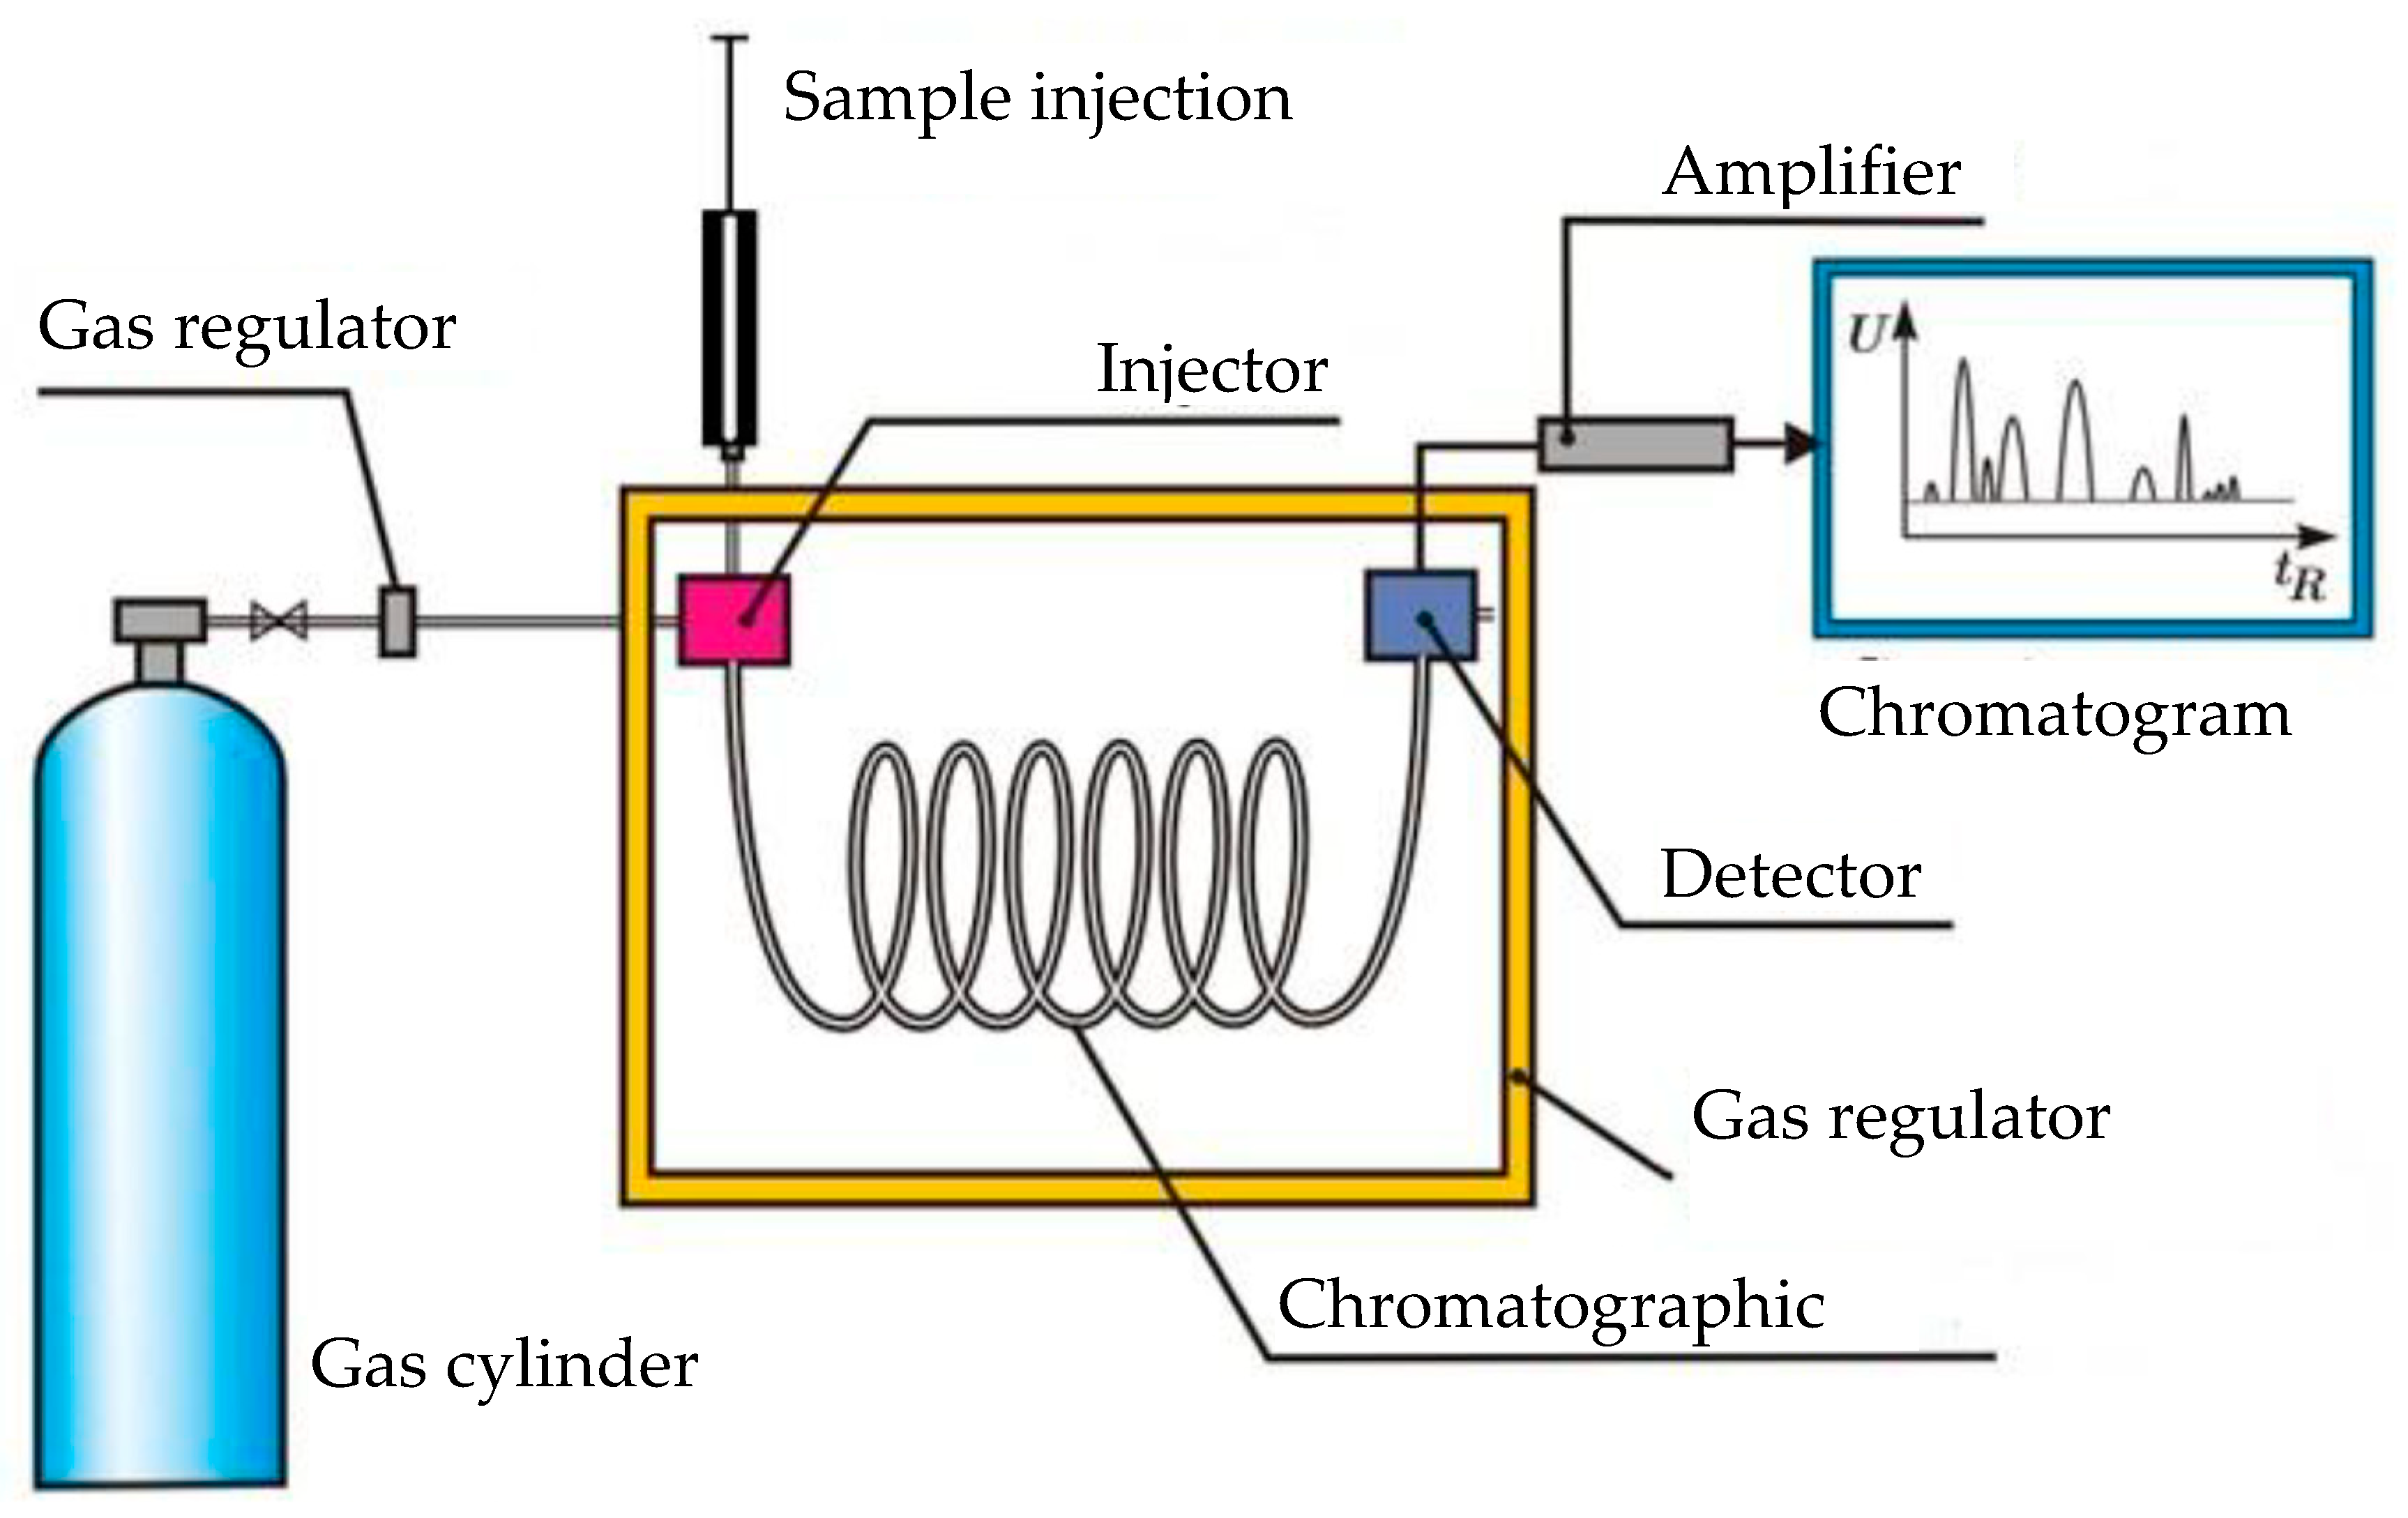
Because the electrolytic cell sample contains methanol and water, following the chronoamperometry tests, we submitted the sample to a 35 min distillation process to obtain water and methanol separately due to their different vapor pressure and evaporation temperatures.
Table 9 shows the water and methanol percentages after distillation for the various working electrodes.
We notice that the distilled methanol percentage is low, below 6% in all cases, indicating that the carbon dioxide conversion into methanol is not highly efficient.
Repeating the distillation process at the same time as for the electrolytic cell sample for a pure water and methanol solution, in separated processes, at a temperature equal to the methanol evaporation temperature at ambient pressure, corresponding to the electrolytic cell sample distillation, we obtained the following (
Table 10):
The water percentage obtained from the distillation process in the electrolytic cell sample differs from the values in the pure water distillation at equivalent pressure and temperature conditions, showing that the chemical reaction for carbon dioxide conversion into methanol develops at partial electron transfer, resulting in a lower efficiency with a reduced methanol production level.
Table 11 shows the efficiency ratio in methanol production, using the distilled water as a reference parameter.
The lower distilled water percentage obtained in the electrolytic cell sample distillation indicates that the carbon dioxide conversion produces hydrocarbons other than the type CxHz−2nO2x−n, corresponding to methanol with x = 1, z = 6, and n = 1, with subscript z accounting for the maximum electron transfer number.
Indeed, if the chemical reaction for carbon dioxide conversion into methanol develops at incomplete electron transfer, the resulting product is not methanol but an alternative hydrocarbon; therefore, the methanol percentage obtained in the process is lower than the maximum expected value.
Regarding the Randles–Sevcik and Cotrell equations:
Equation (7) provides a method to determine the adequate number of electrons transferred during carbon dioxide conversion. On the other hand, by using Equation (5) and clearing the electron transfer number,
n, we obtain the electron transfer number’s theoretical value:
Applying data from our experimental tests, we have (
Table 12):
We should note the close agreement between theoretical and experimental values, proving the validity of the developed method for calculating the electron transfer number.
Table 11 shows the deficit in the electron transfer number regarding the optimum,
z = 6, proving that the carbon dioxide conversion into methanol develops at incomplete chemical redox reaction, generating a deficit in the methanol production, as shown by the low efficiency values.
Since the process efficiency in converting carbon dioxide into methanol is closely related to the electron transfer number, we calculate the ratio between these two parameters, obtaining the following results (
Table 13):
Theoretical predictions and experimental values indicate that the expected methanol production increases if the redox reaction develops at optimum conditions, with the electron transfer number matching the maximum (z = 6). Applying these conditions, we hope to reach a 100% methanol percentage production if operating at optimum conditions (complete redox reaction).
3.3. Chemical Reaction Balance
Data from
Table 9 show that we operate far from the ideal conditions, with an incomplete redox reaction meaning a lower than ideal methanol formation. Indeed, the methanol formation reaction from carbon dioxide develops in both senses due to the intermediate formation of a weak acid, the formic acid, as shown in Equation (9) [
48].
Because formic is a weak acid, it decomposes in carbon dioxide and water quickly, reverting the equation toward the left, limiting the progress of the global reaction. In such a situation, the overall reaction balance is the result of methanol formation (→) and decomposition (←). If the carbon dioxide molecular concentration is higher than that of methanol, which is the current situation at the methanol formation process, the global reaction progresses to the right but at a limited speed, resulting in an incomplete redox reaction, producing an electron change number lower than the optimum.
We can improve the methanol formation by reducing the methanol concentration, generating a disequilibrium in the global reaction, and accelerating methanol formation, thus increasing the reaction progress and the electron change number. To do so, we can drain the methanol/water solution in the electrolytic cell, carrying it to a distiller where we separate methanol and water through a distillation process.
On the other hand, if we raise the carbon dioxide concentration by increasing the CO2 pressure, the global reaction tends to displace to the right, accelerating methanol formation and improving the efficiency of the process.
3.4. Simulation
We run a simulation to evaluate the system capacity of achieving the optimum conditions; i.e., an electron change number equal to ideal value (
z = 6). To this goal, we apply the correspondence between energy and electron change ratio, using data from
Table 12 and
Table 13, and repeating the calculation for a complete redox reaction, thus obtaining the following (
Table 15):
As in the former case, the energy balance is negative, meaning we cannot recover all the energy invested in the formation process, no matter which catalyzer we use. The negative energy balance, however, is low, showing a developed process close to the optimum performance.
We determine the energy balance considering half of the error band, adding the value to the formation energy, and subtracting it from the combustion power. Since the calculation corresponds to ideal conditions, the energy balance should be null because the cyclic transformation matches a thermodynamic cycle where enthalpy variation is null. The deviation from the null value, shown in
Table 15, corresponds to irreversibilities in the process. Considering the energy balance to combustion power ratio as the irreversibility index, we obtain an average value of 1.2%, which is acceptable for a quasi-reversible process. The low deviation shown in the reversibility index value proves the proposed methodology feasibility.
The proven method feasibility encourages the development of a protocol in which we drain the methanol/water solution generated at the chemical reactor as soon as it is produced, with water obtained after the distillation process re-injected into the chemical reactor to compensate for water loss during the chemical reaction.
Figure 16 shows the schematic view of the process.
Table 15 data from the simulation corresponds to an ideal process where the redox reaction completely displaces to the right with no reverse methanol decomposition. This situation never happens since we cannot achieve an infinite carbon dioxide or null methanol concentration. In the current procedure, we reduce the methanol concentration by draining the methanol/water solution from the reactor.
Provided we operate at constant pressure, the concentration equilibrium constant depends on the elements intervening in the chemical reaction, as in the following [
49,
50]:
Considering the carbon dioxide concentration to be constant, since the CO
2 flow to the reactor remains unchanged, and the water concentration is constant too, as the reaction progresses, the methanol concentration increases, generating a disequilibrium in the response and increasing
Kc. Therefore, because the chemical reaction tends to the equilibrium, it reacts by decomposing methanol in water and carbon dioxide, lowering the
Kc until it is back to the equilibrium value,
Kco. This situation generates an effective reduction in the electron change number [
51].
Considering the equilibrium and disequilibrium concentration constants as
Kco and
Kc, we have the following:
The x-parameter represents the incremental fraction of methanol concentration, which is directly related to the degree of chemical reaction progress.
Operating in Equation (11), for the [CO
2] and [H
2O] constants, we have the following:
According to the setup chemical reaction for methanol production, the pressure equilibrium constant,
Kp, is expressed in terms of the concentration equilibrium constant,
Kc, and the variation of the mole number, Δ
n (Equation (13)) [
52].
We can express the variation in the mole number as follows:
Combining Equations (12)–(14):
If the methanol concentration increases due to the redox reaction while the carbon dioxide supply stays constant, provided the water content in the electrolytic solution, the initial concentration, and the working pressure remain unchanged, all factors on the right side of Equation (15) will be constant except for the incremental fraction of methanol concentration, x, producing a decrease in the methanol number of moles, and creating a reverse flow as per Equation (9). Consequently, this decrease reduces the net electron transfer number and leads to an incomplete redox reaction if we do not drain the produced methanol.
On the other hand, if we control the methanol concentration in the electrolytic solution, the methanol mole number on the left side of Equation (15) increases, and the redox reaction moves toward a complete chemical reaction, approaching the electron change number to the ideal value z = 6.
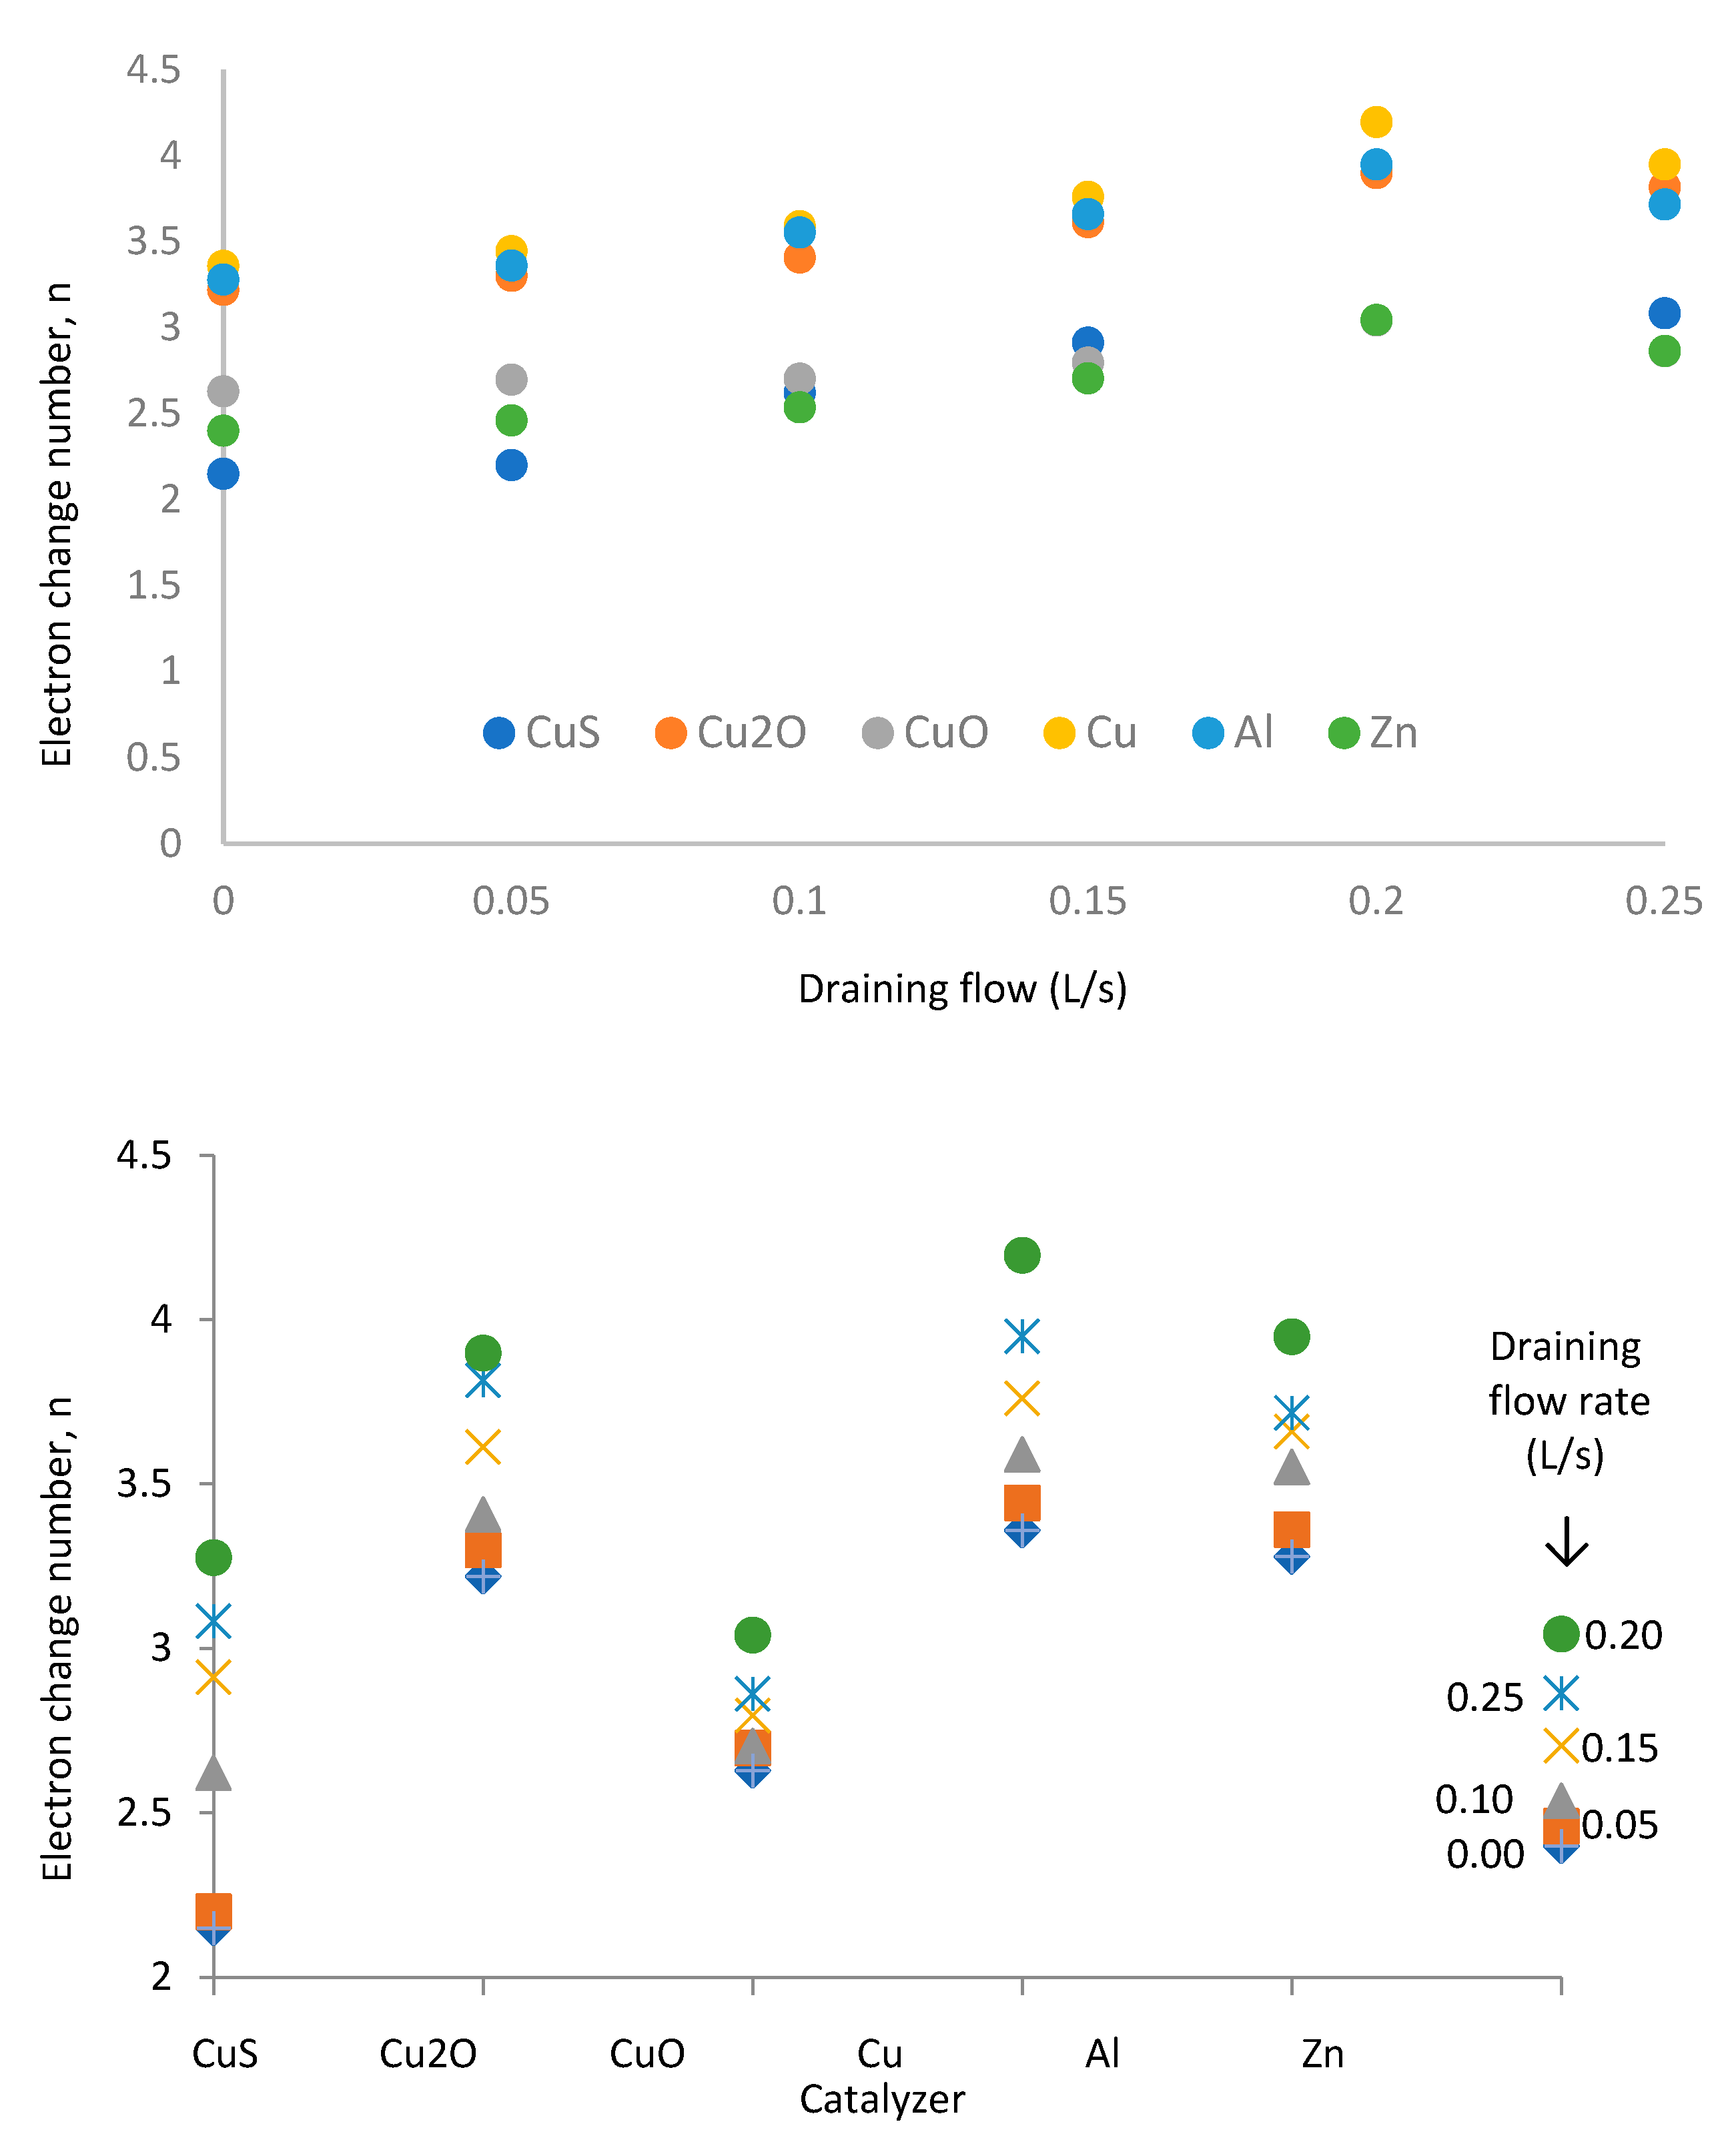
A new simulation process shows the chemical reaction and the development of the electron change number with the methanol/water solution draining (
Figure 17).
We notice that the electron change number increases with the methanol draining flow until it reaches the 0.2 L/s value. The electron change number decreases for higher rates. The draining flow rate of 0.2 L/s represents the optimum operation conditions, showing a maximum electron change number of 4.2 for the copper as the catalyzer. This simulation shows that we cannot achieve the ideal condition of z = 6 independently of the methanol/water solution draining flow.
The simulation results are coherent with theoretical behavior of redox chemical reaction. Operating in Equation (11), and clearing the methanol and water concentration terms, we have the following:
Since carbon dioxide concentration and
Kc remain constant, applying equilibrium conditions, the first derivative of Equation (16) should be zero; therefore:
Operating in Equation (17):
Since the methanol concentration never becomes null and the water concentration does not achieve the infinitum at any time:
Applying the values for methanol and water concentration, the results are as follows.
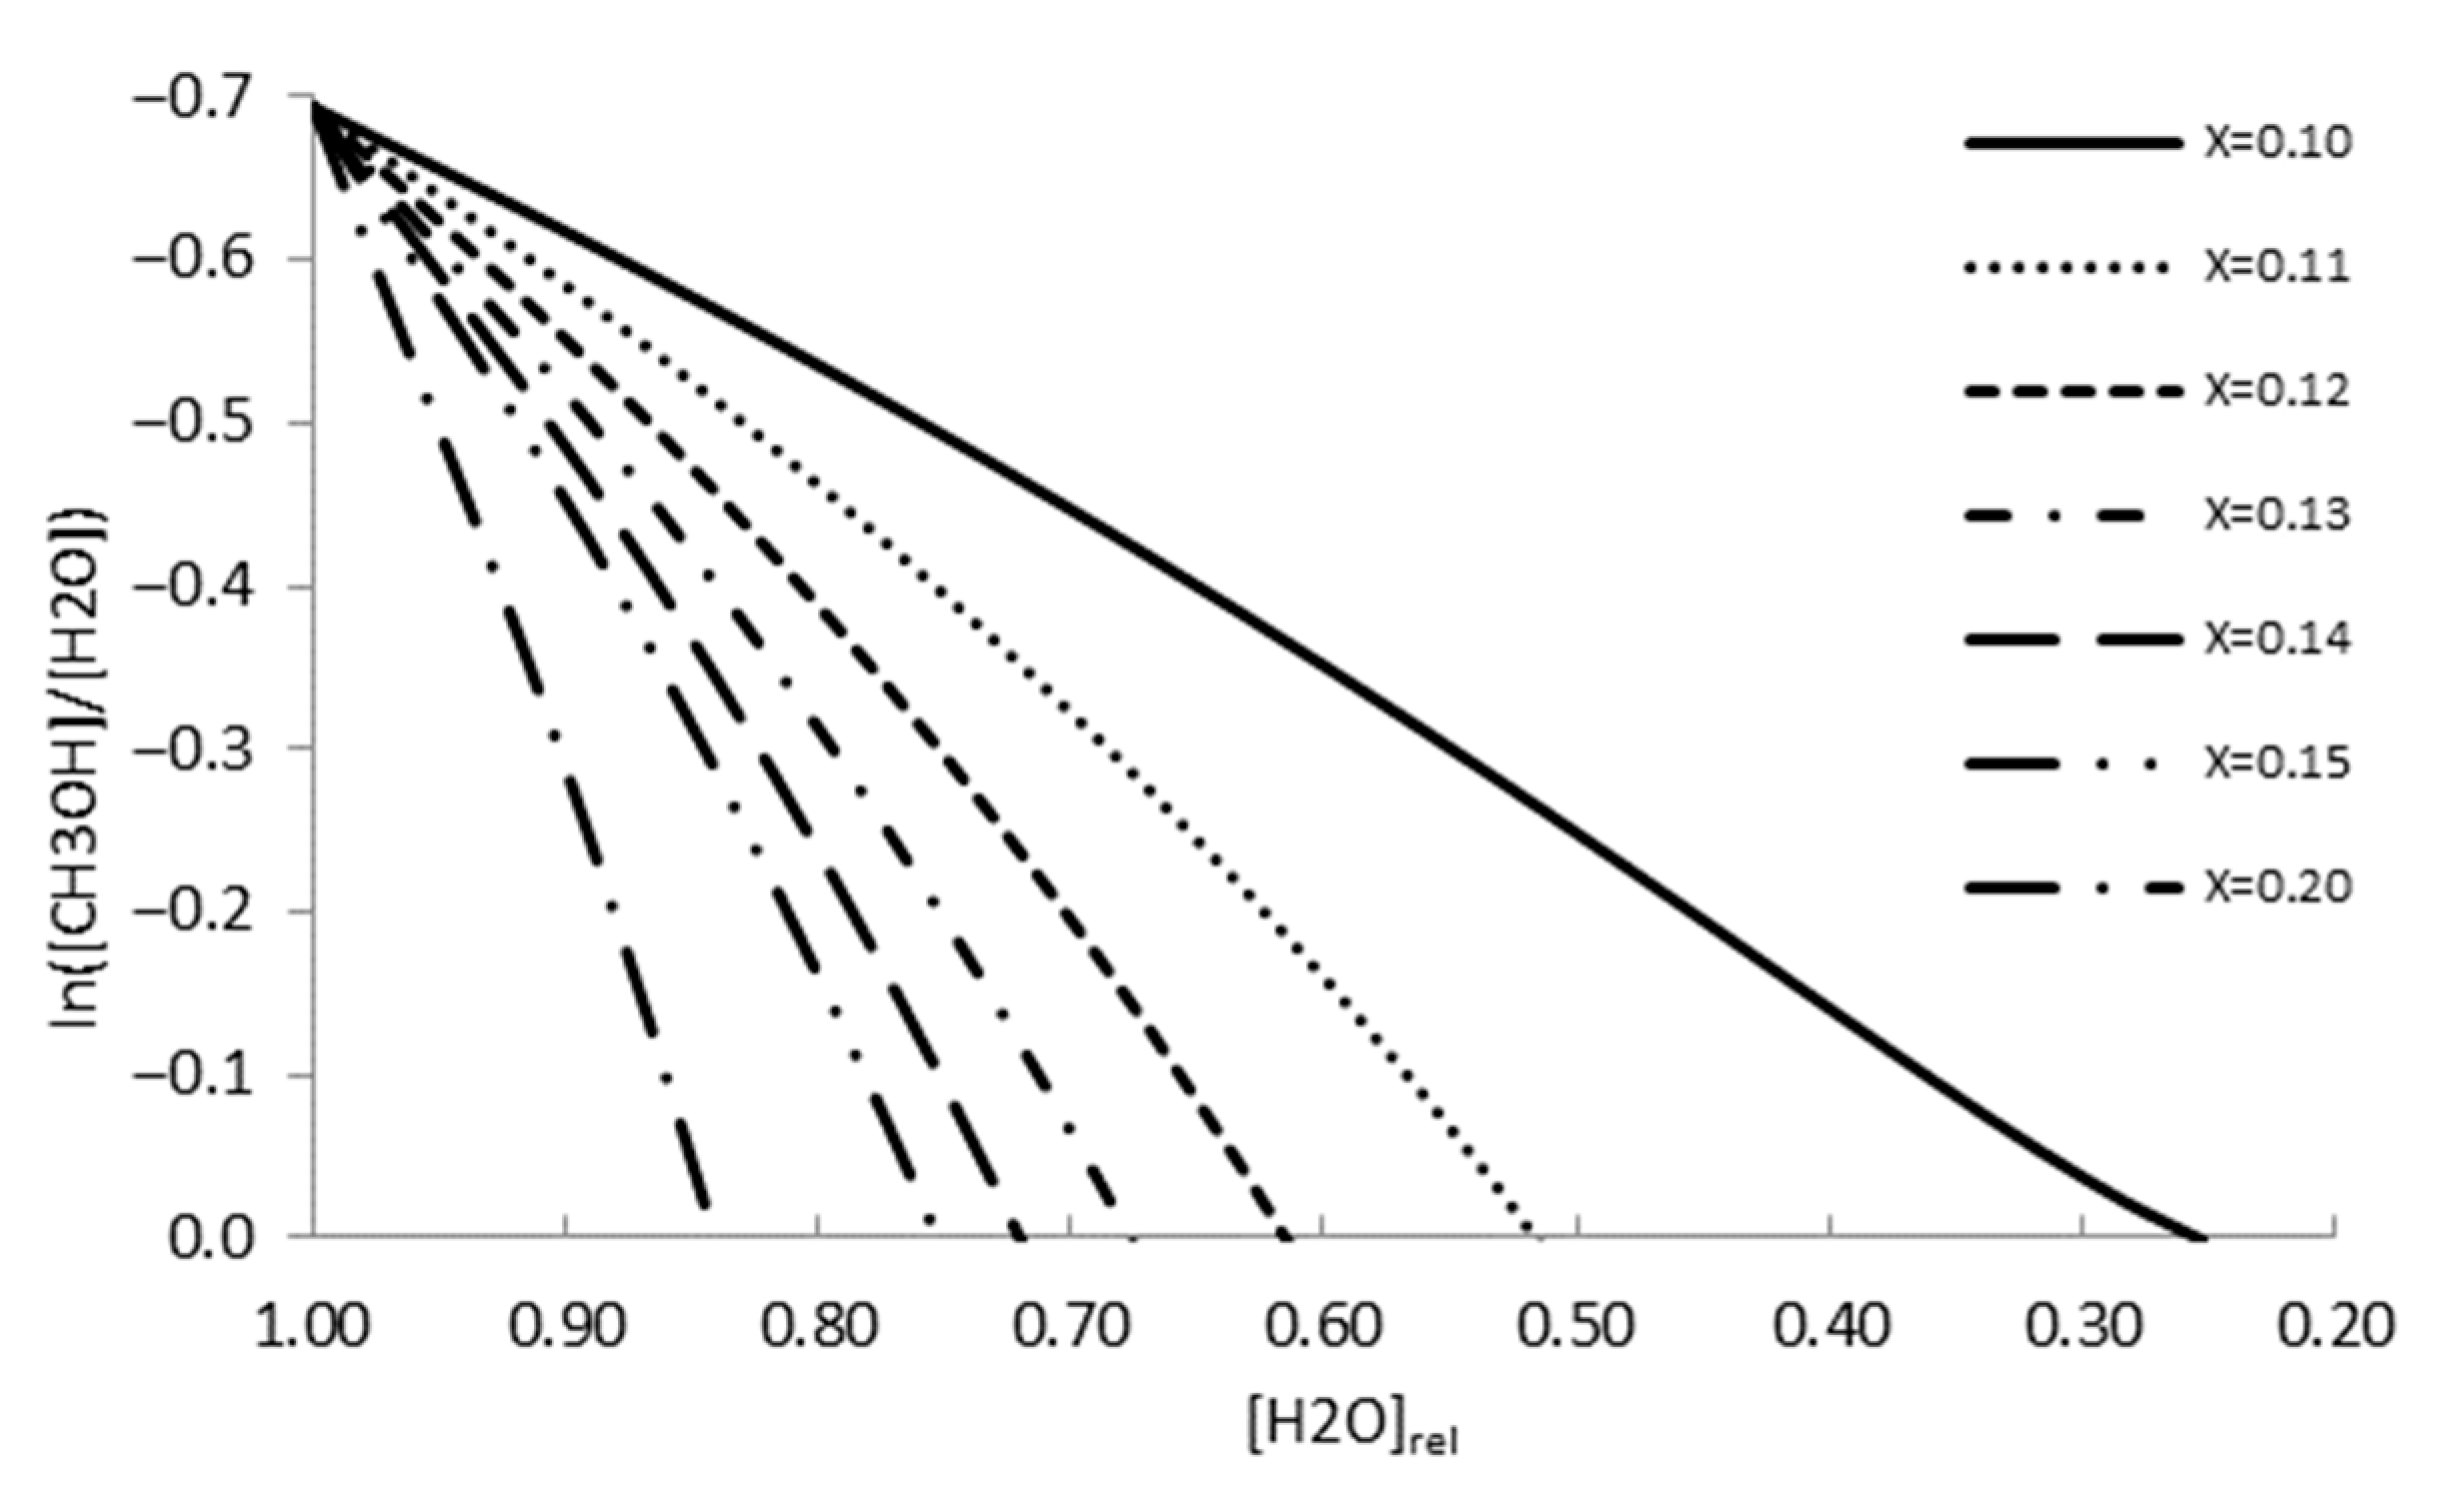
Analyzing
Figure 18, the obtained results show that the chemical reaction disequilibrium of methanol formation tends to zero as the relative water concentration diminishes. Below the value where the function crosses the X-axis, the reaction reverses, and the electron change number reduces. The relative water concentration at which the redox reaction reverses depends on the incremental fraction of the methanol concentration,
x, as shown in
Table 16.
The relative water concentration relates to the initial value in the electrolytic cell.
The simulation shows that for x-values below 0.1, the redox reaction never reverses, meaning that methanol concentration in the electrolytic cell is not high enough to stop the reaction progress.
3.5. Experimental Tests
We run experimental tests to validate the simulation results. To this goal, we proceed to inject carbon dioxide at atmospheric pressure and the ambient temperature inside the electrolytic cell to produce methanol, according to Equation (1). We calculate the methanol concentration by determining the pH evolution in the electrolytic cell solution.
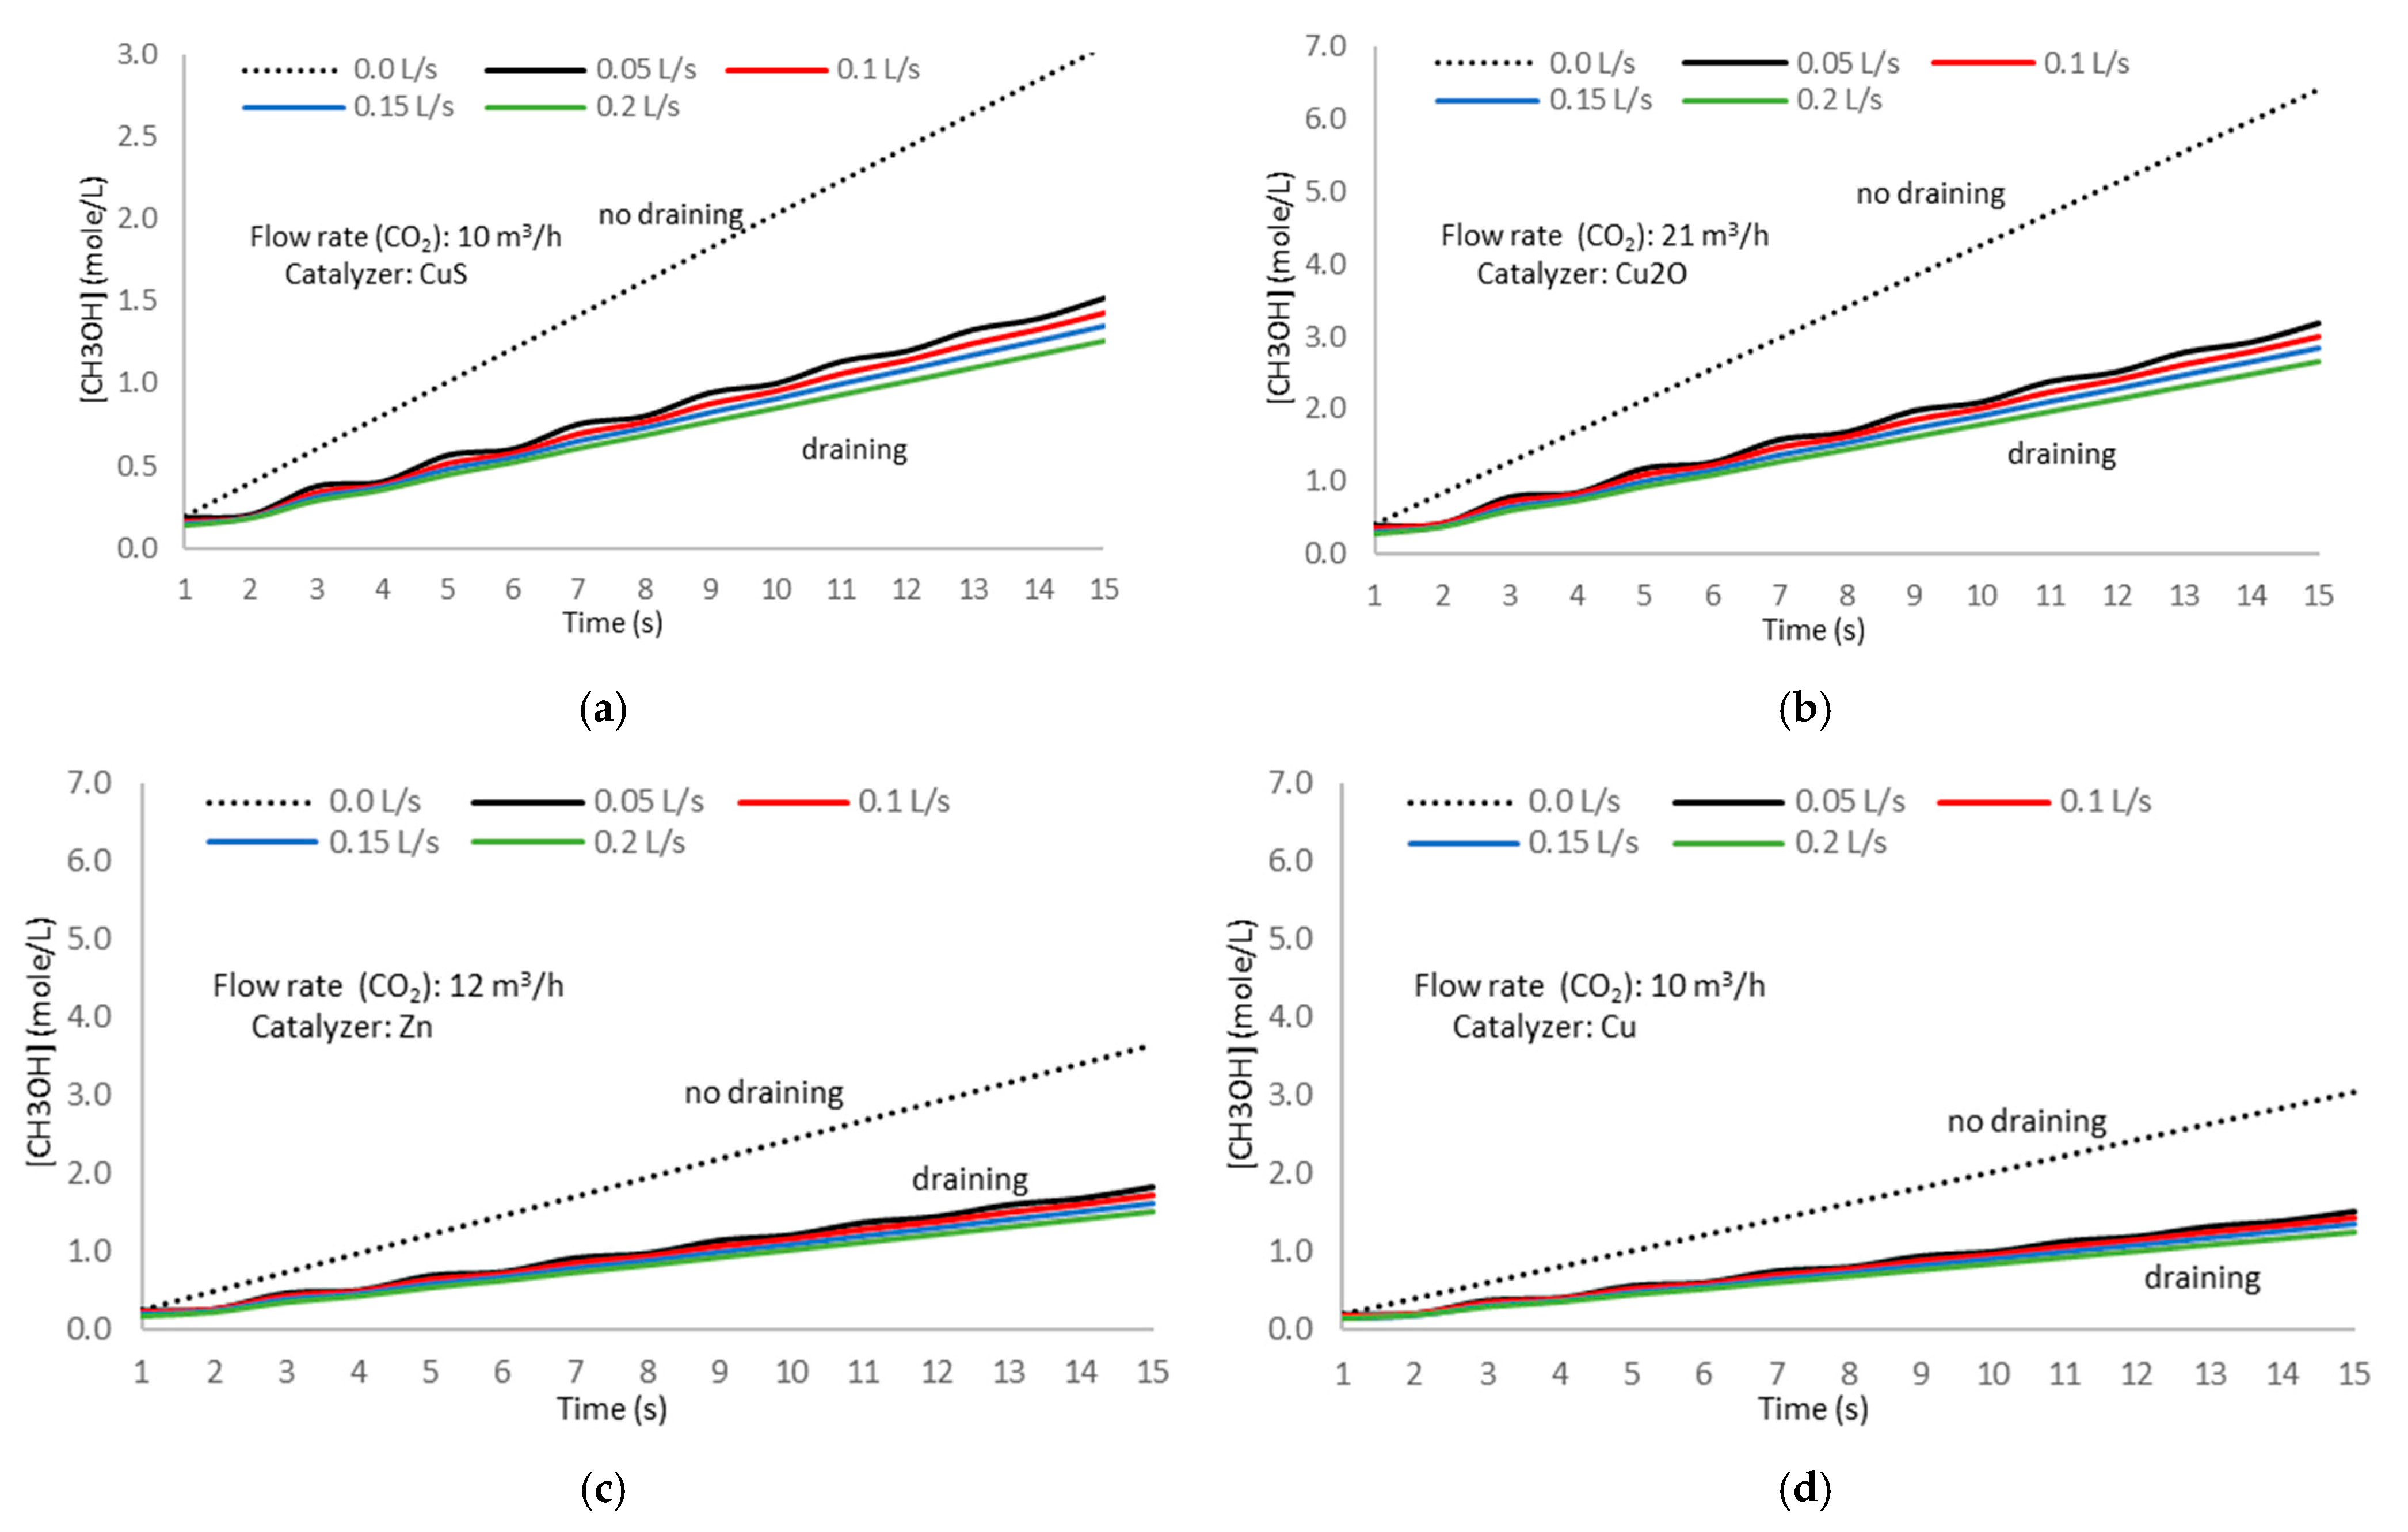
Figure 19 shows the evolution of the methanol concentration with time.
The next step in the experimental tests is determining the time evolution of the methanol concentration with the chemical reaction progress. To this goal, we calculate the
Kc value using Equation (11) since the carbon dioxide and water concentrations are known.
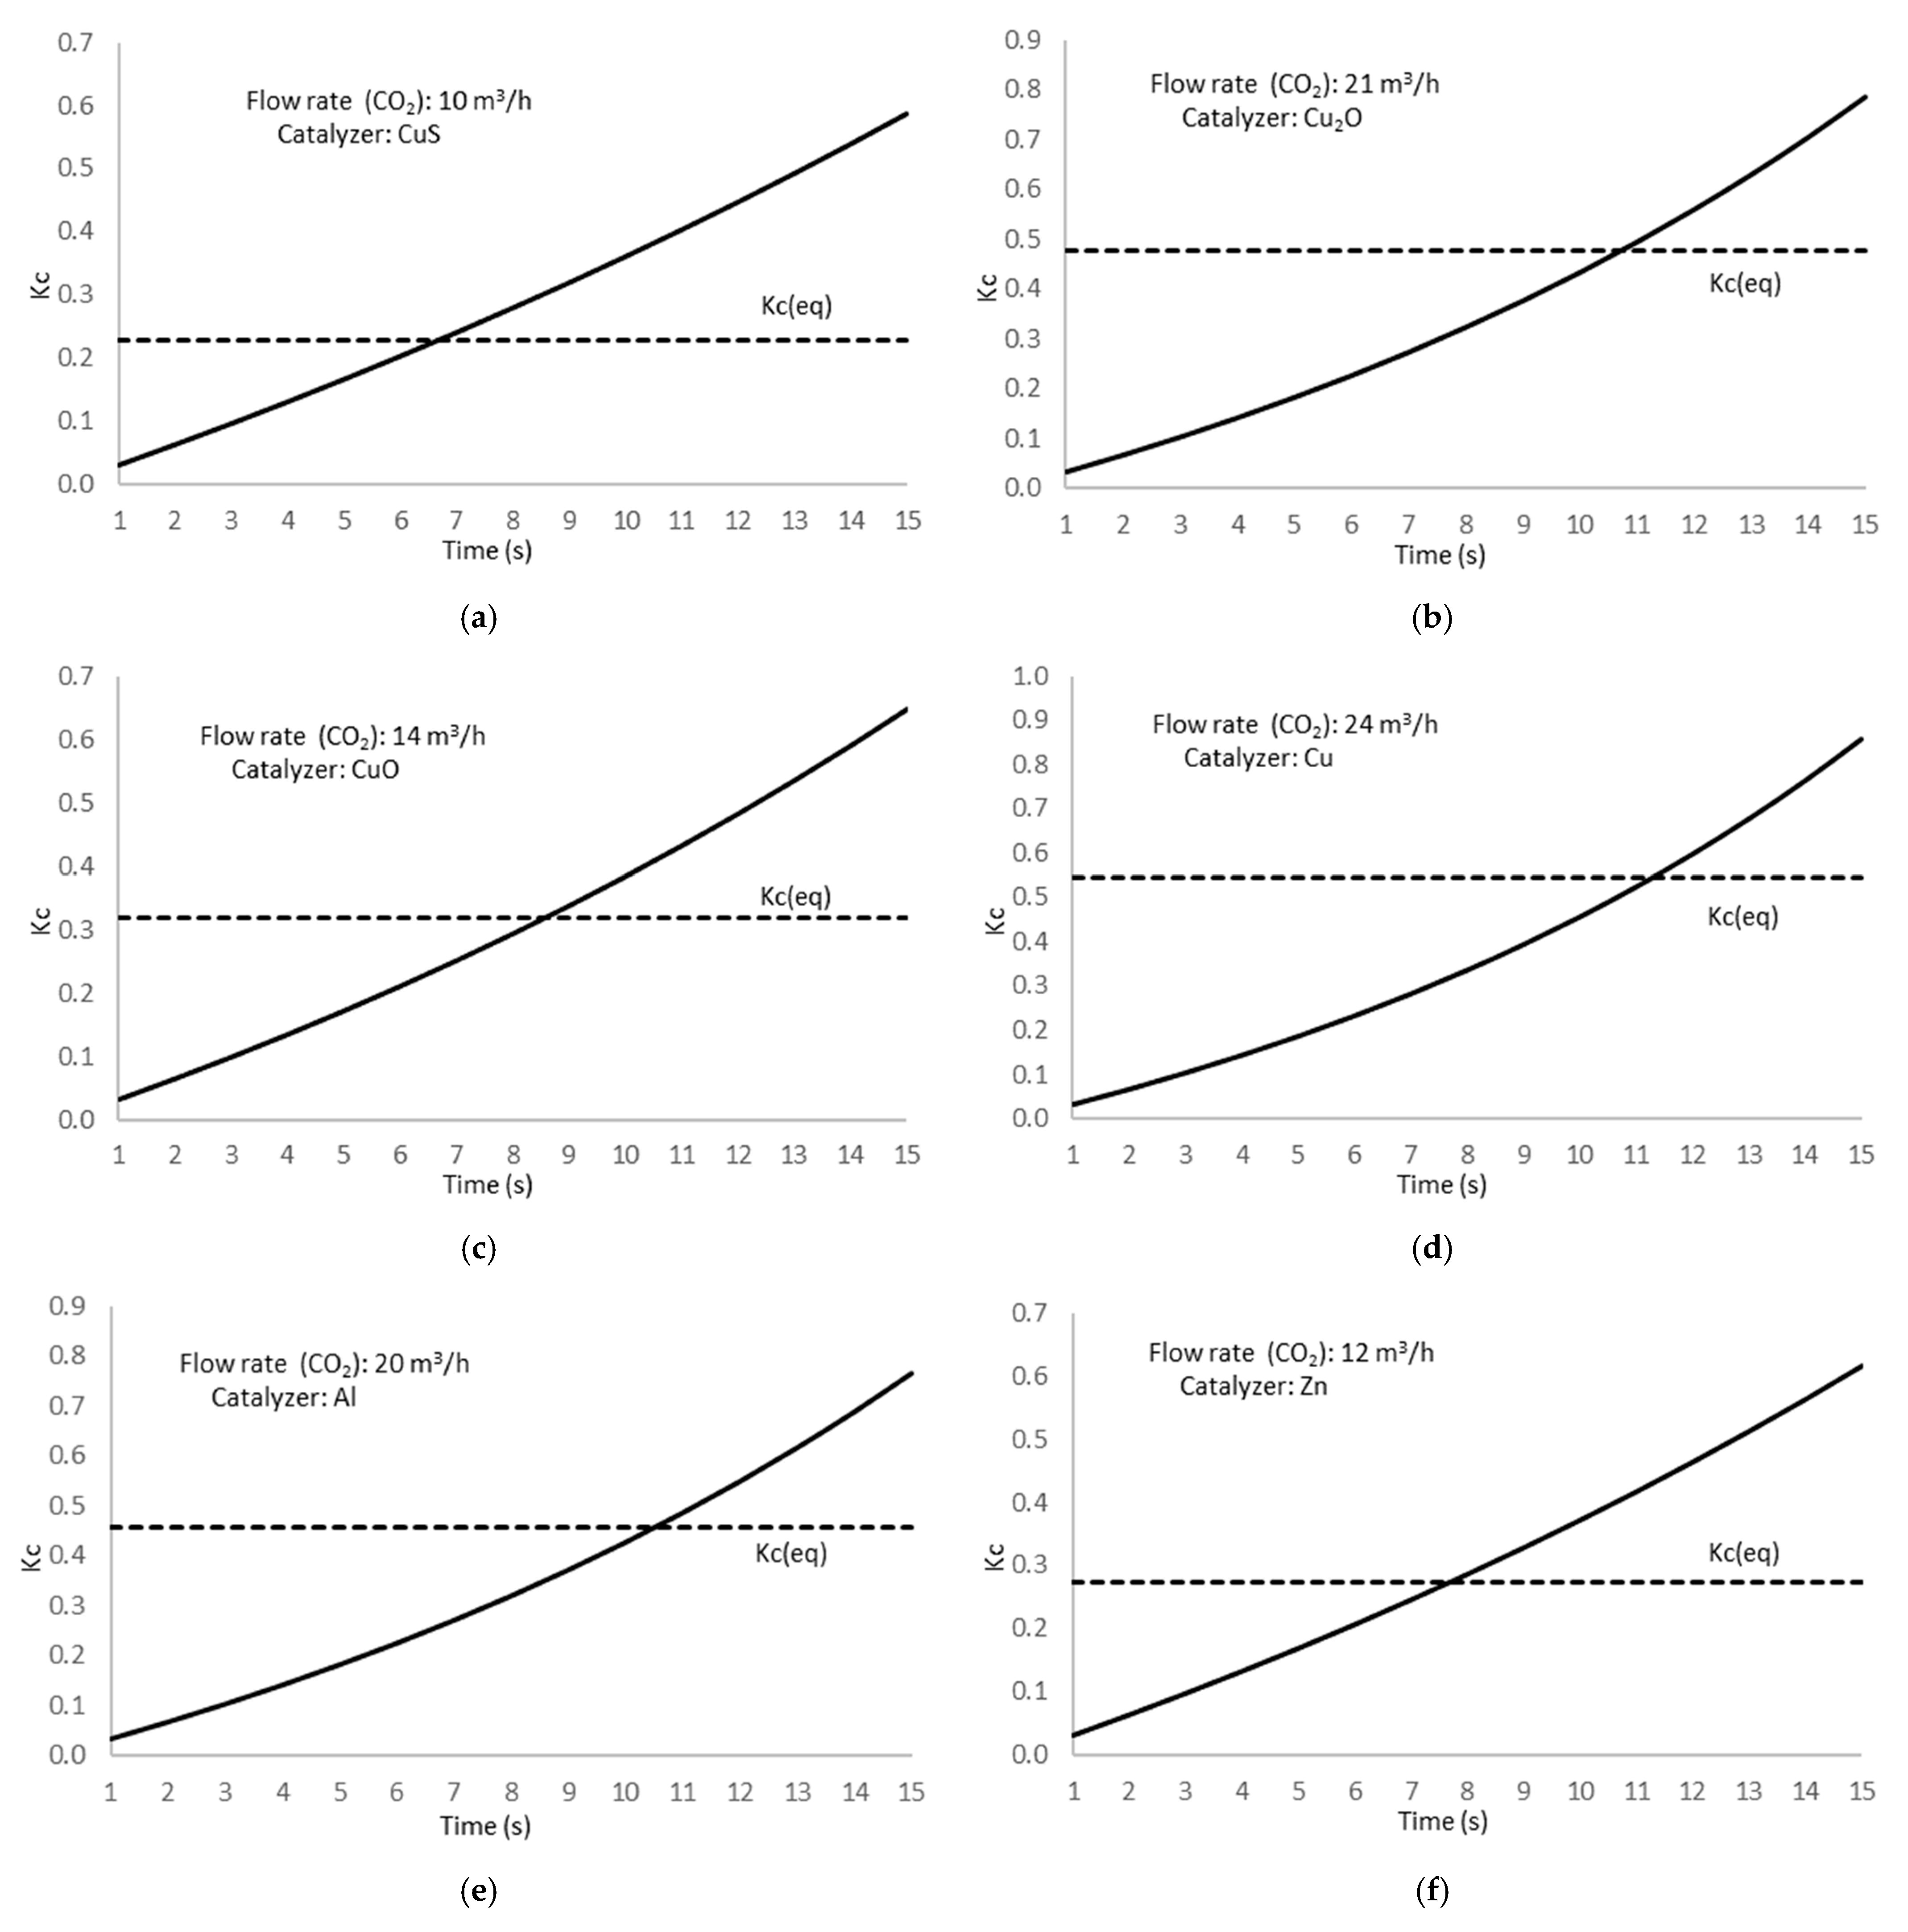
Figure 20 shows the results of the experimental tests.
The dashed line corresponds to the Kc value at the equilibrium state.
The experimental running time corresponds to where the electron change number from running tests matches the calculated value using data from
Figure 20 and applying Equation (13).
Analyzing data from
Figure 20, the obtained results show that the experimental value for the
Kc constant overpasses the equilibrium at a specific time, depending on the catalyzer used in the electrochemical reaction, showing that a reverse process starts from this time to maintain the equilibrium in the methanol formation chemical reaction. This result is consistent with a lower electron change number because of the reverse chemical process to return to the equilibrium state and maintain the
Kc constant.
Table 19 shows the time at which the experimental concentration constant matches the equilibrium value; therefore, the time from which the methanol decomposition reverse reaction starts.
The carbon dioxide injection flow corresponds to the required value to match the equilibrium value.
From the data in
Table 19, we notice that the methanol decomposition reverse reaction occurs quickly from the beginning of the process. This proves that the redox reaction develops in an incomplete form and results in a lower electron change number than the ideal.
If we use the same carbon dioxide injection flow for all catalyzers, taking the value for the CuS catalyzer, 10 m
3/h, as a reference, the time at which the experimental concentration constant matches the equilibrium value is different, as shown in
Table 20.
On the other hand, the time at which the calculated value for the electron change number, using the
Kc values and applying Equation (13), matches the data from the experimental tests is as follows (
Table 21):
3.6. Results Analysis
Analyzing the results obtained from the experimental tests, if we intend to match the experimental data with the calculated value for the methanol formation electrochemical reaction electron change number simultaneously for all chemical processes, we notice that the carbon dioxide injection flow changes depending on the catalyzer used. Data from
Figure 20 shows that for a 15 s running time, the CuS catalyzer requires the lowest carbon dioxide injection flow, while the copper catalyzer requires the highest. The obtained results show that the catalyzers used can be grouped into two categories: CuS, CuO, and Zn, requiring low carbon dioxide injection flow, around 12 m
3/h on average; and Cu
2O, CuO, and Al, requiring nearly double the injection flow, 22 m
3/h.
On the other hand, the time the methanol decomposition reverse reaction starts depends on the catalyzer type; the CuS catalyzer shows the quickest starting time and the copper catalyzer the lowest. Regarding the reverse reaction starting time, we can group the catalyzers into two categories, CuS, CuO, and Zn, showing a relatively short starting time for the reverse reaction, 7.04 s on average; and Cu2O, CuO, and Al, with a longer starting time, 10.54 s on average. These values indicate that the reverse reaction begins at 47% of the total methanol formation process time for the first catalyzers group, CuS, CuO, and Zn, and at 70% for the second group, Cu2O, CuO, and Al, meaning that this latter group is more suitable for methanol formation in the operating conditions.
Applying a constant carbon dioxide injection flow, 10 m3/h, the obtained results show that the reverse reaction starting time is identical for all cases, showing independence from the catalyzer type. Nevertheless, for a constant carbon dioxide injection flow, the time at which the experimental data and calculated value for the electron change number match in the methanol formation electrochemical reaction depends on the catalyzer, with the lowest value for the copper and the highest for the CuS. The analysis of all starting times shows a low standard deviation, σ = 0.759, around the average value of 11.9 s.
3.7. Draining Methodology
Draining the methanol/water solution in the electrolytic cell reduces the methanol concentration and favors the reaction progress to produce methanol from carbon dioxide. The analysis developed in a previous section shows (
Figure 17) that draining increases the electron change number, bringing the methanol formation process closer to ideality.
To this goal, we ran experimental tests draining the methanol/water solution at the flow rate shown in
Figure 17, except for the case of 0.25 L/s, since we proved that the reaction progress degree reduces from the optimum flow rate of 0.2 L/s. The experimental tests corresponded to the methanol concentration and reaction constant evolution with time for the same time range used for previous tests without draining.
Figure 21 and
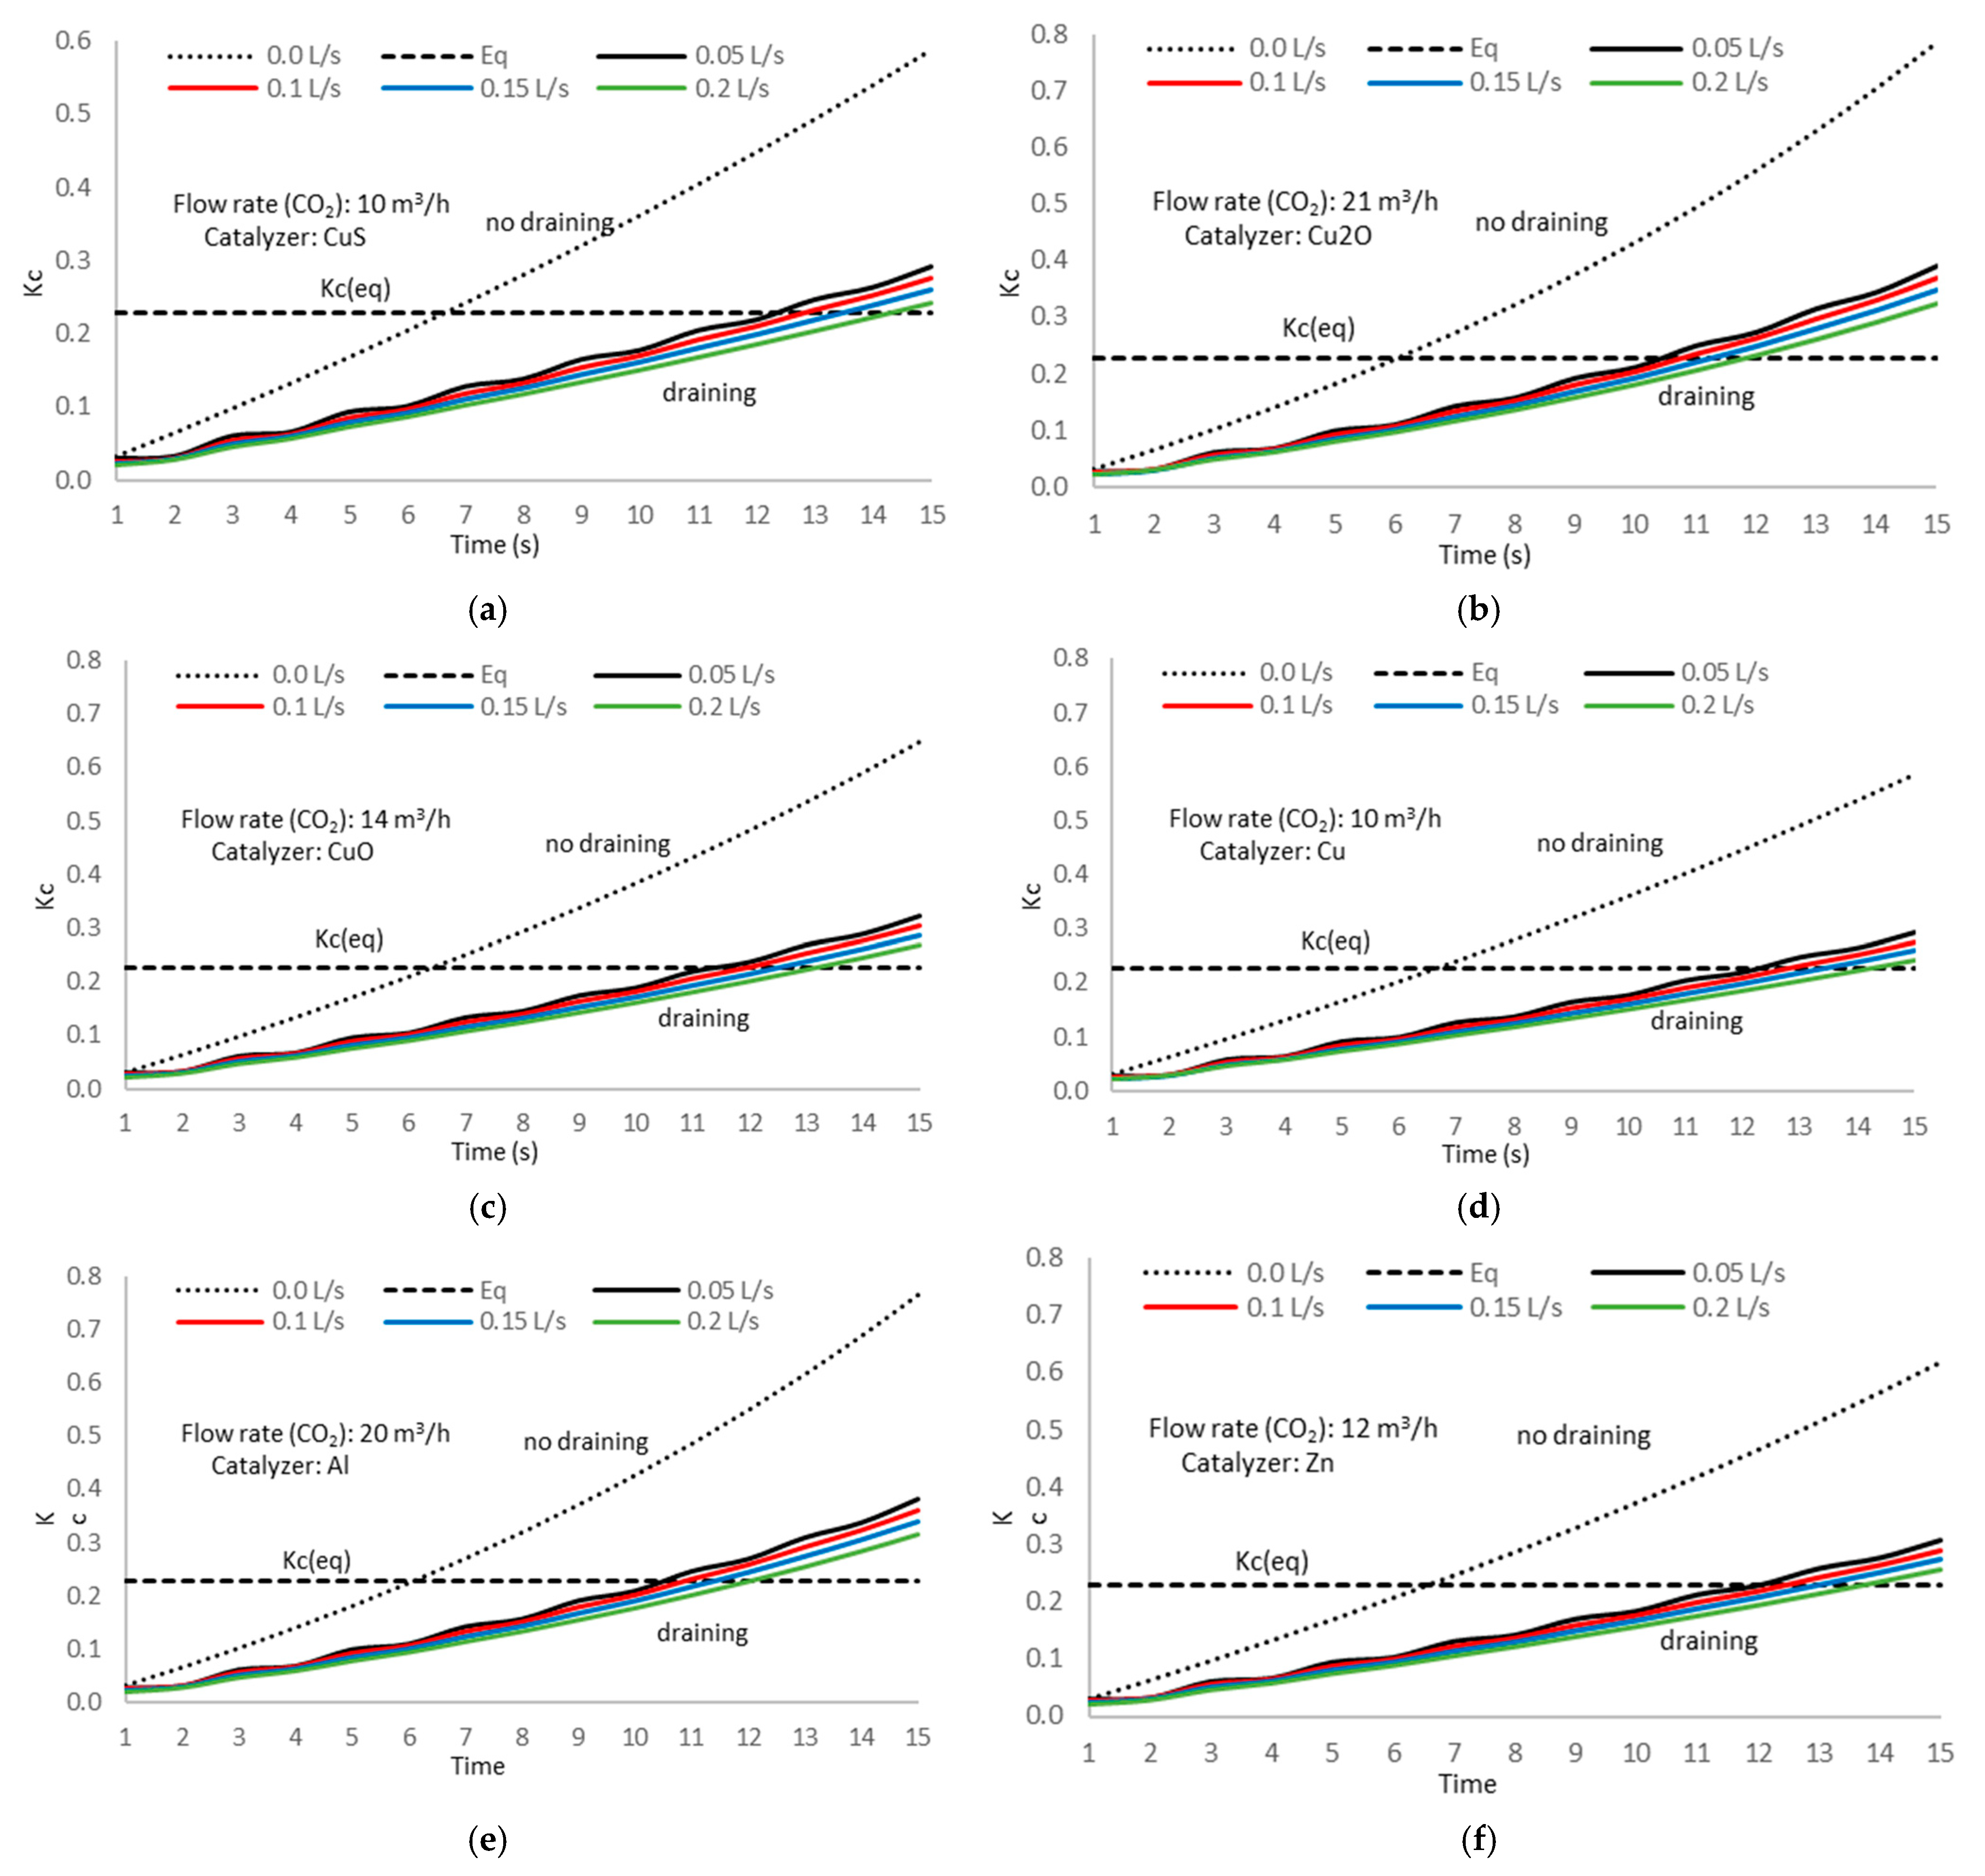
Figure 22 show the experimental results.
Comparing the time evolution of the methanol concentration under current conditions and using the draining methodology, we notice that this last procedure shows a significant reduction in the methanol concentration in the electrolytic cell solution. This process favors the direct reaction progress and continuous methanol formation and tends to achieve the maximum electron change number and the optimum performance. This situation occurs in all cases with slight differences between the catalyzer types.
Analyzing the experiment results, we also noticed no significant differences in the time evolution of methanol concentration between the different catalyzer types when applying the draining methodology. Applying statistical methods, we determined the average ratio of the time evolution of methanol formation with and without draining, obtaining a value of 0.513 with a standard deviation of 0.008, proving the high accuracy in the ratio determination and the consistency of the obtained value.
The colored lines in
Figure 21 correspond to the draining flow labels shown on the upper side of the figure. The dashed line represents the time evolution of methanol formation without draining.
The data analysis from the experiment results in
Figure 21 shows that the draining flow is not critical to reducing the methanol formation; therefore, we can use the lower draining value, saving energy in pumping the methanol/water solution from the reactor to the distiller.
A second step in the experimental tests using the draining methodology is evaluating the time evolution of the concentration constant when we drain the electrolytic cell solution.
Figure 22 shows the experiment results.
As expected, the reaction constant in the methanol formation shows the same reduction ratio as for the methanol concentration, with an identical value of 0.513 and a standard deviation of 0.008, proving the accuracy in the value determination.
We also notice no significant difference in the
Kc performance between different catalyzers, with a slight gap from one to another.
Table 15 shows the time the reaction constant,
Kc, matches the equilibrium value for the non-draining and draining cases with the different catalyzers. This value represents the point where the methanol decomposition reverse reaction starts.
Table 21 also shows the time fraction where the reverse reaction begins, regarding the total time of the process.
Regarding the data in
Table 23, we notice that the draining process extends the reverse reaction starting time, improving the methanol formation performance. On the other hand, the electronic change is modified when using the draining process;
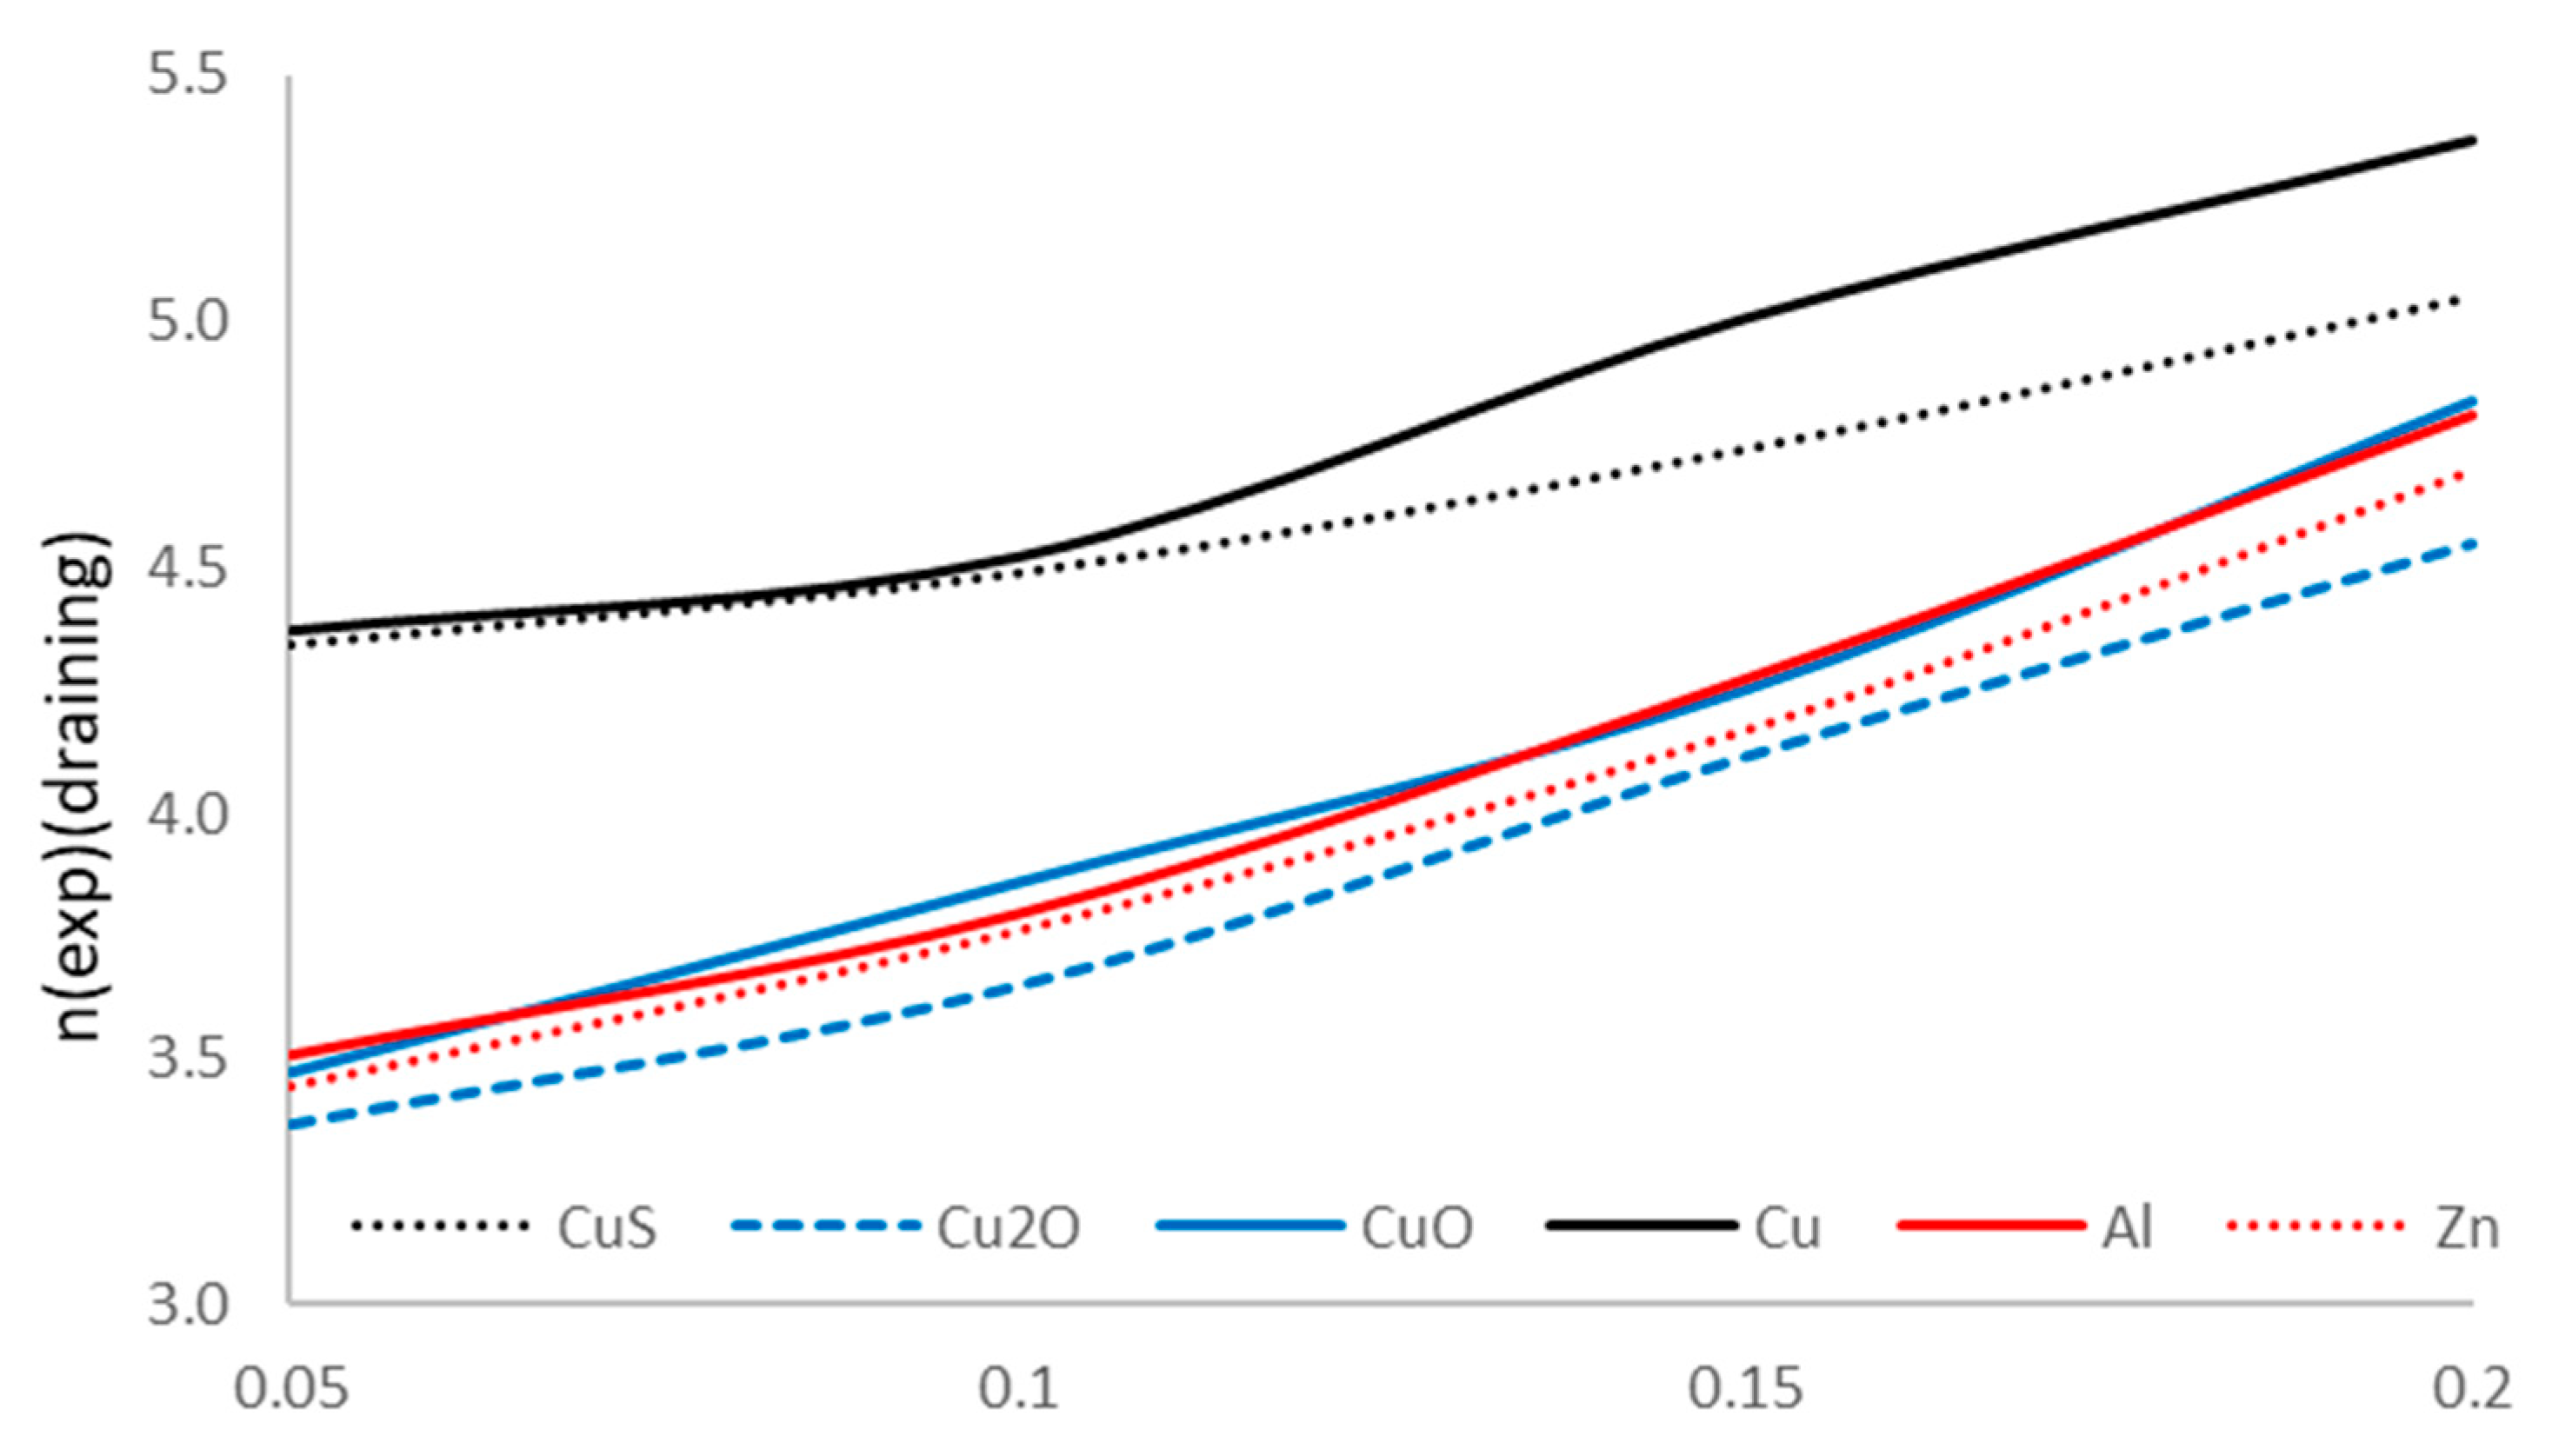
Figure 23 shows the evolution of the experimental n-value for the various flow rates and catalyzer types.
The obtained results show that the improvement in the methanol formation process, with the electron change number in the redox reaction approaching to the ideal value z = 6. The experiment results using the draining methodology prove the profitability of the technique used.
