Article

Green Synthesis and Characterization of Fe3O4 and ε-Fe2O3 Nanoparticles Using Apricot Kernel Shell Extract and Study of Their Optical Properties

1
Laboratoire Physico-Chimique des Materiaux et Environnement (LPCME), Faculty of Exact Sciences and Computer Science, University of Djelfa, P.O. Box 3117, Djelfa 17000, Algeria
2
Laboratory of Organic Chemistry and Naturel Substance (LOCNa), Faculty of Exact Sciences and Computer Science, University of Djelfa, P.O. Box 3117, Djelfa 17000, Algeria
3
Laboratoire de Physique de la Matière Molle et de la Modélisation Electromagnétique, Faculté des Sciences de Tunis, Université de Tunis El Manar, Rommana 1068, Tunisia
4
Unité Matériaux et Transformations (UMET), UMR8207, CNRS, INRAE Centrale Lille, Université de Lille, 59000 Lille, France
*
Authors to whom correspondence should be addressed.
Physchem 2025, 5(3), 33; https://doi.org/10.3390/physchem5030033
Submission received: 14 May 2025 / Revised: 1 August 2025 / Accepted: 8 August 2025 / Published: 10 August 2025
(This article belongs to the Section Photophysics, Photochemistry and Photobiology)

Abstract

The synthesis of Fe3O4 and ε-Fe2O3 nanoparticles (hereafter referred to as Fe3O4 NPs and ε-Fe2O3 NPs, respectively) was conducted in an eco-friendly manner using FeCl3·6H2O as the primary reactant. The experiment was conducted by subjecting the sample to an aqueous solution of FeCl2·4H2O at a temperature of 80 °C for a duration of 45 min, with the inclusion of apricot kernel shell extract (AKSE) as a natural reducing agent. The synthesized Fe3O4 NPs and ε-Fe2O3 NPs were characterized using Fourier transform infrared spectroscopy (FTIR), X-ray diffraction (XRD), scanning electron microscopy (SEM), and thermogravimetric analysis (TGA). The optical properties of Fe3O4 NPs and ε-Fe2O3 NPs were examined, with the band gap energy estimated using the Kubelka–Munk formula. The results demonstrated a band gap of Eg (Fe3O4 NPs) = 2.59 eV and Eg (ε-Fe2O3 NPs) = 2.75 eV, thereby confirming their semiconductor behavior. The photoconductivity of Fe3O4 NPs and ε-Fe2O3 NPs was analyzed as a function of photon energy. For Fe3O4 NPs, photoconductivity exhibited an increase between 1.37 eV and 6.2 eV prior to reaching a state of stability. A comparable trend was observed for ε-Fe2O3 NPs, with an increase from 1.35 eV to 6.22 eV, followed by stabilization. Furthermore, the extinction coefficient (k) was determined. For Fe3O4 NPs, k ranged from 39 to a maximum of 300, while for ε-Fe2O3 NPs, it varied from 37 to a maximum of 280. A higher k value indicates strong light absorption, rendering these nanoparticles highly suitable for photothermal and sensing applications.

1. Introduction

In recent years, there has been a significant increase in research focused on nanomaterials, particularly with regard to their distinctive catalytic, optical, electrical, optoelectronic, mechanical, thermodynamic, and magnetic properties [1]. These properties of nanomaterials differ considerably from those exhibited by their bulk counterparts. These characteristics render nanomaterials promising for various nanodevice applications [2,3]. Transition metal oxides, in particular, have attracted considerable attention due to their exceptional physical, electrical, magnetic, and optical properties [1] at the nanoscale (dimensions of less than a few hundred nanometers), resulting from high surface-to-volume ratios, quantum confinement effects, and surface phenomena. Among these elements, iron and its oxides have played a pivotal role in a variety of scientific and industrial applications for over half a century [4]. A total of sixteen iron oxides have been identified thus far [5]. A number of these, including Fe3O4 and ε-Fe2O3, are currently under intensive study due to their promising potential applications in various fields, including electronics, biomedicine, and environmental processes [6,7]. Iron oxide nanoparticles have gained significant recognition for their diverse applications, including but not limited to drug delivery [8], magnetostriction [9], magnetic resonance imaging [10], microwave absorption, dye degradation, and photocatalysis [11]. The practical importance of these elements serves as the impetus for extensive research into synthesis and characterization [12]. A plethora of methodologies have been devised for the synthesis of iron oxide nanoparticles, including sol–gel [13], microemulsion [14], sonochemical techniques [15], ultrasonic spraying, pyrolysis [16], and microwave plasma [17]. The efficacy of these methods is contingent upon factors such as particle size control, production scalability, and cost effectiveness. Among these methods, wet chemical processes are economically viable; however, they frequently necessitate intricate multi-step protocols [18]. In this study, the synthesis of Fe3O4 NPs and ε-Fe2O3 NPs was carried out using an environmentally friendly approach. Apricot kernel shell extract was utilized as a natural reducing agent in the synthesis process, thereby emphasizing sustainability. A suite of advanced characterization techniques was employed to validate the synthesis of Fe3O4 NPs and ε-Fe2O3 NPs, with the objective of ascertaining their structural, thermal, and chemical properties. The aforementioned techniques comprised scanning electron microscopy (SEM), X-ray diffraction (XRD), Fourier transform infrared spectroscopy (FTIR), and thermogravimetric analysis (TGA).

2. Materials and Methods

2.1. Materials

Iron(III) chloride hexahydrate (FeCl3·6H2O) was obtained from BIOCHEM, Chemopharma, Montreal, Canada, and iron(II) chloride tetrahydrate (FeCl2·4H2O) was purchased from BIOCHEM, Chemopharma, Leuven, Belgium. Sodium hydroxide (NaOH) was procured from Sigma-Aldrich (Dolní Dobrouč, Czech Republic), while 96% ethanol was obtained from Honeywell (Frankfurt am Main, Germany). The apricot kernel shells utilized as a raw material were obtained from Dar Shuyukh city, situated within the Djelfa region in central Algeria.

2.2. Collection and Preparation of Plant Material for Apricot Kernel Shell Extraction

Apricot kernel shells were collected in May 2023 from Dar Shuyukh city, which is located in the central region of Djelfa, Algeria. The shells were air-dried at room temperature, away from direct sunlight, in order to preserve their integrity. The dried shells were subsequently pulverized into a fine powder using a mortar and pestle. A 10 g portion of the powdered material was meticulously combined with 100 mL of distilled water. The mixture was then subjected to magnetic stirring at a temperature of 70 °C for a duration of 2 h. The resulting mixture was then subjected to a centrifugal process to separate the solid residues. The upper layer, or the “supernatant,” was collected and stored at 4 °C for subsequent use.
In contrast to the numerous other plant extracts employed in green synthesis, which are typically derived from leaves, flowers, or seeds, apricot kernel peel extract is an inexpensive, underutilized agricultural by-product that is abundant in bioactive compounds, including ascorbic acid, polyphenols, and flavonoids. It functions as both a reducing and stabilizing agent in the synthesis of nanoparticles while concurrently contributing to the principles of a circular economy through the valorization of agro-waste.

2.3. Synthesis of ε-Fe2O3 NPs

The synthesis of ε-Fe2O3 NPs was carried out in accordance with the protocol described by Mohammed et al. with modification [19]. The following reagents were utilized: 0.811 g of FeCl3. The 6H2O solution was prepared by dissolving 6H2O in 100 mL of distilled water. The solution was then subjected to heating at 80 °C under continuous stirring for a duration of 45 min, with the objective of achieving complete dissolution. Subsequently, 50 mL of apricot kernel shell extract was added dropwise to the FeCl3. The result of the dissolution of six molecules of water is a solution that is dark orange in color. A 20 mL solution of 1M sodium hydroxide (NaOH) (pH = 11) was added dropwise to an orange solution, resulting in a color change from dark orange to black. This color change indicates the formation of ε-Fe2O3 NPs. The resulting black precipitate was washed five times with distilled water and ethanol to remove impurities and then collected by centrifugation. The ε-Fe2O3 NPs were then subjected to vacuum drying at a temperature of 25 °C for the purpose of subsequent characterization.
The following is a simplified reaction:
F e C l 3 + Bio-reducingagents   + N a O H                       heat ,   stirring   ε - F e 2 O 3 N + byproducts   ( water ,   salts )
In the context of employing exclusively Fe3+ precursors, the polyphenols and flavonoids inherent in the plant extract facilitate the nucleation of metastable ε-Fe2O3 under mild conditions.

2.4. Synthesis of Fe3O4 NPs

The synthesis of Fe3O4 NPs was carried out in accordance with the protocol outlined by Abd et al. [20]. This involved the dissolution of 1.16 g of FeCl3 in a suitable solvent. The solution consists of six moles of water and 0.43 g of FeCl2. A solution of 4H2O in 100 mL of distilled water was prepared, with the molar ratio of Fe3+ to Fe2+ set at 2:1. The solution was subjected to continuous stirring at 80 °C for a duration of 45 min. Thereafter, 20 mL of apricot kernel shell extract was added dropwise, resulting in the transformation of the solution into a dark orange hue. Following a 5 min waiting period, 20 mL of a 1 M NaOH solution (pH = 11) was added dropwise, resulting in a color change from dark orange to black. This change indicates the formation of Fe3O4 NPs. The black precipitate was meticulously washed five times with distilled water and ethanol to eliminate impurities. It was then collected by centrifugation and dried under vacuum at 25 °C for subsequent analysis.
The following is a simplified reaction:
2 Fe 3 + + Fe 2 + + 8 O H + bio-reducing / capping   agents Fe 3 O 4 ( N P s ) + 4 H 2 O
The selective formation of Fe3O4 versus ε-Fe2O3 is primarily dependent on the Fe3+/Fe2+ precursor ratio. In the presence of Fe2+ ions at a molar ratio of 2:1 to Fe3+ ions, the formation of magnetite (Fe3O4) nanoparticles occurs under basic conditions. In this environment, Fe2+ is stabilized by the bioactive compounds present in the plant extract, thereby promoting the formation of the mixed-valence Fe3O4 phase.

3. Characterizations

The synthesized ε-Fe2O3 NPs and Fe3O4 NPs were subjected to a comprehensive physicochemical characterization using a variety of analytical techniques.
High-performance liquid chromatography (HPLC) analysis was performed on a Shimadzu LC-20ADXR system (Shimadzu Corporation, Kyoto, Japan) (low-pressure gradient mode) using an Ultra C18 column (250 × 4.6 mm, 5 µm). The mobile phase consisted of 0.1% acetic acid (A) and acetonitrile (B), with a gradient from 10% to 100% B (0–55 min), followed by a return to initial conditions at 60 min (total run time: 70 min). Flow rate: The flow rate was set at 1.0 mL/min, and the injection volume was 10 µL, as measured by an SIL-20ACXR autosampler.
The detection process was carried out using a PDA detector (SPD-M20A) set at 250 nm. The column temperature was maintained at 30 °C, with a wavelength range of 190–800 nm. The sampling rate was 1.5625 Hz, and the time constant was 0.640 s.
The experimental procedure involved the implementation of FTIR spectroscopy, which was conducted using an IRTracer−100 spectrometer. Spectroscopic data were collected in the 4000–400 cm−1 range, with a resolution of 4 cm−1. To ensure accuracy, 32 scans were taken at room temperature under dry conditions. XRD analysis was performed using a PANalyticalX’Pert Pro diffractometer equipped with a copper anode (CuKα radiation, λ = 1.54 Å). The data were collected over a 2θ range of 5–110°, with a step size of 0.02° and a scan speed of 0.5°/min. The morphology and size distribution of the nanoparticles were examined using a field-emission SEM (FE-SEM, Thermo Fisher Apreo 2 C) (Thermo Fisher Scientific, Waltham, MA, USA) This instrument is equipped with an FEG-Schottky field emission gun and a Gemini® ultra-fine electron column for high-resolution imaging at low accelerating voltages. TGA and differential thermal analysis (DTA) were conducted using a SETARAM Labsys Evo device under a nitrogen atmosphere at a flow rate of 40 mL per minute. The samples were subjected to analysis within a temperature range of 30–800 °C at a heating rate of 10 °C/min. The spectral reflectance of the samples was measured using an SP-UV 500DB/VDB dual-beam UV-Vis spectrometer (manufactured by Spectrum Instruments, South Bank, Victoria, Australia) over a wavelength range of 200–900 nm.

4. Results

4.1. HPLC Analysis of Apricot Kernel Peel Extract

A thorough HPLC analysis of the aqueous extract of apricot kernel peel was conducted, revealing the presence of a complex mixture of bioactive compounds. This analysis confirmed the potential of the extract as a natural reducing and capping agent for the green synthesis of iron oxide nanoparticles. The extract contains a variety of identified compounds, including ascorbic acid (C6H8O6), pyrocatechol (C6H6O2), salicin (C13H18O7), and esculin (C15H16O9). Caffeine (C8H10N4O2), vanillic acid (C8H8O4), rutin (C2H30O16), vanillin (C8H8O3), caffeic acid (C9H8O4), salicylic acid (C7H6O3), and enamic acid (C9H8O2) were identified in the given sample. Furthermore, the presence of additional, more intricate compounds was ascertained; nevertheless, their precise identification proved to be arduous due to the intricacy of the extract. Table 1 presents the proportions of certain compounds present in apricot kernel peel extract.
A review of the scientific literature reveals the presence of several compounds in apricot kernel peel extract, including xylans (xylooligomers, or xylose) [21,22,23,24], carbohydrates (sugars, glycosides, and starch) [21], acetic acid [22], uronic acids [21], and lignin [22,23,24].

4.2. FTIR Analysis

An FTIR spectrum of ε-Fe2O3 NPs is depicted in Figure 1a. The broadband observed at 3379 cm−1 is attributed to the stretching vibration of hydroxyl groups (OH). The absorption bands observed at 1650 cm−1 and 1500 cm−1 are attributed to the asymmetric and symmetric bending vibrations of carbonyl groups (C=O), respectively. The absorption band at 1350 cm−1 is attributed to the stretching vibrations of C-O bonds, indicating the presence of organic functional groups. These functional groups are likely the result of residual compounds present in the apricot kernel peel extract utilized during the synthesis process [25]. In the range of 648 cm−1 and below, an intense band is attributed to the Fe-O stretching mode, with a characteristic absorption of ε-Fe2O3 identified at 560 cm−1 [25]. Figure 1b presents the FTIR spectrum of the Fe3O4 NPs. As indicated by the extant literature, the presence of an absorption band beyond 600 cm−1 is not ordinarily observed in the case of magnetite. The presence of an intense band at 1000 cm−1 serves as a confirmation of the occurrence of the magnetite phase [26].

4.3. XRD Analysis

Figure 2a,b illustrate the XRD analysis of ε-Fe2O3 NPs and Fe3O4 NPs, respectively. The ε-Fe2O3 NPs demonstrate specific peaks at 18.57° (002), 30.59° (013), 35.50° (210), 43.27° (114), 57.00° (311), 62.70° (322), and 81.60° (422), thereby verifying their orthorhombic configuration (JCPDS card No. 98-017-3025). These results substantiate the effective synthesis of the ε-Fe2O3 phase. In a similar manner, the Fe3O4 NPs exhibit characteristic peaks at 18.13° (111), 30.30° (022), 35.92° (113), 43.87° (004), 72.81° (026), and 78.95° (444). These peaks correspond to an orthorhombic structure, as indicated in JCPDS card No. 98-009-6012. These observations confirm the successful synthesis of the Fe3O4 phase.
Furthermore, crystal size measurements were determined from the full width at half maximum (FWHM) of the strongest reflections at the highest height. This was performed using the Scherrer approximation, which assumes that small crystal size is the cause of line broadening (Equation (1)) [27].
L = 0.89 λ β c o s θ
where L represents the crystal size, λ is the X-ray wavelength, θ stands for the Bragg diffraction angle, and β is the FWHM of the diffraction peak.
The mean crystal size of the nanoparticles was determined to be approximately 30 nm for Fe3O4 NPs and 70 nm for ε-Fe2O3 NPs. These values were obtained from the FWHM of the (111) diffraction peak for Fe3O4 and the (012) peak for ε-Fe2O3.

4.4. Morphological Characteristics and Elemental Composition

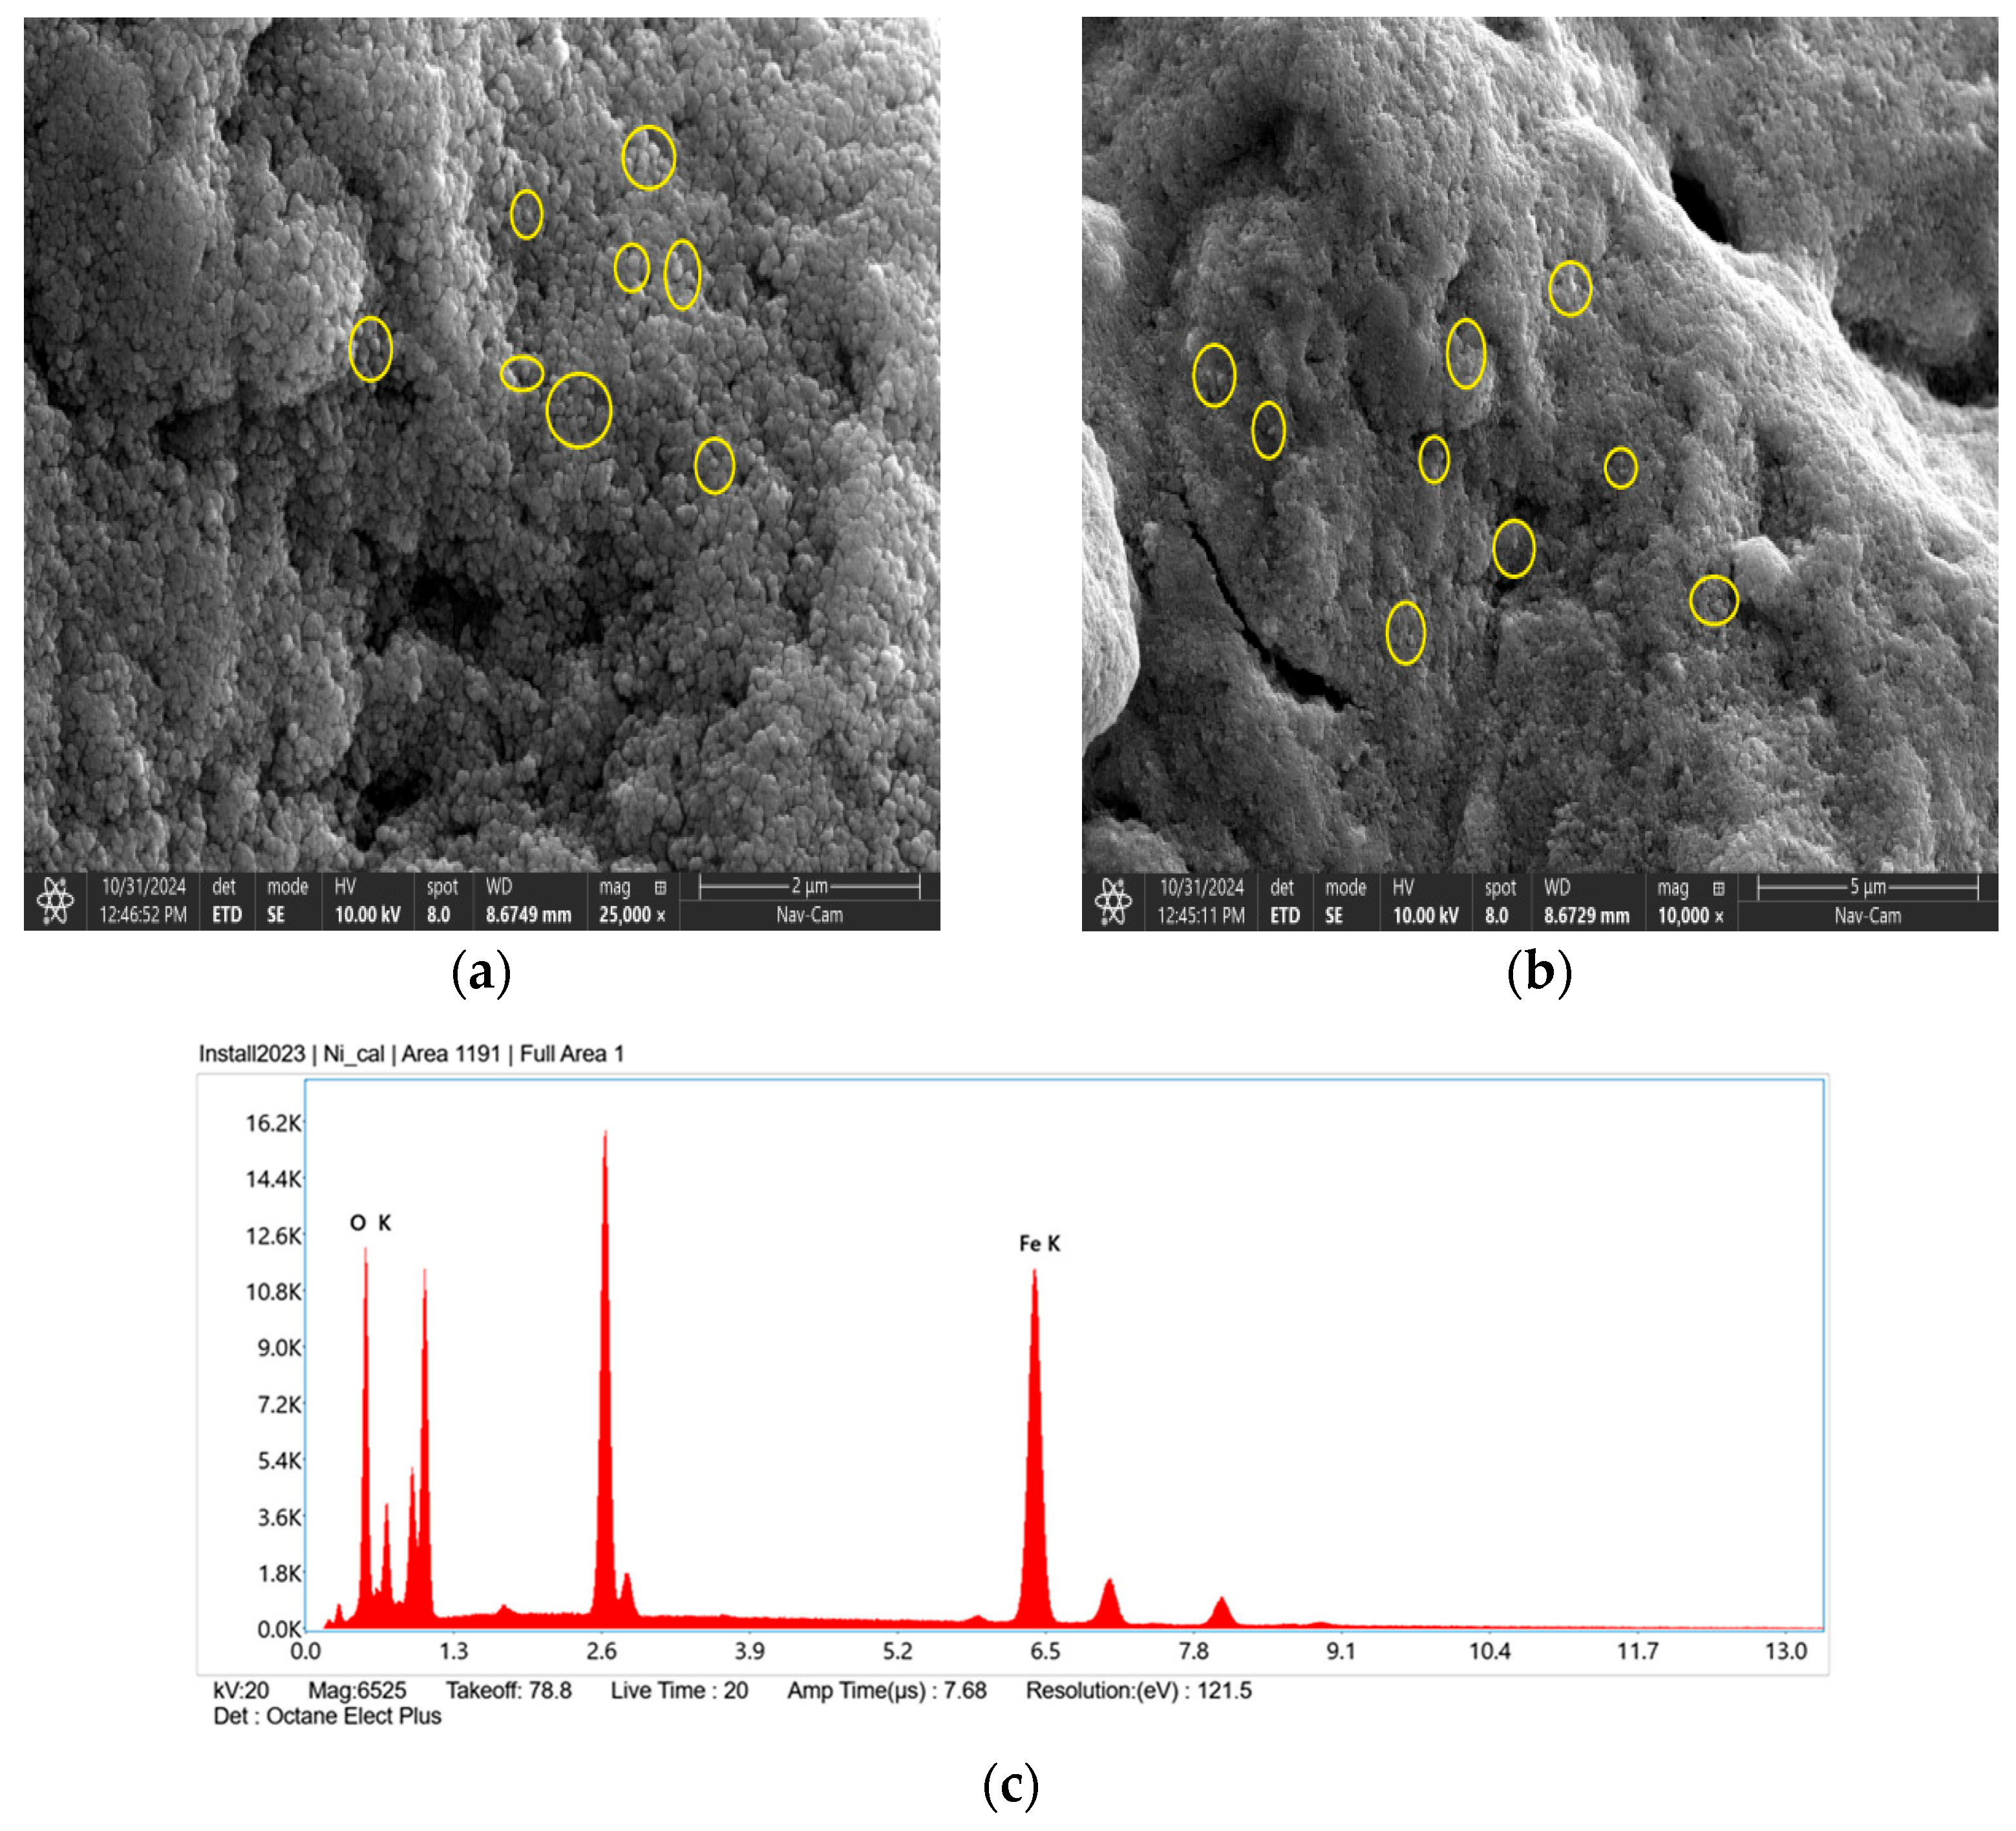
The successful synthesis of Fe3O4 and ε-Fe2O3 NPs was confirmed by SEM images (see Figure 3a–c). The NPs displayed a well-defined crystalline structure, with sizes ranging from 30 to 70 nm. EDX analysis further corroborated these findings, unveiling compositional variations influenced by the synthesis conditions and the specific iron oxide phase. For Fe3O4, oxygen accounted for 26.0 wt% (55.1% atomic concentration), while iron constituted 74.0 wt% (44.9% atomic concentration), confirming the presence of magnetite. In ε-Fe2O3, oxygen was present at 41.8 wt% (71.5% atomic concentration) and iron at 58.2 wt% (28.5% atomic concentration), validating its formation. The presence of additional peaks in the EDX spectrum indicates the incorporation of elements from the apricot kernel shell extract into the NP composition [19] (Figure 4a–c). The yellow circles in Figure 3a,b and Figure 4a,b indicate the regions where nanoparticles have accumulated.

4.5. Thermal Properties

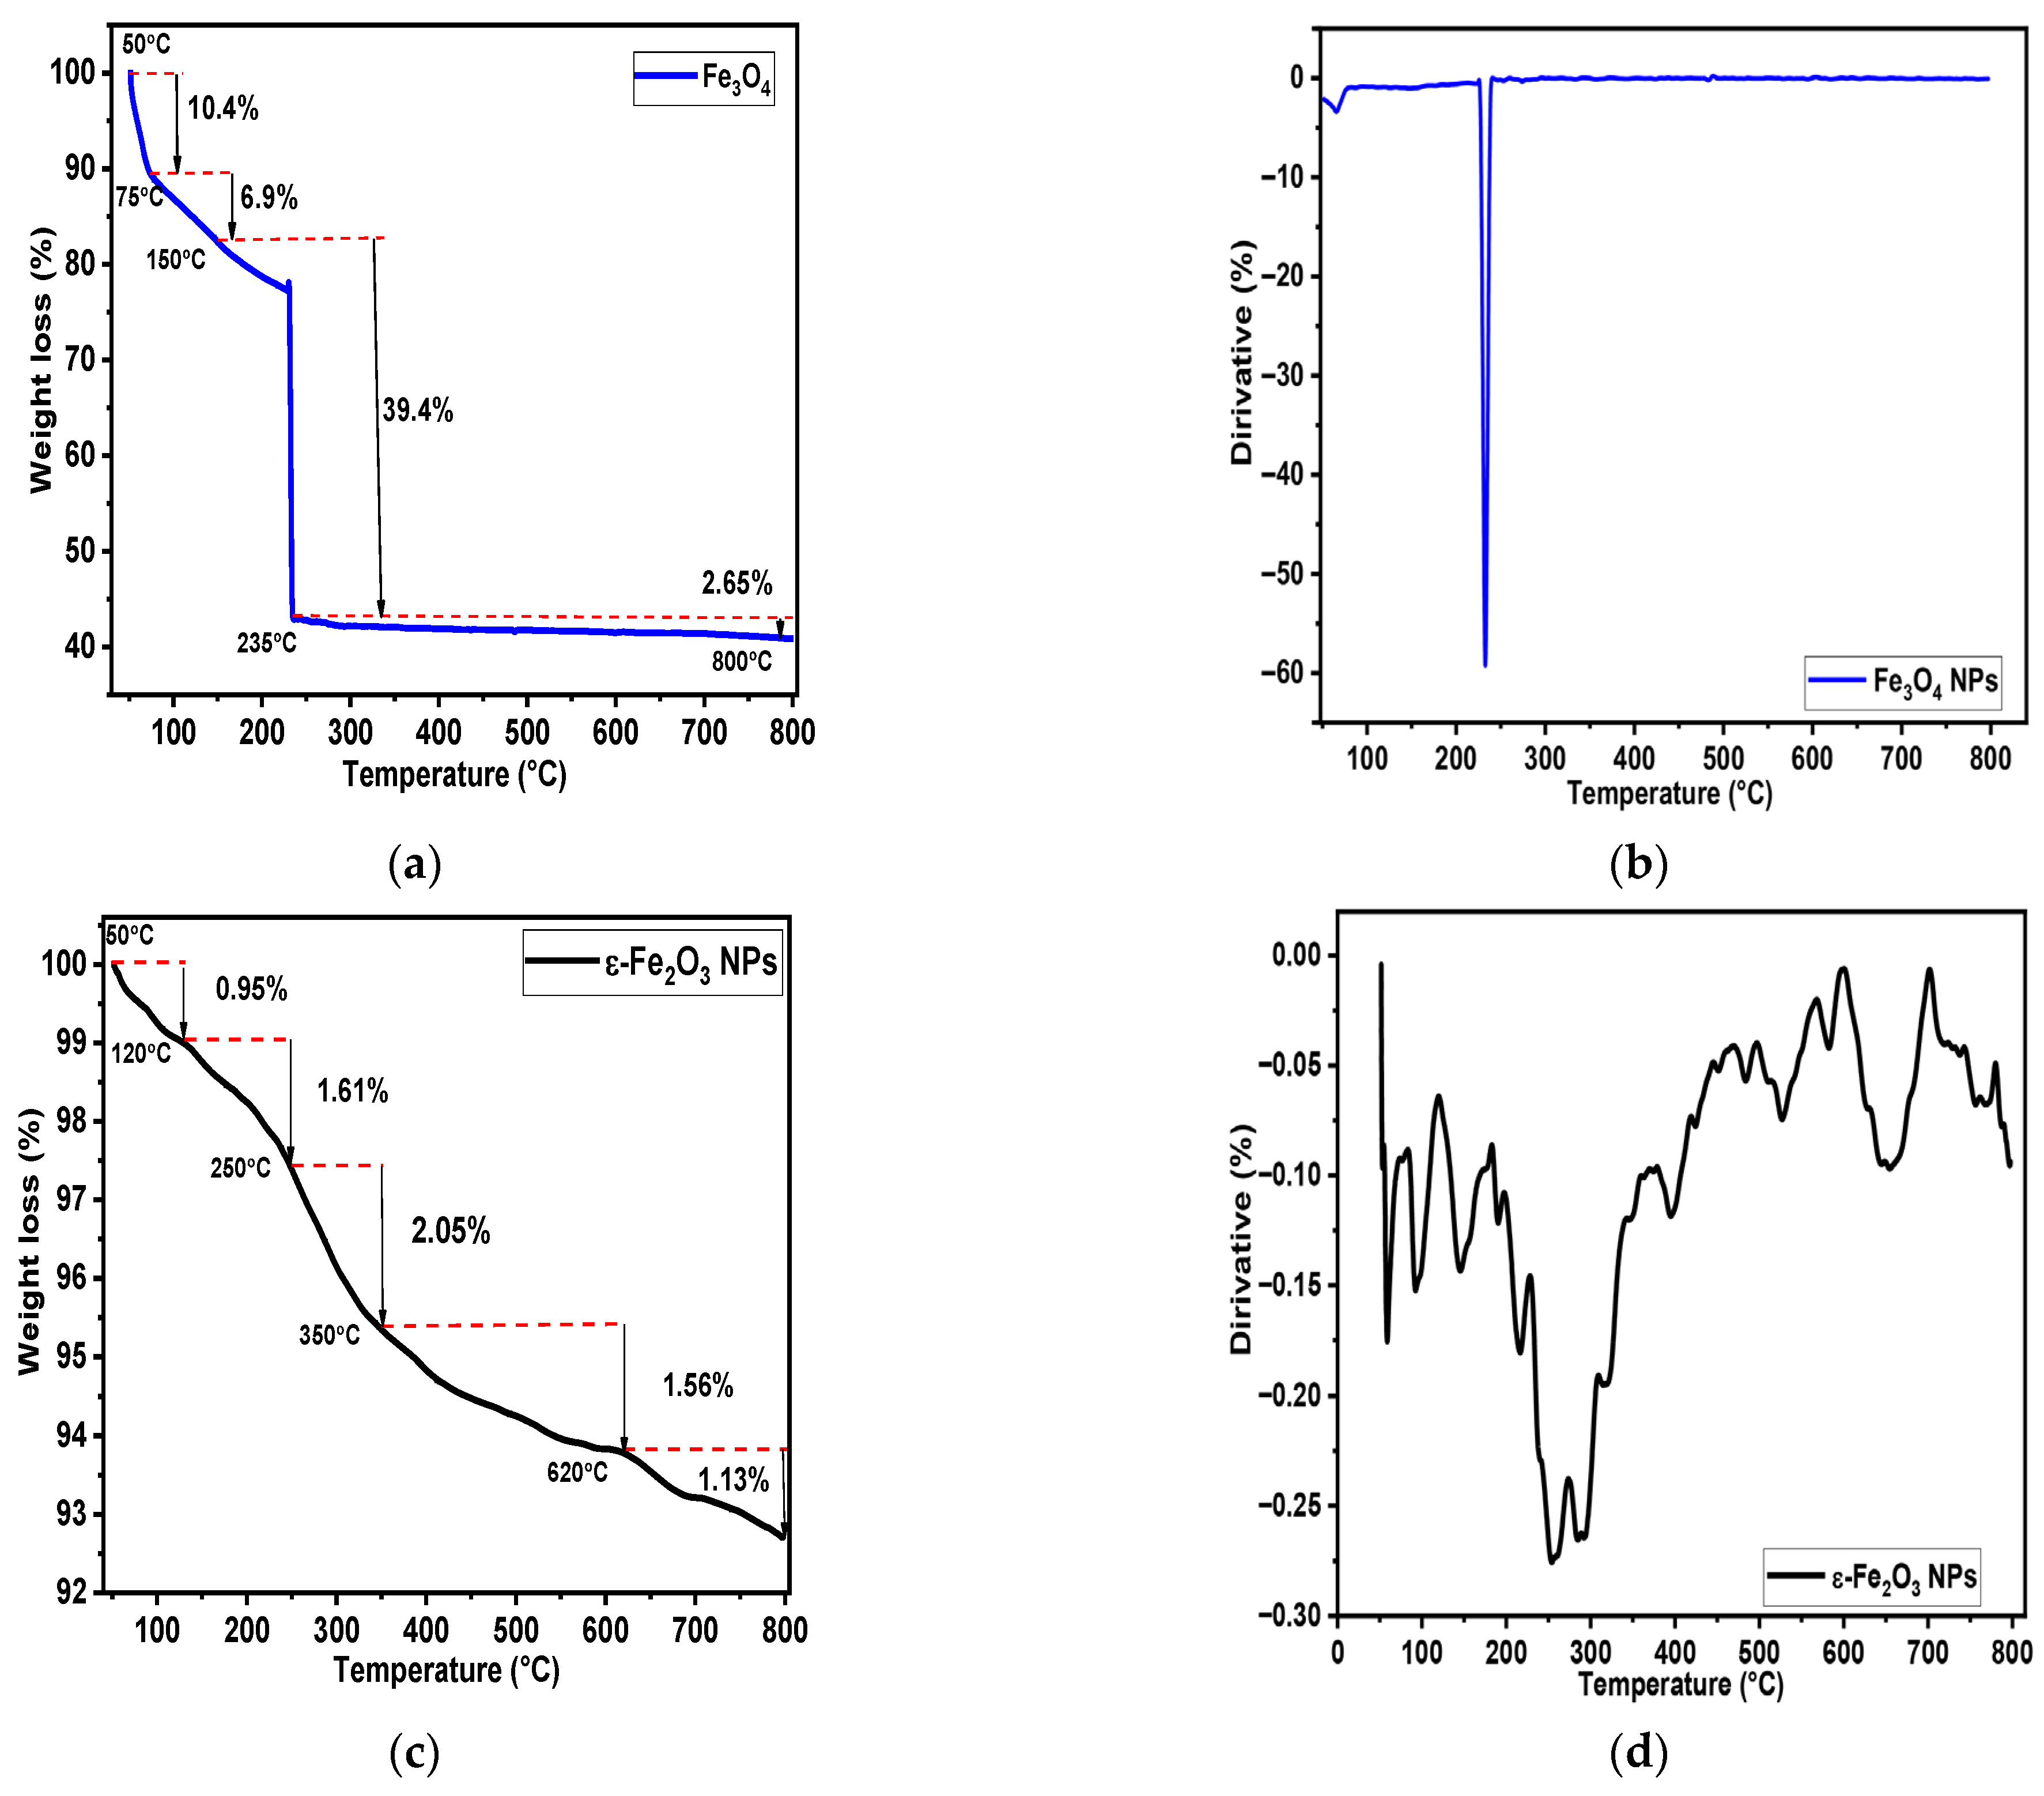
As illustrated in Figure 5a,b, the thermal stability and decomposition profiles of Fe3O4 NPs (a) and ε-Fe2O3 NPs (b) are evident. The Fe3O4 NPs undergo a four-stage decomposition process, resulting in a residual mass of 40.65% at 800 °C. The initial stage demonstrates a 10.4% weight reduction between 50 and 75 °C, subsequently followed by a 6.9% reduction between 75 and 150 °C, which is predominantly ascribed to the evaporation of adsorbed water. A more substantial weight loss of 39.4% occurs between 150 and 235 °C and continues up to 800 °C due to the dehydration and decomposition of organic substances. It has been demonstrated that a 2% increase in weight loss is predominantly associated with the decomposition of organic functional groups (e.g., polyphenols, flavonoids, and proteins) derived from the apricot kernel extract, which are adsorbed or loosely bound to the NP surface.
Conversely, ε-Fe2O3 NPs exhibit superior thermal stability, retaining 92.7% of their original mass at 800 °C through a four-step decomposition process. A minor mass loss of 0.95% was observed between 50 and 120 °C, followed by a 1.61% loss between 120 and 250 °C. This was associated with the removal of adsorbed water and volatile compounds from the apricot bark extract. The third stage, occurring between 250 and 350 °C, results in a 2.05% mass loss due to the progressive degradation of organic material. At temperatures ranging from 350 to 620 °C, an additional loss of 1.56% is observed, which can be attributed to the decomposition of structural organic groups, such as polyphenols, flavonoids, and proteins, that are adsorbed on the NP surfaces.
At temperatures above 620 °C, mass loss is negligible, thereby confirming the exceptional thermal stability of ε-Fe2O3. The findings demonstrate that ε-Fe2O3 NPs exhibit significantly higher thermal stability compared to Fe3O4 NPs. Table 2 shows a summary of the TGA results, comparing the thermal stability and decomposition behavior of ε-Fe2O3 and Fe3O4 nanoparticles.

5. Optical Properties

5.1. Reflectance

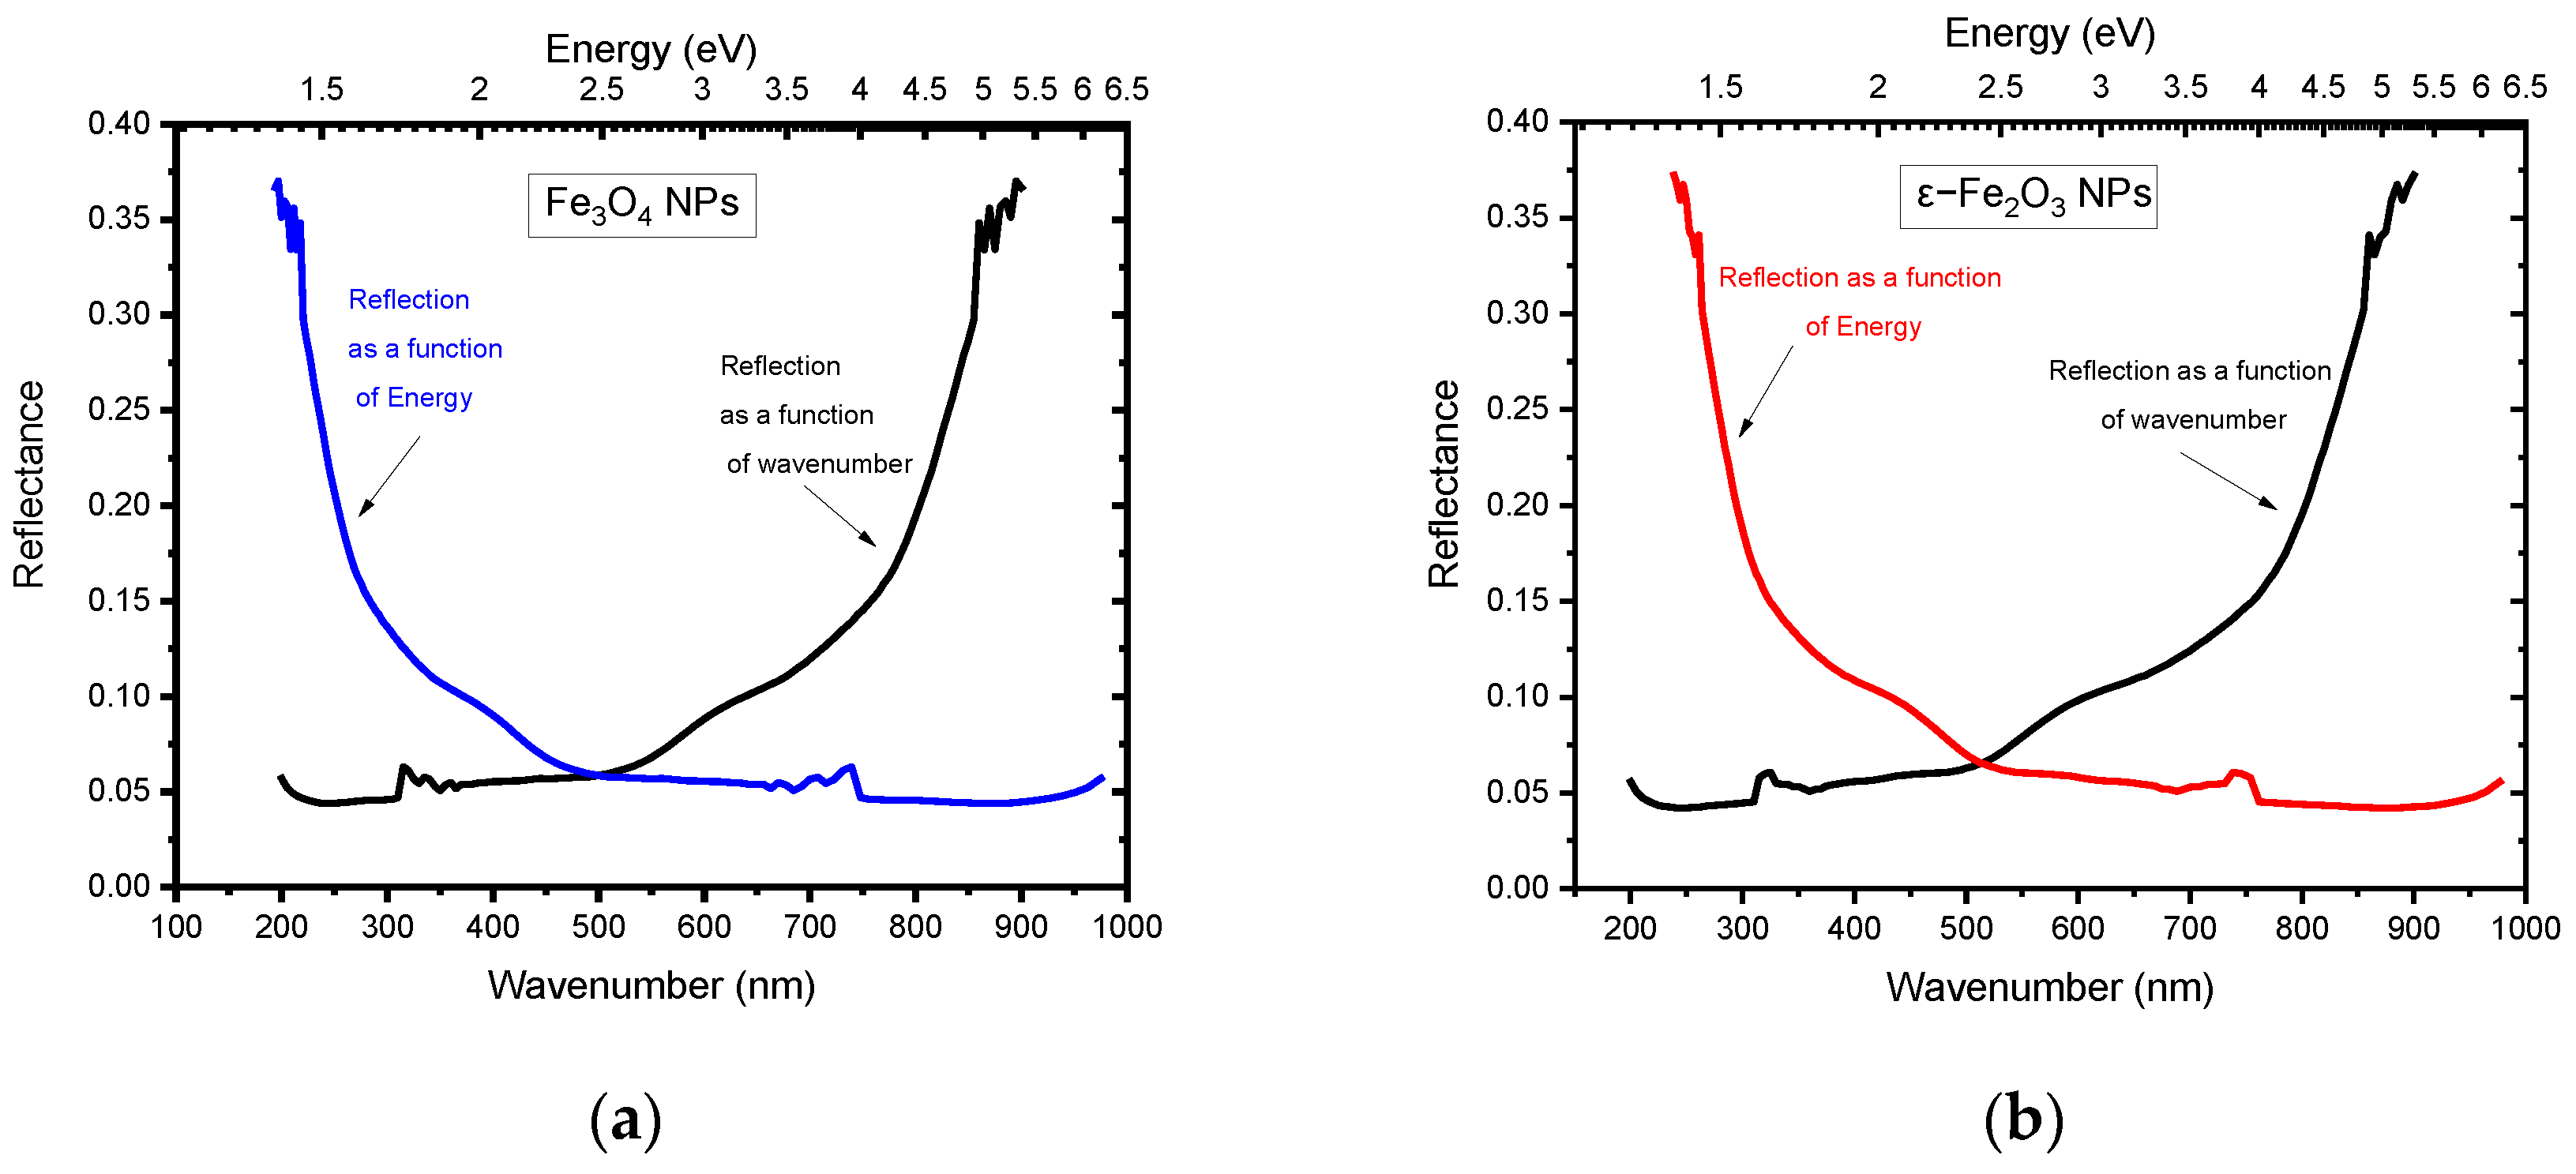
As demonstrated in Figure 6, both Fe3O4 NPs and ε-Fe2O3 NPs demonstrate a consistent reflectance of 0.05 under incident light at wavelengths ranging from 200 nm to 600 nm, followed by an enhancement to 0.37.

5.2. Refractive Index

The refractive index can be determined using the following equation:
n = 1 + R 1 R
where R is the reflectance, defined as the ratio of reflected to incident light intensity (dimensionless, with values between 0 and 1), and n represents the refractive index of the material.
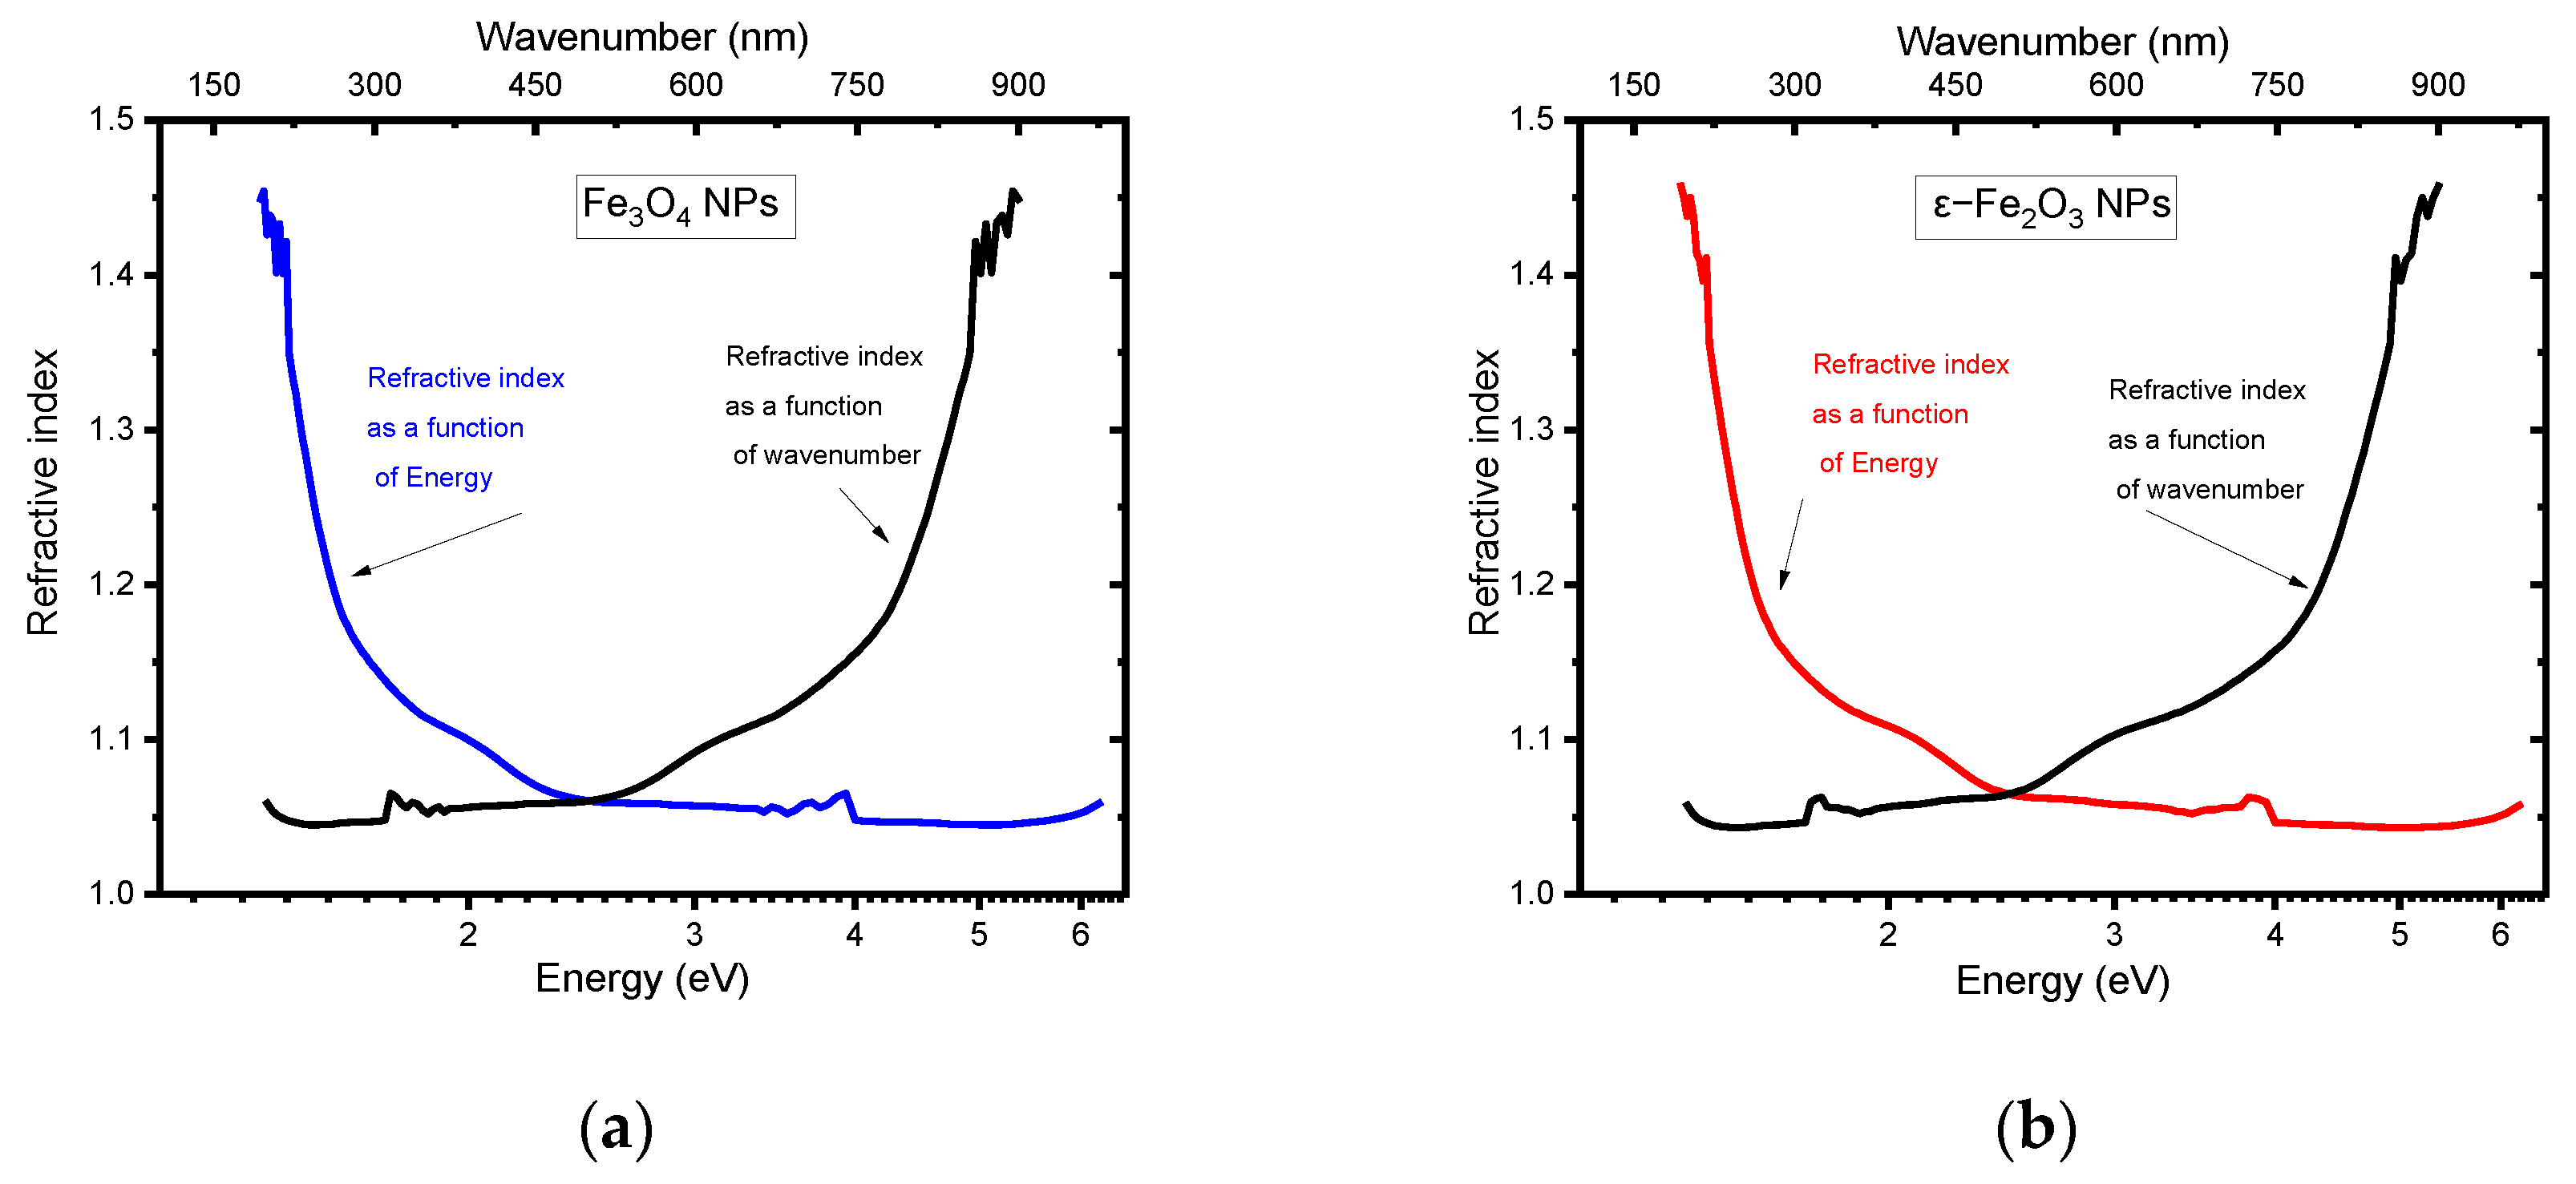
As illustrated in Figure 7, the refractive indices of Fe3O4 and ε-Fe2O3 NPs are presented. A comparable trend is exhibited by both, wherein the refractive index decreases from a maximum value of 1.45 to 1.05 and then stabilizes.

5.3. Band Gap

Electronic transitions are a pivotal factor in the absorption of light and can be described by the Tauc equation as follows [28]:
( α h ϑ ) β = A ( h ϑ E g )
where h ϑ is the energy of the incident photons, α represents the absorption coefficient, A stands for a constant, h is Planck’s constant, and β is a transition-dependent exponent.
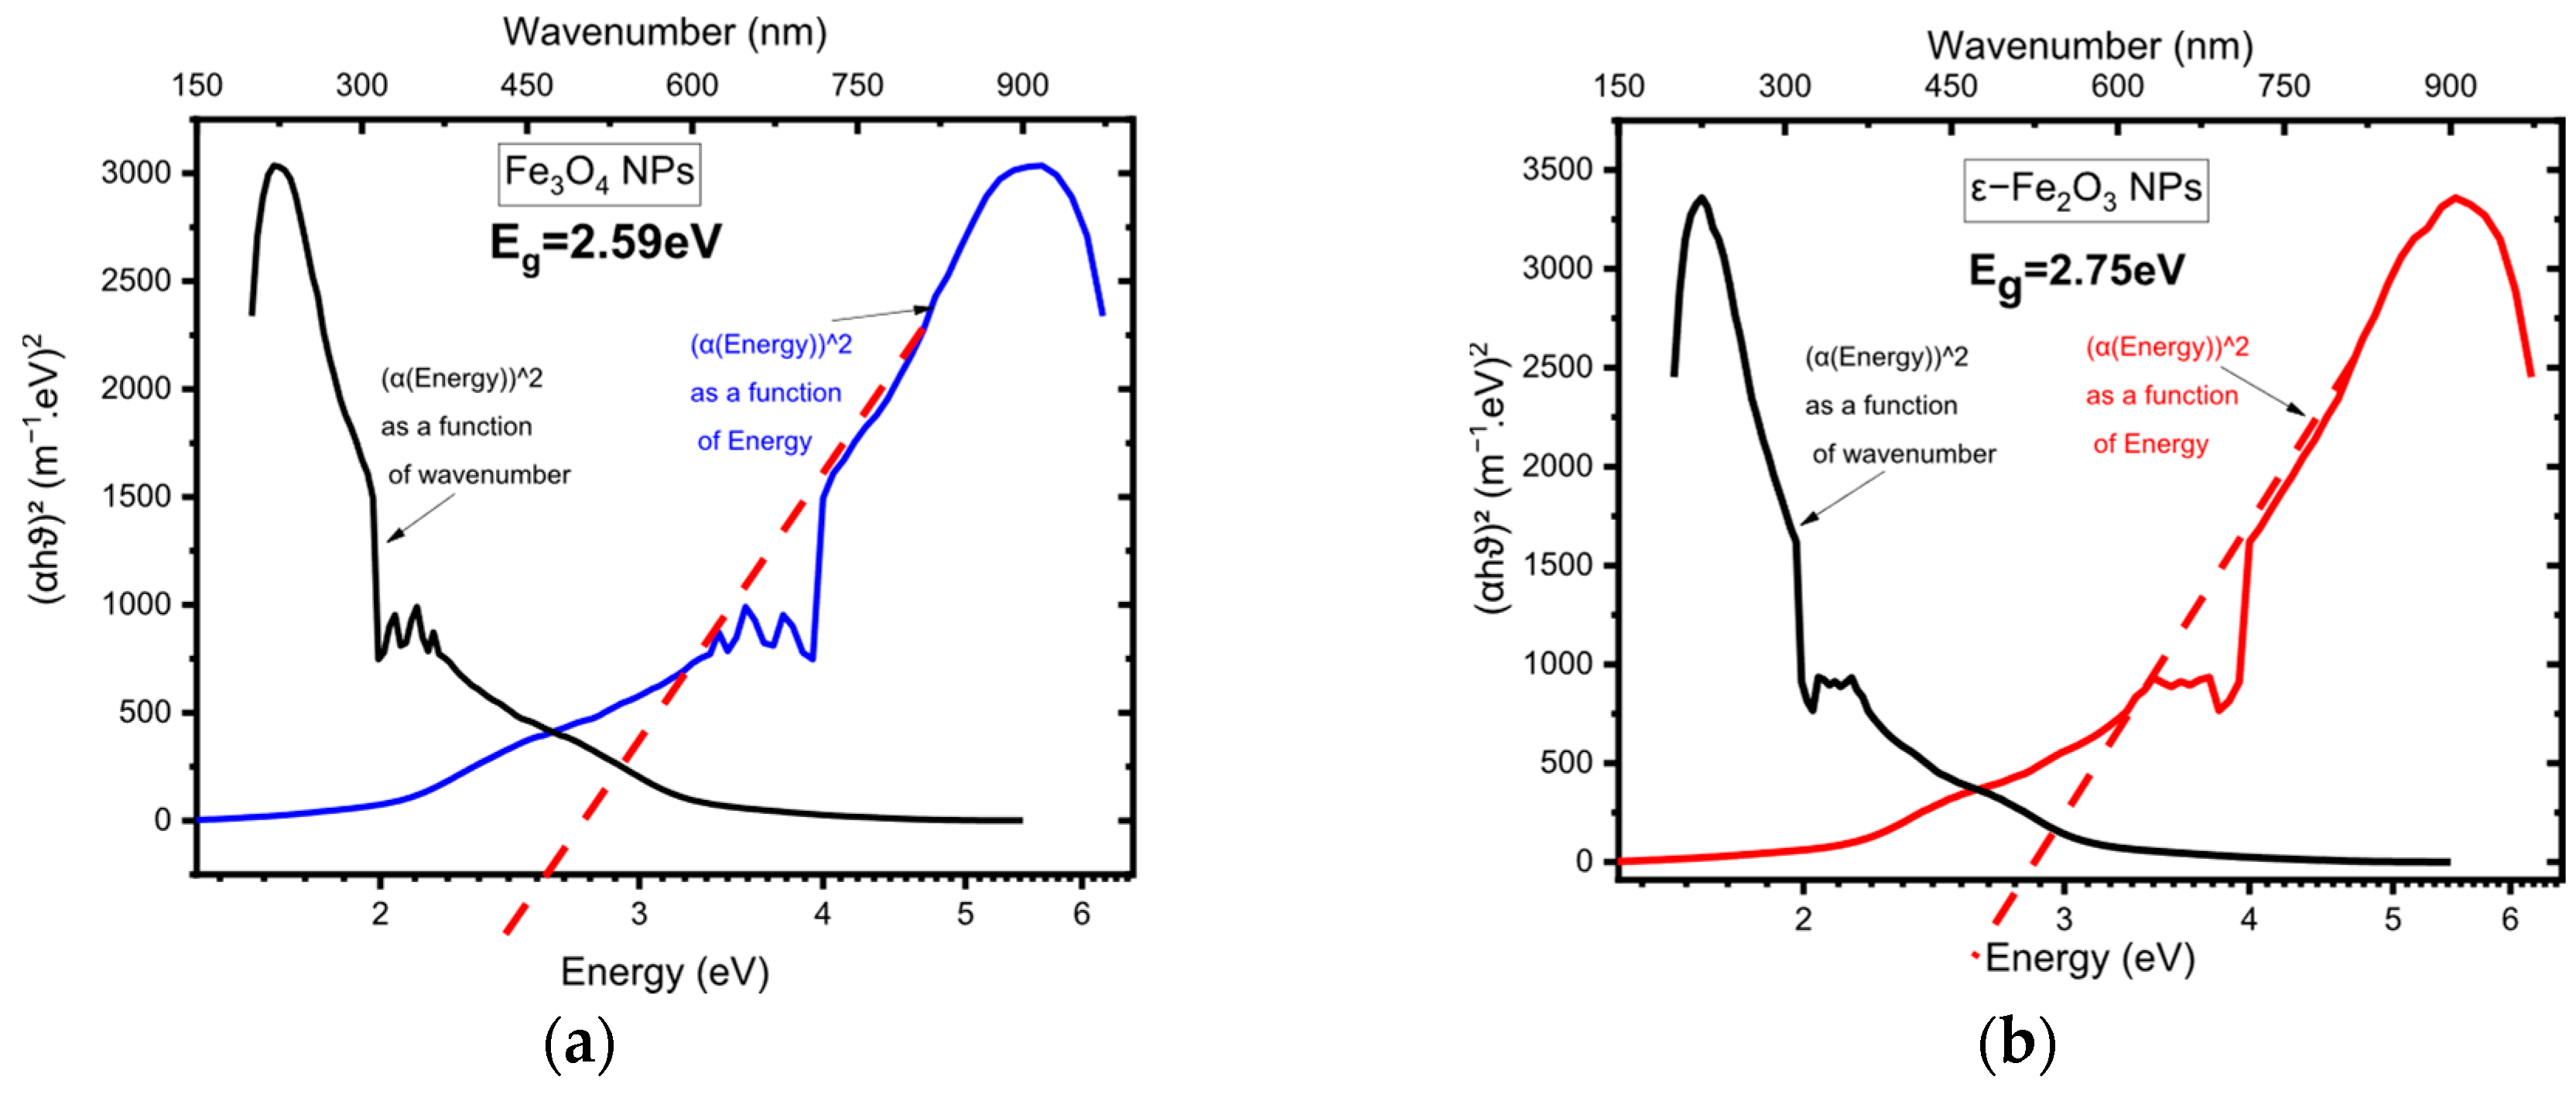
The values of β that are permitted are 1/2 and 2 for direct and indirect transitions, respectively. Meanwhile, the values 3/2 and 3 are forbidden [29]. Preliminary experimental observations suggest that β falls within the range of 0.925 to 1.083, indicating a potential direct electronic transition. The band gap (Eg) is determined from the Tauc plot by extrapolating the linear portion of the ( α h ϑ )2 vs. h ϑ curve to the energy axis. As illustrated in Figure 8, the relationship between ( α h ϑ )2 and photon energy ( h ϑ ) for Fe3O4 NPs and ε-Fe2O3 NPs is evident. The estimated band gap values are 2.59 and 2.75 eV, respectively.

5.4. Optical Conductivity

Optical conductivity ( σ ) is determined using the following relationship [20]:
σ = c n α 4 π
where σ represents optical conductivity, c stands for the speed of light in vacuum, and α is the absorption coefficient.
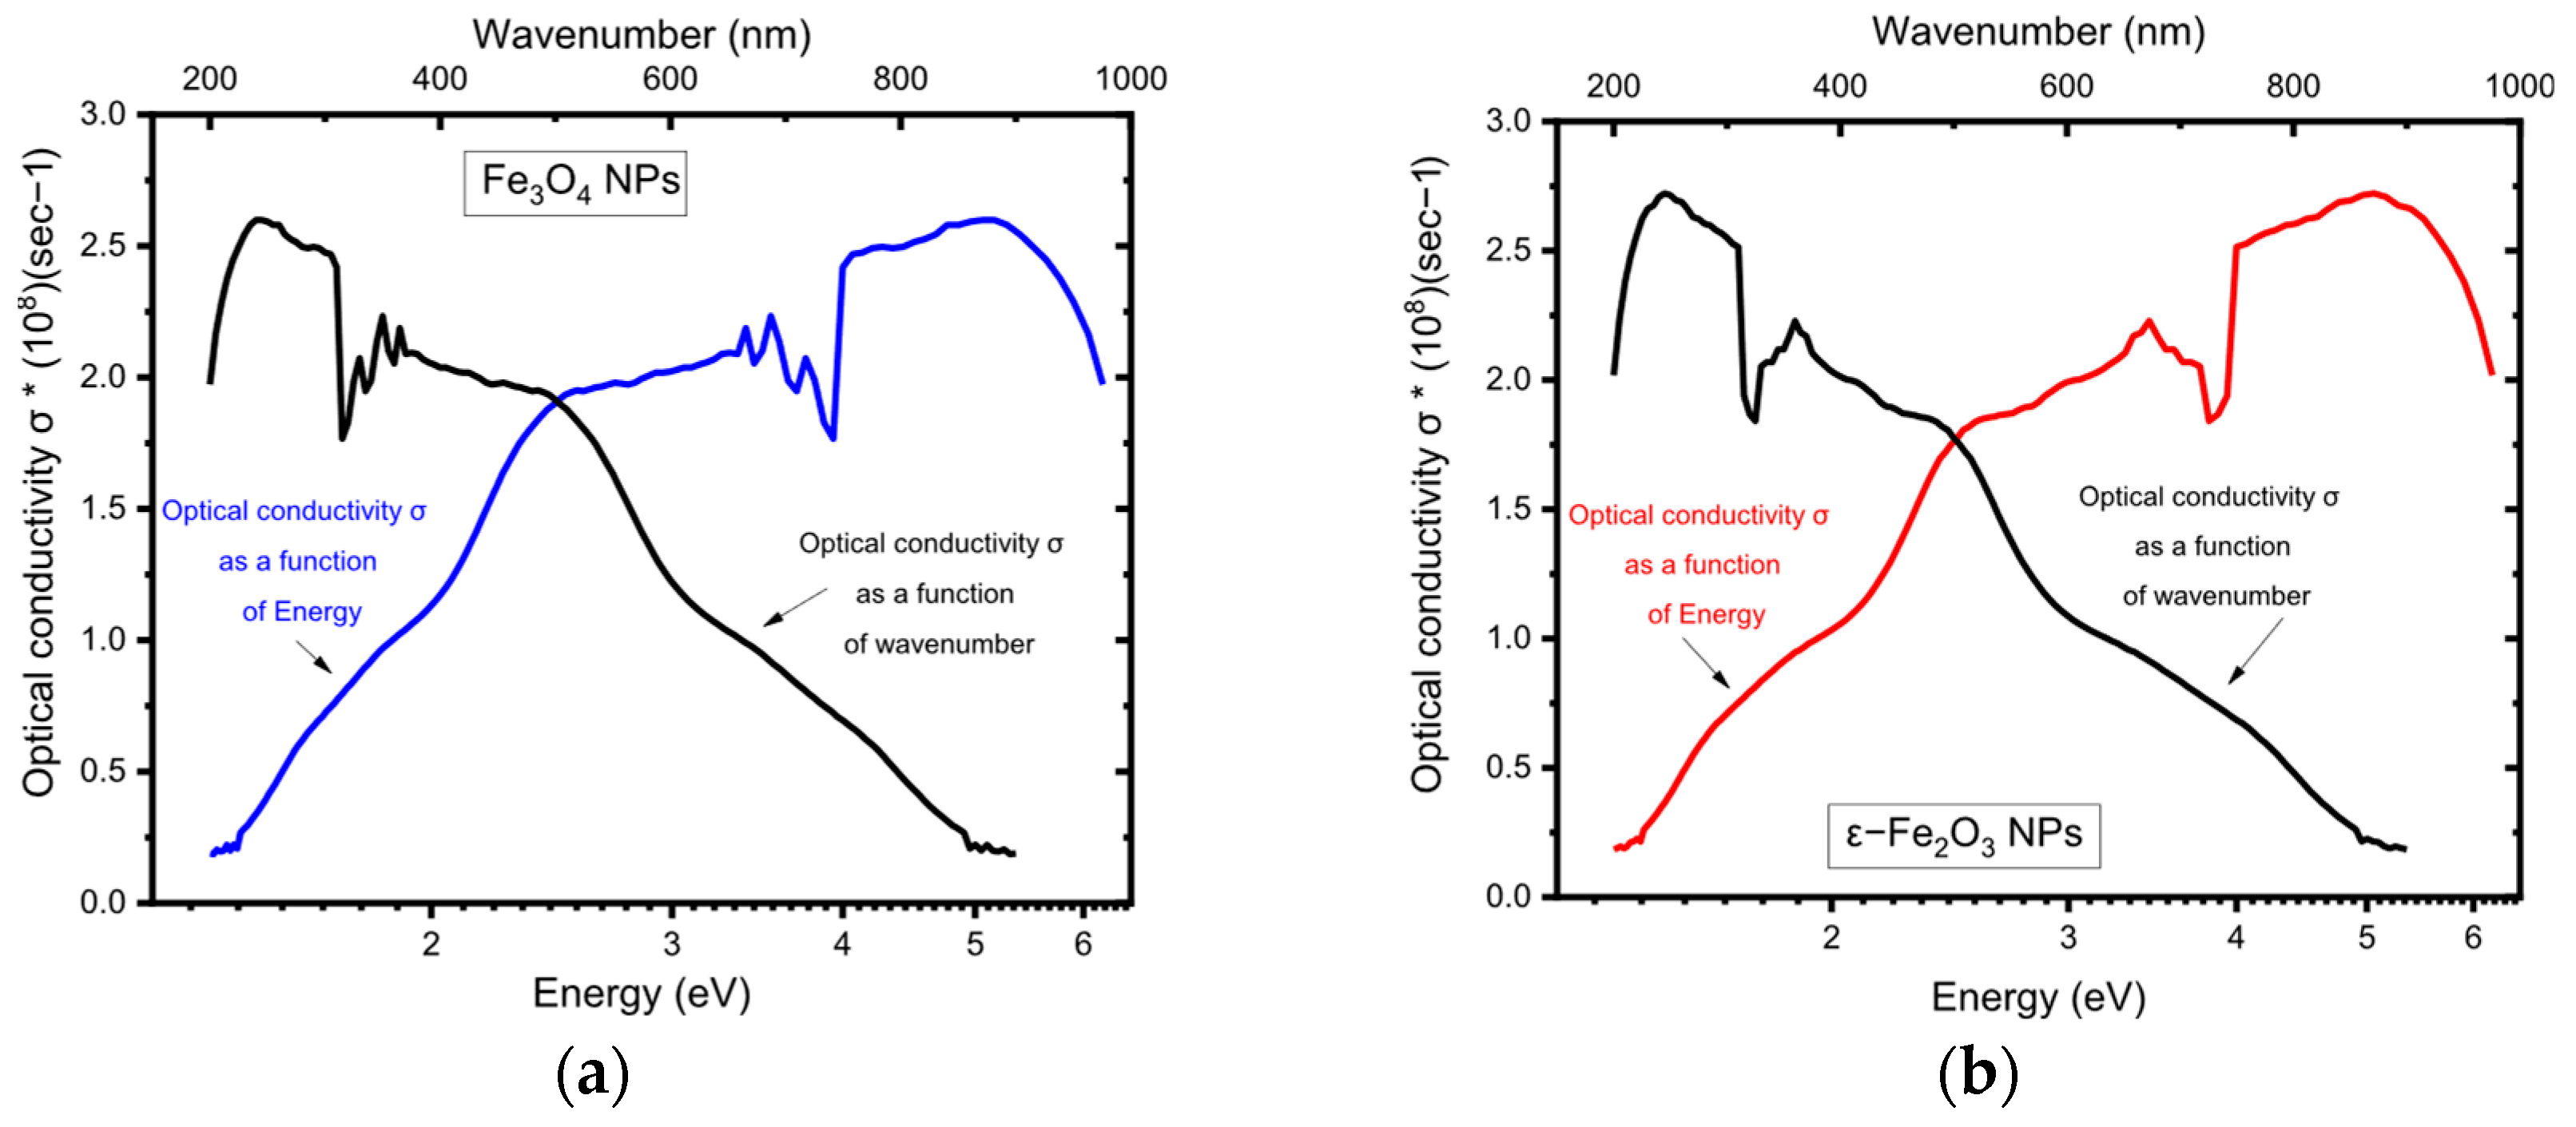
The variation in optical conductivity as a function of photon energy for Fe3O4 NPs and ε-Fe2O3 NPs is demonstrated in Figure 9a and Figure 9b, respectively. The results indicate that for Fe3O4 NPs, optical conductivity increases between 1.37 eV and 6.2 eV, after which it stabilizes. A similar trend is observed in the case of ε-Fe2O3 nanoparticles, with an increase from 1.35 eV to 6.22 eV, followed by a plateau.

5.5. The Extinction Coefficient

The extinction coefficient (k) is calculated using the appropriate equation [20]:
k = α λ 4 π
where k represents the extinction coefficient, α is the absorption coefficient, λ is the wavelength of light, and π is the mathematical constant.
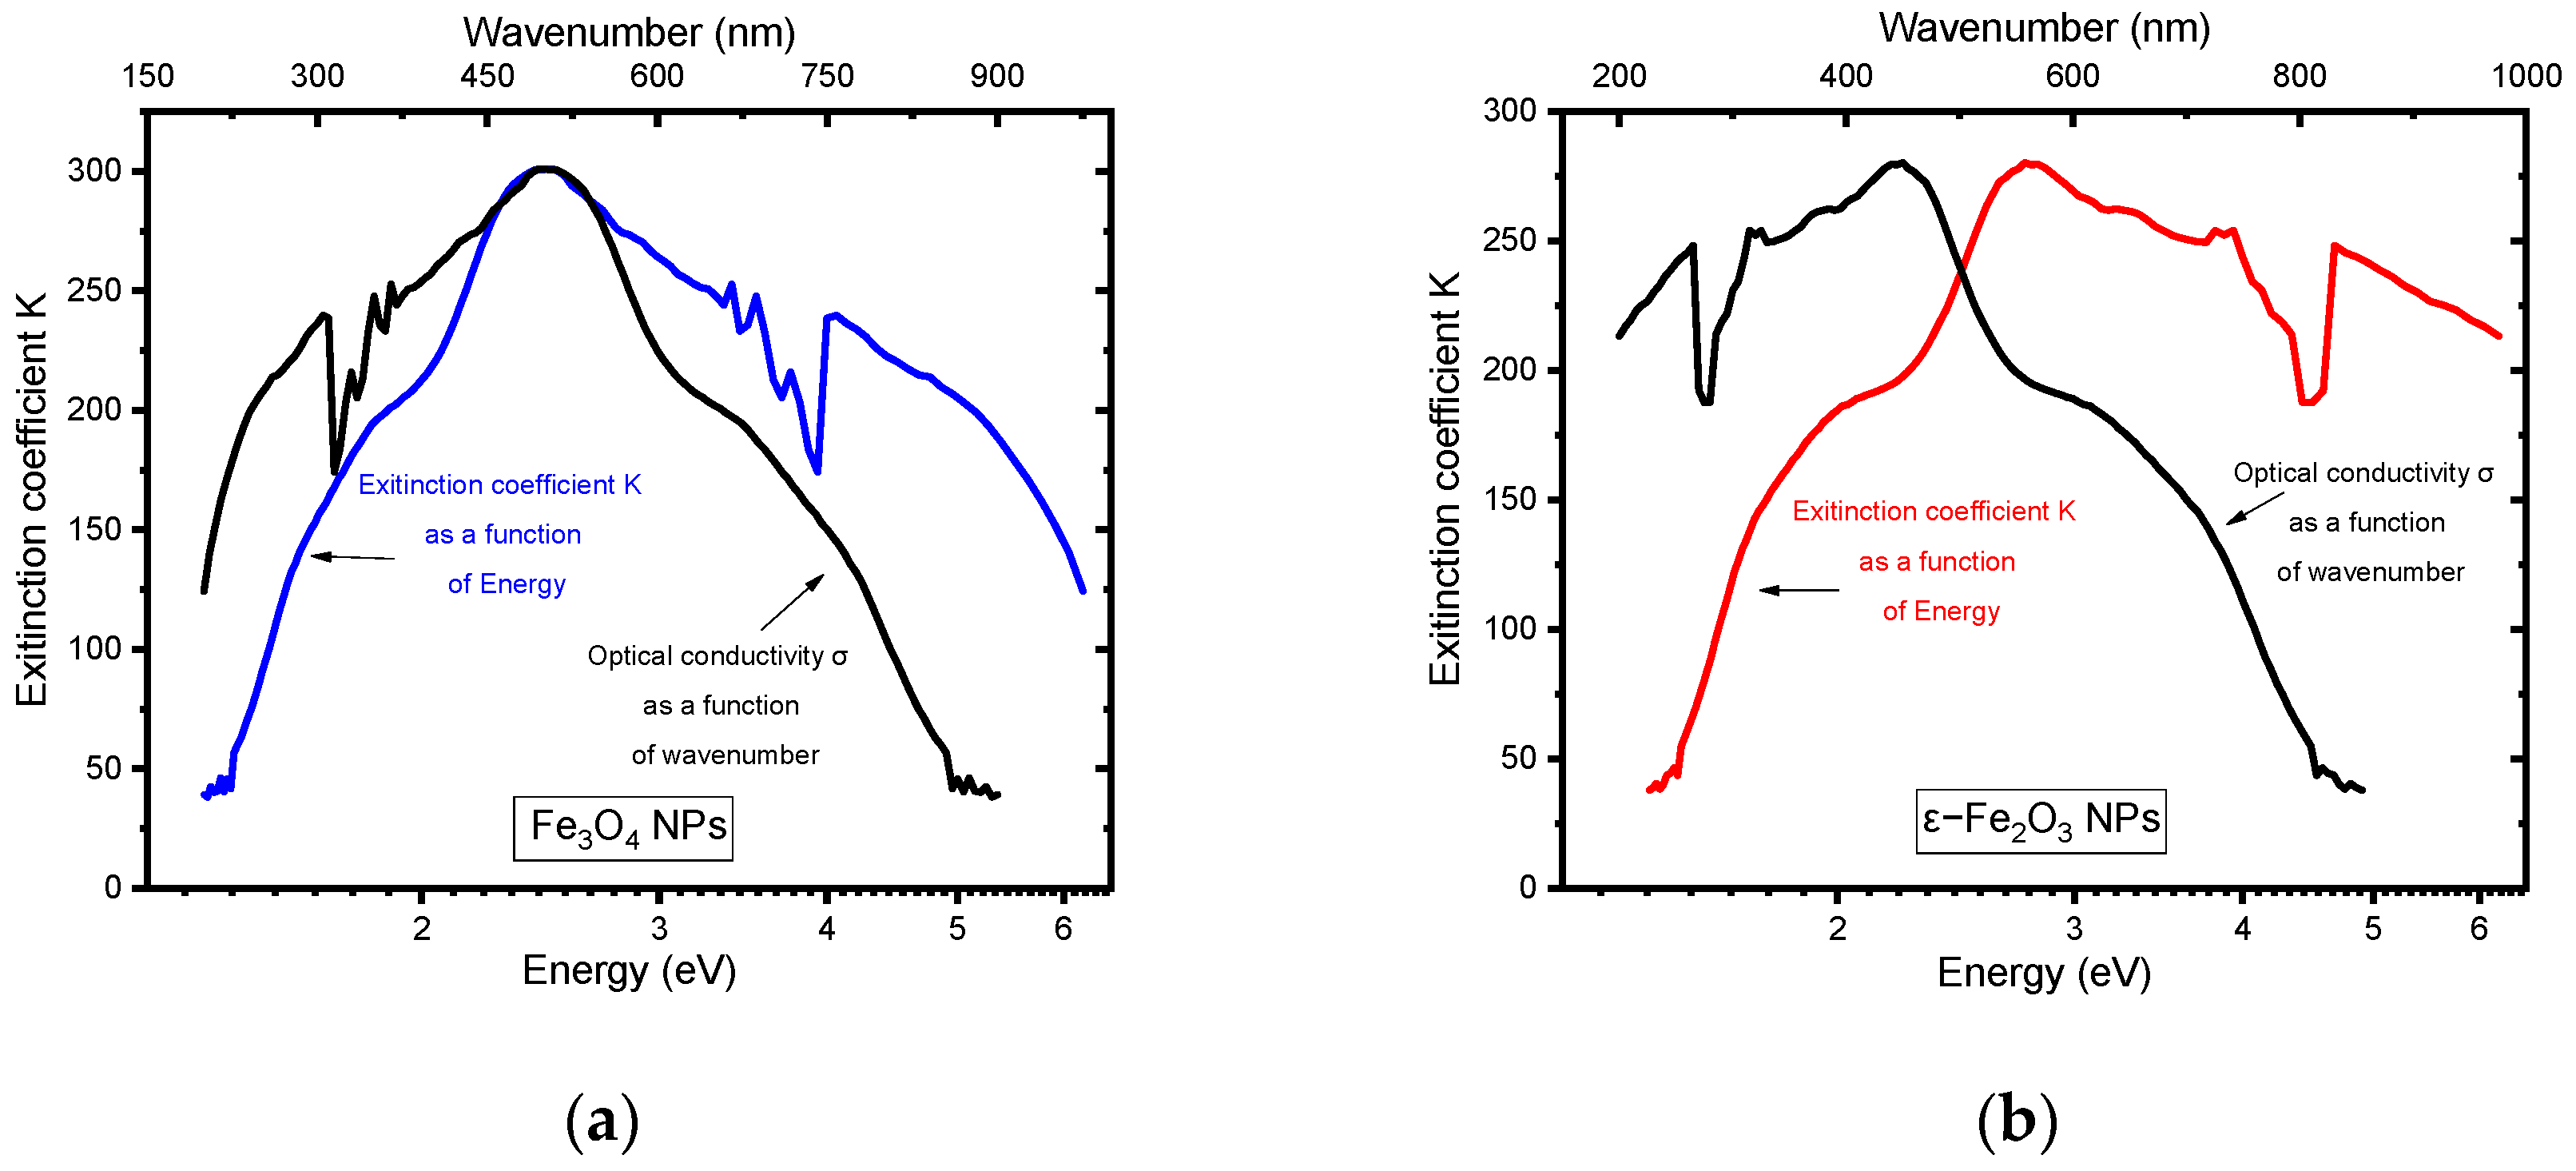
The value of k is contingent upon the wavelength of light. The extinction coefficient for Fe3O4 NPs exhibits a range from a minimum of 39 to a maximum of 300. A similar trend is observed for ε-Fe2O3 NPs, where k varies between 37 and a maximum of 280, as illustrated in Figure 10. A higher k value indicates greater light absorption, rendering these materials suitable for photothermal and sensing applications.
As illustrated in Table 3, a synopsis of the optical properties of ε-Fe2O3 and Fe3O4 nanoparticles is provided, alongside a comparison with values reported in the extant literature. The close agreement between the experimental results and literature data supports the successful synthesis of the nanoparticles.
The material displays a notable variation in reflectance with wavelength, indicative of photonic crystalline behavior, which is advantageous for optical sensors, liquid crystal devices, and photonic applications requiring stable reflection patterns. The low refractive index values of the material indicate high transparency and minimal scattering, both of which are critical properties for the application of optical coatings. The band gap, which was measured to be between 2.50 and 2.75 eV, is indicative of the material’s semiconducting nature, as evidenced by its ability to absorb visible light. This property renders the material suitable for applications such as photocatalysis, photodetection, and sensing. The broad optical conductivity (1.35–6.22 eV) facilitates efficient absorption from near-infrared to ultraviolet, thereby enhancing its potential in optoelectronic and photocatalytic applications. The high k values indicate a high density of electronic states and free carriers, suggesting metallic optical behavior. Collectively, these properties position the material as a promising candidate for photothermal coatings, electromagnetic shielding, and broadband black coatings.

6. Conclusions

The utilization of apricot kernel shell extract (Akse) as a natural reducing agent facilitated the effective synthesis of Fe3O4 NPs and ε-Fe2O3 NPs, employing FeCl3 4H2O and FeCl2 6H2O. This environmentally friendly synthesis was carried out at 80 °C and resulted in the formation of NPs with particle sizes ranging from 30 to 70 nm. The confirmation of Fe3O4 NPs and ε-Fe2O3 NPs was conducted through FTIR spectroscopy, XRD SEM, and X-ray EDX analysis. The evaluation of their thermal stability was performed using TGA and DTG. The optical properties of the synthesized NPs were investigated, and the band gap energy was estimated using the Kubelka−Munk formula. The results demonstrated a band gap of Eg (Fe3O4 NPs) = 2.59 eV and Eg (ε-Fe2O3 NPs) = 2.75 eV, thereby confirming their semiconductor behavior. The photoconductivity of Fe3O4 NPs and ε-Fe2O3 NPs was subsequently analyzed as a function of photon energy. For Fe3O4 NPs, the photoconductivity exhibited an increase between 1.37 eV and 6.2 eV, subsequently reaching a state of stability. A comparable trend was observed in ε-Fe2O3 NPs, demonstrating an increase from 1.35 eV to 6.22 eV, followed by a period of stabilization. Furthermore, k was determined; for Fe3O4 NPs, k varied from 39 to a maximum of 300, while for ε-Fe2O3 NPs, it varied from 37 to a maximum of 280. A higher k value indicates a high level of light absorption, which renders these Fe3O4 NPs and ε-Fe2O3 NPs highly suitable for photothermal and sensor applications.

Author Contributions

Conceptualization, T.S., Y.D. and L.S.; methodology, T.B.K., L.S. and U.M.; validation, Y.D., U.M., L.S. and T.S.; formal analysis, T.B.K. and L.S.; investigation, Y.D., L.S. and U.M.; data curation, T.B.K. and L.S.; writing—original draft preparation, T.B.K., L.S. and Y.D.; writing—review and editing, T.S., Y.D. and U.M.; visualization, Y.D. and L.S.; supervision, L.S. and Y.D. All authors have read and agreed to the published version of the manuscript.

Funding

This research received no external funding.

Data Availability Statement

Data are contained within the article.

Acknowledgments

The authors gratefully acknowledge the support of the Algerian Ministry of Higher Education and Scientific Research (MESRS), the General Directorate of Scientific Research and Technological Development (DGRSDT) of Algeria, and the University of Djelfa, Algeria.

Conflicts of Interest

The authors declare no conflicts of interest.

Abbreviations

The following abbreviations are used in this manuscript:
Fe3O4 NPsIron oxide nanoparticles
ε-Fe2O3 NPsIron oxide nanoparticles
AkseApricot kernel shell extract

References

  1. Indrayana, I.; Tuny, M.; Putra, R.; Istiqomah, N.; Suharyadi, E. Optical Properties of Fe3O4/Chitosan and Its Applications for Signal Amplifier in Surface Plasmon Resonance Sensor. In Proceedings of the 2nd International Conference on Science, Technology, and Modern Society (ICSTMS 2020), Langsa, Indonesia, 25–26 November 2021; Atlantis Press: Dordrecht, The Netherlands; pp. 424–429. [Google Scholar]
  2. Zheng, Y.-H.; Cheng, Y.; Bao, F.; Wang, Y.-S. Synthesis and magnetic properties of Fe3O4 nanoparticles. Mater. Res. Bull. 2006, 41, 525–529. [Google Scholar] [CrossRef]
  3. Kind, H.; Yan, H.; Messer, B.; Law, M.; Yang, P. Nanowire ultraviolet photodetectors and optical switches. Adv. Mater. 2002, 14, 158–160. [Google Scholar] [CrossRef]
  4. Wu, W.; Wu, Z.; Yu, T.; Jiang, C.; Kim, W.-S. Recent progress on magnetic iron oxide nanoparticles: Synthesis, surface functional strategies and biomedical applications. Sci. Technol. Adv. Mater. 2015, 16, 023501. [Google Scholar] [CrossRef]
  5. Ali, A.; Zafar, H.; Zia, M.; Ul Haq, I.; Phull, A.R.; Ali, J.S.; Hussain, A. Synthesis, characterization, applications, and challenges of iron oxide nanoparticles. Nanotechnol. Sci. Appl. 2016, 9, 49–67. [Google Scholar] [CrossRef]
  6. Kumar, S.; Thakur, A.; Gupta, S.K.; Rajput, P.; Singh, A. A facile route to synthesis of ferromagnetic and antiferromagnetic phases of iron oxide nanoparticles by controlled heat treatment of ferritin. J. Supercond. Novel Magn. 2020, 33, 3841–3852. [Google Scholar] [CrossRef]
  7. Tong, S.; Quinto, C.A.; Zhang, L.; Mohindra, P.; Bao, G. Size-dependent heating of magnetic iron oxide nanoparticles. ACS Nano 2017, 11, 6808–6816. [Google Scholar] [CrossRef]
  8. Sirivat, A.; Paradee, N. Facile synthesis of gelatin-coated Fe3O4 nanoparticles: Effect of pH in single-step co-precipitation for cancer drug loading. Mater. Des. 2019, 181, 107942. [Google Scholar] [CrossRef]
  9. Tipsawat, P.; Wongpratat, U.; Phumying, S.; Chanlek, N.; Chokprasombat, K.; Maensiri, S. Magnetite (Fe3O4) nanoparticles: Synthesis, characterization and electrochemical properties. Appl. Surf. Sci. 2018, 446, 287–292. [Google Scholar] [CrossRef]
  10. Oktivina, M.; Nurrohman, D.; Rinto, A.; Suharyadi, E.; Abraha, K. Effect of Fe3O4 magnetic nanoparticle concentration on the signal of surface plasmon resonance (SPR) spectroscopy. IOP Conf. Ser. Mater. Sci. Eng. 2017, 202, 012032. [Google Scholar] [CrossRef]
  11. Thu, N.T.A.; Duc, H.V.; Hai Phong, N.; Cuong, N.D.; Hoan, N.T.V.; Quang Khieu, D. Electrochemical determination of paracetamol using Fe3O4/reduced graphene-oxide-based electrode. J. Nanomater. 2018, 2018, 7619419. [Google Scholar] [CrossRef]
  12. Kumar, S.; Kumar, M.; Singh, A. Synthesis and characterization of iron oxide nanoparticles (Fe2O3, Fe3O4): A brief review. Contemp. Phys. 2021, 62, 144–164. [Google Scholar] [CrossRef]
  13. Liu, B.; Wang, D.; Huang, W.; Yao, A.; Kamitakahara, M.; Ioku, K. Preparation of magnetite nanoparticles coated with silica via a sol-gel approach. J. Ceram. Soc. Jpn. 2007, 115, 877–881. [Google Scholar] [CrossRef]
  14. Xu, H.; Cui, L.; Tong, N.; Gu, H. Development of high magnetization Fe3O4/polystyrene/silica nanospheres via combined miniemulsion/emulsion polymerization. J. Am. Chem. Soc. 2006, 128, 15582–15583. [Google Scholar] [CrossRef] [PubMed]
  15. Dang, F.; Kamada, K.; Enomoto, N.; Hojo, J.; Enpuku, K. Sonochemical synthesis of the magnetite nanoparticles in aqueous solution. J. Ceram. Soc. Jpn. 2007, 115, 867–872. [Google Scholar] [CrossRef]
  16. Suh, W.H.; Suslick, K.S. Magnetic and porous nanospheres from ultrasonic spray pyrolysis. J. Am. Chem. Soc. 2005, 127, 12007–12010. [Google Scholar] [CrossRef] [PubMed]
  17. Li, S.-Z.; Hong, Y.C.; Uhm, H.S.; Li, Z.K. Synthesis of nanocrystalline iron oxide particles by microwave plasma jet at atmospheric pressure. Jpn. J. Appl. Phys. 2004, 43, 7714. [Google Scholar] [CrossRef]
  18. Grabis, J.; Heidemane, G.; Rašmane, D. Preparation of Fe3O4 and γ-Fe2O3 nanoparticles by liquid and gas phase processes. Mater. Sci. 2008, 14, 292–295. [Google Scholar]
  19. Mohammed, A.M.; Saud, W.; Ali, M. Green synthesis of Fe2O3 nanoparticles using Olea europaea leaf extract and their antibacterial activity. Dig. J. Nanomater. Biostruct 2020, 15, 175–183. [Google Scholar] [CrossRef]
  20. Abd, A.N.; Latif, D.M.; Wasna’a, M.A. Synthesis and some physical properties of magnetite (Fe3O4) NPs. Synthesis 2016, 2, 341–345. [Google Scholar]
  21. Corbett, D.B.; Kohan, N.; Machado, G.; Jing, C.; Nagardeolekar, A.; Bujanovic, B.M. Chemical composition of apricot pit shells and effect of hot-water extraction. Energies 2015, 8, 9640–9654. [Google Scholar] [CrossRef]
  22. Amidon, T.E.; Bujanovic, B.; Liu, S.; Howard, J.R. Commercializing biorefinery technology: A case for the multi-product pathway to a viable biorefinery. Forests 2011, 2, 929–947. [Google Scholar] [CrossRef]
  23. Lin, H. The Role of Green Chemistry in Biomass Processing and Conversion; Xie, H., Gathergood, N., Eds.; Wiley Online Library: Hoboken, NJ, USA, 2013. [Google Scholar]
  24. Gong, C.; Bujanović, B.M. Impact of hot-water extraction on acetone–water oxygen delignification of Paulownia spp. and lignin recovery. Energies 2014, 7, 857–873. [Google Scholar] [CrossRef]
  25. Farahmandjou, M.; Soflaee, F. Synthesis and characterization of α-Fe2O3 nanoparticles by simple co-precipitation method. Phys. Chem. Res. 2015, 3, 191–196. [Google Scholar]
  26. Bertolucci, E.; Galletti, A.M.R.; Antonetti, C.; Marracci, M.; Tellini, B.; Piccinelli, F.; Visone, C. Chemical and magnetic properties characterization of magnetic nanoparticles. In Proceedings of the 2015 IEEE International Instrumentation and Measurement Technology Conference (I2MTC) Proceedings, Pisa, Italy, 11–14 May 2015; pp. 1492–1496. [Google Scholar]
  27. Manikandan, A.; Vijaya, J.J.; Mary, J.A.; Kennedy, L.J.; Dinesh, A. Structural, optical and magnetic properties of Fe3O4 nanoparticles prepared by a facile microwave combustion method. J. Ind. Eng. Chem. 2014, 20, 2077–2085. [Google Scholar] [CrossRef]
  28. Horia, F.; Easawi, K.; Khalil, R.; Abdallah, S.; El-Mansy, M.; Negm, S. Optical and thermophysical characterization of Fe3O4 nanoparticles. IOP Conf. Ser. Mater. Sci. Eng. 2020, 956, 012016. [Google Scholar] [CrossRef]
  29. Pandey, B.K.; Shahi, A.K.; Shah, J.; Kotnala, R.K.; Gopal, R. Optical and magnetic properties of Fe2O3 nanoparticles synthesized by laser ablation/fragmentation technique in different liquid media. Appl. Surf. Sci. 2014, 2, 462–471. [Google Scholar] [CrossRef]
  30. Radoń, A.; Drygała, A.; Hawełek, Ł.; Łukowiec, D. Structure and optical properties of Fe3O4 nanoparticles synthesized by co-precipitation method with different organic modifiers. Mater. Charact. 2017, 131, 148–156. [Google Scholar] [CrossRef]
  31. Tsedenbal, B.; Hussain, I.; Anwar, M.S.; Koo, B.H. Morphological, magnetic and optical properties of α-Fe2O3 nanoflowers. J. Nanosci. Nanotechnol. 2018, 18, 6127–6132. [Google Scholar] [CrossRef]
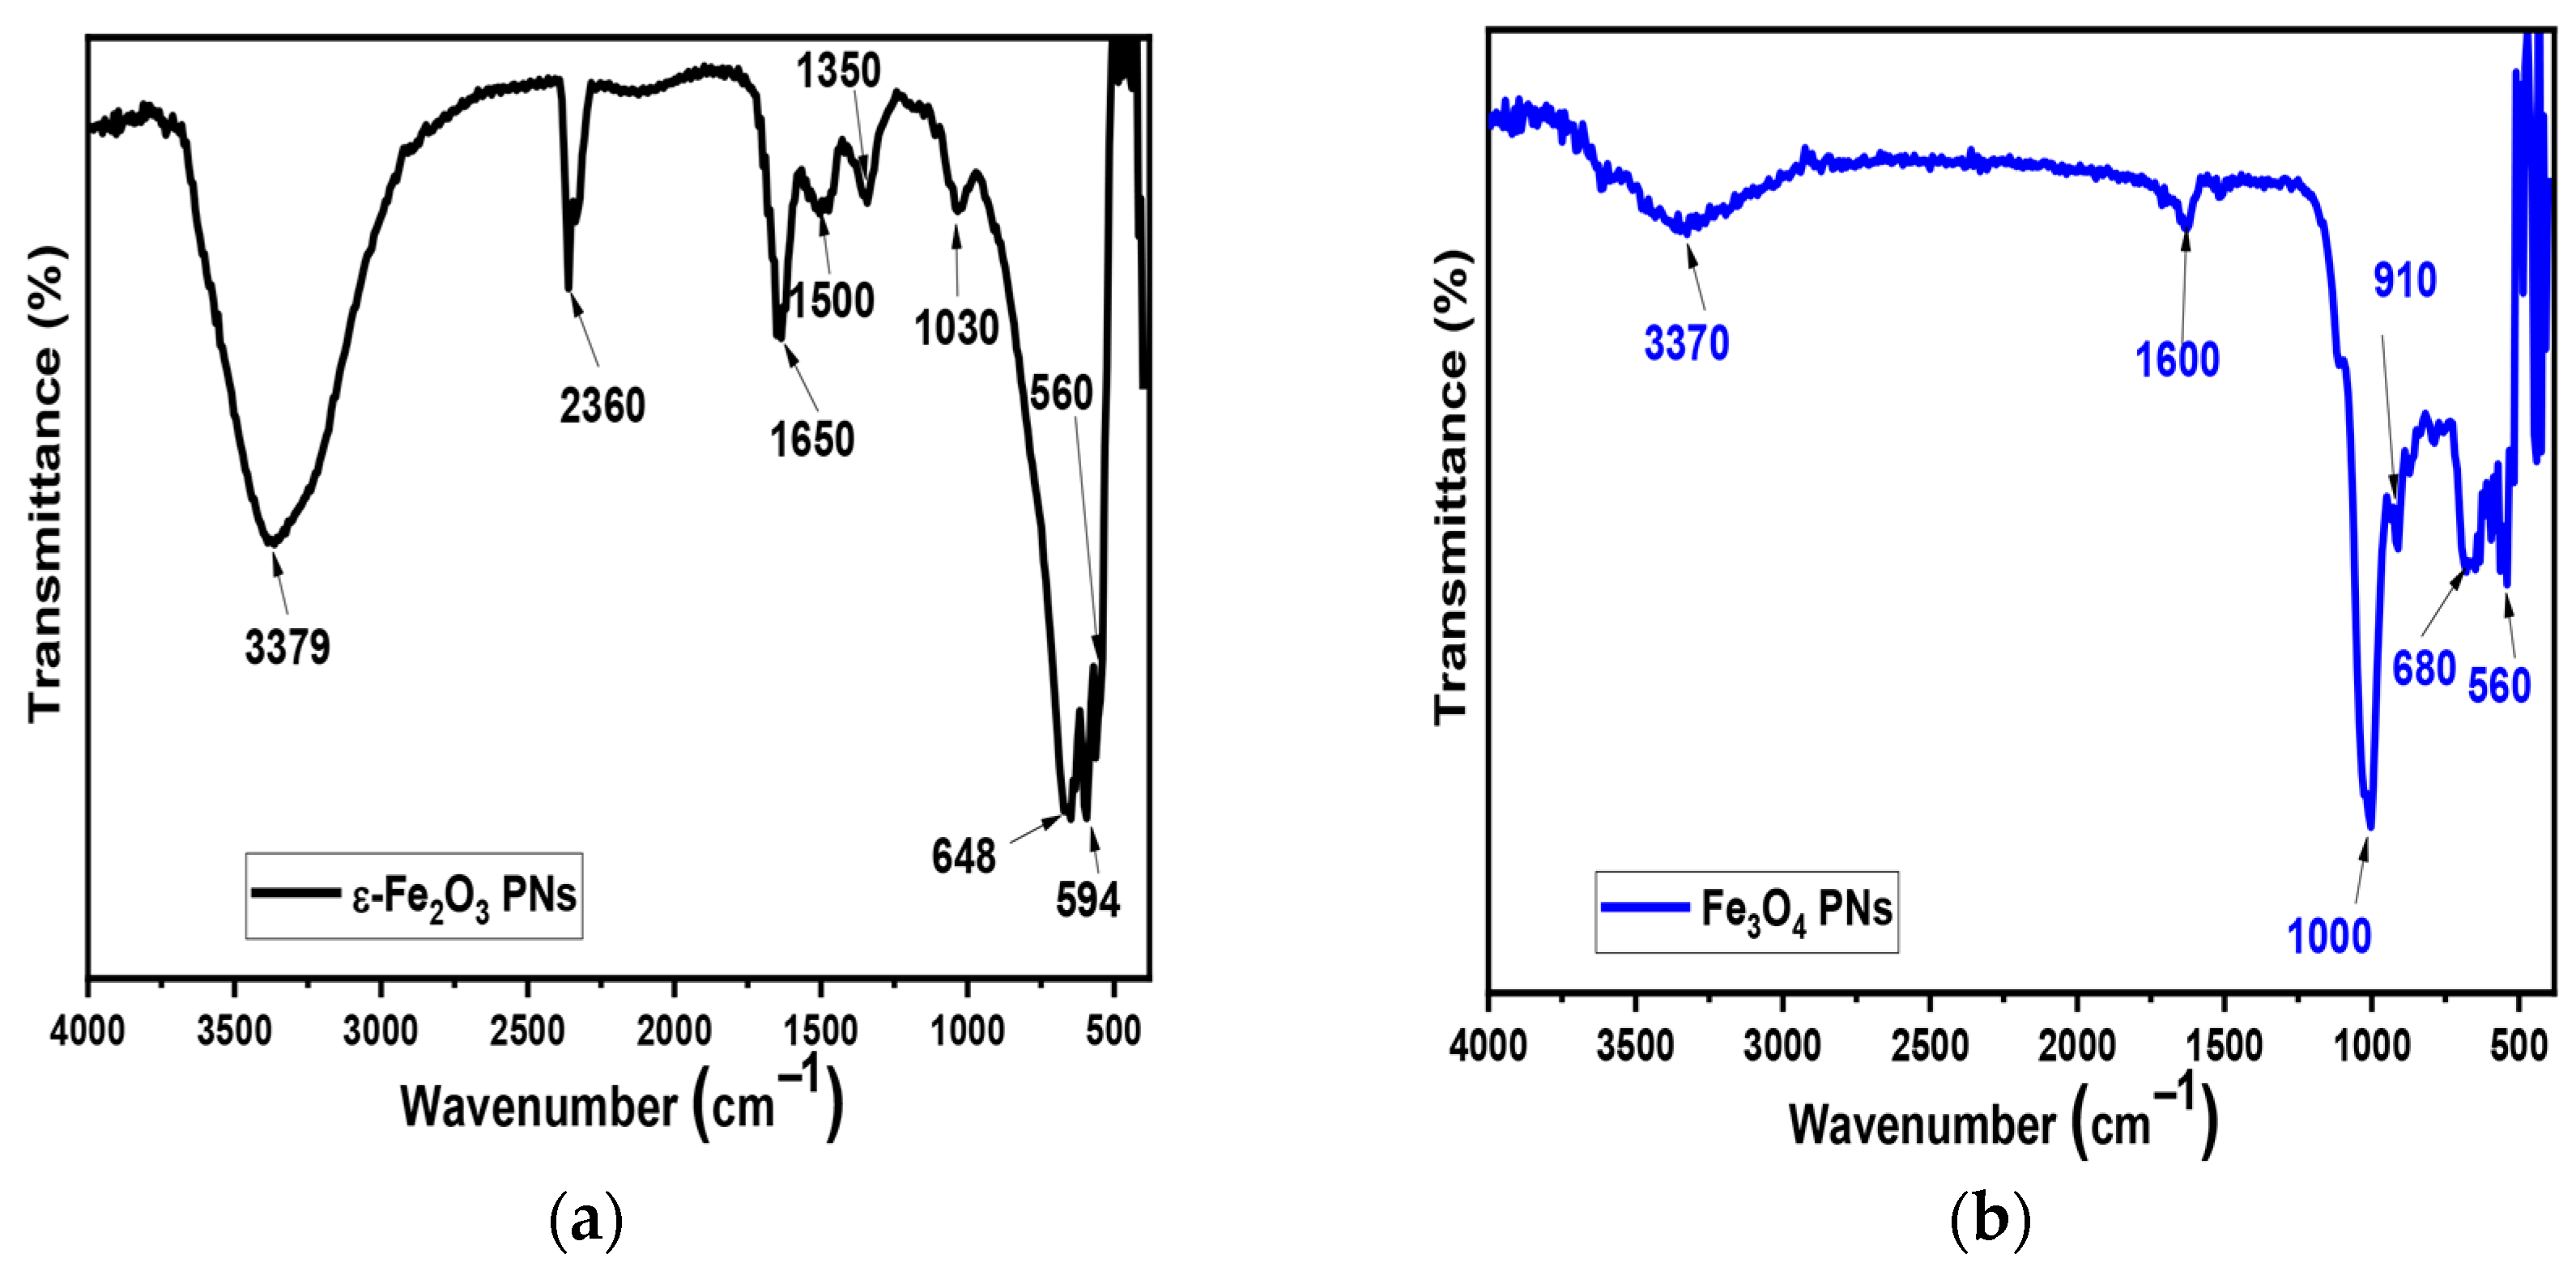
Figure 1. FTIR spectra of (a) ε-Fe2O3 NPs and (b) Fe3O4 NPs.
Physchem 05 00033 g001
Figure 2. XRD analysis of (a) ε-Fe2O3 NPs and (b) Fe3O4 NPs.
Physchem 05 00033 g002
Figure 3. SEM images of the synthesized Fe3O4 NPs at (a) 2 µm scale with 25,000× magnification and (b) 5 µm scale with 10,000× magnification and (c) the EDX of Fe3O4 NPs.
Physchem 05 00033 g003
Figure 4. SEM images of the synthetized ε-Fe2O3 NPs at (a) 2 µm scale with 25,000× magnification and (b) 5 µm scale with 10,000× magnification. (c) The EDX analysis of ε-Fe2O3 NPs.
Physchem 05 00033 g004
Figure 5. Thermal behavior of Fe3O4 and ε-Fe2O3 nanoparticles: (a) TGA of Fe3O4, (b) DTA of Fe3O4, (c) TGA of ε-Fe2O3, and (d) DTA of ε-Fe2O3.
Physchem 05 00033 g005
Figure 6. Reflectance spectra of (a) Fe3O4 nanoparticles and (b) ε-Fe2O3 nanoparticles.
Physchem 05 00033 g006
Figure 7. Refractive indices of (a) Fe3O4 nanoparticles and (b) ε-Fe2O3 nanoparticles.
Physchem 05 00033 g007
Figure 8. (αhν)2 versus hν plots for (a) Fe3O4 nanoparticles and (b) ε-Fe2O3 nanoparticles.
Physchem 05 00033 g008
Figure 9. Optical conductivity of (a) Fe3O4 NPs and (b) ε-Fe2O3 NPs as a function of photon energy.
Physchem 05 00033 g009
Figure 10. Extinction coefficient of thin films of (a) Fe3O4 NPs and (b) ε-Fe2O3 NPs as a function of photon energy.
Physchem 05 00033 g010
Table 1. Some compounds found in apricot kernel peel extract.
Chemical Compounds of the Apricot Kernel ShellsPercentage
ascorbic acid (C6H8O6)0.50%
pyrocatechol (C6H6O2)0.36%
salicin (C13H18O7)0.34%
esculin (C15H16O9)0.30%
caffeine (C8H10N4O2)0.36%
vanillic acid (C8H8O4)2.67%
rutin (C27H30O16)0.56%
vanillin (C8H8O3)0.30%
caffeic acid (C9H8O4)1.10%
salicylic acid (C7H6O3)0.34%
enamic acid (C9H8O2)1.60%
Table 2. The TGA results comparing the thermal stability and decomposition characteristics of ε-Fe2O3 NPs and Fe3O4 NPs.
Propertyε-Fe2O3 NPsFe3O4 NPs
T (°C)Mass Loss (%)T (°C)Mass Loss (%)
1st weight loss50−1200.9550−7510.4
2nd weight loss120−2501.6175−1506.9
3rd weight loss250−3502.05150−23539.4
4rd weight loss350−6201.56235−8002.65
5rd weight loss620−8001.13//
Residual at 800 °C80092.780040.65
Table 3. A summary of the optical properties of ε-Fe2O3 and Fe3O4 NPs.
Optical Propertiesε-Fe2O3 NPs Fe3O4 NPs Literature References
Constant reflectance (R)0.05 to a maximum of 0.370.05 To a maximum of 0.37Fe3O4 Rmax = 0.2 [20]
Refractive index (n)1.05 to a maximum of 1.451.05 to a maximum of 1.45Fe3O4 nmax = 1.5 [20]
Band gap Eg (eV)2.752.56Fe3O4 2.2 [20]
Fe3O4 2.51−3.01 [30]
α-Fe2O3 1.94−2.27 [31]
Optical conductivity σ (eV) × 1081.35 to a maximum of 6.22 1.37 to a maximum of 6.2 Fe3O4 σ (eV)max = 60 [20]
Extinction coefficient (k)37
to a maximum of 280
39
to a maximum of 300
0.5
to a maximum of
0.65 [20]
Disclaimer/Publisher’s Note: The statements, opinions and data contained in all publications are solely those of the individual author(s) and contributor(s) and not of MDPI and/or the editor(s). MDPI and/or the editor(s) disclaim responsibility for any injury to people or property resulting from any ideas, methods, instructions or products referred to in the content.