Article

Detection of Electron Beam-Irradiated Bone-Containing Foods Using a Robust Method of Electron Paramagnetic Resonance Spectrometry

by
Ashfaq Ahmad Khan
1 and
Muhammad Kashif Shahid
2,*
1
Department of Chemistry, Government Postgraduate College, University of Haripur, Haripur 22620, Pakistan
2
School of Engineering, Faculty of Science and Engineering, Macquarie University, Sydney, NSW 2109, Australia
*
Author to whom correspondence should be addressed.
Physchem 2025, 5(3), 24; https://doi.org/10.3390/physchem5030024
Submission received: 15 May 2025 / Revised: 7 June 2025 / Accepted: 17 June 2025 / Published: 20 June 2025
(This article belongs to the Section Experimental and Computational Spectroscopy)

Abstract

Food irradiation is gaining popularity worldwide due to its potential to extend shelf life, improve hygienic quality, and meet trade requirements. The electron paramagnetic resonance (EPR) method is a reliable and sensitive technique for detecting untreated and irradiated foods. This study investigated the effectiveness of EPR in identifying irradiated meat and seafood containing bones. Beef, lamb, chicken, and various fish were irradiated with electron beams at different doses and analysed using an EPR spectrometer. During irradiation, the food samples were surrounded by small ice bags to prevent autodegradation of cells and nuclei. After the irradiation process, the samples were stored at −20 °C. For EPR signal recording, the flesh, connective tissues, and bone marrow were removed from the bone samples, which were then oven-dried at 50 °C. The EPR spectra were recorded using an X-band EPR analyzer. Unirradiated and irradiated samples were identified based on the nature of the EPR signals as well as the g-values of symmetric and asymmetric signals. The study found that the EPR method is effective in distinguishing between unirradiated and irradiated bone-containing foods across nearly all applied radiation doses. The peak-to-peak amplitude of the EPR signals increased with increasing radiation doses. It was observed that unirradiated bone samples showed low-intensity symmetrical signals, while irradiated samples showed typical asymmetric signals. Overall, the study demonstrated that the EPR method is a reliable and sensitive technique for identifying irradiated foods containing bones and can be used for the control, regulation, and proper surveillance of food irradiation.

1. Introduction

Food irradiation plays a vital role in ensuring food safety for both healthy and vulnerable consumers by inactivating pathogens, meeting quarantine regulations, and reducing spoilage during transport and commercialization [1,2]. Spoilage and harmful microorganisms, such as Salmonella, can significantly degrade food quality and safety. For example, Salmonella in meat and related products is responsible for up to 96% of salmonellosis cases, presenting a major public health concern and economic burden worldwide. To mitigate this, ionizing radiation methods such as electron beam treatment have been applied to inactivate pathogens in various food matrices [3].
Irradiation involves the application of ionizing radiation, gamma rays, X-rays, or electron beams, to eliminate bacteria, viruses, or insects in food. This method is approved in many countries, with global adoption steadily increasing [4,5]. During irradiation, free radicals are generated within the food matrix. At the maximum permitted dose of 10 kGy, approximately 5 × 10⁻³ moles of free radicals are formed per kg of food [6]. If radiation exceeds permitted levels, it may negatively impact food’s sensory and nutritional qualities, underscoring the importance of precise dosimetry in food processing [7].
Most irradiation-induced free radicals are highly reactive and short-lived, disappearing rapidly through interactions with surrounding molecules. However, a subset of radicals persists in hard tissues such as bones and other calcified materials, remaining stable for months or even years after treatment [8]. These persistent radicals, or paramagnetic centers, can be directly detected without sample pre-treatment using electron paramagnetic resonance (EPR) spectroscopy [9]. EPR spectroscopy is a non-destructive and highly sensitive technique that measures unpaired electrons in irradiated materials. In this process, an applied magnetic field splits electron spin energy levels (ms = ±1/2), allowing resonance absorption of microwave radiation [10]. The concentration of radiation-induced radicals is proportional to the absorbed dose of ionizing radiation, and EPR is one of the most sensitive methods for detecting these radicals. However, the ability of EPR spectrometry to detect free radicals is limited by their lifespan, which can be influenced by infrared radiation. Therefore, studying the temporal kinetics of radicals in various food products is essential for understanding their behavior and stability over time [11]. The persistence of free radicals is affected by various factors, including the product’s moisture content, radical recombination reactions, radiation parameters, and storage conditions, all of which can affect the stability and longevity of these highly reactive molecules [12].
Extensive research has been conducted on the detection of irradiation treatment in meats such as veal, beef, goose, duck, turkey, chicken, and frog’s legs, with successful differentiation between irradiated and non-irradiated samples [13]. Similarly, irradiation detection in mechanically recovered meat (MRM) has been successfully achieved using bone fragments extracted from MRM, which exhibit characteristic radiation-induced EPR signals [14,15]. Studies have shown that the presence of calcified material in the bones of fish, crustaceans, and shellfish makes them strong candidates for the detection of radiation-induced radicals, allowing for reliable identification of treated foods [16]. However, the EPR signal intensities observed in irradiated fish bones are generally lower than those in the bones of other animals or birds due to lower levels of calcification. Several studies have also successfully identified radiation treatment in seafood, and post-irradiation storage studies under varying conditions have been carried out [1,17].
EPR spectrometry is also a promising technique for detecting irradiated plant-based foods, which contain cellulosic materials and low molecular weight sugars. Investigations have been conducted on the identification of irradiated foods such as tree nuts (e.g., pine nuts and walnuts), legumes, and pulses (e.g., red grams, white beans, pinto beans, and green peas), and foods containing low molecular weight sugars (e.g., pan masala and dried dates). These studies included comparisons of EPR signal intensities as well as assessment of the post-irradiation stability of the signals. The method proved effective in distinguishing between irradiated and non-irradiated (control) samples [18].
This study highlights the effectiveness of the EPR technique in identifying irradiated meat and seafood containing bones, thereby contributing to the advancement of food irradiation detection methods. Although the high cost and limited availability of EPR equipment remain challenges, its growing application in the routine screening of irradiated foods highlights its potential importance. The novelty of this study lies in the application of EPR spectroscopy to this specific category of foods. Its findings may support food regulators, producers, and consumers in ensuring the safety of irradiated food products.

2. Materials and Methods

2.1. Sample Preparation

Fresh samples of chicken, beef, and lamb meat, as well as fresh fish species including halibut, saithe, salmon, and plaice, were purchased from local markets in Karlsruhe, Germany. The samples were immediately frozen and stored at −20 °C. On the following day, the frozen meat and fish samples were irradiated while being nearly completely surrounded by numerous small ice packs to maintain low temperature and then stored at −20 °C for subsequent analysis.

2.2. Irradiation of Samples

A 10 MeV linear accelerator (Circe III Linear Accelerator, Thomson-CSF Linac, St. Aubin, France) was used to irradiate the samples in this study. Each sample of beef, lamb, and fish (halibut, plaice, saithe, and salmon) was exposed to radiation doses within the permissible range specified for each food type, as outlined in Table 1 and endorsed by the International Consultative Group on Food Irradiation (ICGFI, 1993). To determine the actual absorbed radiation doses, radiochromic film dosimeters (GAF DM-1260; International Specialty Products, Wayne, NJ, USA) were placed alongside the samples during irradiation. Changes in the absorbance of the dosimetric films were measured at 405 nm using a filter photometer (Ciba Corning, Essex, UK). The absorbed dose was then calculated using a calibration curve established at up to 35 kGy.

2.3. Preparation of Food Samples for EPR Cavity for Recording of Signals
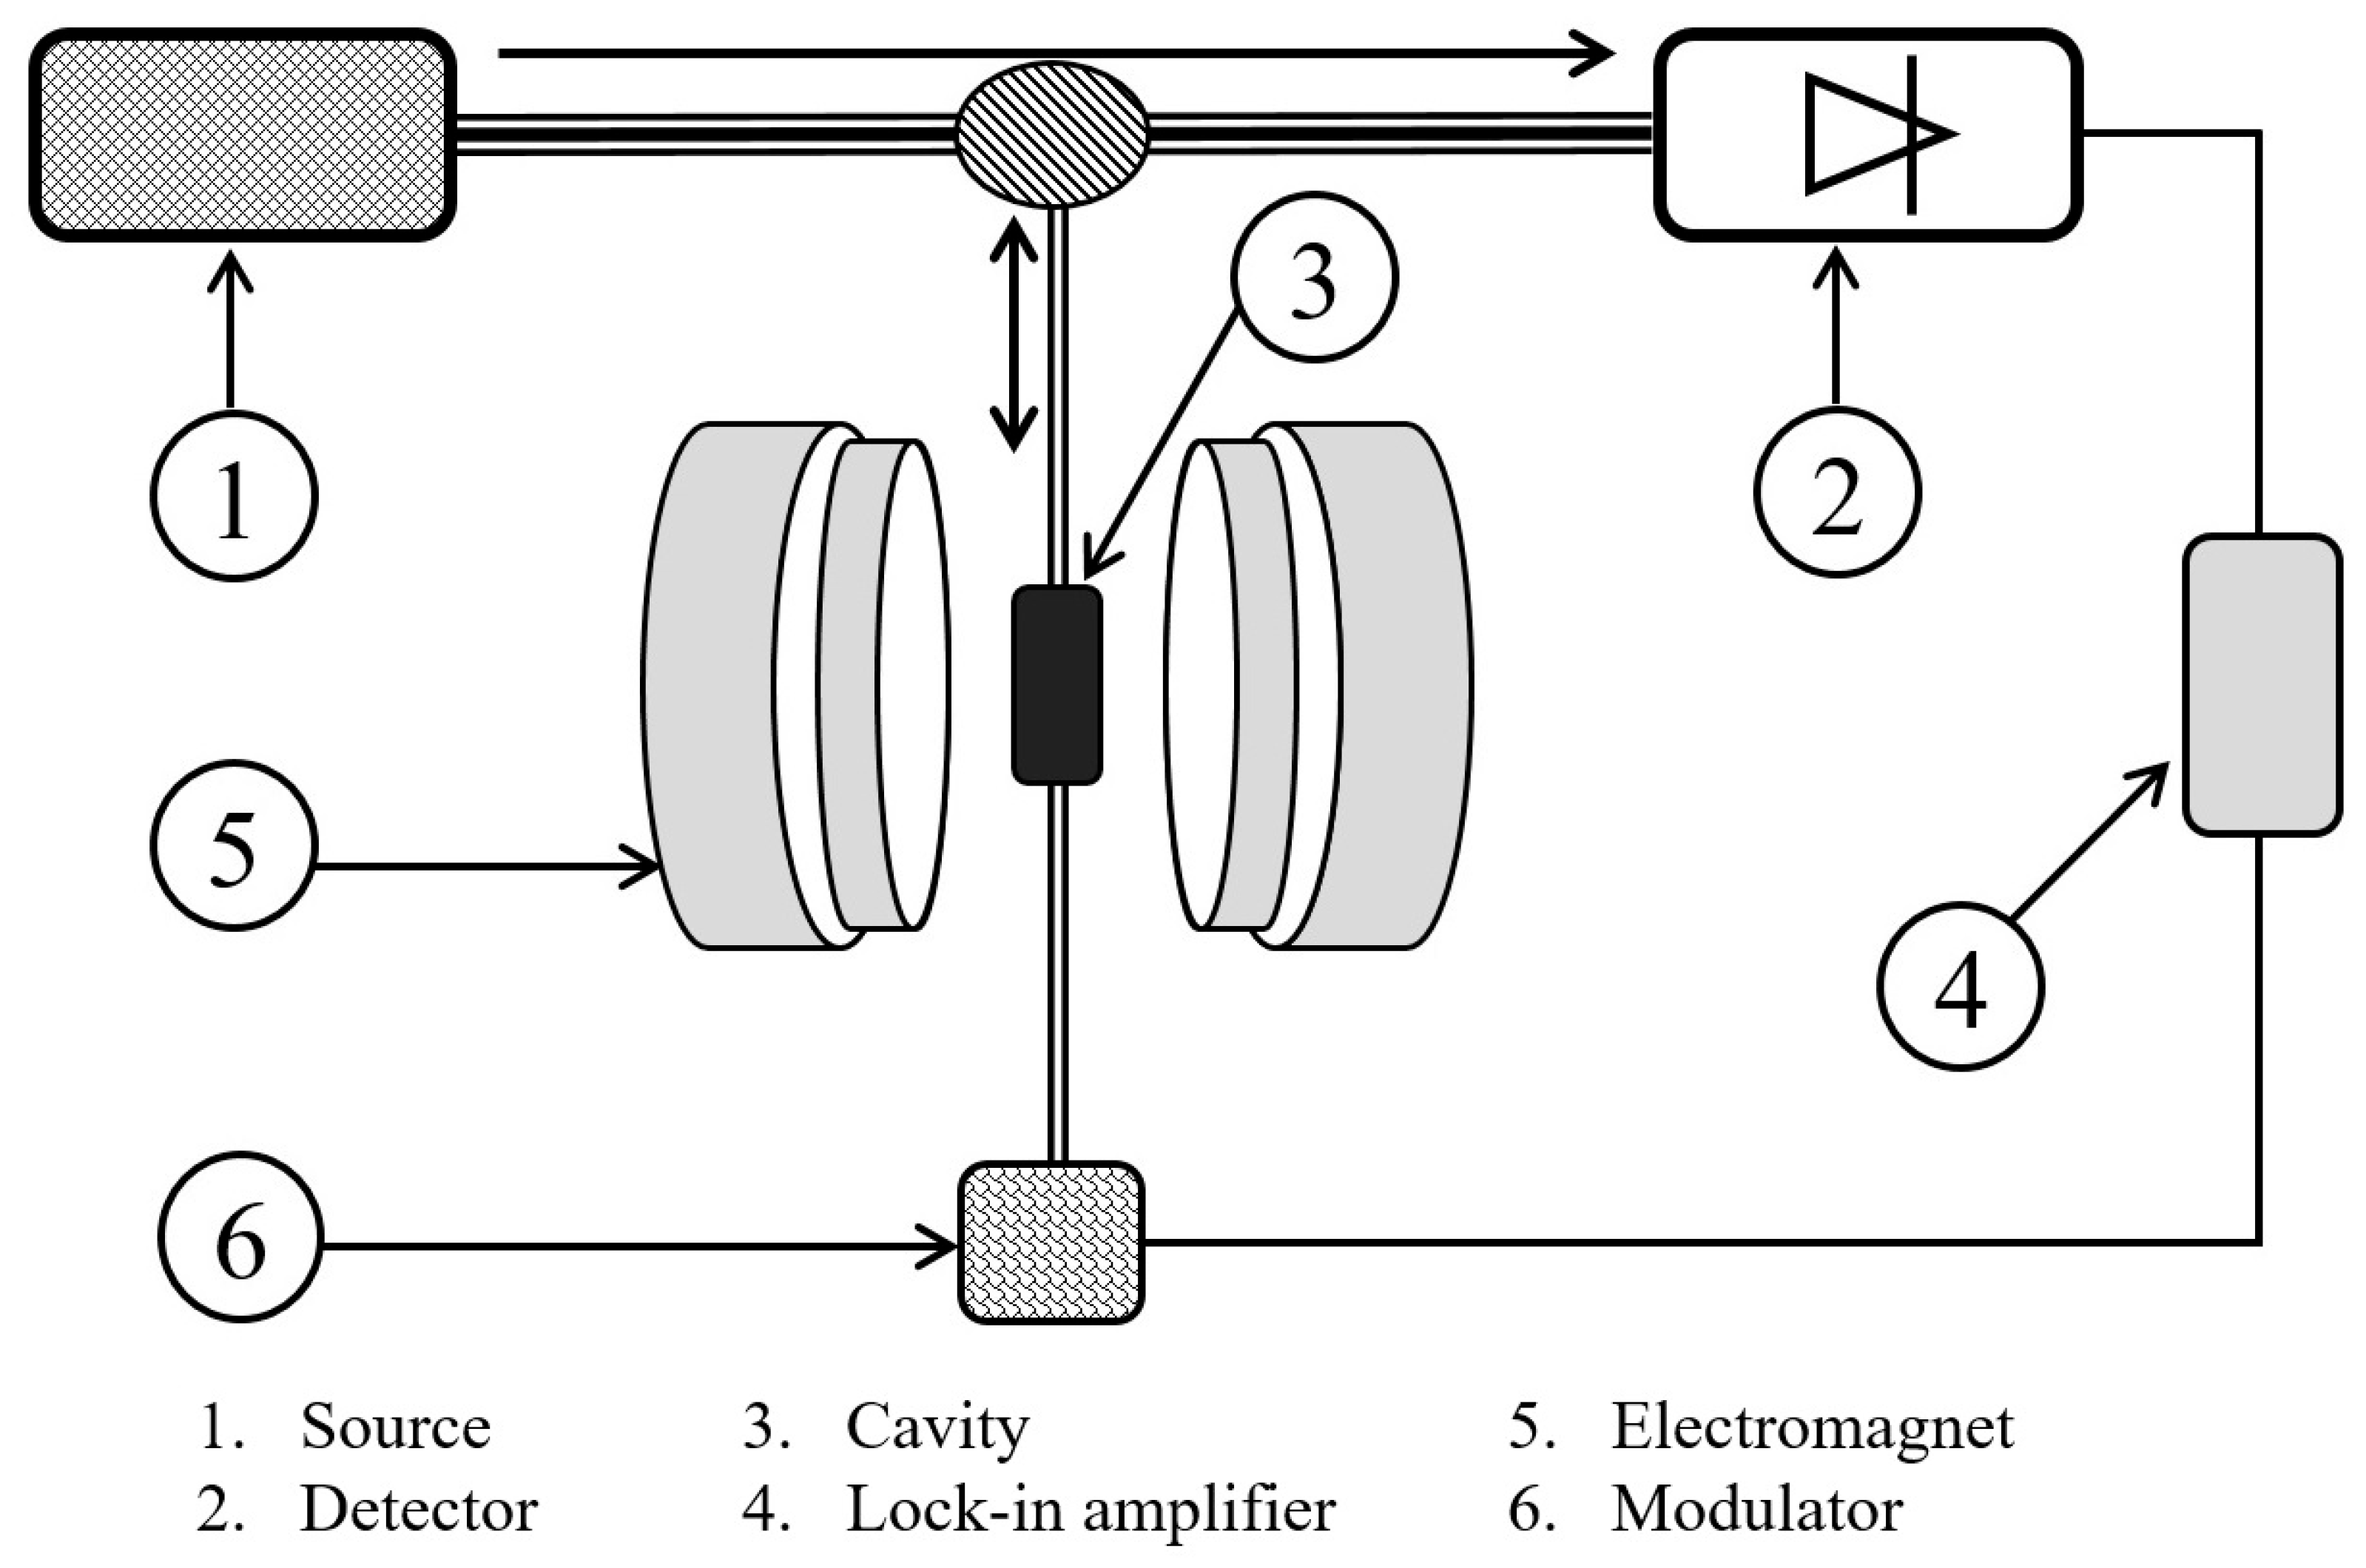
The bones from chicken, beef, and lamb were separated from the flesh and thoroughly cleaned by carefully scraping the outer surfaces with a scalpel. Additionally, bone marrow was removed by splitting the bones open. For the chicken samples, bones from the thigh were used.
In the case of fish samples, most of the flesh was removed using a scalpel. Any remaining tissue tightly attached to the bones was eliminated by gently heating the bones in a microwave oven followed by scraping with a scalpel. In most cases, vertebrae from the spinal column were selected for EPR measurements.
All bone samples were dried in a laboratory vacuum oven at 40 °C for approximately three hours. They were then broken into small pieces measuring approximately 3.0–3.5 mm in thickness and 5–10 mm in length. Each fragment was weighed precisely for normalization based on the sample weight used in the analysis.
The prepared bone fragments were placed in standard quartz ESR tubes in reproducible orientations and inserted into the rectangular microwave cavity of the EPR instrument for spectral measurement. EPR analyses were conducted on both irradiated and non-irradiated bone samples after storage at room temperature for 15 days, 3 months, and 12 months.

2.4. EPR Analysis

The experiment employed several pieces of equipment, including an X-band EPR spectrometer (Bruker EMS 104 EPR Analyzer) equipped with a magnet, microwave bridge, console with a field controller and signal channel, rectangular cavity, and a built-in g-value measurement unit. Quartz ESR tubes with an internal diameter of approximately 4.0 mm were used, along with an analytical balance with an accuracy of 1.0 mg, and a laboratory vacuum oven.
Figure 1 illustrates the block diagram of the main components of the EPR spectrometer. Prior to each measurement, the instrument was calibrated to ensure reproducibility and stability. A known paramagnetic reference sample with a stable spin concentration was used for calibration. The resulting signal intensities were corrected by applying a factor derived from the ratio of the EPR peak-to-peak signal intensity of the calibration scan to a stored reference calibration value. This correction factor was approximately 1, indicating that the instrument operated under normal conditions throughout all EPR measurements.
To ensure accurate and reproducible positioning of the samples within the resonant cavity, a positioning template was used for each ESR tube, as illustrated in Figure 2. The vertical placement of each sample was adjusted using the instrument’s parameter settings. Table 2 summarizes the spectrometric settings applied for all bone-containing food samples.

3. Results and Discussion

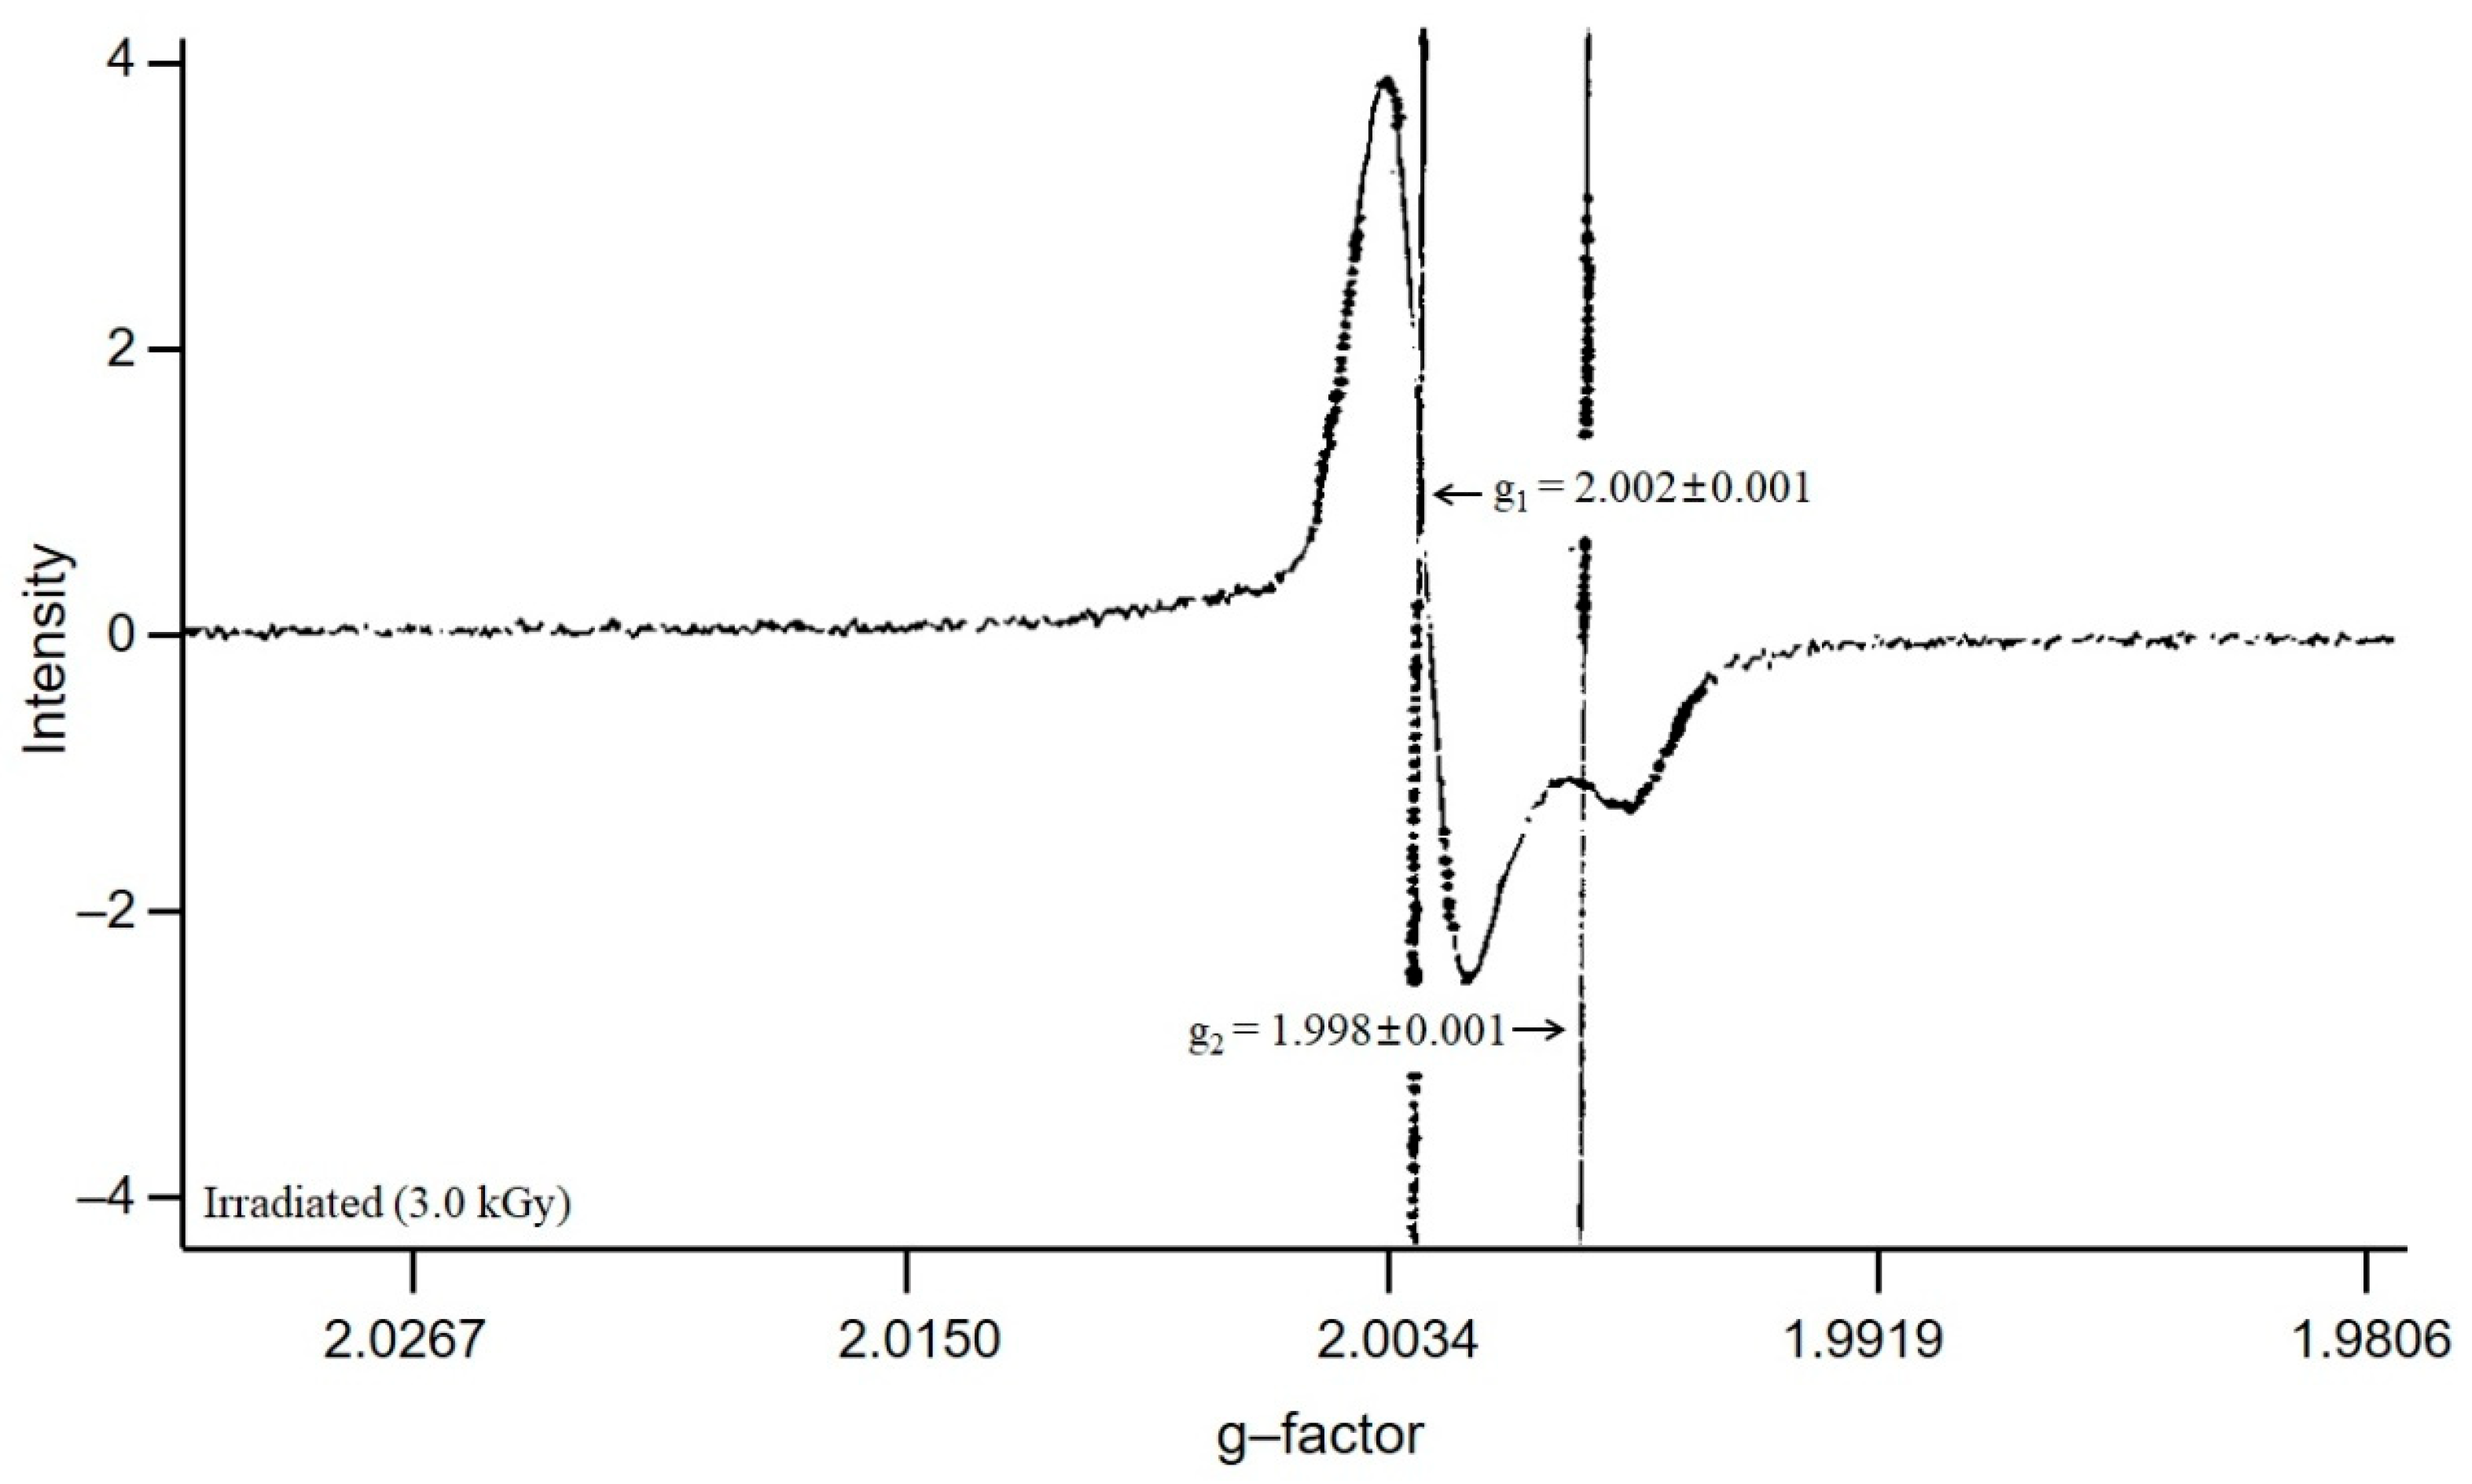
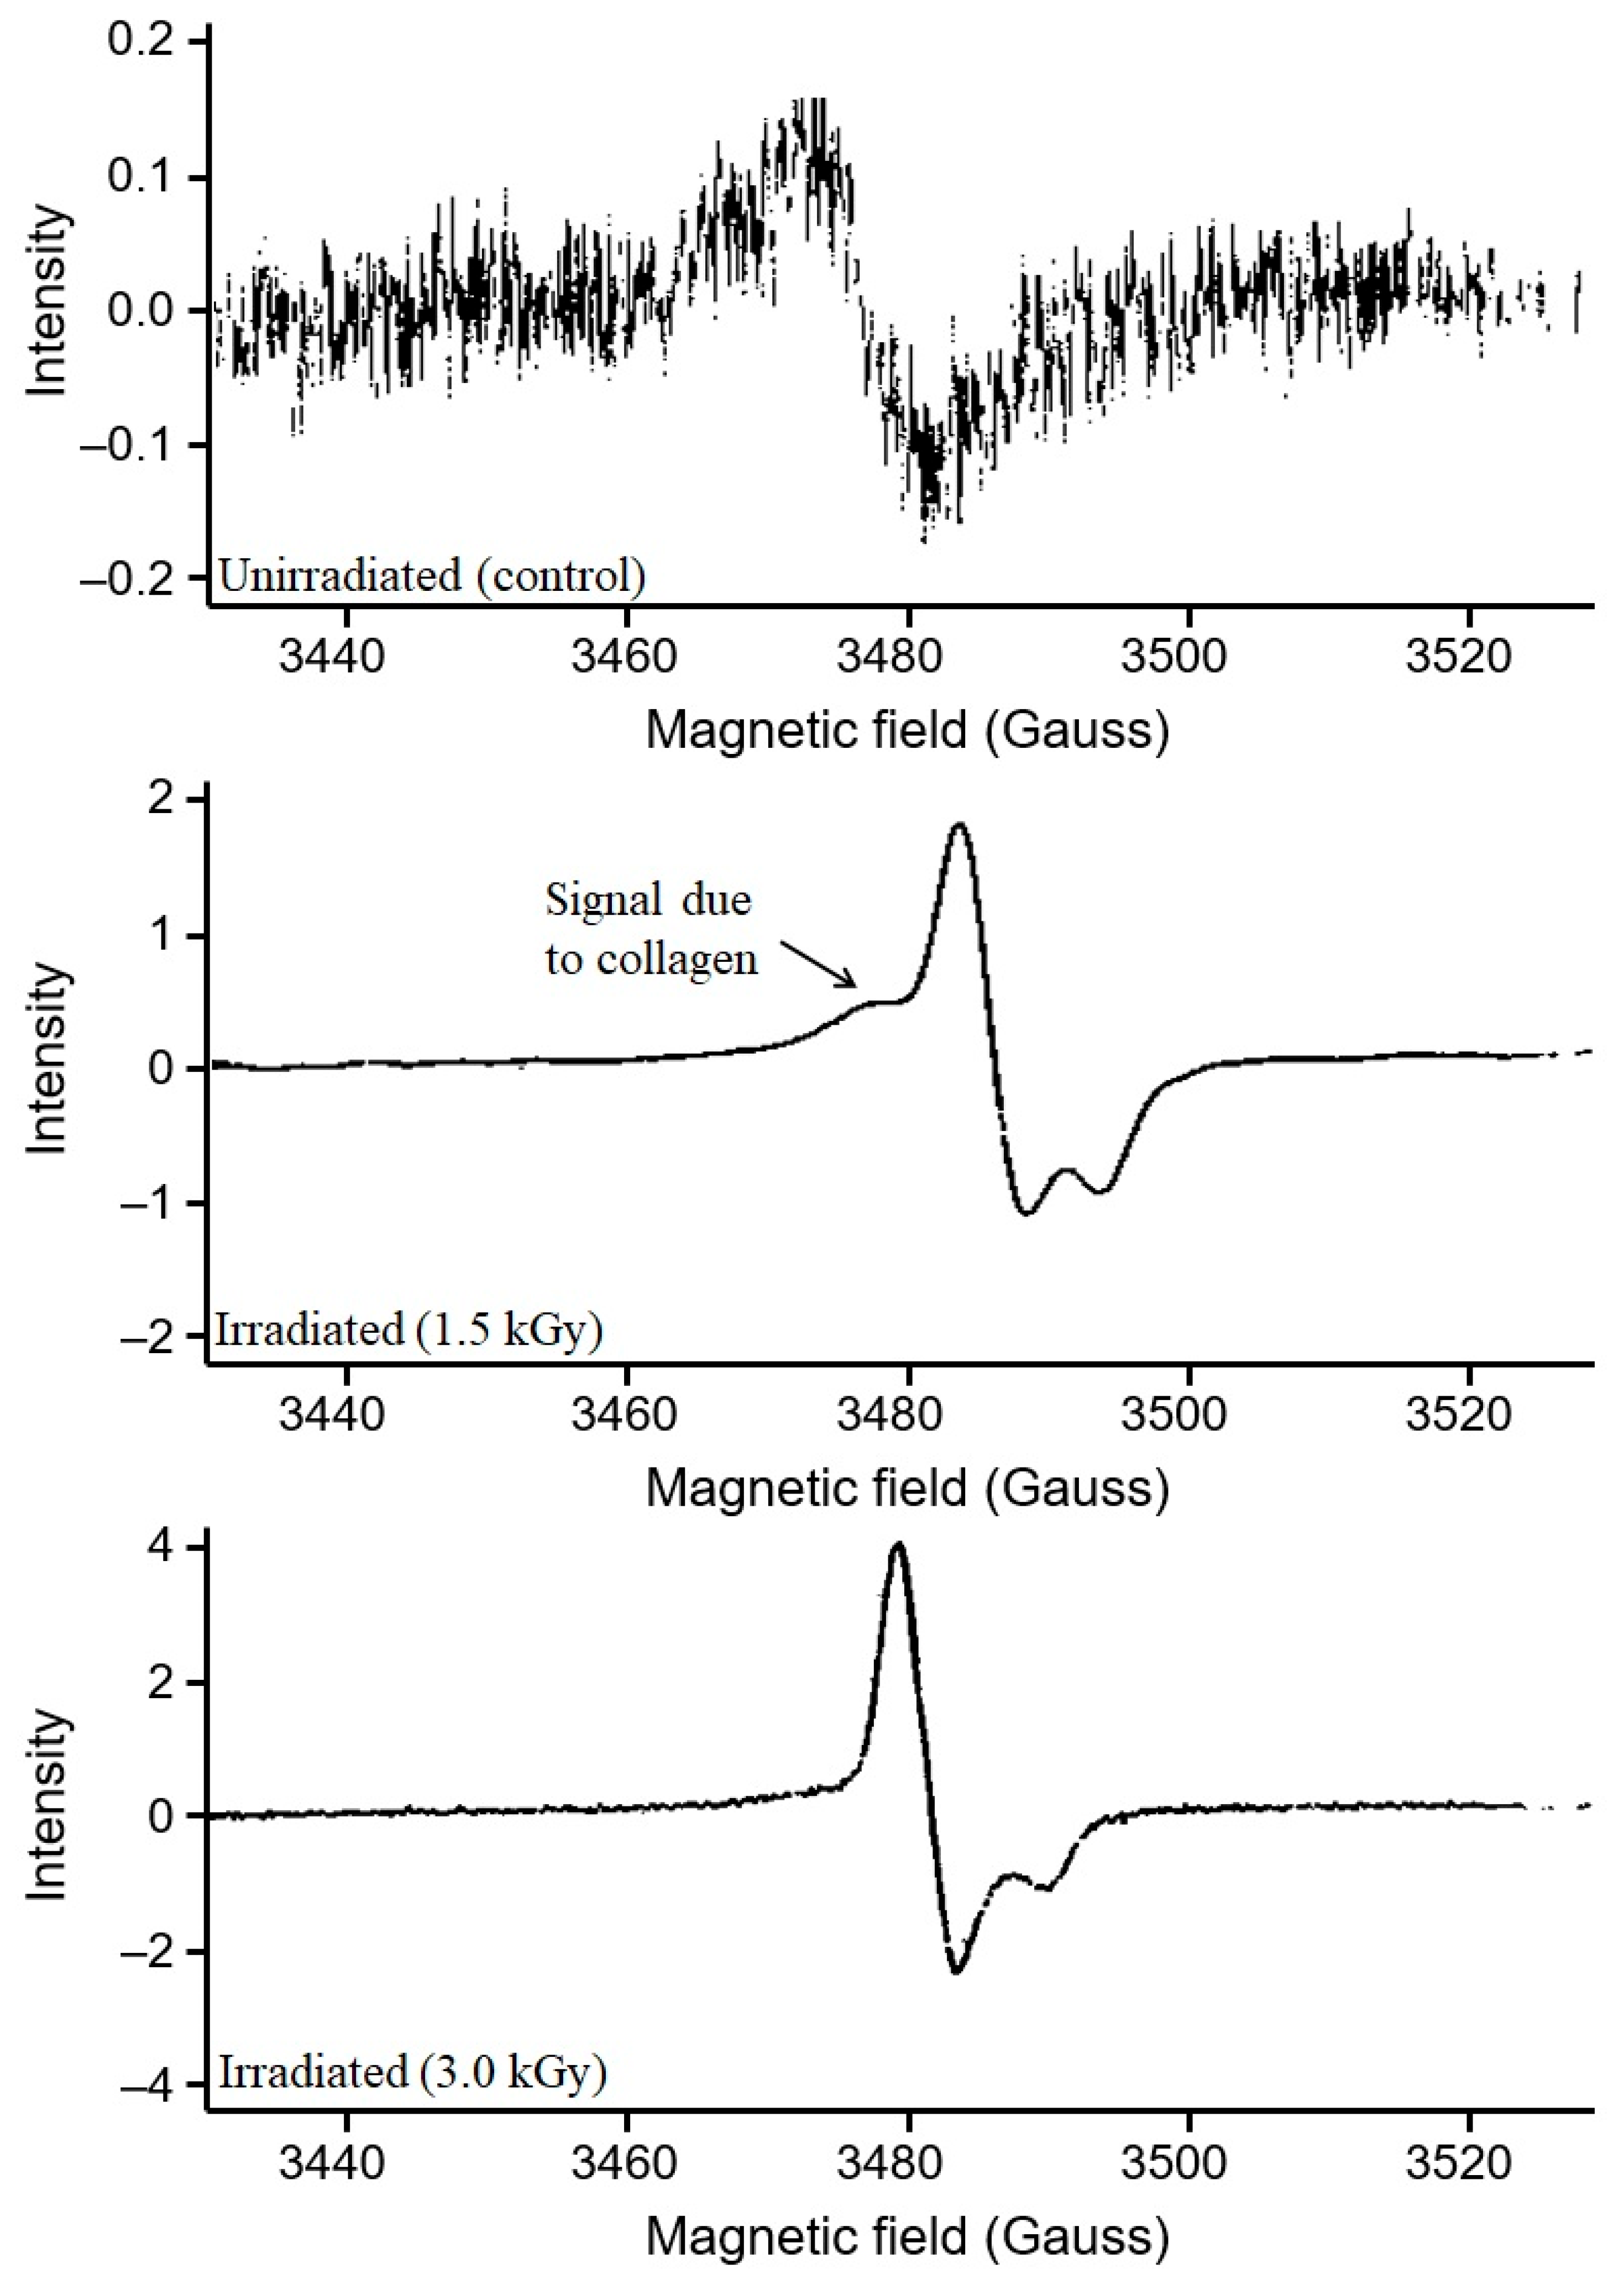
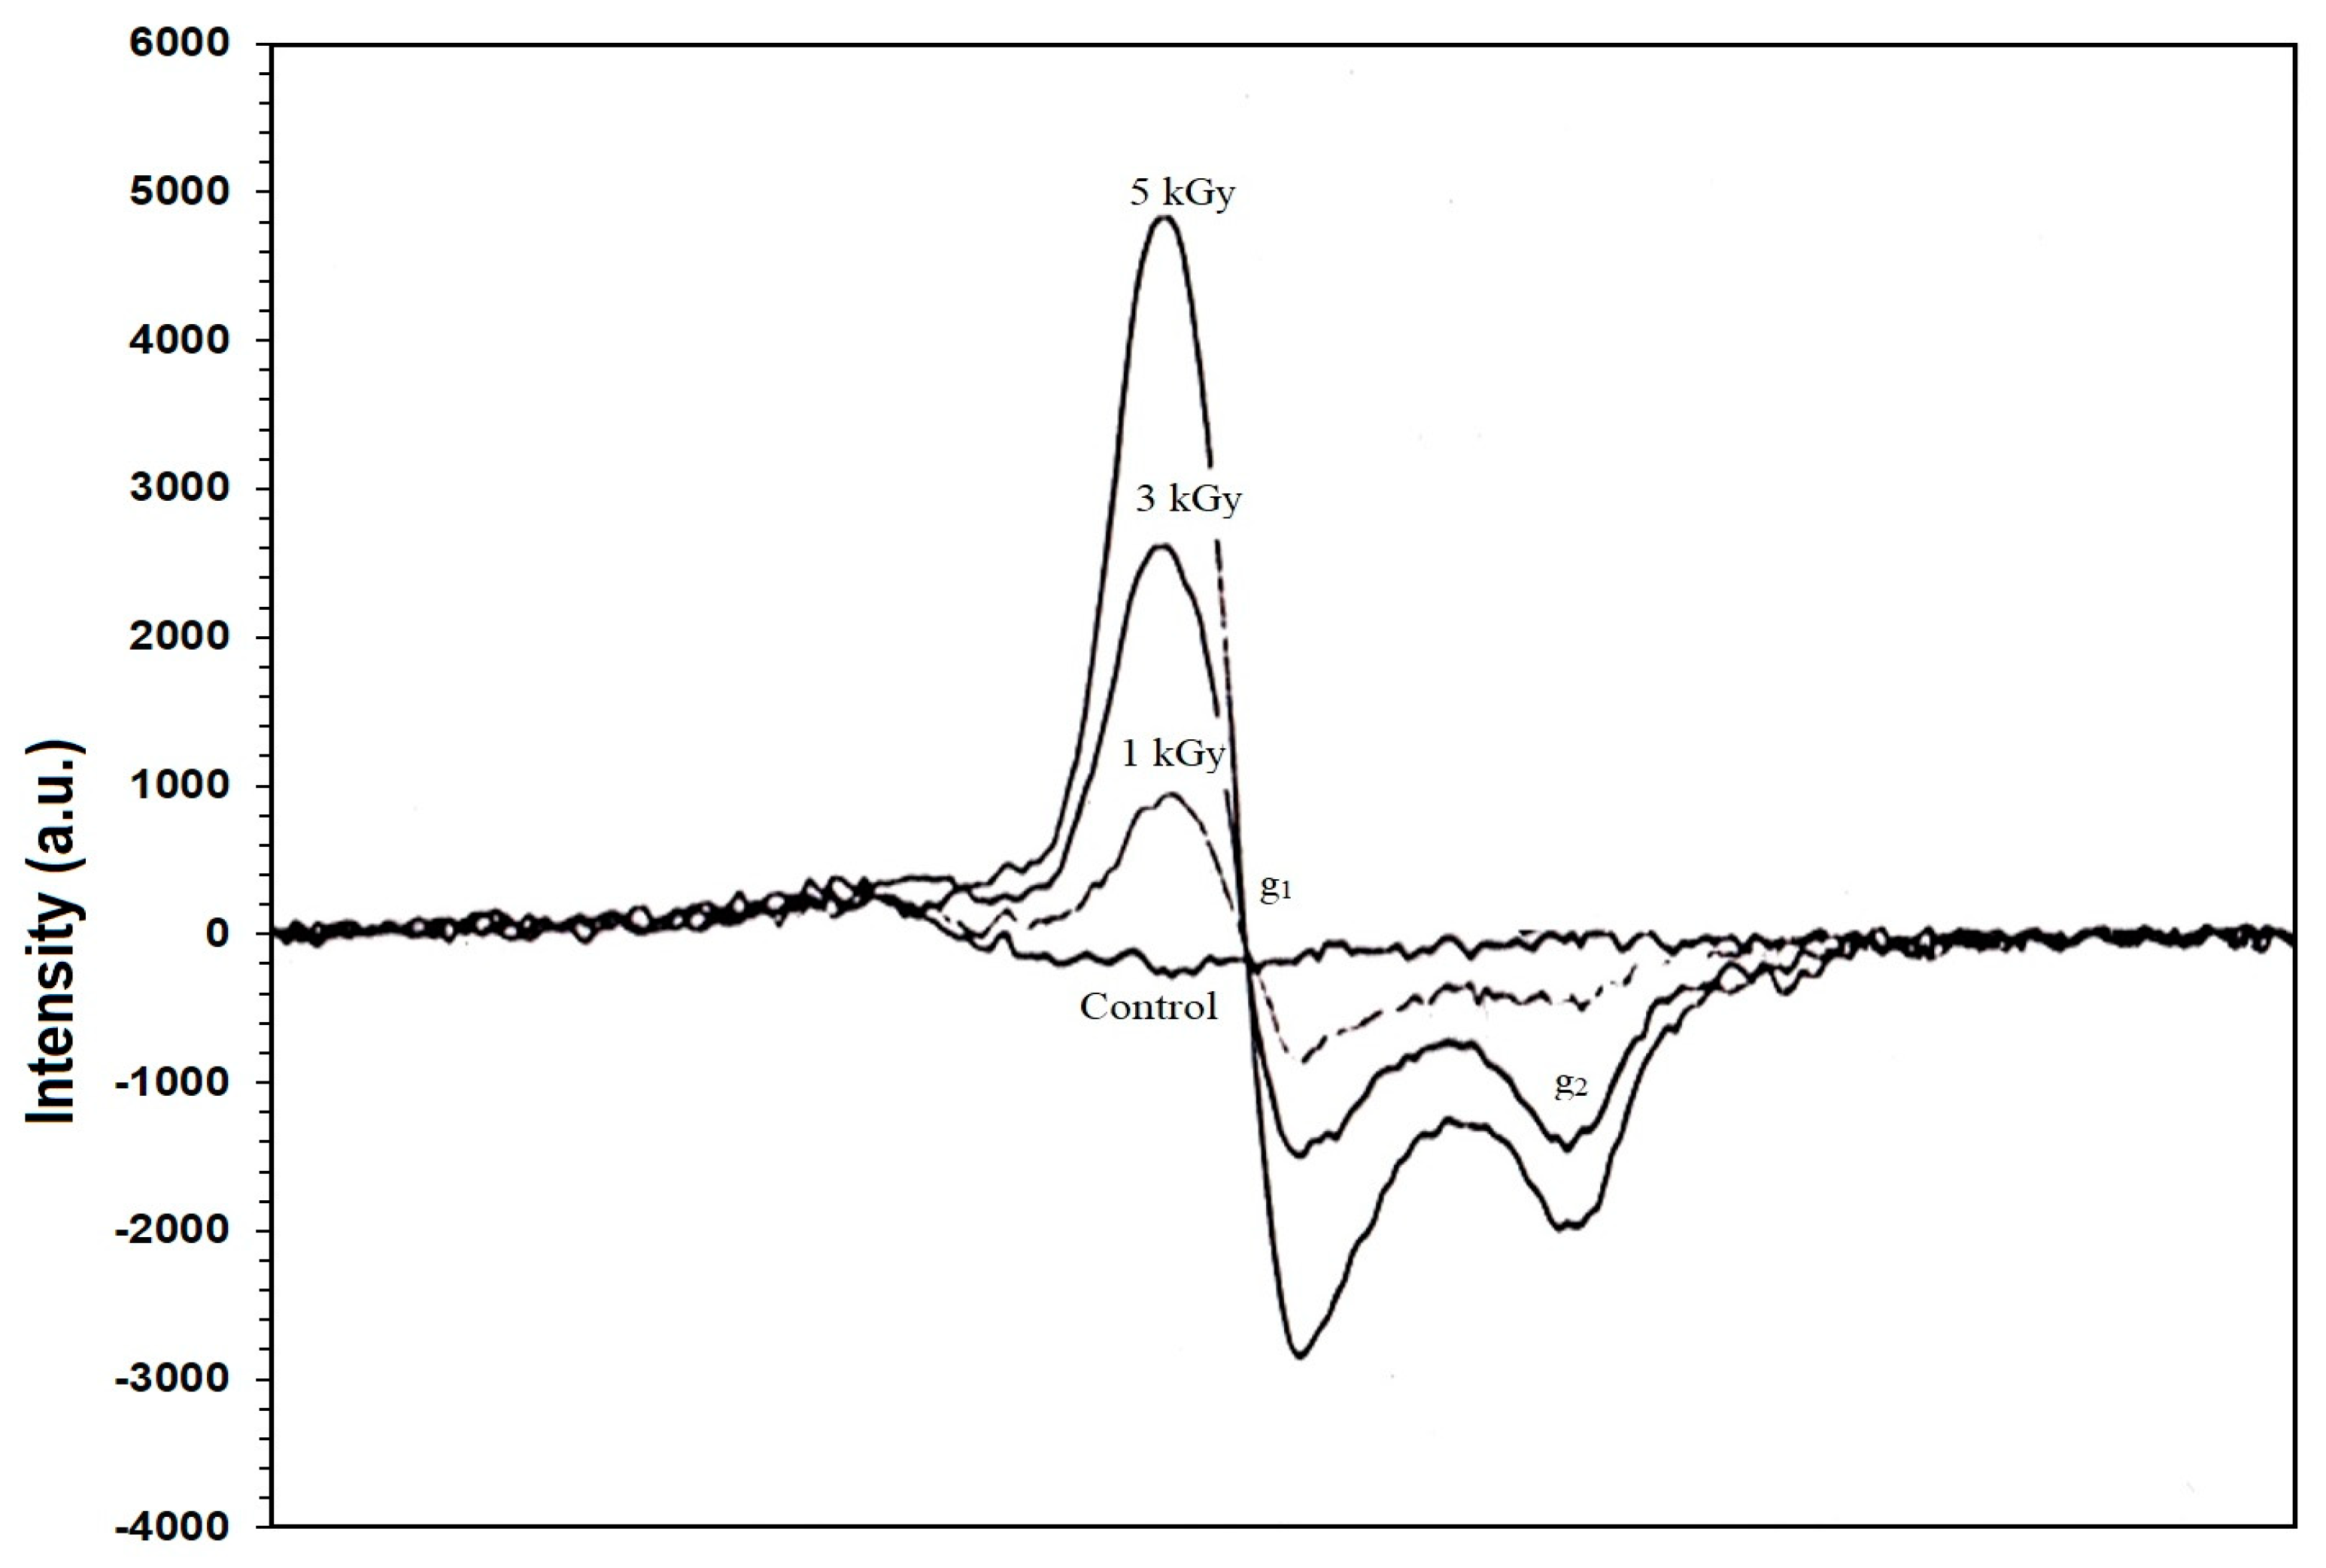
3.1. Assessment of EPR Signals from Bone Samples

The peak heights of the EPR signals were normalized based on the sample weights to allow for accurate comparison across different radiation doses. For normalization purposes, equal weights of each sample were used when comparing EPR signal intensities. The g-values of EPR signals from both unirradiated and irradiated samples were recorded and compared to those previously reported, following the established protocol [19].
The g-values for all bone samples were determined directly by positioning the cursor along the x-axis, which was calibrated in units of g-values. In unirradiated samples, the EPR spectrum consistently displayed a low-intensity, symmetric signal with a gsymm (go) of 2.005 ± 0.001 and a peak-to-peak linewidth of approximately 0.6–0.8 mT (6–8 G).
In contrast, irradiated samples exhibited an anisotropic EPR signal, indicative of ionizing radiation exposure. This signal was characterized by two g-values: g1 = 2.002 ± 0.001 (with a peak-to-peak width of 0.35 mT or 3.5 G) and g2 = 1.998 ± 0.001. Additionally, samples irradiated with minimal doses sometimes showed a nonspecific signal to the left of the main signal, attributed to collagen, an organic part of bone that is not completely removable. The positions of the observed g-values are illustrated in Figure 3 for unirradiated chicken thigh bone samples and in Figure 4 for irradiated ones.

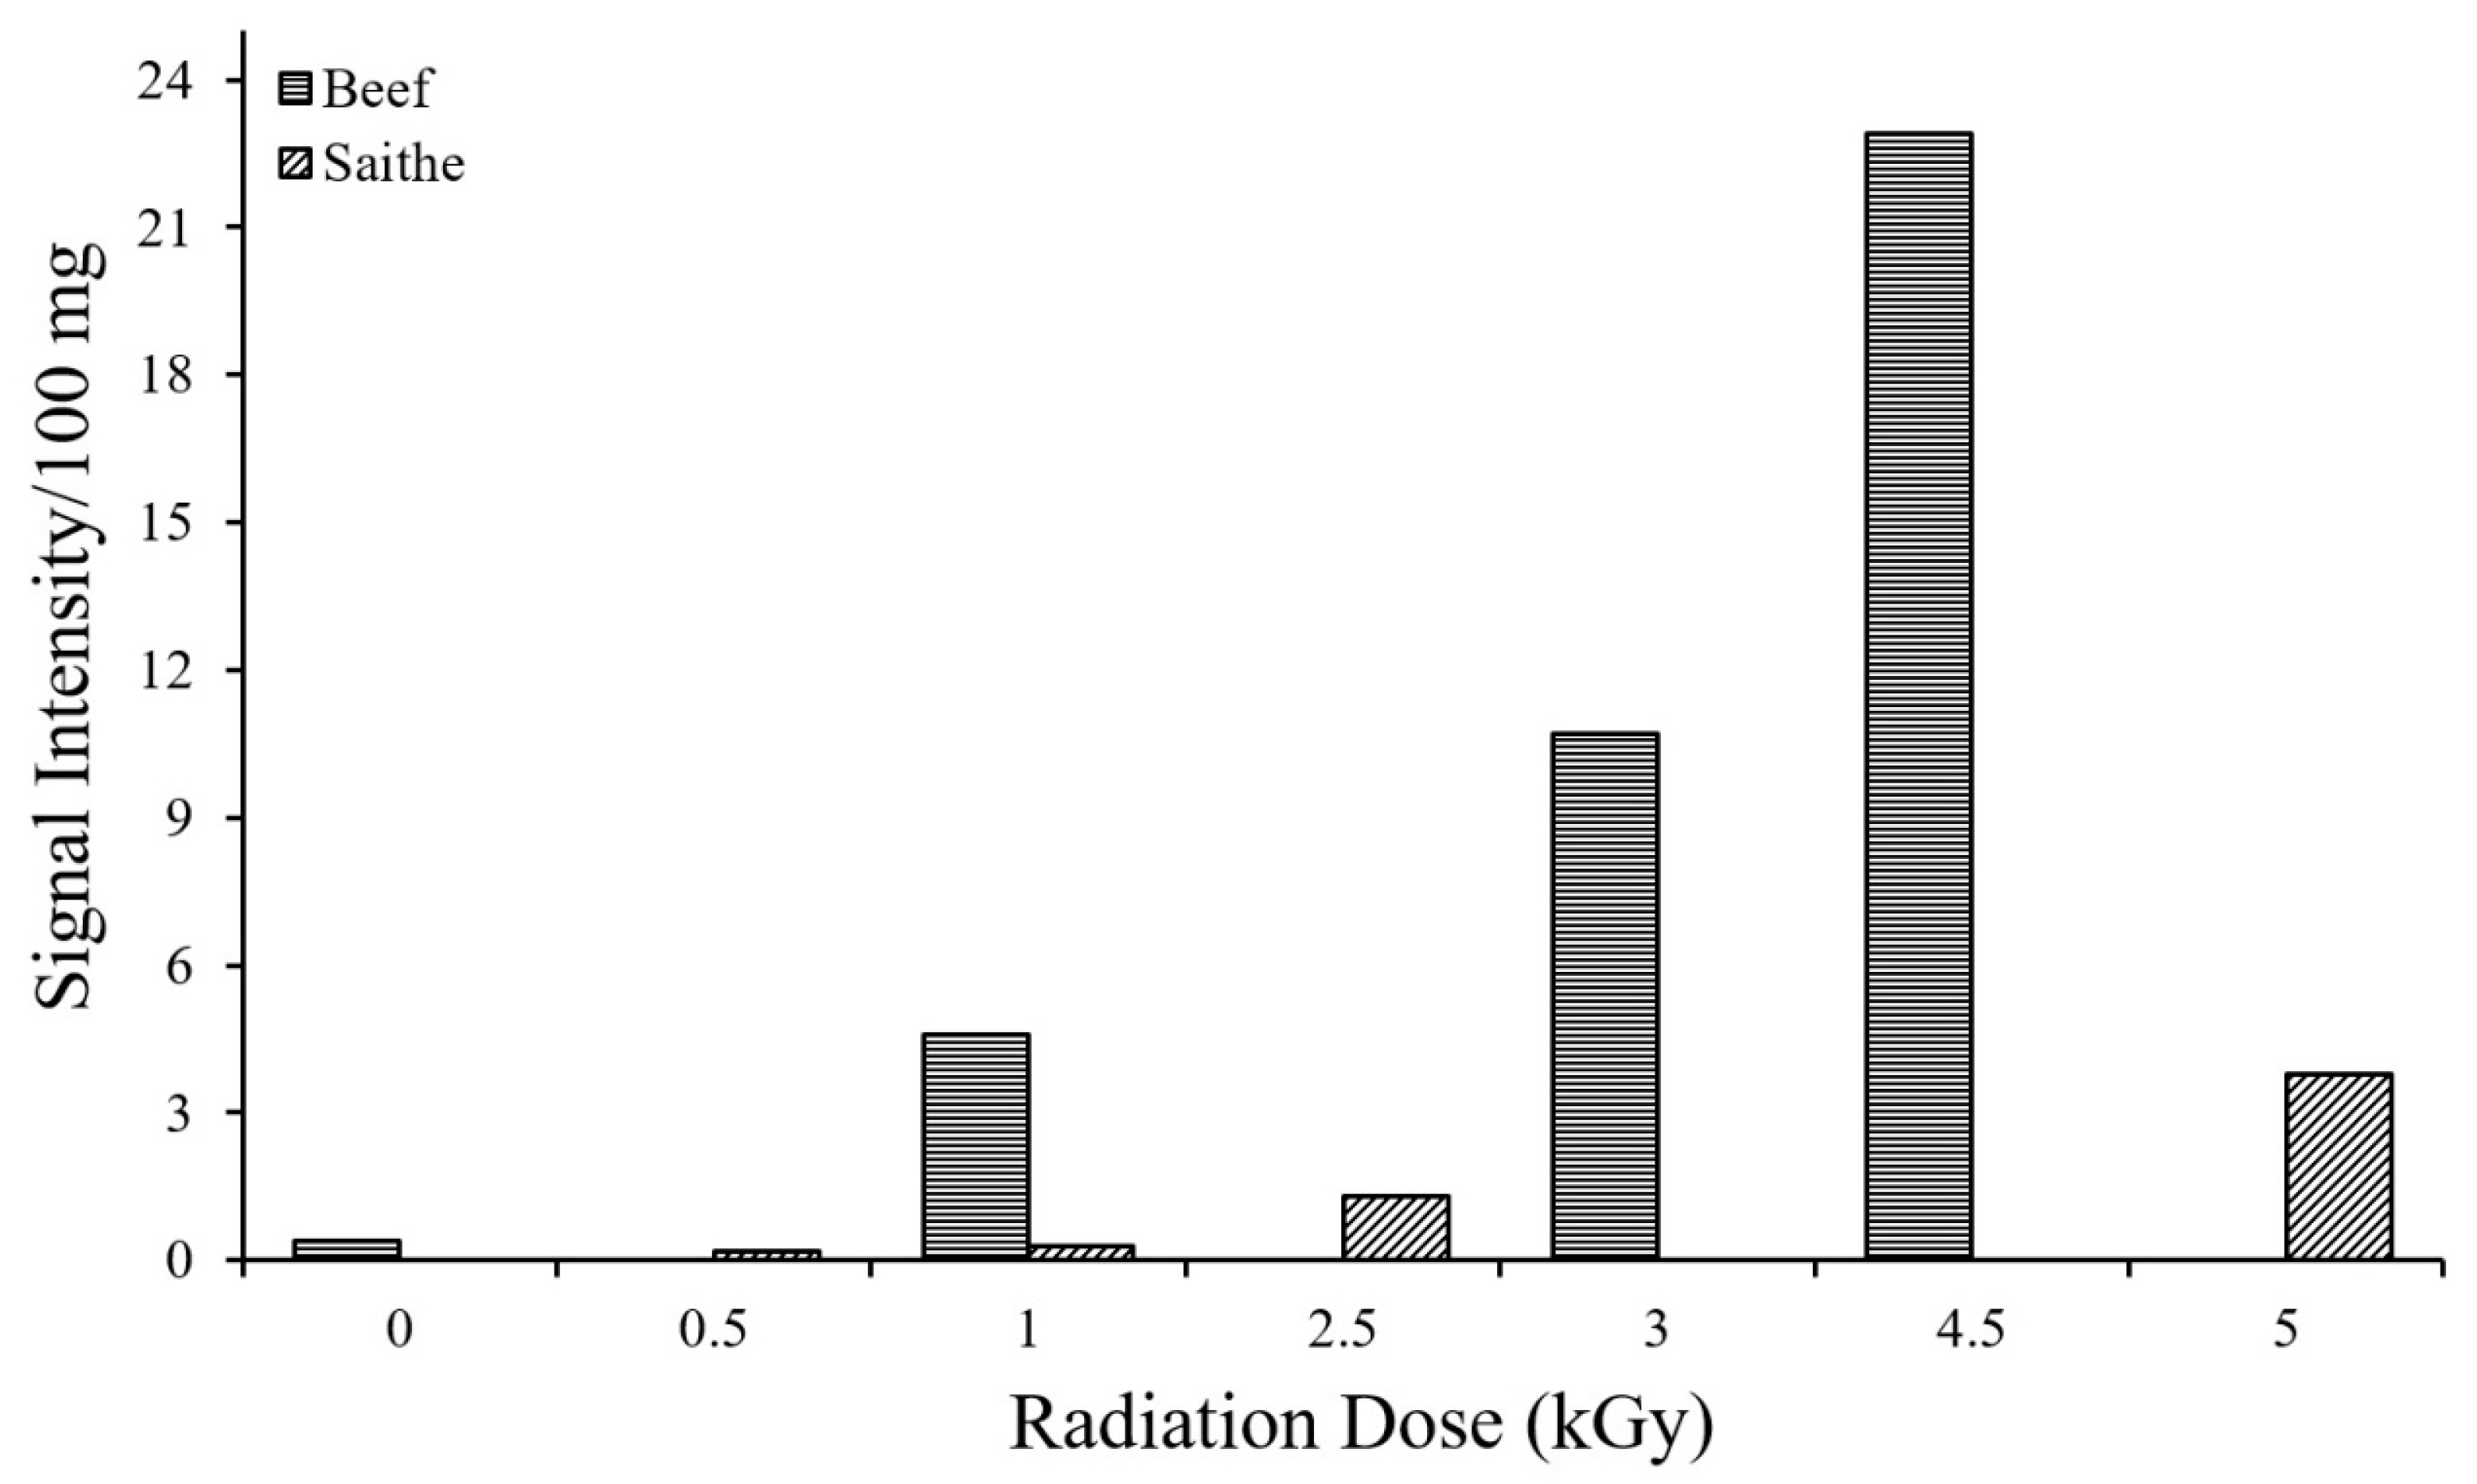
3.2. Identification of Irradiated Samples of Chicken, Beef, and Lamb’s Meat

Bones from beef, chicken, and lamb samples were used to detect radiation treatment, based on prior findings that bones are reliable indicators of long-lived, radiation-induced free radicals. This is attributed to the crystalline lattice structure of bone, which can trap such free radicals [20,21]. The presence of these radicals can be effectively detected using EPR spectroscopy. Similarly, radiation-induced free radicals are considered strong candidates for verifying irradiation treatment in mechanically deboned meat [14].
Chicken thigh bone samples were specifically analyzed to detect irradiation treatment. The EPR spectra of unirradiated (0 kGy) and irradiated samples (1.5 and 3 kGy) are shown in Figure 5. Distinct identification between unirradiated and irradiated samples was possible: the unirradiated samples exhibited a weak, symmetric EPR signal, whereas irradiated samples displayed strong, anisotropic (asymmetric) signals.
In samples irradiated at 1.5 kGy, a small, nonspecific signal appeared on the left side of the main signal, attributed to collagen, an inherent organic component of bone. The intensity of EPR signals in the irradiated samples (1.5 and 3 kGy) reflected the amount of absorbed radiation dose.
A comparison between unirradiated and 2.7 kGy-irradiated chicken samples is shown in Figure 6, clearly demonstrating differences in EPR signal patterns. To facilitate discrimination among unirradiated (0 kGy) and irradiated samples (1, 3, and 5 kGy), the overlaid spectra are presented in Figure 7, highlighting the distinct differences in EPR signal intensities corresponding to each dose level.
Bones from unirradiated and irradiated beef samples were analyzed to assess their potential for differentiation and identification based on radiation treatment. Bone samples exposed to radiation doses of 1, 3, and 4.5 kGy were subjected to EPR analysis. Measurements were performed after 15 days of storage at room temperature and repeated after 3 and 12 months of storage.
Unirradiated samples consistently displayed weak, symmetrical EPR signals with a g-value of 2.005 ± 0.001. In contrast, all irradiated samples exhibited strong, asymmetric (anisotropic) signals characterized by g1 = 2.002 ± 0.001 and g2 = 1.998 ± 0.001. The presence of these anisotropic signals served as a clear indication of irradiation in the bone samples.
The EPR spectra for unirradiated and irradiated beef bone samples (1 and 4.5 kGy) are presented in Figure 8. The results align well with the CEN protocol [19]. Moreover, the intensities of the asymmetric signals were proportional to the applied radiation doses, as illustrated in Figure 8. This linear relationship enables a rough estimation of the absorbed dose based on signal intensity. Similar dose-dependent linearity in EPR signal intensity has been reported for radiation doses up to 20–25 kGy in some earlier studies [22,23,24].
In the present study, for all applied radiation doses of 1, 3, and 4.5 kGy, the intensities of the EPR signals were found to be proportional to the absorbed dose. In earlier studies on irradiated bone samples, signals attributed to collagen have been reported in samples irradiated at doses of 2–3 kGy [25]. However, in the current study, no collagen-related signal was detected in samples irradiated at 3 and 4.5 kGy. This absence is likely due to the dominance of high-intensity asymmetric signals originating from hydroxyapatite-based free radicals, which may have masked much weaker collagen signals.
In contrast, a faint signal attributed to collagen was observed in the sample irradiated at 1 kGy. This finding is consistent with earlier work [25], which reported that bone samples irradiated at minimal doses (≤2–3 kGy) showed a combination of specific and nonspecific EPR signals, particularly when the bone marrow was not completely removed. Another study supported these observations by showing that the EPR spectra of irradiated bone samples are primarily composed of signals from hydroxyapatite (approximately 60%) along with contributions from remaining organic components such as collagen [26].
For lamb bone samples, EPR signals were recorded at absorbed radiation doses of 0, 0.5, and 1.5 kGy. The unirradiated bones exhibited symmetric signals with g-values identical to those observed in unirradiated beef bone samples. In all irradiated lamb bone samples, significant concentrations of paramagnetic centers were detected, indicated by the presence of asymmetric signals originating from hydroxyapatite-based free radicals. These signals confirmed that the lamb meat samples had undergone radiation treatment.
In samples irradiated at 0.5 and 1.5 kGy, the EPR spectra revealed a combination of nonspecific signals (attributed to collagen) and specific signals (from hydroxyapatite-based radicals). In the 1.5 kGy samples, the hydroxyapatite signal was more intense and clearly dominant compared to that in the 0.5 kGy samples.
These findings align with earlier studies, which have reported that at low radiation doses, signals from hydroxyapatite and organic components (such as collagen) may overlap. However, due to their distinct spectral characteristics, these signals can still be distinguished spectroscopically [26].
Lamb bone samples irradiated at minimal doses (0.5 and 1.5 kGy) were distinguishable from unirradiated samples based on the asymmetric nature of their EPR signals and the differences in g-values. As a result, the qualitative identification of irradiation treatment in these samples was straightforward.
It has been reported that the stable EPR signal observed in hydroxyapatite found in bones and teeth primarily originates from CO2 radical ions. Minor contributions also arise from other radicals, such as CO33−, CO3, and O [27]. Consequently, the experimental EPR signal reflects a composite spectrum formed by the overlapping signals of these radicals. Importantly, the EPR signal in bones remains stable over time, retaining its shape and intensity even after prolonged storage [28].
In this study, post-irradiation analyses of the EPR spectra were conducted after storage periods of three months and one year. These tests showed that the specific radiation-induced signals remained generally stable and predictable across these time intervals. However, some fading of the EPR signals was observed over time. Despite this, the results confirmed that qualitative identification of radiation treatment in lamb bones remained feasible for up to one year of storage.

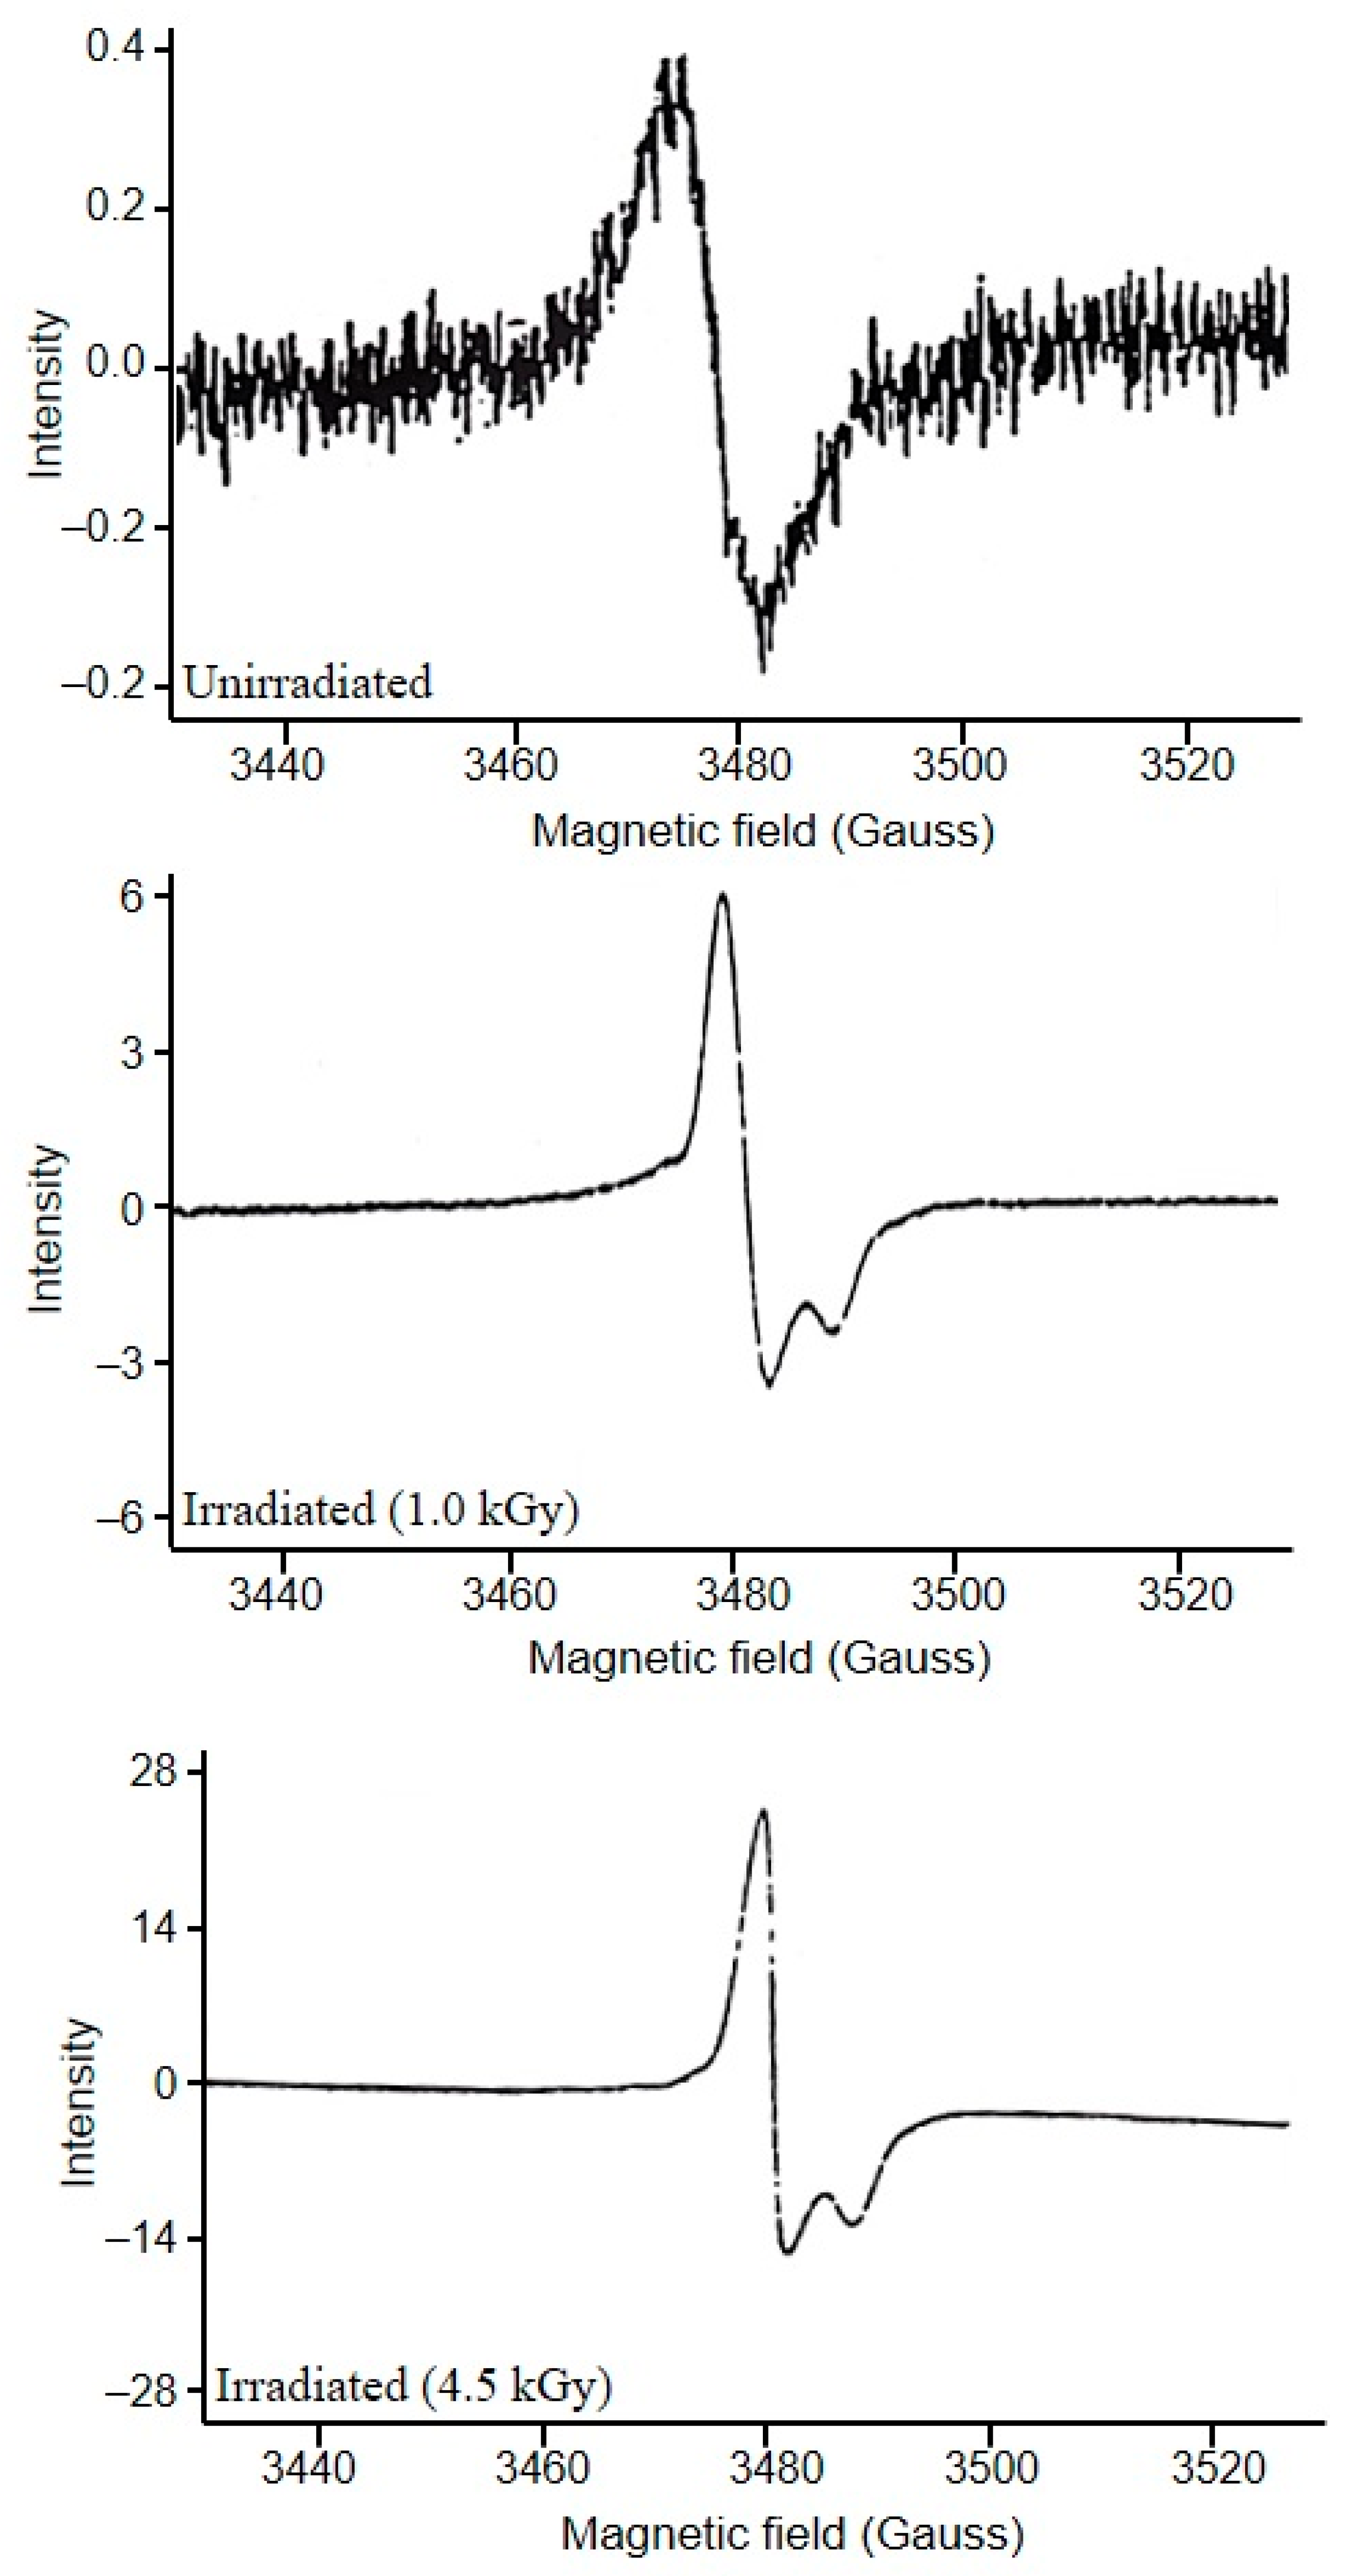
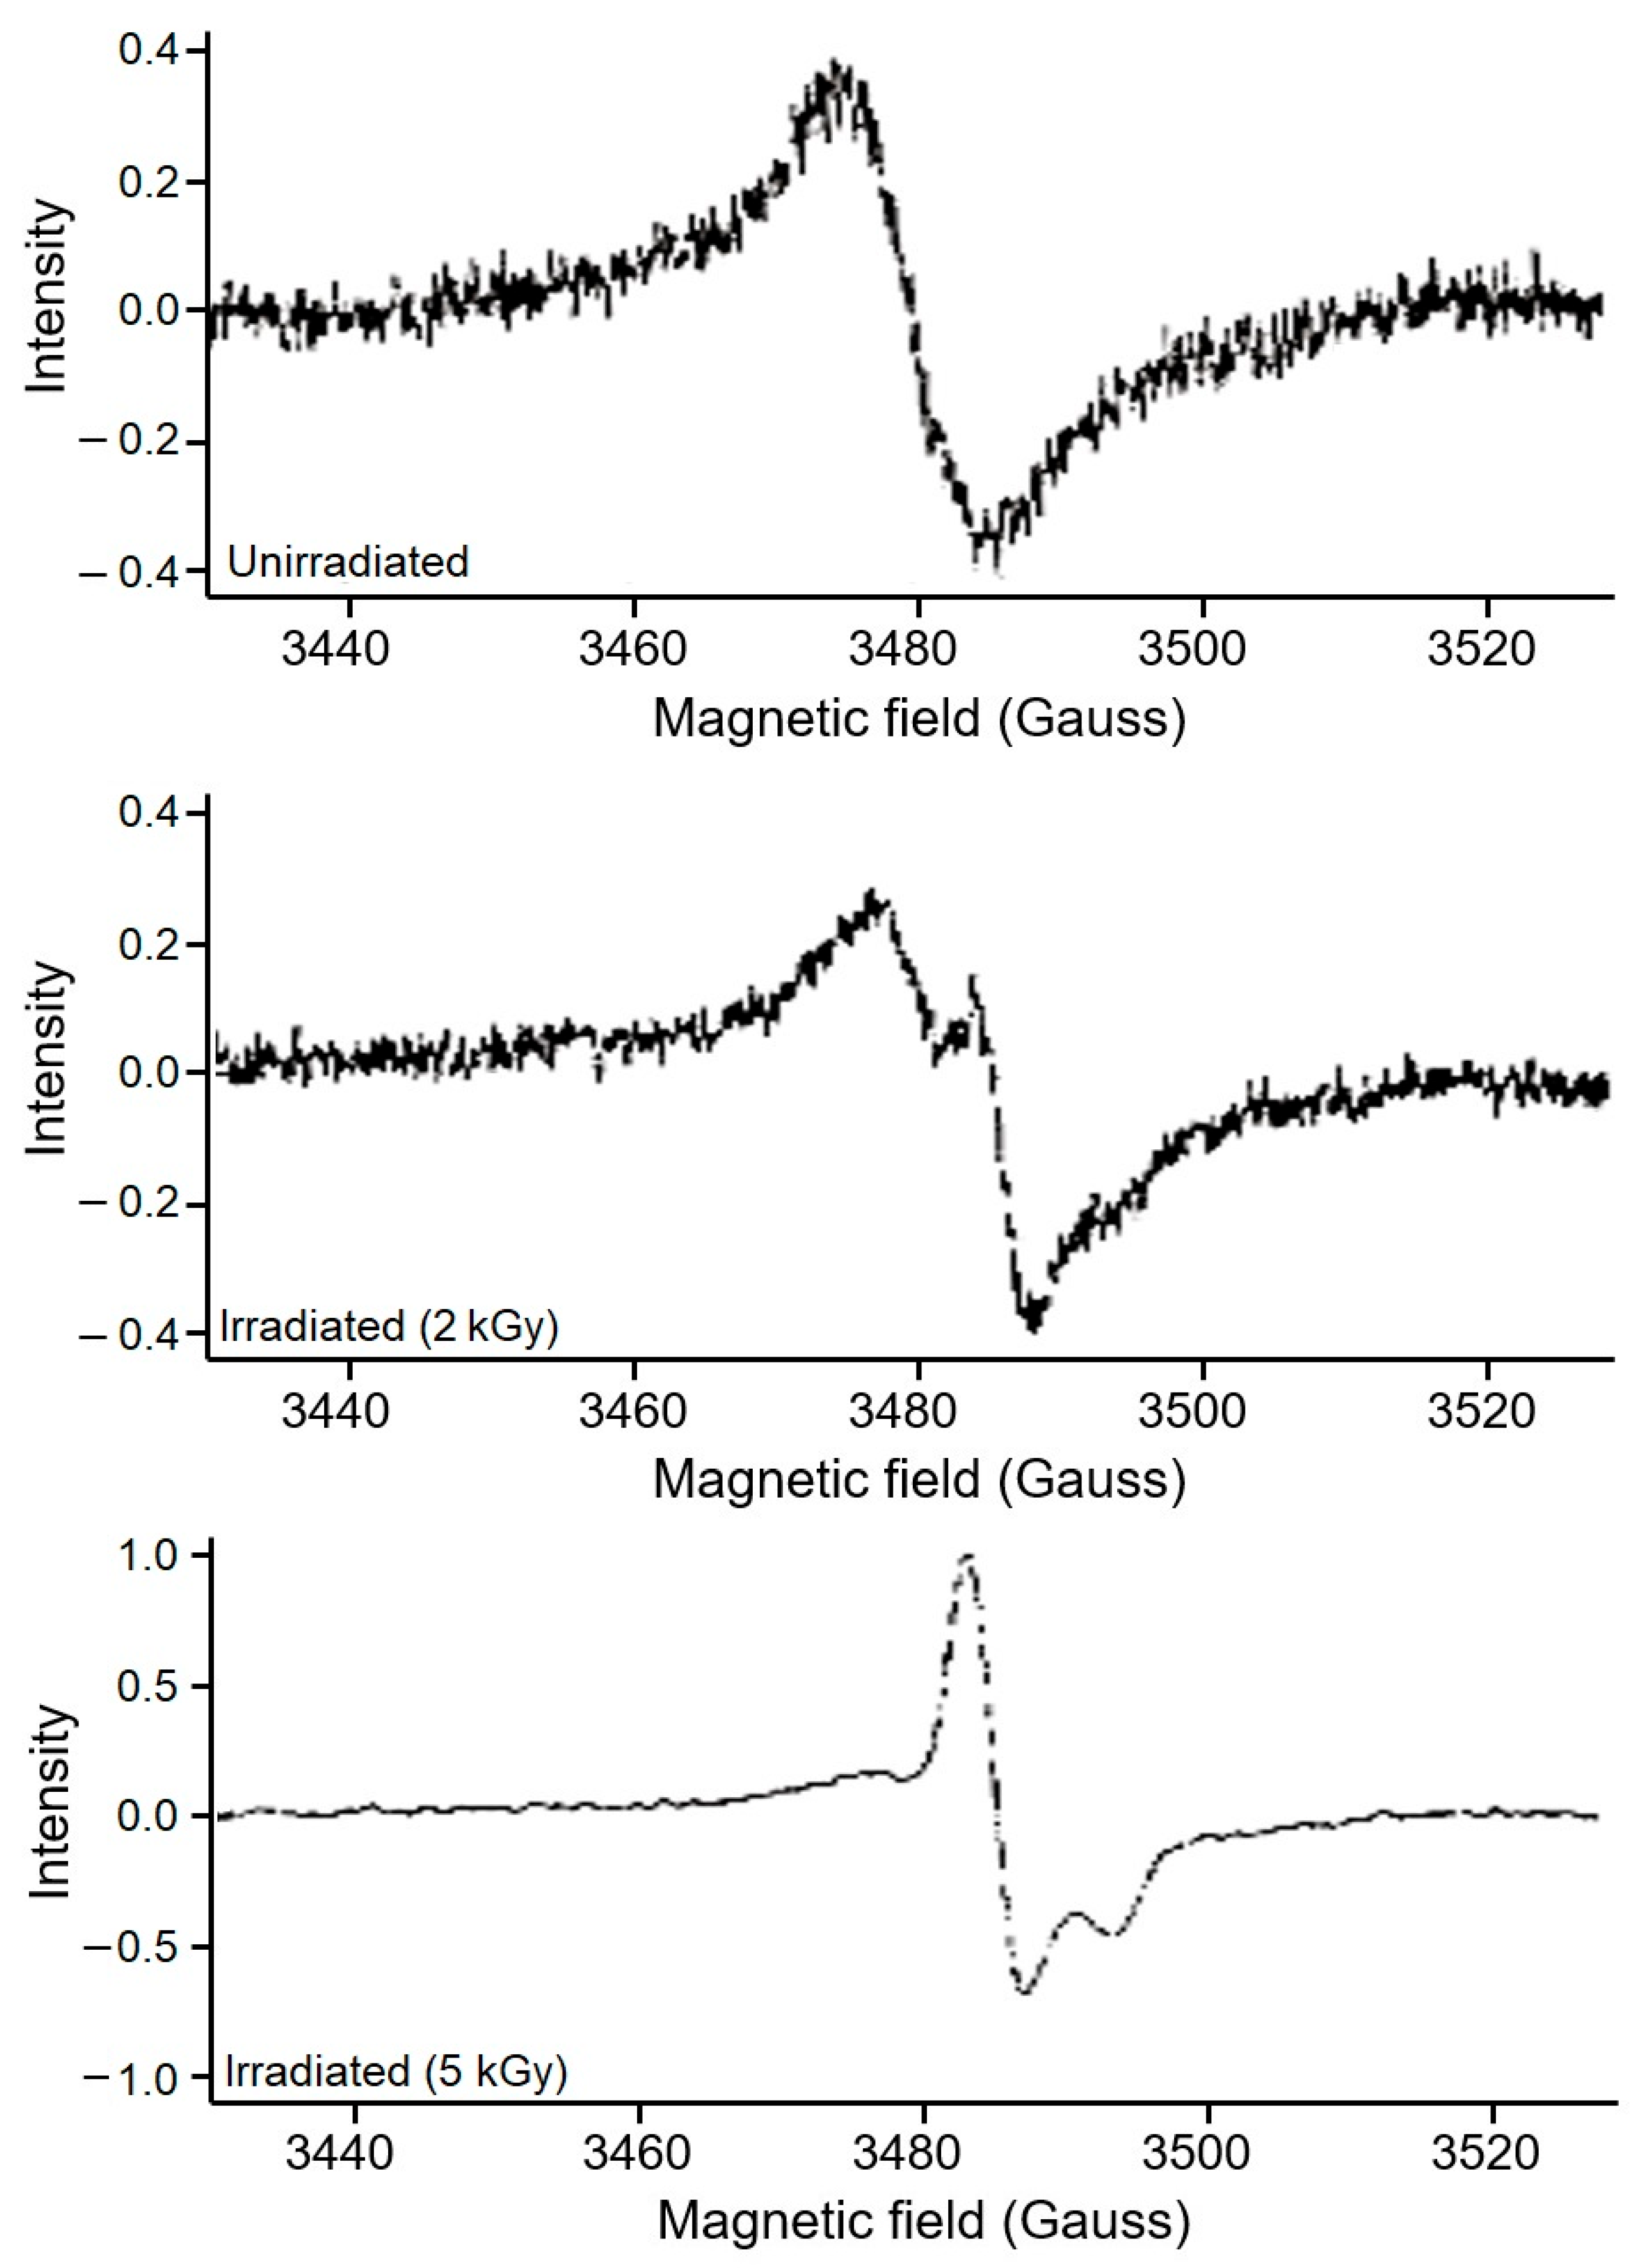
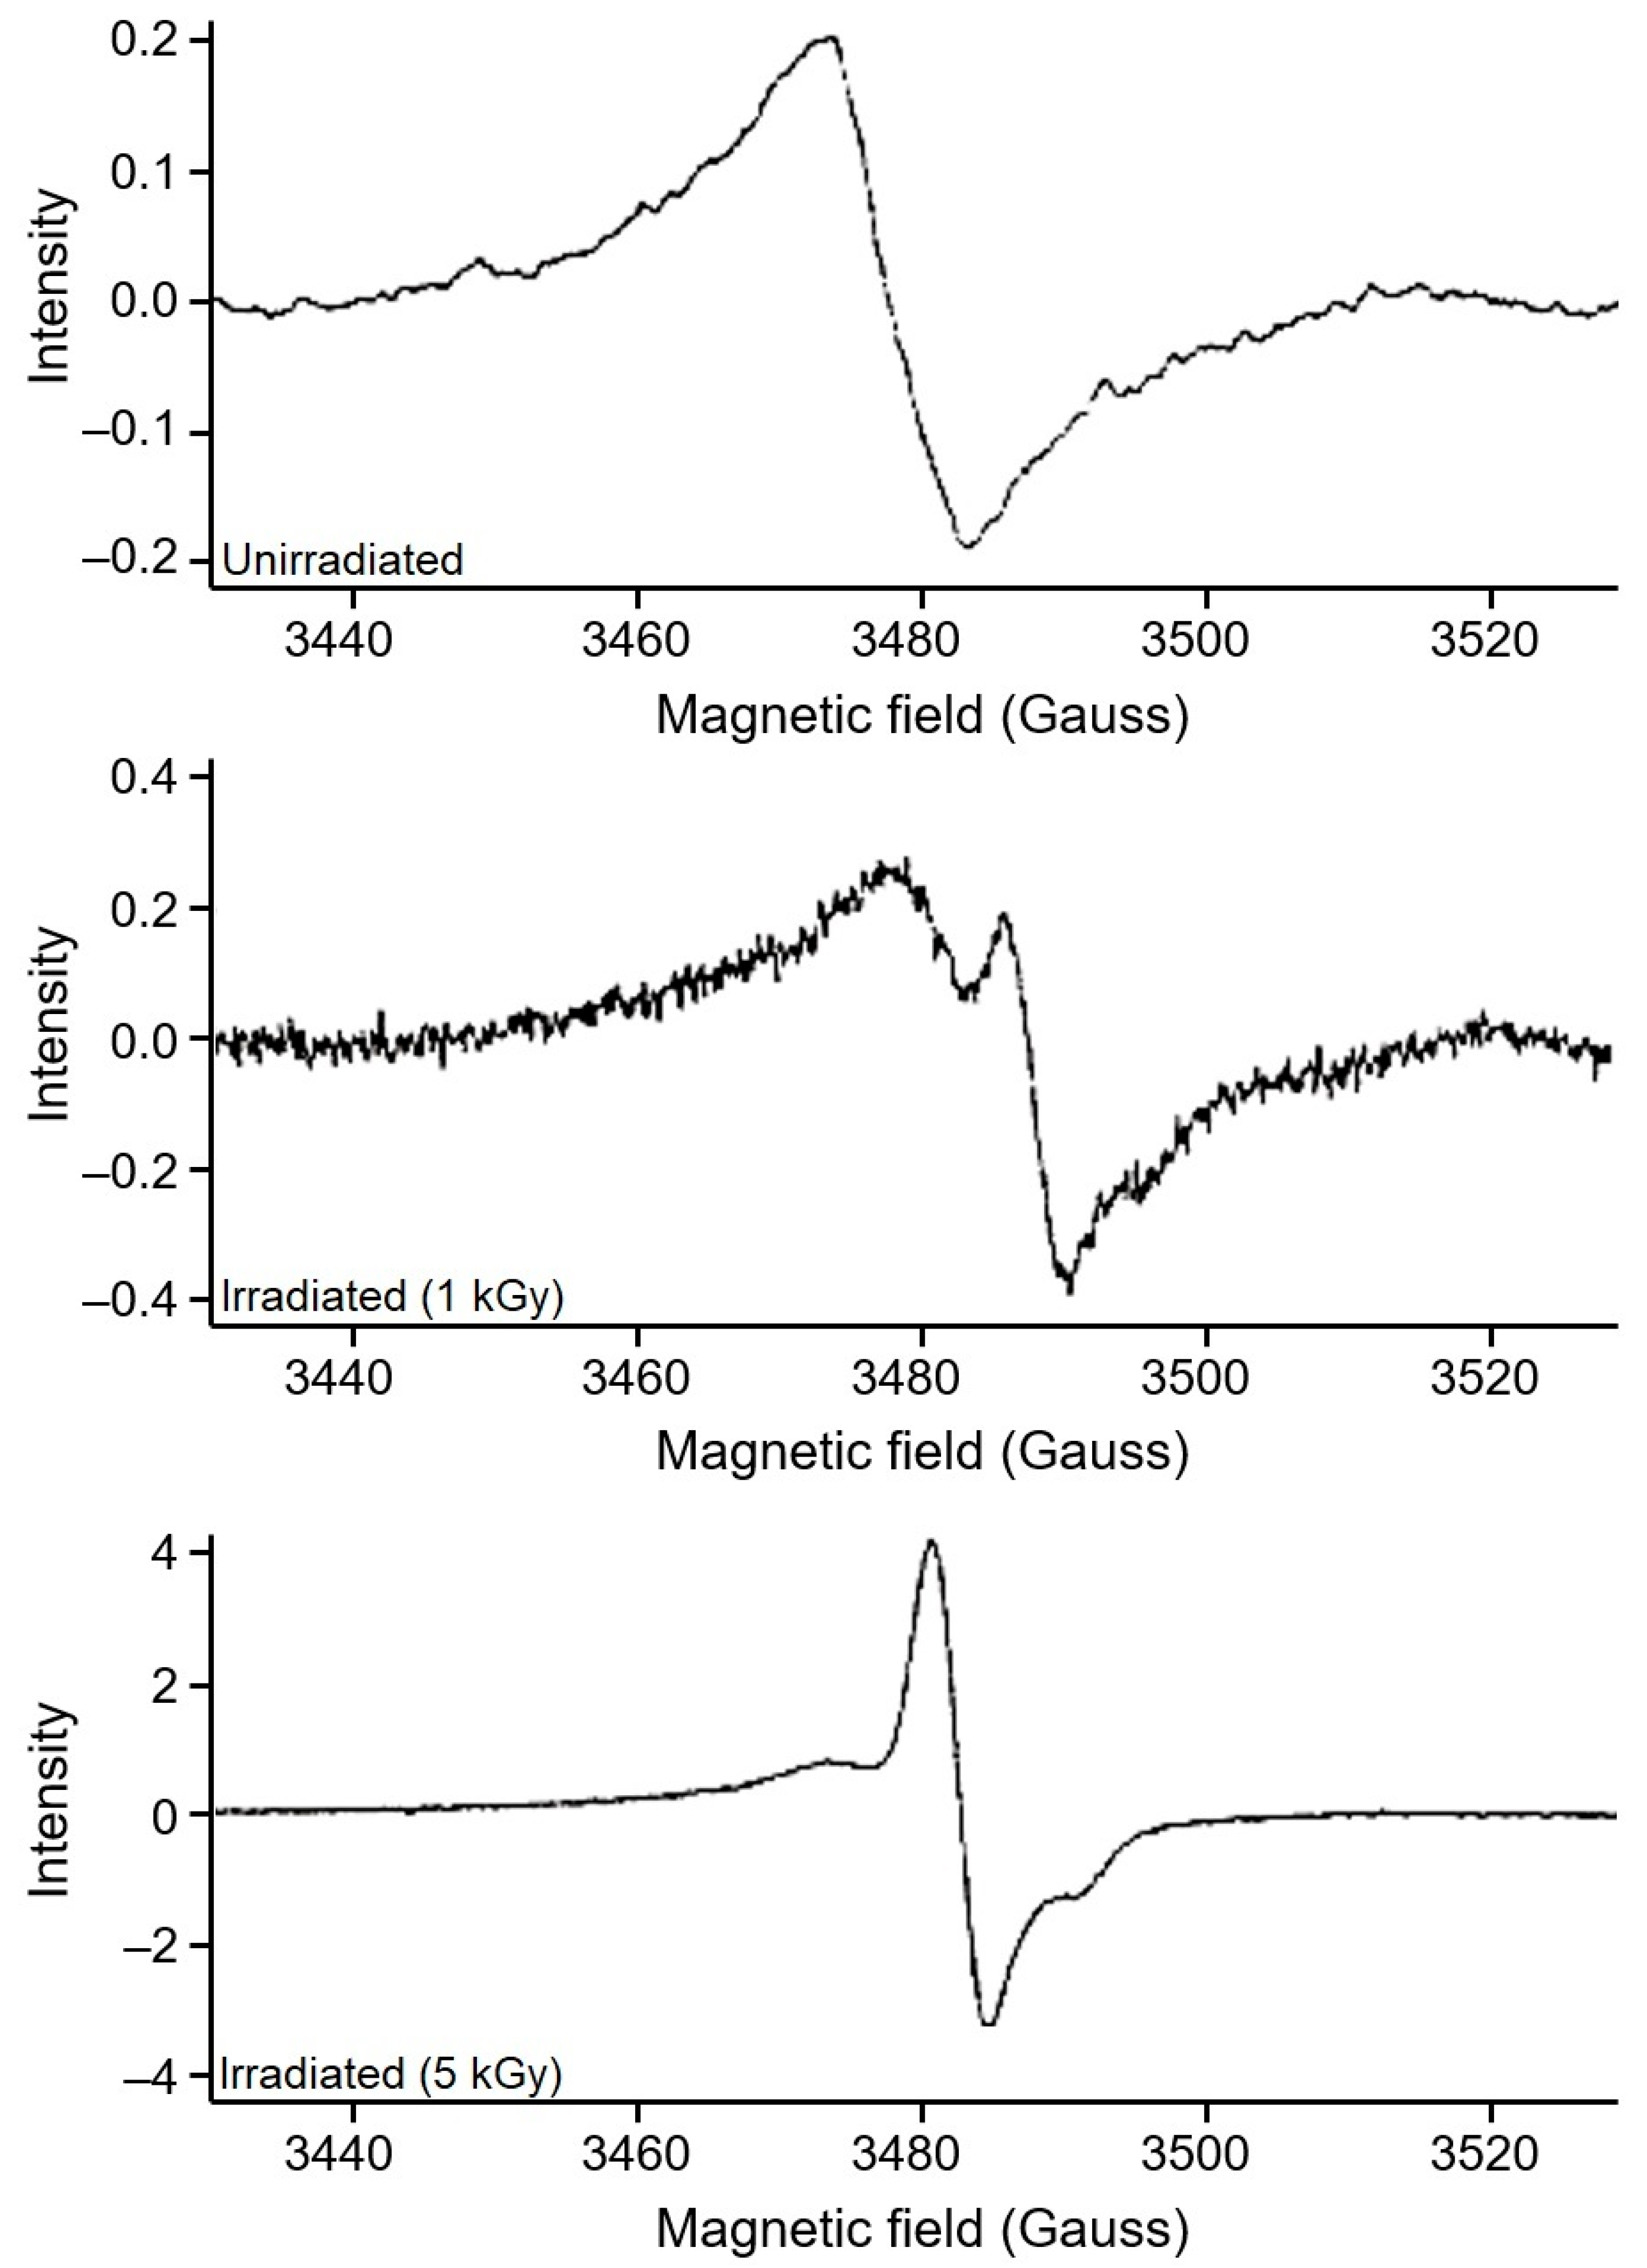
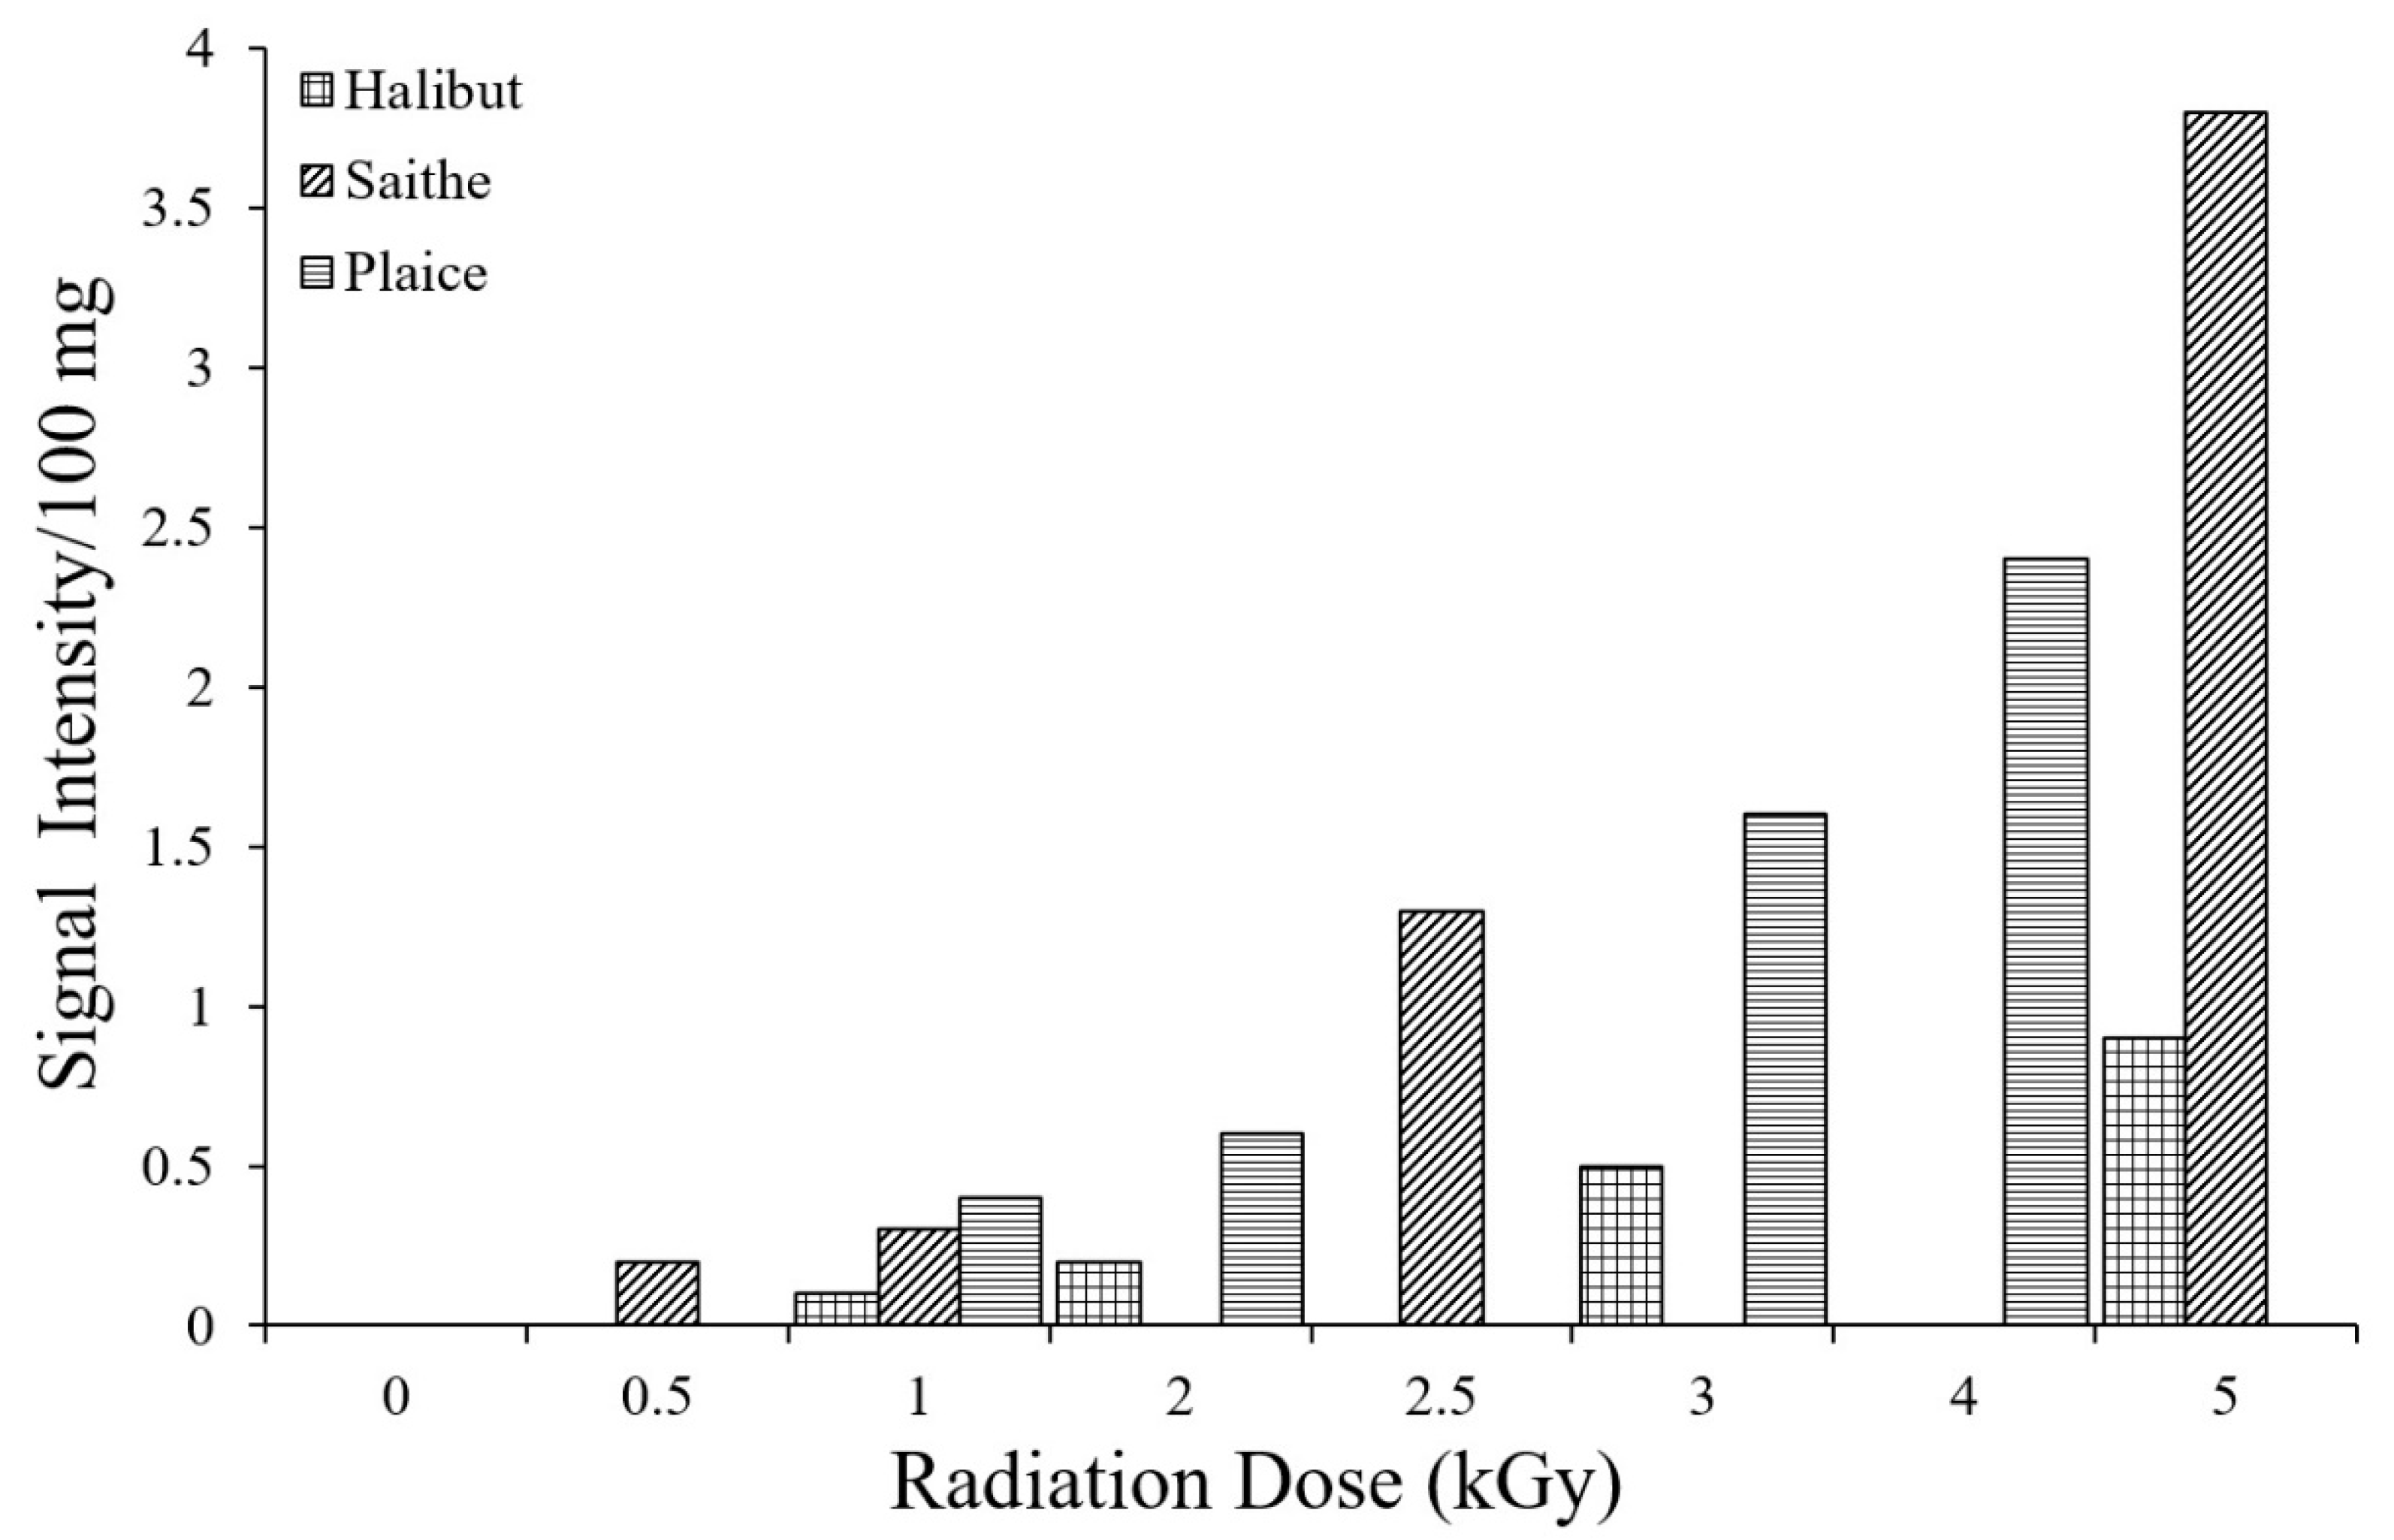
3.3. Identification of Irradiated Seafood

The unirradiated and irradiated samples of fish species such as plaice, halibut, saithe, and salmon were studied to identify evidence of irradiation treatment. In particular, the bones of both unirradiated and irradiated plaice samples were analyzed using EPR spectroscopy to determine the presence of radiation treatment.
The unirradiated samples exhibited typical symmetric signals with low intensities. The observed g-values and the symmetric nature of these signals indicated that the samples had not been exposed to ionizing radiation. In contrast, the samples irradiated at various doses showed more pronounced signals at higher doses (3 and 4 kGy). At lower doses (1 and 2 kGy), a combination of specific and unspecific signals was observed. This combination of signals, as noted in the present study, has also been reported previously. It has been suggested that, in the case of fish, complete removal of bone marrow from bone samples is difficult due to the low rigidity and crystallinity of the bone [25]. However, in this study, the asymmetric component of the combined signal was sufficient to provide evidence of radiation treatment. Therefore, it can be concluded that unirradiated and irradiated samples of plaice can be effectively identified using the EPR method.
In the case of halibut fish, the unirradiated samples showed typical low-intensity symmetric EPR signals, indicating the absence of radiation treatment. In contrast, the bone samples from irradiated fish, treated with absorbed radiation doses of 1 and 2 kGy, showed specific EPR signals, as illustrated in Figure 9. Although, these signals were not dominant compared to the nonspecific signals, they were clearly distinguishable due to their asymmetric nature.
The combined presence of specific and nonspecific signals was attributed to the bone marrow, which could not be completely removed from the weak and lean fish bones. For detection purposes, the g-values were found to be approximately g0~2.005 for unirradiated samples and g1~2.002 and g2~1.998 for irradiated ones. Thus, the differentiation between unirradiated and irradiated halibut samples, even at minimal radiation doses, was feasible based on g-value differences.
In samples irradiated at 3 or 5 kGy, the specific signals from hydroxyapatite radicals were much more intense, while collagen-based (nonspecific) signals appeared as small peaks to the left of the hydroxyapatite signals. Complete removal of organic matter from fish bones, by either physical or chemical methods, can further facilitate the detection of irradiated samples, even at low radiation doses. This finding is consistent with earlier studies that reported successful detection of radiation-induced changes at doses below 1 kGy in fish species with easily separable connective tissues. However, detection at such low doses was found to be difficult in fish like herring and sardines [29].
Analysis of EPR spectra from halibut fish samples irradiated at various doses showed that the intensity of specific signals correlated with the radiation dose applied. These dose-dependent variations were evident in the concentration of hydroxyapatite radicals in the irradiated samples. Moreover, the estimation of peak intensities was possible even at lower doses (1 and 2 kGy). It was observed that signal intensities for 2 and 5 kGy were generally higher than those at 1 kGy, confirming the dose-dependence of hydroxyapatite signal intensities. In conclusion, the EPR method enables clear differentiation between unirradiated and irradiated halibut fish samples, and is effective for identifying radiation treatment, even at low doses.
An EPR study was also conducted on saithe fish to detect differences between unirradiated and irradiated samples. A typical weak and symmetrical signal was observed in the unirradiated samples, indicating the absence of radiation treatment (Figure 10). In samples irradiated with minimal doses (0.5 and 1 kGy), the nonspecific signals attributed to collagen were more intense than the specific signals associated with hydroxyapatite radicals. Nevertheless, irradiation was detectable based on the asymmetric nature of the EPR signals at different doses.
Differentiation between irradiated and unirradiated samples was also possible using g-values, which were consistently distinct and characteristic for each group. The observed g-values were approximately g0~2.004 for unirradiated samples, and g1~2.002 and g2~1.998 for irradiated ones. Additionally, measuring the intensities of specific EPR signals from hydroxyapatite radicals provided insights into the radiation doses applied to the bone samples.
Similar results have been reported for blue jack mackerel, where weak nonspecific signals in control samples became more prominent at very low radiation doses, thereby contributing to a lower detection threshold [30]. At higher radiation doses (2.5 and 5 kGy), specific signals in the saithe fish samples were prominent, while nonspecific signals from organic matter (collagen) appeared as minor peaks, typically as shoulders on the left side of the specific signals, as shown in Figure 10. The intensities of the specific signals increased proportionally with the applied radiation dose [31].
The EPR method was also employed to identify radiation treatment in salmon fish. Similar to the results for saithe fish, a typical weak and symmetrical signal was observed in the unirradiated samples. In contrast, the EPR spectra of bone samples from irradiated salmon exhibited asymmetric signals along with nonspecific signals at all applied radiation doses.
This combination of specific signals (from hydroxyapatite-based radicals) and nonspecific signals (attributed to collagen) was observed even in samples irradiated at higher doses (2.5 and 5 kGy). Interestingly, the intensities of the nonspecific signals were greater than those of the specific signals at these higher doses. This was attributed to the presence of bone marrow and other organic matter, which could not be effectively removed from the salmon bones. Although mild heating (using a microwave oven) was applied in an attempt to remove connective tissue and bone marrow, complete separation of organic matter was not achieved in this study.
Nevertheless, the presence of asymmetric signals indicated that the samples had undergone radiation treatment. While the specific signals were not as intense as the nonspecific ones, their relative intensities still provided some insight into the radiation dose applied. Furthermore, the g-values of the asymmetric signals could be used for qualitative identification of irradiation. The observed g-values, g1~2.002 and g2~1.998, were consistent with those typically reported for anisotropic signals in irradiated bone samples. In conclusion, the detection of radiation treatment in salmon fish was possible at all tested dose levels based on the presence of asymmetric EPR signals and the identification of characteristic g-values.
A comparative investigation was conducted to study the strength of EPR signals from bone samples of different fish species (plaice, saithe, and halibut), as shown in Figure 11. The signal intensities observed for saithe were stronger than those recorded for plaice and halibut. These differences in signal intensity may be attributed to variations in the crystalline structure of bone among different fish species.
Similarly, a notable difference in EPR signal strength was observed between bone samples from beef and saithe, as shown in Figure 12. The EPR signals from beef bones were significantly more intense, likely due to the highly dense crystalline structure of beef bone compared to that of saithe fish.

4. Conclusions

The EPR spectroscopic method was employed to detect radiation treatment in various food samples, including beef, chicken, lamb, and different fish species. Unirradiated and irradiated samples exhibited distinct EPR signal patterns: a weak, symmetric signal in unirradiated samples and a strong, asymmetric signal in irradiated samples. The symmetric signal, characteristic of unirradiated bone-containing samples, displayed a g-value of 2.005 ± 0.001. In contrast, the asymmetric signals typical of irradiated samples showed g-values of g1 = 2.002 ± 0.001 and g2 = 1.998 ± 0.001.
In irradiated beef, chicken, and lamb bone samples, the asymmetric signals were intense, with minimal or absent side peaks from collagen, which appeared only as minor features. In irradiated fish samples, however, the intensity of specific EPR signals was lower compared to those of beef, chicken, and lamb. This difference was attributed to the lower crystallinity of fish bones.
At minimal radiation doses (≤3 kGy), the nonspecific collagen signal often dominated over the specific signal in fish samples. Nevertheless, discrimination between unirradiated and irradiated fish samples remained feasible, based on differences in signal shape and g-values, even at low radiation dose levels.

Author Contributions

Conceptualization, A.A.K.; methodology, A.A.K.; software, M.K.S.; formal analysis, M.K.S.; investigation, A.A.K.; data curation, A.A.K. and M.K.S.; writing—original draft preparation, A.A.K.; writing—review and editing, M.K.S. All authors have read and agreed to the published version of the manuscript.

Funding

This research received no external funding.

Data Availability Statement

The original contributions presented in this study are included in the article. Further inquiries can be directed to the corresponding author.

Acknowledgments

We are grateful to Henry Delincée of the Federal Research Centre for Nutrition and Physiology (at present the Max-Rubner Institute), Karlsruhe, Germany for providing facilities to complete this research work. One of the authors, Ashfaq A. Khan, is grateful to the Ministry of Science and Technology, Pakistan for the grant of an S&T fellowship.

Conflicts of Interest

The authors declare no conflicts of interest.

References

  1. Sahoo, M.; Aradwad, P.; Panigrahi, C.; Kumar, V.; Naik, S.N. Irradiation of Food. In Novel Technologies in Food Science; Wiley: Hoboken, NJ, USA, 2023; pp. 333–373. ISBN 9781119776376. [Google Scholar]
  2. Srinivasa, U.M.; Sruthi, P.; Rastogi, N.K.; Naidu, M.M. Application of Irradiation in the Food Industry. In A Volume in Unit Operations and Processing Equipment in the Food Industry; Jafari, S.M., Therdthai, N., Eds.; Woodhead Publishing: Cambridge, UK, 2023; pp. 221–253. ISBN 978-0-12-818717-3. [Google Scholar]
  3. Tahergorabi, R.; Matak, K.E.; Jaczynski, J. Application of Electron Beam to Inactivate Salmonella in Food: Recent Developments. Food Res. Int. 2012, 45, 685–694. [Google Scholar] [CrossRef]
  4. Farkas, J.; Mohácsi-Farkas, C. History and Future of Food Irradiation. Trends Food Sci. Technol. 2011, 22, 121–126. [Google Scholar] [CrossRef]
  5. Khan, A.A.; Shahid, M.K. Detection of Radiation Treatment of Spices Using Electron Spin Resonance Spectroscopy Technique. J. Spices Aromat. Crops 2021, 30, 107–116. [Google Scholar] [CrossRef]
  6. Swallow, A.J. Can We Tell If Our Food Has Been Irradiated. Chem. Br. 1988, 24, 102–103. [Google Scholar]
  7. Vazirov, R.A.; Narkhova, A.A.; Vazirova, E.N.; Sokovnin, S.Y. Electron Paramagnetic Resonance Signal in Wheat Seeds Irradiated with Low-Energy Electron Beam. Radiat. Phys. Chem. 2023, 208, 110934. [Google Scholar] [CrossRef]
  8. Coghlan, A. Irradiated Food: Too Hot to Handle? New Sci. 1990, 125, 28–29. [Google Scholar]
  9. Vazirov, R.A.; Sokovnin, S.Y.; Agdantseva, E.N.; Tsmokalyuk, A.N. Investigation of Radiation-Induced Electron Paramagnetic Resonance Signal of an Eggshell after Electron Beam Irradiation. Radiat. Phys. Chem. 2022, 192, 109882. [Google Scholar] [CrossRef]
  10. Roessler, M.M.; Salvadori, E. Principles and Applications of EPR Spectroscopy in the Chemical Sciences. Chem. Soc. Rev. 2018, 47, 2534–2553. [Google Scholar] [CrossRef]
  11. Murrieta, H.S.; Muñoz, E.P.; Adem, E.; Burillo, G.; Vazquez, M.; Cabrera, E.B. Effect of Irradiation Dose, Storage Time and Temperature on the ESR Signal in Irradiated Oat, and Corn and Wheat. Appl. Radiat. Isot. 1996, 47, 1657–1661. [Google Scholar] [CrossRef]
  12. Korkmaz, M.; Polat, M. Free Radical Kinetics of Irradiated Durum Wheat. Radiat. Phys. Chem. 2000, 58, 169–179. [Google Scholar] [CrossRef]
  13. Fontanesi, L. Meat Authenticity and Traceability. In Woodhead Publishing Series in Food Science, Technology and Nutrition; Toldra’, F., Eighth, E., Eds.; Woodhead Publishing: Cambridge, UK, 2017; pp. 585–633. ISBN 978-0-08-100694-8. [Google Scholar]
  14. Tomaiuolo, M.; Chiaravalle, A.E.; Mangiacotti, M.; Petrella, A.; Di Taranto, A.; Iammarino, M. Innovative Techniques for Identifying a Mechanically Separated Meat: Sample Irradiation Coupled to Electronic Spin Resonance. Eur. Food Res. Technol. 2019, 245, 2331–2341. [Google Scholar] [CrossRef]
  15. Marchioni, E.; Horvatovich, P.; Charon, H.; Kuntz, F. Detection of Irradiated Ingredients Included in Low Quantity in Non-Irradiated Food Matrix. 2. ESR Analysis of Mechanically Recovered Poultry Meat and TL Analysis of Spices. J. Agric. Food Chem. 2005, 53, 3774–3778. [Google Scholar] [CrossRef] [PubMed]
  16. Chauhan, S.K.; Kumar, R.; Nadanasabapathy, S.; Bawa, A.S. Detection Methods for Irradiated Foods. Compr. Rev. Food Sci. Food Saf. 2009, 8, 4–16. [Google Scholar] [CrossRef]
  17. Guzik, G.P.; Stachowicz, W. Advanced Analytical Methods for the Detection of Irradiated Foods. In Advanced Spectroscopic Techniques for Food Quality; Royal Society of Chemistry: London, UK, 2022; Volume 32, p. 80. ISBN 978-1-83916-404-0. [Google Scholar]
  18. Khan, A.A.; Shahid, M.K. Identification of Radiation Processing of Different Plant Foods of Pakistan Origin Using the Rapid Technique of Electron Spin Resonance (ESR) Spectrometry. Radiat. Phys. Chem. 2022, 204, 110667. [Google Scholar] [CrossRef]
  19. EN1786; Detection of Irradiated Food Containing Bone, Method by ESR Spectroscopy. European Committee for Standardization: Brussels, Belgium, 1996.
  20. Bessalah, S.; Jebahi, S.; Faraz, A.; Raoufi, A.; Tirink, C.; Dridi, W.; Daouad, M.; Keskes, H.; Khorchani, T.; Farah, K. Effect of Gamma Radiation on Novel Gelatin Extracted from Camel Skin for Pharmaceutical Application. Pak. J. Zool. 2023, 55, 819. [Google Scholar] [CrossRef]
  21. Kalinnikova, E.; Sadovnikova, M.; Rodionov, A.; Murzakhanov, F.; Grishin, P. Analysis of the Osseointegration Process of Dental Implants by Electron Paramagnetic Resonance: An In Vivo Study. Dent. J. 2022, 10, 28. [Google Scholar] [CrossRef]
  22. Escudero, R.; Segura, J.; Velasco, R.; Valhondo, M.; Romero de Ávila, M.D.; Garcia-Garcia, A.B.; Cambero, M.I. Electron Spin Resonance (ESR) Spectroscopy Study of Cheese Treated with Accelerated Electrons. Food Chem. 2019, 276, 315–321. [Google Scholar] [CrossRef]
  23. Leonor, S.J.; Gómez, J.A.; Kinoshita, A.; Calandreli, I.; Tfouni, E.; Baffa, O. ESR Spectroscopic Properties of Irradiated Gum Arabic. Food Chem. 2013, 141, 1860–1864. [Google Scholar] [CrossRef]
  24. Marciniec, B.; Stawny, M.; Kozak, M.; Naskrent, M. The Influence of Radiation Sterilization on Thiamphenicol. Spectrochim. Acta Part A Mol. Biomol. Spectrosc. 2008, 69, 865–870. [Google Scholar] [CrossRef]
  25. Raffi, J.; Stocker, P. Electron Paramagnetic Resonance Detection of Irradiated Foodstuffs. Appl. Magn. Reson. 1996, 10, 357–373. [Google Scholar] [CrossRef]
  26. Desrosiers, M.F. Current Status of the EPR Method to Detect Irradiated Food. Appl. Radiat. Isot. 1996, 47, 1621–1628. [Google Scholar] [CrossRef] [PubMed]
  27. Guzik, G.P.; Stachowicz, W.; Michalik, J. Aspects of the EPR Study on Mineralized Tissues as Related to Medicine, Dosimetry, and Dating. In Experimental Methods in the Physical Sciences; Shukla, A.K., Ed.; Academic Press: Cambridge, MA, USA, 2019; Volume 50, pp. 115–127. ISBN 1079-4042. [Google Scholar]
  28. Chawla, S.P.; Thomas, P.; Bongirwar, D.R. Factors Influencing the Yield of Radiation Induced Electron Spin Resonance (ESR) Signal in Lamb Bones. Food Res. Int. 2002, 35, 467–473. [Google Scholar] [CrossRef]
  29. Minea, R.; Pascanu, S. Identification of Irradiated Foods I Detection Methods Based on Physical Changes Induced by Irradiation in the Food Samples. Rom. Rep. Phys. 1996, 49, 107–131. [Google Scholar]
  30. Empis, J.M.A.; Silva, H.A.; Nunes, M.L.; Andrade, E.M. Detection of Irradiated Fish Using EPR of Fish Bone; Signal Intensity and Stability. Fish. Res. 1995, 21, 471–475. [Google Scholar] [CrossRef]
  31. Salama, E.; Sami, A.; Mansour, A.; Maghraby, A. EPR study of irradiated bovine bone: Application to radiation dosimetry. Radiat. Eff. Defects Solids 2025, 1–8. [Google Scholar] [CrossRef]
Figure 1. Schematic illustration of EPR apparatus.
Physchem 05 00024 g001
Figure 2. Schematic illustration of a resonant cavity with the inserted sample.
Physchem 05 00024 g002
Figure 3. EPR spectrum of controlled chicken’s thigh bone swept at g-values to show the location of gsym.
Physchem 05 00024 g003
Figure 4. EPR spectrum of irradiated chicken’s thigh bone swept at g-values to show the locations of g1 and g2 (parallel to each other).
Physchem 05 00024 g004
Figure 5. EPR spectra of the samples of bones from chicken thigh.
Physchem 05 00024 g005
Figure 6. Overlying EPR signals of chicken thigh bone for control and irradiated samples.
Physchem 05 00024 g006
Figure 7. Overlying EPR signals of chicken thigh bone for unirradiated sample and samples irradiated to 1, 3, and 5 kGy.
Physchem 05 00024 g007
Figure 8. EPR spectra of the samples of bone from beef, unirradiated and irradiated to 1 and 4.5 kGy.
Physchem 05 00024 g008
Figure 9. EPR spectra of the samples of the bones of halibut fish unirradiated and irradiated to 2 and 5 kGy.
Physchem 05 00024 g009
Figure 10. EPR spectra of the samples of the bones of saithe fish, unirradiated and irradiated to 1 and 5 kGy.
Physchem 05 00024 g010
Figure 11. A comparison of EPR signal intensities of bone samples of different fish irradiated to different doses of radiation.
Physchem 05 00024 g011
Figure 12. A comparison of EPR signal intensities of bone samples of beef and saithe fish irradiated to different doses of radiation.
Physchem 05 00024 g012
Table 1. The permissible range of absorbed radiation doses used for different food samples.
Type of FoodAbsorbed Radiation Doses (kGy)
Beef0, 1, 3, 4.5
Chicken0, 1, 1.5, 2.7, 3, 5
Meat of Lamb0, 0.5, 1.5
Halibut fish0, 1, 2, 3, 5
Plaice fish0, 1, 2, 3, 4
Saithe fish0, 0.5, 1, 2.5, 5
Salmon fish0, 0.5, 1, 2.5, 5
Table 2. The spectrometric settings utilized for all food samples containing bones.
Spectrometric SettingsValues
Microwave radiation
Microwave frequency9.78 GHz.
Microwave power9.95 mW
Magnetic field
Centre field348 mT (3480 Gauss)
Sweep width10 mT (100 Gauss)
Signal Channel
Modulation frequency50 kHz
Modulation amplitude0.4 mT (4 Gauss)
Time constant (Filter t.c)10.24 ms (bones)
40.96 ms (fish bones)
Sweep time42 s/sweep (bones)
84 s/sweep (fish bones)
No of sweeps5 (bones)
10 (fish bones)
Receiver gain50 dB (bones)
60 dB (fish bones)
TemperatureRoom temperature
Disclaimer/Publisher’s Note: The statements, opinions and data contained in all publications are solely those of the individual author(s) and contributor(s) and not of MDPI and/or the editor(s). MDPI and/or the editor(s) disclaim responsibility for any injury to people or property resulting from any ideas, methods, instructions or products referred to in the content.

