1. Introduction
Severe acute respiratory syndrome coronavirus 2 (SARS-CoV-2), the causative agent of the COVID-19 pandemic, has posed an unprecedented global health challenge since its emergence in late 2019. As a member of the Coronaviridae family, SARS-CoV-2 is characterized by a single-stranded RNA genome and a structural architecture comprising four main proteins: Spike (S), Envelope (E), Membrane (M), and Nucleocapsid (N) [
1]. Among these, the Spike protein plays a pivotal role in viral entry, mediating attachment to the host cell receptor, angiotensin-converting enzyme 2 (ACE2), and facilitating membrane fusion [
2,
3].
The receptor-binding domain (RBD) of the Spike protein is central to viral infectivity, determining host range by directly engaging ACE2. As such, the RBD is a primary target for vaccine development, neutralizing antibodies, and antiviral therapies [
4,
5,
6]. However, the rapid emergence of SARS-CoV-2 variants of concern (VOCs), including Alpha, Beta, Gamma, Delta, and Omicron, has demonstrated the virus’s ability to adapt through mutations in the Spike protein, particularly within the RBD [
7,
8]. These VOCs have severely enhanced COVID-19’s transmissibility and immune evasion, complicating global efforts to control the pandemic [
9].
First identified in November 2021, the Omicron (BA.1) variant has rapidly become the dominant SARS-CoV-2 strain worldwide, attributed to its extraordinary transmissibility and capacity for immune evasion [
10,
11]. The Omicron Spike protein contains 30 mutations, 15 of which are localized in the RBD, where they directly affect ACE2 binding [
12].
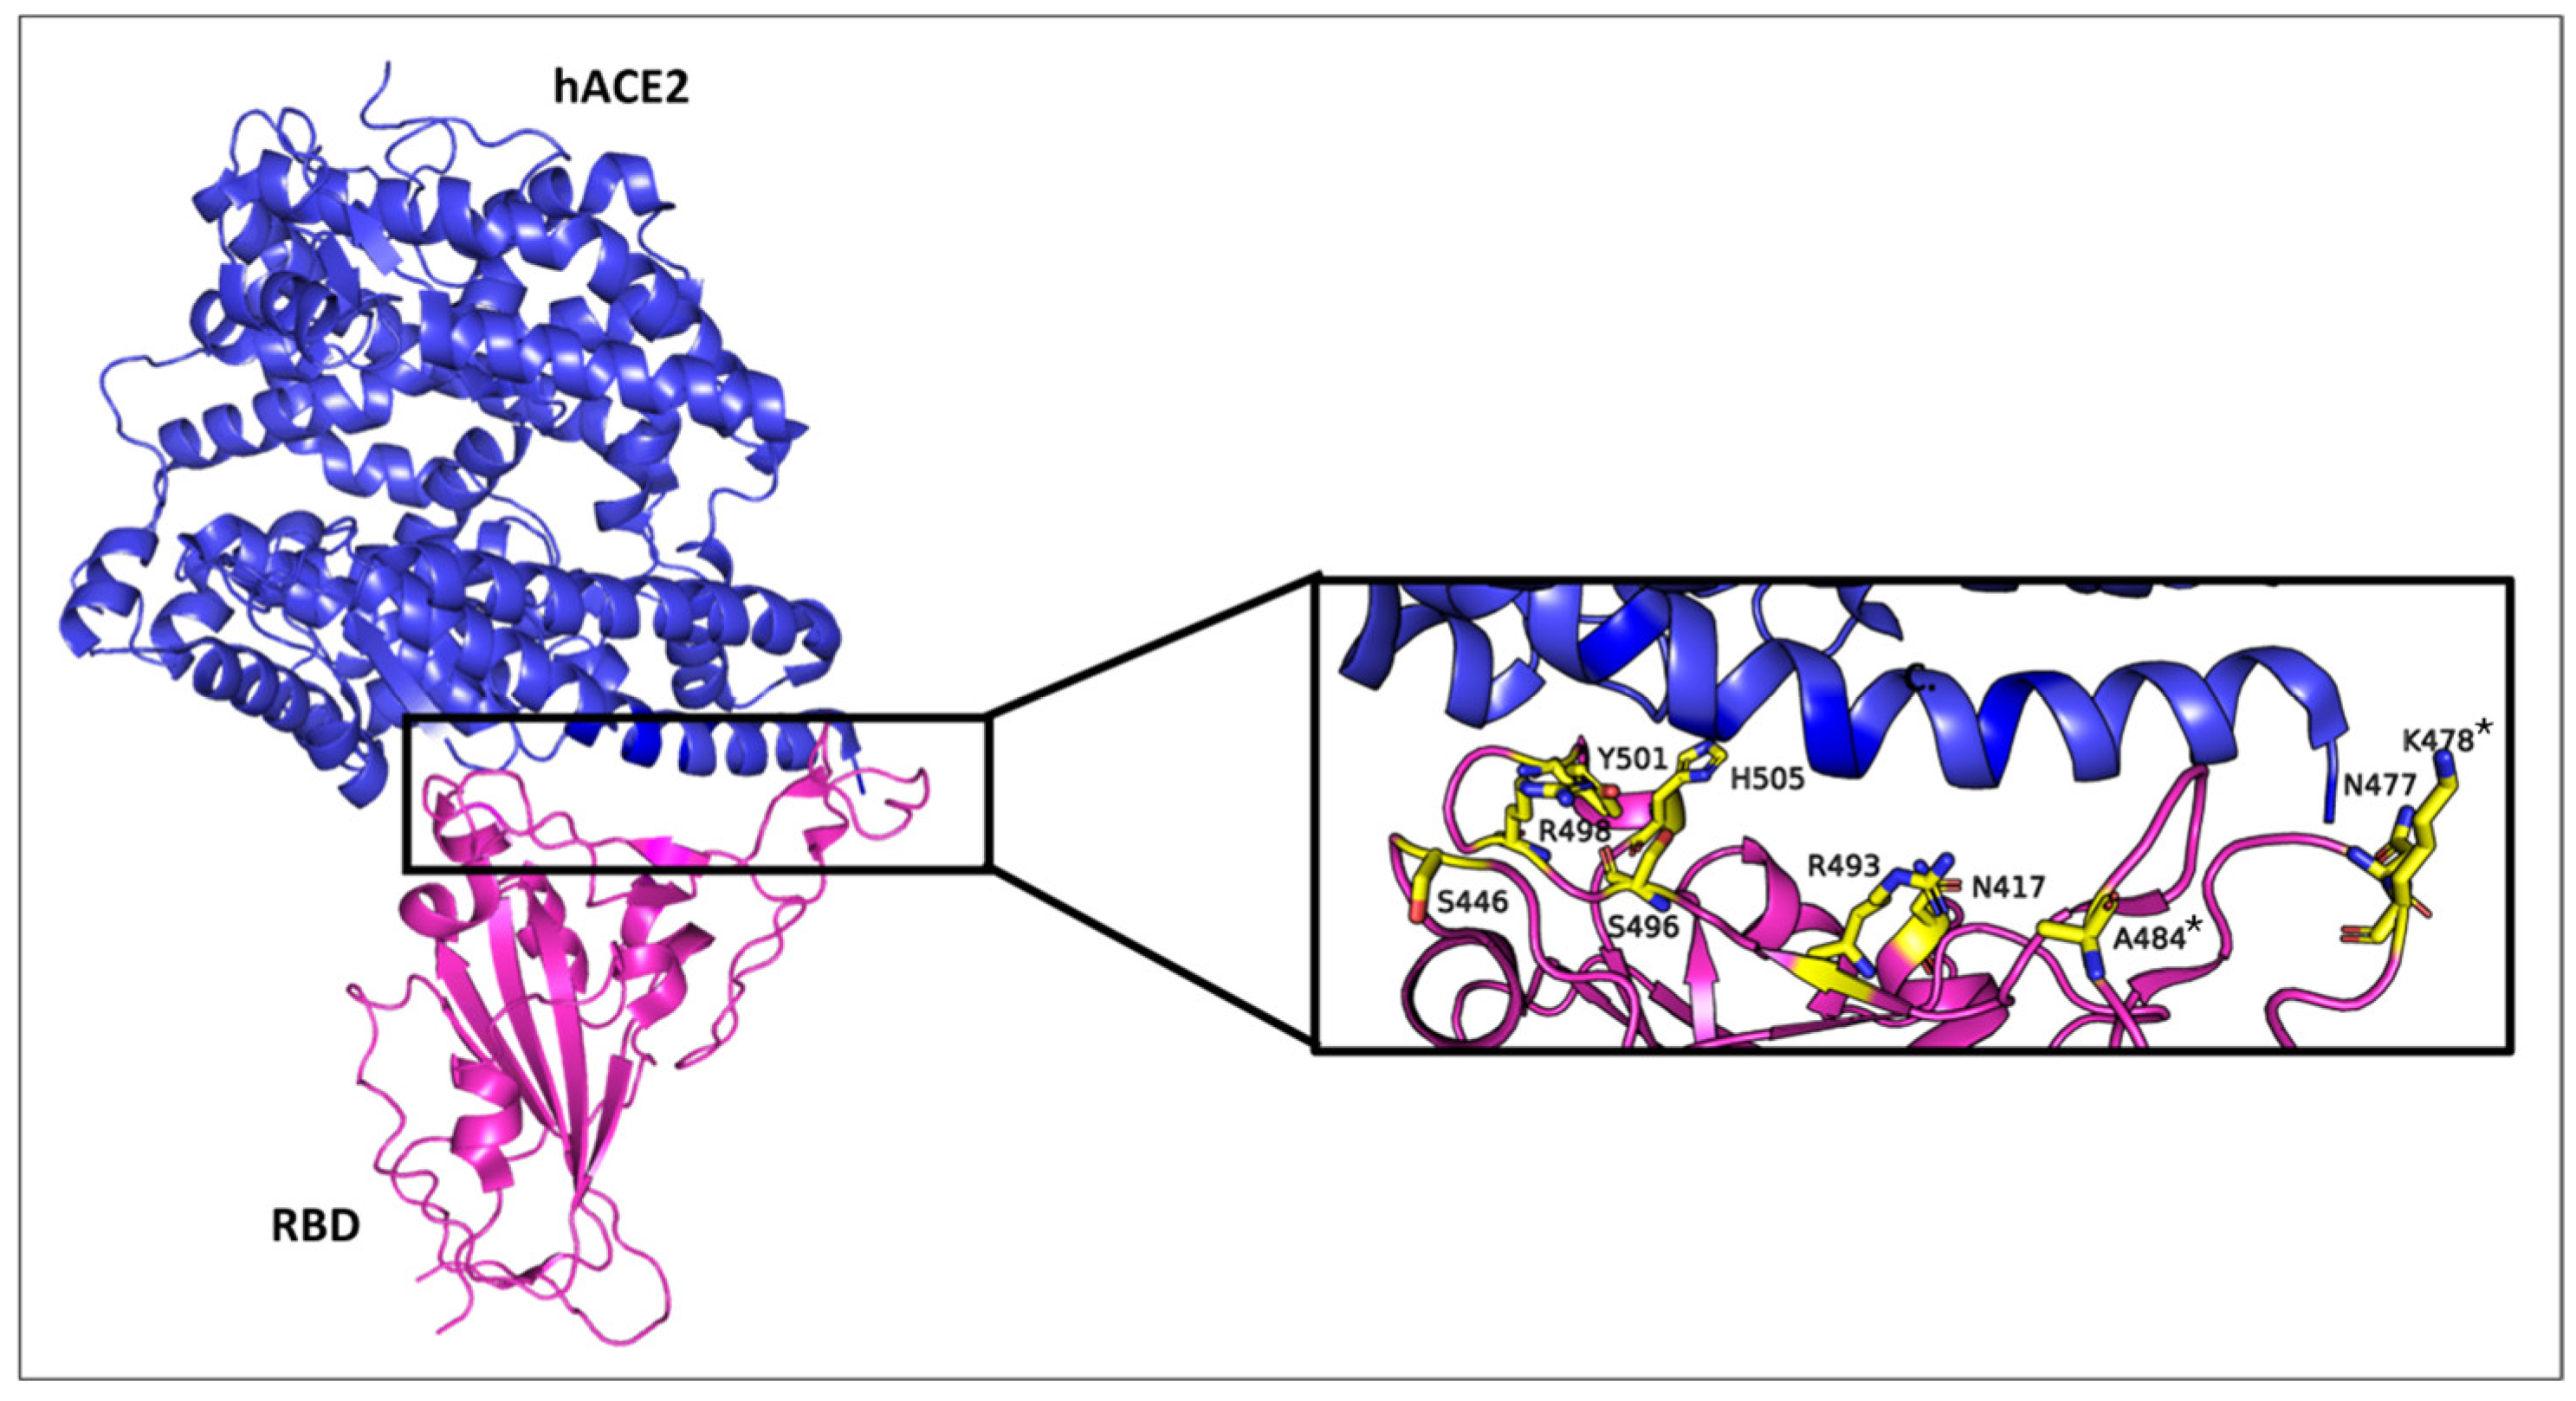
Figure 1 depicts the structural features of the Omicron variant’s RBD in complex with the human ACE2 receptor, displaying the mutated residues within 5.6 Å of the ACE2 binding interface. It also provides a zoomed-in view of the RBD-ACE2 interface, displaying the spatial distribution of key mutated residues. These mutations, including N501Y, K417N, and T478K, which also appeared in earlier variants of concern [
13], have been linked to enhanced transmission, antibody evasion, and vaccine resistance of Omicron [
10,
12,
14,
15]. Given these implications, the Omicron-specific mutations in the RBD and their synergistic effects on ACE2 binding affinity have emerged as a focal point of experimental and theoretical investigations [
16,
17,
18,
19,
20].
Both computational and experimental studies have consistently shown that Omicron-specific mutations enhance binding affinity through a combination of electrostatic interactions, hydrogen bonding, and structural flexibility. Molecular dynamics (MD) simulations have been instrumental in elucidating the structural and dynamic effects of these mutations on the RBD–ACE2 interaction. For instance, Kim et al. used steered MD simulations to quantify the interaction forces between Omicron’s RBD and ACE2, revealing that mutations N501Y, Q498R, and T478K enhance binding [
20]. Similarly, Lupala et al. employed MD simulations to show that Omicron’s RBD forms additional hydrogen bonds with ACE2, leading to a more stable RBD-ACE2 complex [
22]. These computational findings are corroborated by experimental techniques such as microscale thermophoresis (MST) and surface plasmon resonance (SPR). Kim et al. used MST to confirm that Omicron’s RBD has a five-fold higher binding affinity to ACE2 compared to the original wildtype strain [
20]. Mannar et al. further validated these results using cryo-EM and SPR, showing that Omicron’s RBD forms new salt bridges and hydrogen bonds with ACE2, compensating for mutations like K417N that would otherwise reduce binding affinity [
18].
A notable trend emerging from the literature is the role of electrostatics in determining binding affinity. Several reports have highlighted that the accumulation of positively charged residues within the RBD increases the overall electrostatic attraction toward the negatively charged ACE2 receptor [
19,
23,
24]. Free energy calculations, including both the Molecular Mechanics/Poisson Boltzmann Surface Area (MM/PBSA) and the Molecular Mechanics/Generalized Born Surface Area (MM/GBSA) methods, have provided quantitative insights into the binding free energy changes caused by Omicron’s mutations based on per-residue energy decomposition analyses. For example, Nguyen et al. used MM/PBSA to show that mutations N440K, T478K, E484A, Q493R, and Q498R significantly lower the binding free energy, enhancing ACE2 affinity [
23]. Similarly, da Costa et al. used MM/GBSA calculations to demonstrate that Omicron’s RBD binds ACE2 more strongly than other variants due to mutations N440K, T478K, Q493R, and Q498R [
24]. Interestingly, in a recent study, Bozic and Podgornik analyze charge changes in the spike protein across nearly 2200 SARS-CoV-2 lineages, showing that the trend of increasing positive charge stopped with early Omicron variants (BA.1, BA.2) [
25]. Recent lineages of Omicron display greater diversity in ionizable amino acids, with charge patterns correlating to phylogenetic clades, highlighting the role of electrostatic interactions in viral evolution and stability [
25].
In a seminal experimental study [
16], Starr et al. employed deep mutational scanning (DMS) to evaluate the impacts of all possible single amino acid substitutions in the RBD of SARS-CoV-2 Omicron variants BA.1. Using yeast surface display, site-saturation mutagenesis libraries were constructed and assayed to measure ACE2-binding affinity via fluorescence-activated cell sorting titrations and dissociation constant (K
D) calculations. The resulting data were visualized in a heatmap employing a polarized Δlog
10K
D representation to quantify the effects of mutations on ACE2 binding. This metric reflects the change in the logarithm of the dissociation constant (K
D) compared to the wild-type RBD. The heatmaps visually capture these changes across all single amino acid substitutions, allowing easy identification of mutations that enhance or impair ACE2 binding in the Omicron BA.1 RBDs compared to the ancestral WT (Wuhan-Hu-1) background [
16].
In order to stay ahead of SARS-CoV-2 evolution and mitigate the impact of future variants, it is highly desirable to do the same theoretically, assessing quantitatively the energetic impact of each one of the mutations in RBD on the binding affinity with ACE2. For this purpose, we employed advanced quantum chemical calculations to elucidate the molecular recognition mechanisms between the Omicron RBD and ACE2. It is now widely accepted that molecular recognition is mediated through non-covalent interactions (also known as non-bonded interactions) such as hydrogen bonding, π–π stacking interactions, CH–π interaction, XH–π interaction (X = N, O, S), cation–π interaction, and salt bridges, etc. [
26,
27,
28,
29,
30,
31].
Molecular recognition between proteins is driven by an intricate network of non-bonded interactions, which define the specificity, affinity, and stability of protein–protein interfaces. Hydrogen bonds form when a hydrogen atom covalently attached to an electronegative donor, such as nitrogen or oxygen, interacts with another electronegative acceptor atom. These interactions are directional and provide critical specificity in protein interfaces. Residues like serine, threonine, and tyrosine often act as hydrogen bond donors, while aspartate and glutamate frequently serve as acceptors. π–π stacking interactions occur between the aromatic rings of residues, driven by the alignment of their π-electron clouds. Phenylalanine, tyrosine, and tryptophan are commonly involved. CH–π interactions involve a hydrogen atom bound to carbon, such as a methyl group, interacting with the π-electron cloud of an aromatic residue. CH–π interactions frequently occur between aliphatic residues (Ala, Val, Ile, Leu) and the aromatic residues (Phe, Tyr, Trp). An XH–π interaction occurs when a hydrogen atom attached to a heteroatom (e.g., nitrogen, oxygen, or sulfur) interacts with the π-electron cloud of an aromatic residue. These interactions combine the characteristics of hydrogen bonding and π-based interactions. For example, the hydroxyl group of tyrosine can engage in an XH–π interaction with the π-system of tryptophan, enhancing structural and functional specificity. A cation–π interaction involves an attraction between a positively charged group, such as the guanidinium moiety of arginine, and the π-electron cloud of an aromatic residue like phenylalanine or tyrosine. Salt bridges are strong electrostatic interactions formed between oppositely charged residues, often further stabilized by accompanying hydrogen bonds. Lysine and arginine, with their positively charged side chains, often form salt bridges with negatively charged residues like aspartate and glutamate. These non-bonded interactions, while individually weak, collectively enable highly dynamic yet precise molecular associations between proteins.
In summary, the RBD of the spike protein directly interacts with the human ACE2 receptor to initiate SARS-CoV-2 infection. Any naturally occurring mutations in the S protein, particularly within its RBD, have the potential to influence the strength of this interaction. Such mutations may either enhance or reduce binding affinity to ACE2, which in turn can significantly affect the efficiency and transmissibility of the virus. The objective of this study is to investigate the molecular basis behind the enhanced transmissibility of the Omicron variant compared to the wild-type (WT) virus. This is achieved through a comparative analysis of their molecular recognition mechanisms.
It is our hope that the findings reported below not only provide insights into Omicron’s molecular recognition mechanisms but also lay a foundation for designing targeted antiviral strategies and improving preparedness against future SARS-CoV-2 variants.
2. Results
To begin, we conducted a detailed examination of the binding interfaces in the crystal structures of both the Omicron and WT RBDs bound to ACE2. This analysis focused on identifying all residues involved in the binding interactions. Specifically, interacting residues were defined as those within 5.6 Å of the opposing protein domain—RBD residues within 5.6 Å of ACE2, as well as ACE2 residues within 5.6 Å of the RBD. By applying this criterion, we systematically mapped the binding pocket for both variants and characterized the differences in residue-level interactions.
Furthermore, we identified all non-bonded intermolecular interactions that contribute to the molecular recognition of RBD by ACE2. These interactions include hydrogen bonds, π–π stacking interactions, CH–π interactions, XH–π interactions (X = N, O, S), cation–π interactions and salt bridges. By comparing these interactions across the two variants, we aimed to pinpoint the specific molecular changes introduced by Omicron mutations that could explain its increased transmissibility. This comprehensive analysis aims at providing critical insights into how structural changes in the RBD enhance its ability to bind ACE2 and thereby promote viral spread.
2.1. Interacting Residues at the Interface of Spike (RBD) and ACE2
Interacting residues at the RBD–ACE2 interfaces were identified based on the three-dimensional structures of the respective RBD–ACE2 complexes, utilizing the 2.45 Å resolution X-ray crystal structure of the wild-type SARS-CoV-2 RBD–ACE2 complex (PDB ID: 6M0J) [
32] and the 3.0 Å resolution structure of the Omicron variant RBD–ACE2 complex (PDB ID: 7WBP) [
12]. Binding interfaces were meticulously analyzed using the Visual Molecular Dynamics (VMD) program [
33] to identify residues involved in non-bonded interactions, with a cut-off distance of 5.6 Å applied to define the RBD–ACE2 interaction interfaces. This cut-off accounts for the physical range of non-bonded interactions, including π–π stacking and cation–π interactions that are known for their relatively long ranges. For both types of π interactions, solution-phase interaction energies typically diminish beyond 5.6 Å, as determined by prior quantum chemical calculations [
34].
The analysis of binding interface residues reveals a slightly smaller interface for the Omicron–ACE2 complex compared to the WT–ACE2 complex.
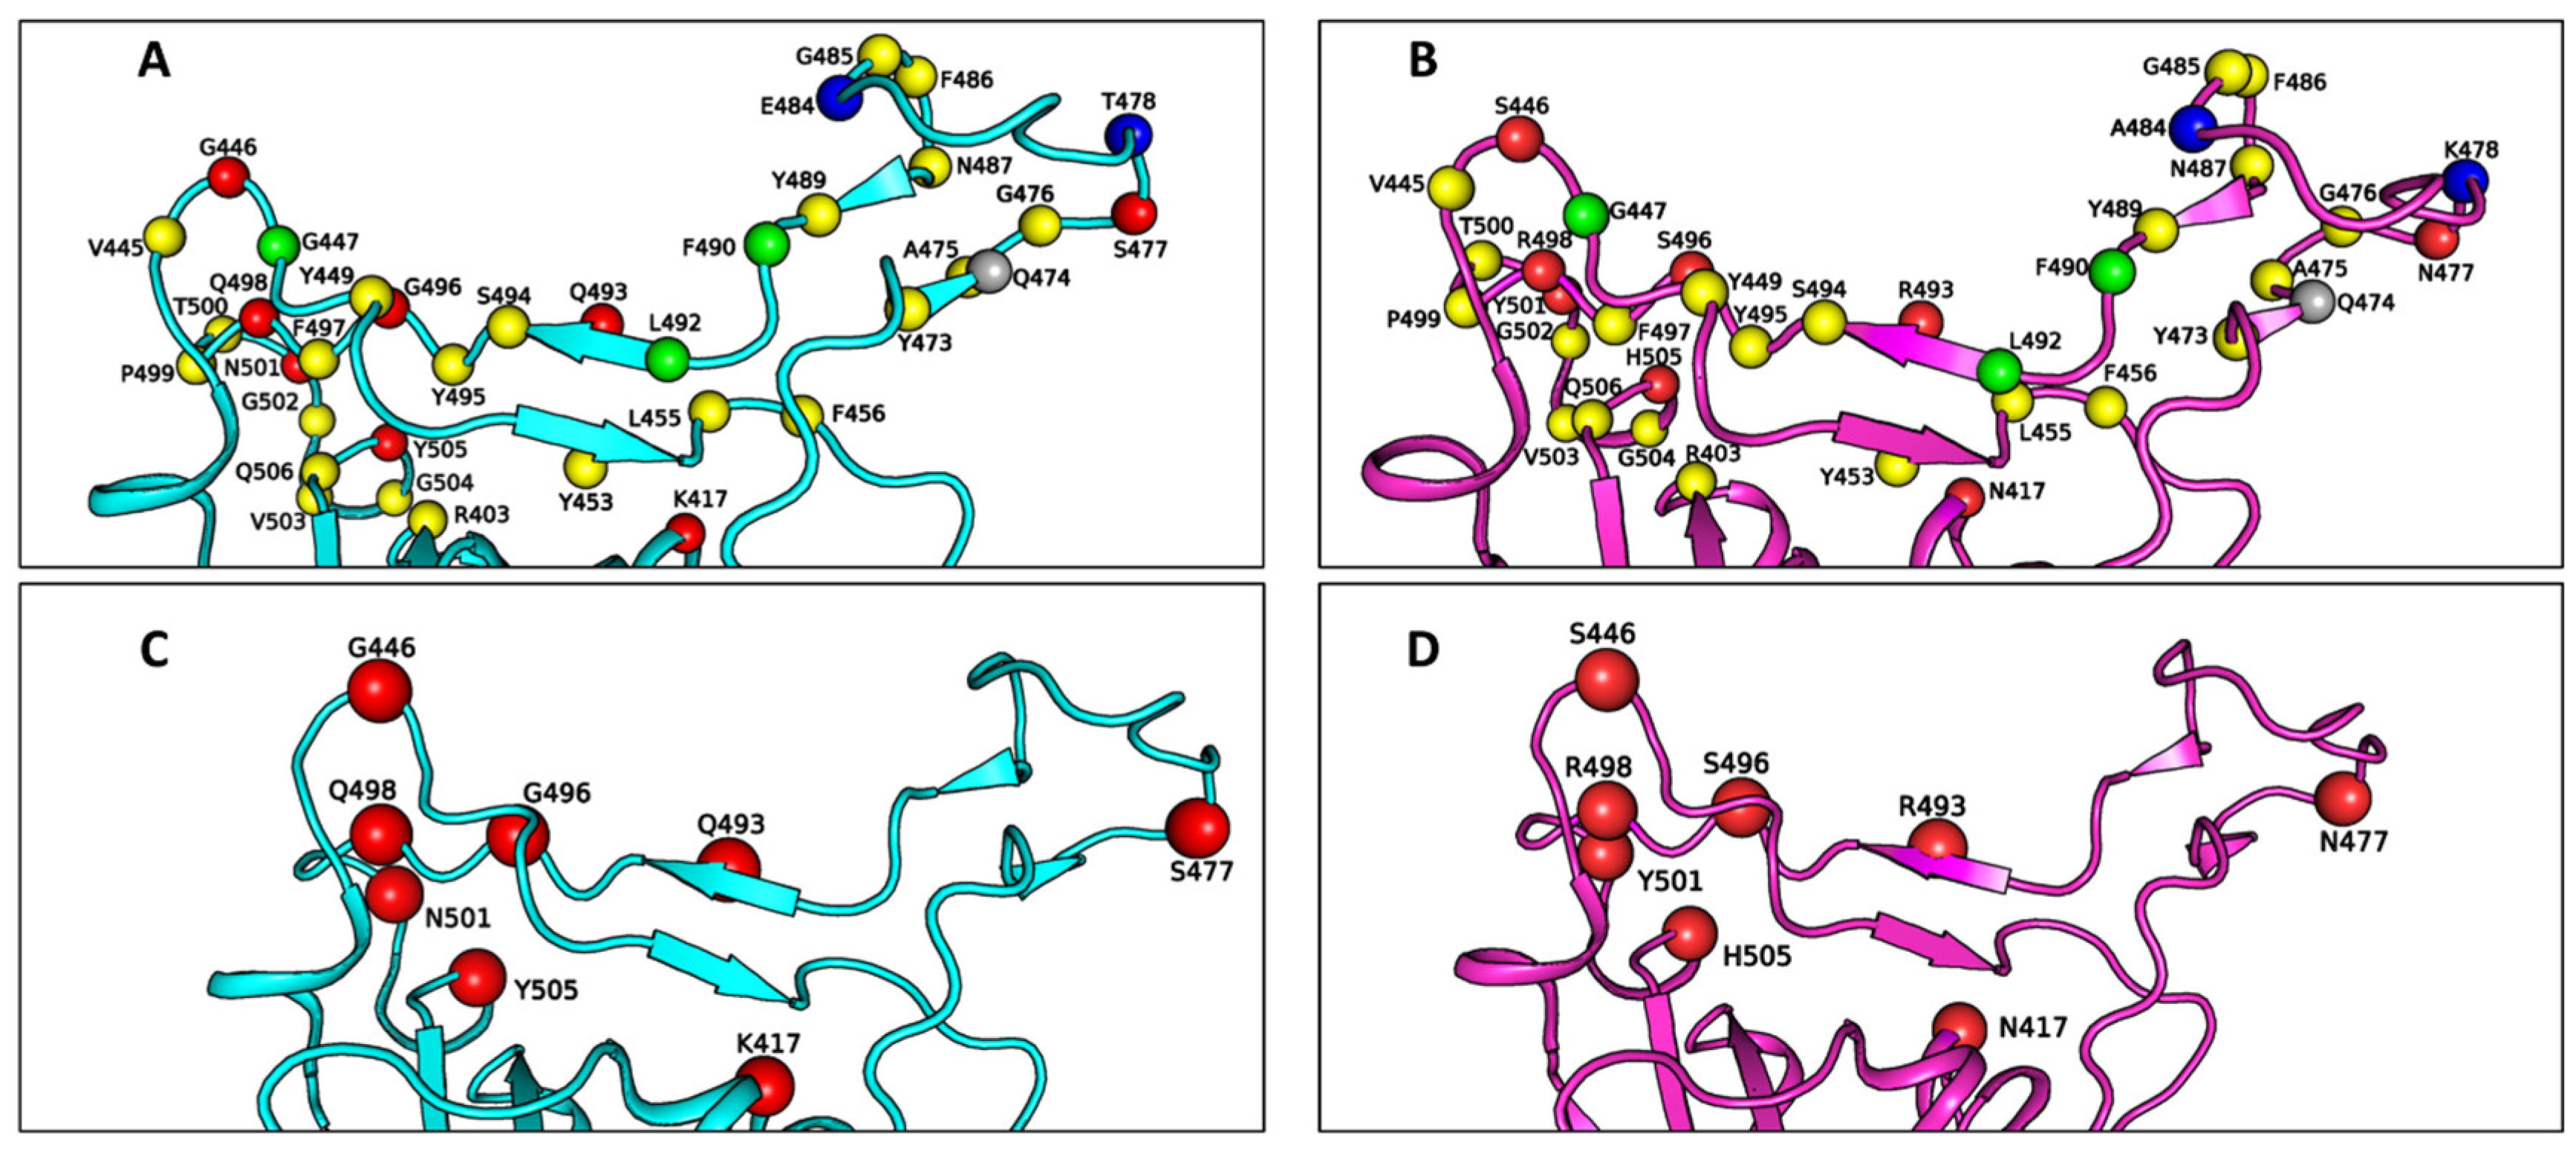
Table 1 lists the residues at the RBD–ACE2 interface for both the WT and Omicron variant SARS-CoV-2, while
Figure 2 illustrates the spatial arrangement of these residues in the RBD binding interface with ACE2. Specifically, the Omicron–ACE2 interface includes 31 amino acid residues from the viral RBD and 34 residues from ACE2, compared to 34 residues from the RBD and 35 from ACE2 in the WT–ACE2 interface. Notably, non-mutated residues G447, F490, and L492, along with the mutated residue A484, are absent from the Omicron–ACE2 interface, whereas residue Q474 is absent from the WT–ACE2 interface. These differences in the binding interfaces are attributed to the extensive number of mutations present in the RBD of the Omicron variant, which induces a certain extent of structural rearrangement.
As shown in
Figure 2C,D, the Omicron RBD–ACE2 interface incorporates only 8 mutated residues from a total of 15 mutations in the Omicron RBD. Naturally, these 8 residues are considered as key candidates for modulating the binding strength of the Omicron–ACE2 interaction. Among them, residue A484 is out of range for non-bonded interaction due to the shorter side chain of alanine compared to that of the glutamic acid (E484) present in the WT RBD. Additionally, residue T478 in the WT RBD is replaced by lysine (K478) in Omicron, a larger residue. However, both residues are located outside the binding interfaces in their respective variants, although they may still exert allosteric effects on the binding interface.
The structural analysis further reveals that, overall, the mode of interaction between the Omicron RBD and ACE2 is highly similar to that of the WT RBD. However, a key difference in their interaction mechanisms was observed, which will be discussed in greater detail in subsequent sections. This highlights the subtle yet significant impact of specific mutations on the molecular recognition and binding affinity of Omicron’s RBD for the ACE2 receptor.
2.2. Pair-Wise Interaction Energies Between RBD Residues and ACE2
The non-bonded interaction energies between RBD and ACE2 were quantified using the double hybrid density functional theory (DFT) method at the B2PLYP-D3/def2-TZVP level of theory (see
Section 4 for details). Given the large number of residues at the RBD–ACE2 interface, calculating the total interaction energy at this high level of theory far exceeds current computational capabilities. Instead, interaction energies were computed in a pairwise manner: for each residue of the RBD, all interacting ACE2 residues within a 5.6 Å cut-off distance were included in the calculations.
Table 2 provides an extensive list of all WT RBD residues and their interacting ACE2 counterparts, while
Table 3 provides the same for the Omicron variant. Each table begins with a serial number, which serves as a sequential identifier for the interacting motifs. The second column and the third column specify the RBD residue and its interacting residues in ACE2, respectively, either from the wild-type variant in
Table 2 or from the Omicron variant in
Table 3. The three-dimensional arrangements for some representative interacting motifs are provided in the next two subsections (
Section 2.3 and
Section 2.4). The next three columns provide energetic values that characterize these interactions (see
Section 4). The first of these is the gas-phase intermolecular interaction energy
calculated using the supermolecular approach at the B2PLYP-D3/def2-TZVP level of theory. Following this, the column accounts for the dehydration energy
which reflects the energy cost associated with removing the solvation shell around the interacting residues upon complex formation. The final column,
, represents the solution-phase intermolecular interaction energy calculated by adding the gas-phase interaction energy to the dehydration energy according to Equation (2).
It is worth mentioning that the B2PLYP-D3/def2-TZVP level calculations of the gas phase interaction energies are computationally intensive, both in terms of CPU and memory, due to the large size of the intermolecular interacting motifs. Among the most computationally demanding cases are interaction motif #28 in the WT RBD-ACE2 complex and interaction motif #26 in the Omicron RBD-ACE2 complex, with a total count of 169 atoms and 180 atoms, respectively.
This comparative analysis highlights the specific residues responsible for enhanced or diminished binding interactions in the Omicron variant, aiming at shedding light on the molecular basis of its altered binding affinity.
The intermolecular interaction energy calculations reveal that a total of 20 residues contribute to the binding affinity with an interaction energy greater than −0.4 kcal/mol in both variants. In the Omicron variant, all residues interact favorably with neighboring ACE2 residues except for V445, Q474, G485, Y495, and P499. In contrast, the WT exhibits destabilizing interactions for residues R403, G447, Y453, S477, E484, F490, L492, and P499. A careful examination of the modes of non-bonded interactions revealed that π-system interactions, electrostatic interactions, and hydrogen bonding are the primary forces driving the binding affinities of both WT and Omicron variants with ACE2.
Summarizing all the pair-wise interaction energies, the total interaction energies for WT–ACE2 binding in the gas phase and solution phase are −322.4 kcal/mol and −70.0 kcal/mol, respectively. For Omicron–ACE2 binding, the corresponding energies are −263.7 kcal/mol and −80.0 kcal/mol. The larger interaction energy of Omicron in the solution phase indicates stronger binding compared to WT, correlating with its higher infectivity and transmissibility. This enhanced binding is attributed to increased electrostatic interactions and π-system contributions. Notably, both mutated and non-mutated residues in the Omicron RBD are found to be responsible for this improvement in binding affinity, further emphasizing the collective impact of structural adaptations in driving Omicron’s heightened ACE2 affinity. The energetic contributions of both muted residues and non-mutated residues are analyzed below.
2.3. Role of Mutation in the Binding of Omicron RBD with ACE2
As widely reported, mutations in amino acid residues play a critical role in altering the binding affinity of SARS-CoV-2 variants [
35,
36,
37,
38]. In the case of the Omicron variant, eight mutations are present within the RBD–ACE2 binding interface. To elucidate the energetic influence of these mutations, we evaluated the difference in intermolecular interaction energies for the WT residues and their mutated counterparts in Omicron
based on
Table 2 and
Table 3.
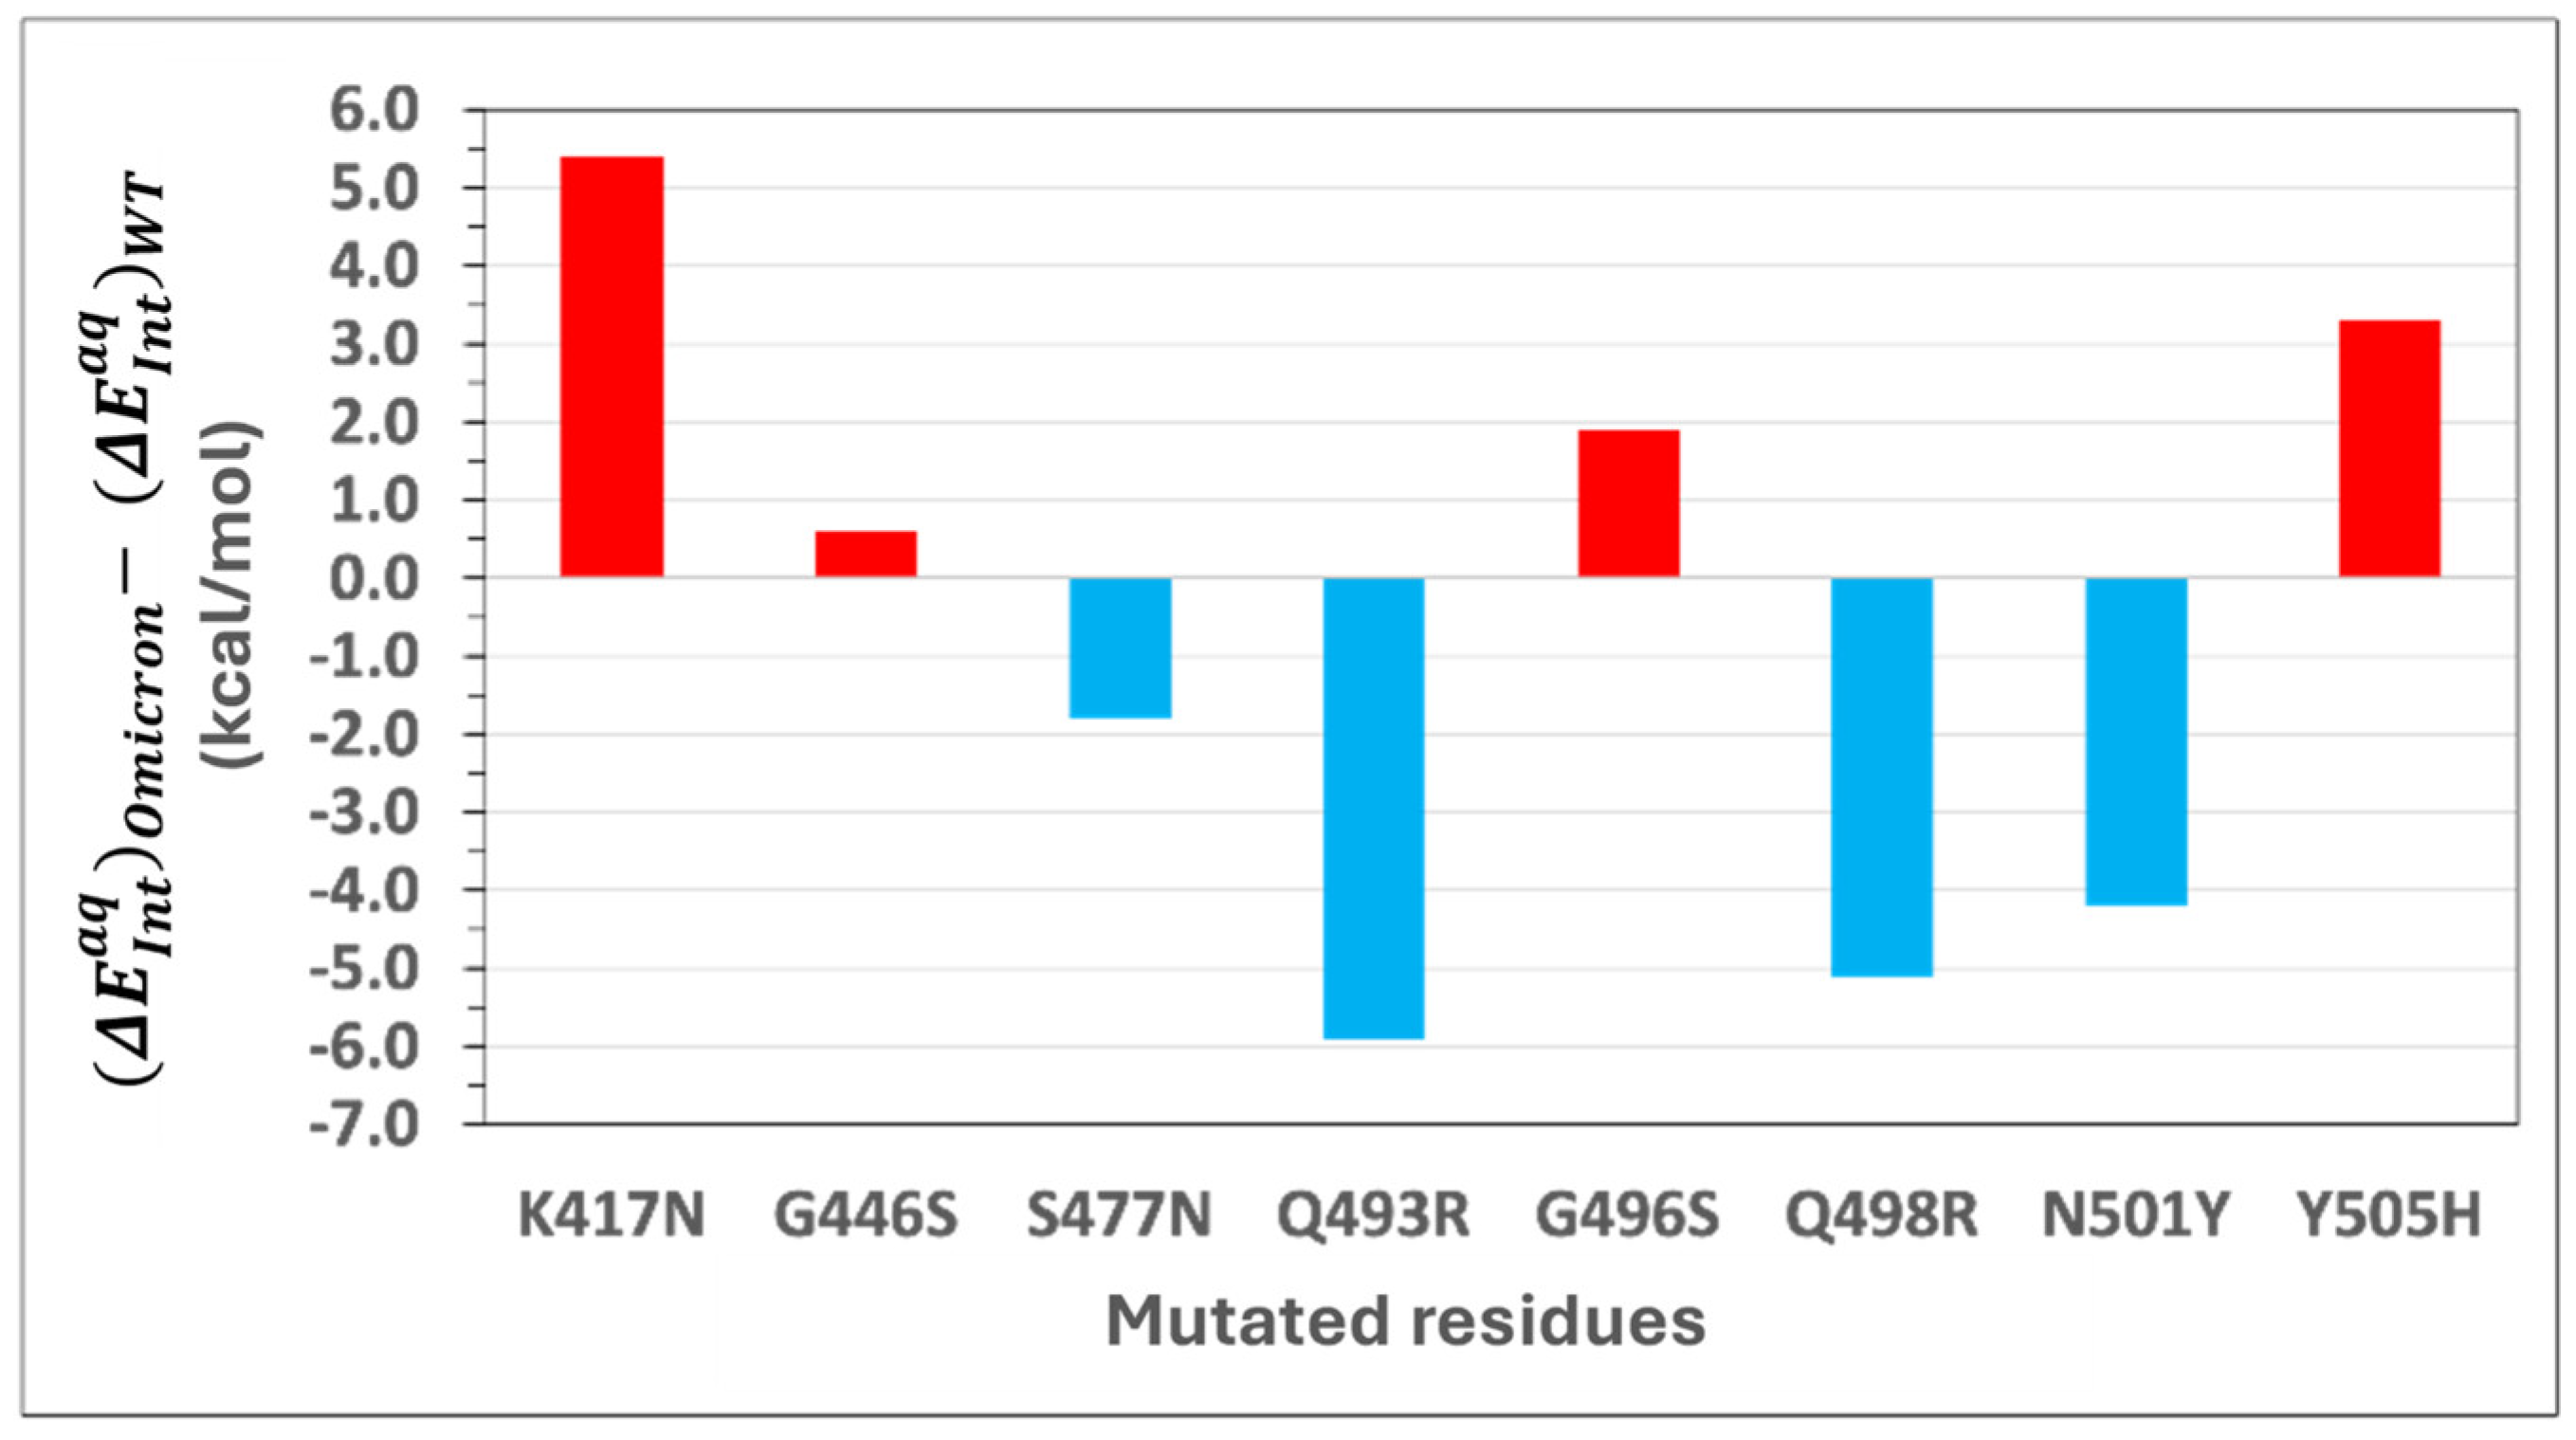
Figure 3 depicts the difference in interaction energies between Omicron and WT. Positive energy change indicates a reduction in binding affinity, while negative values represent an enhancement.
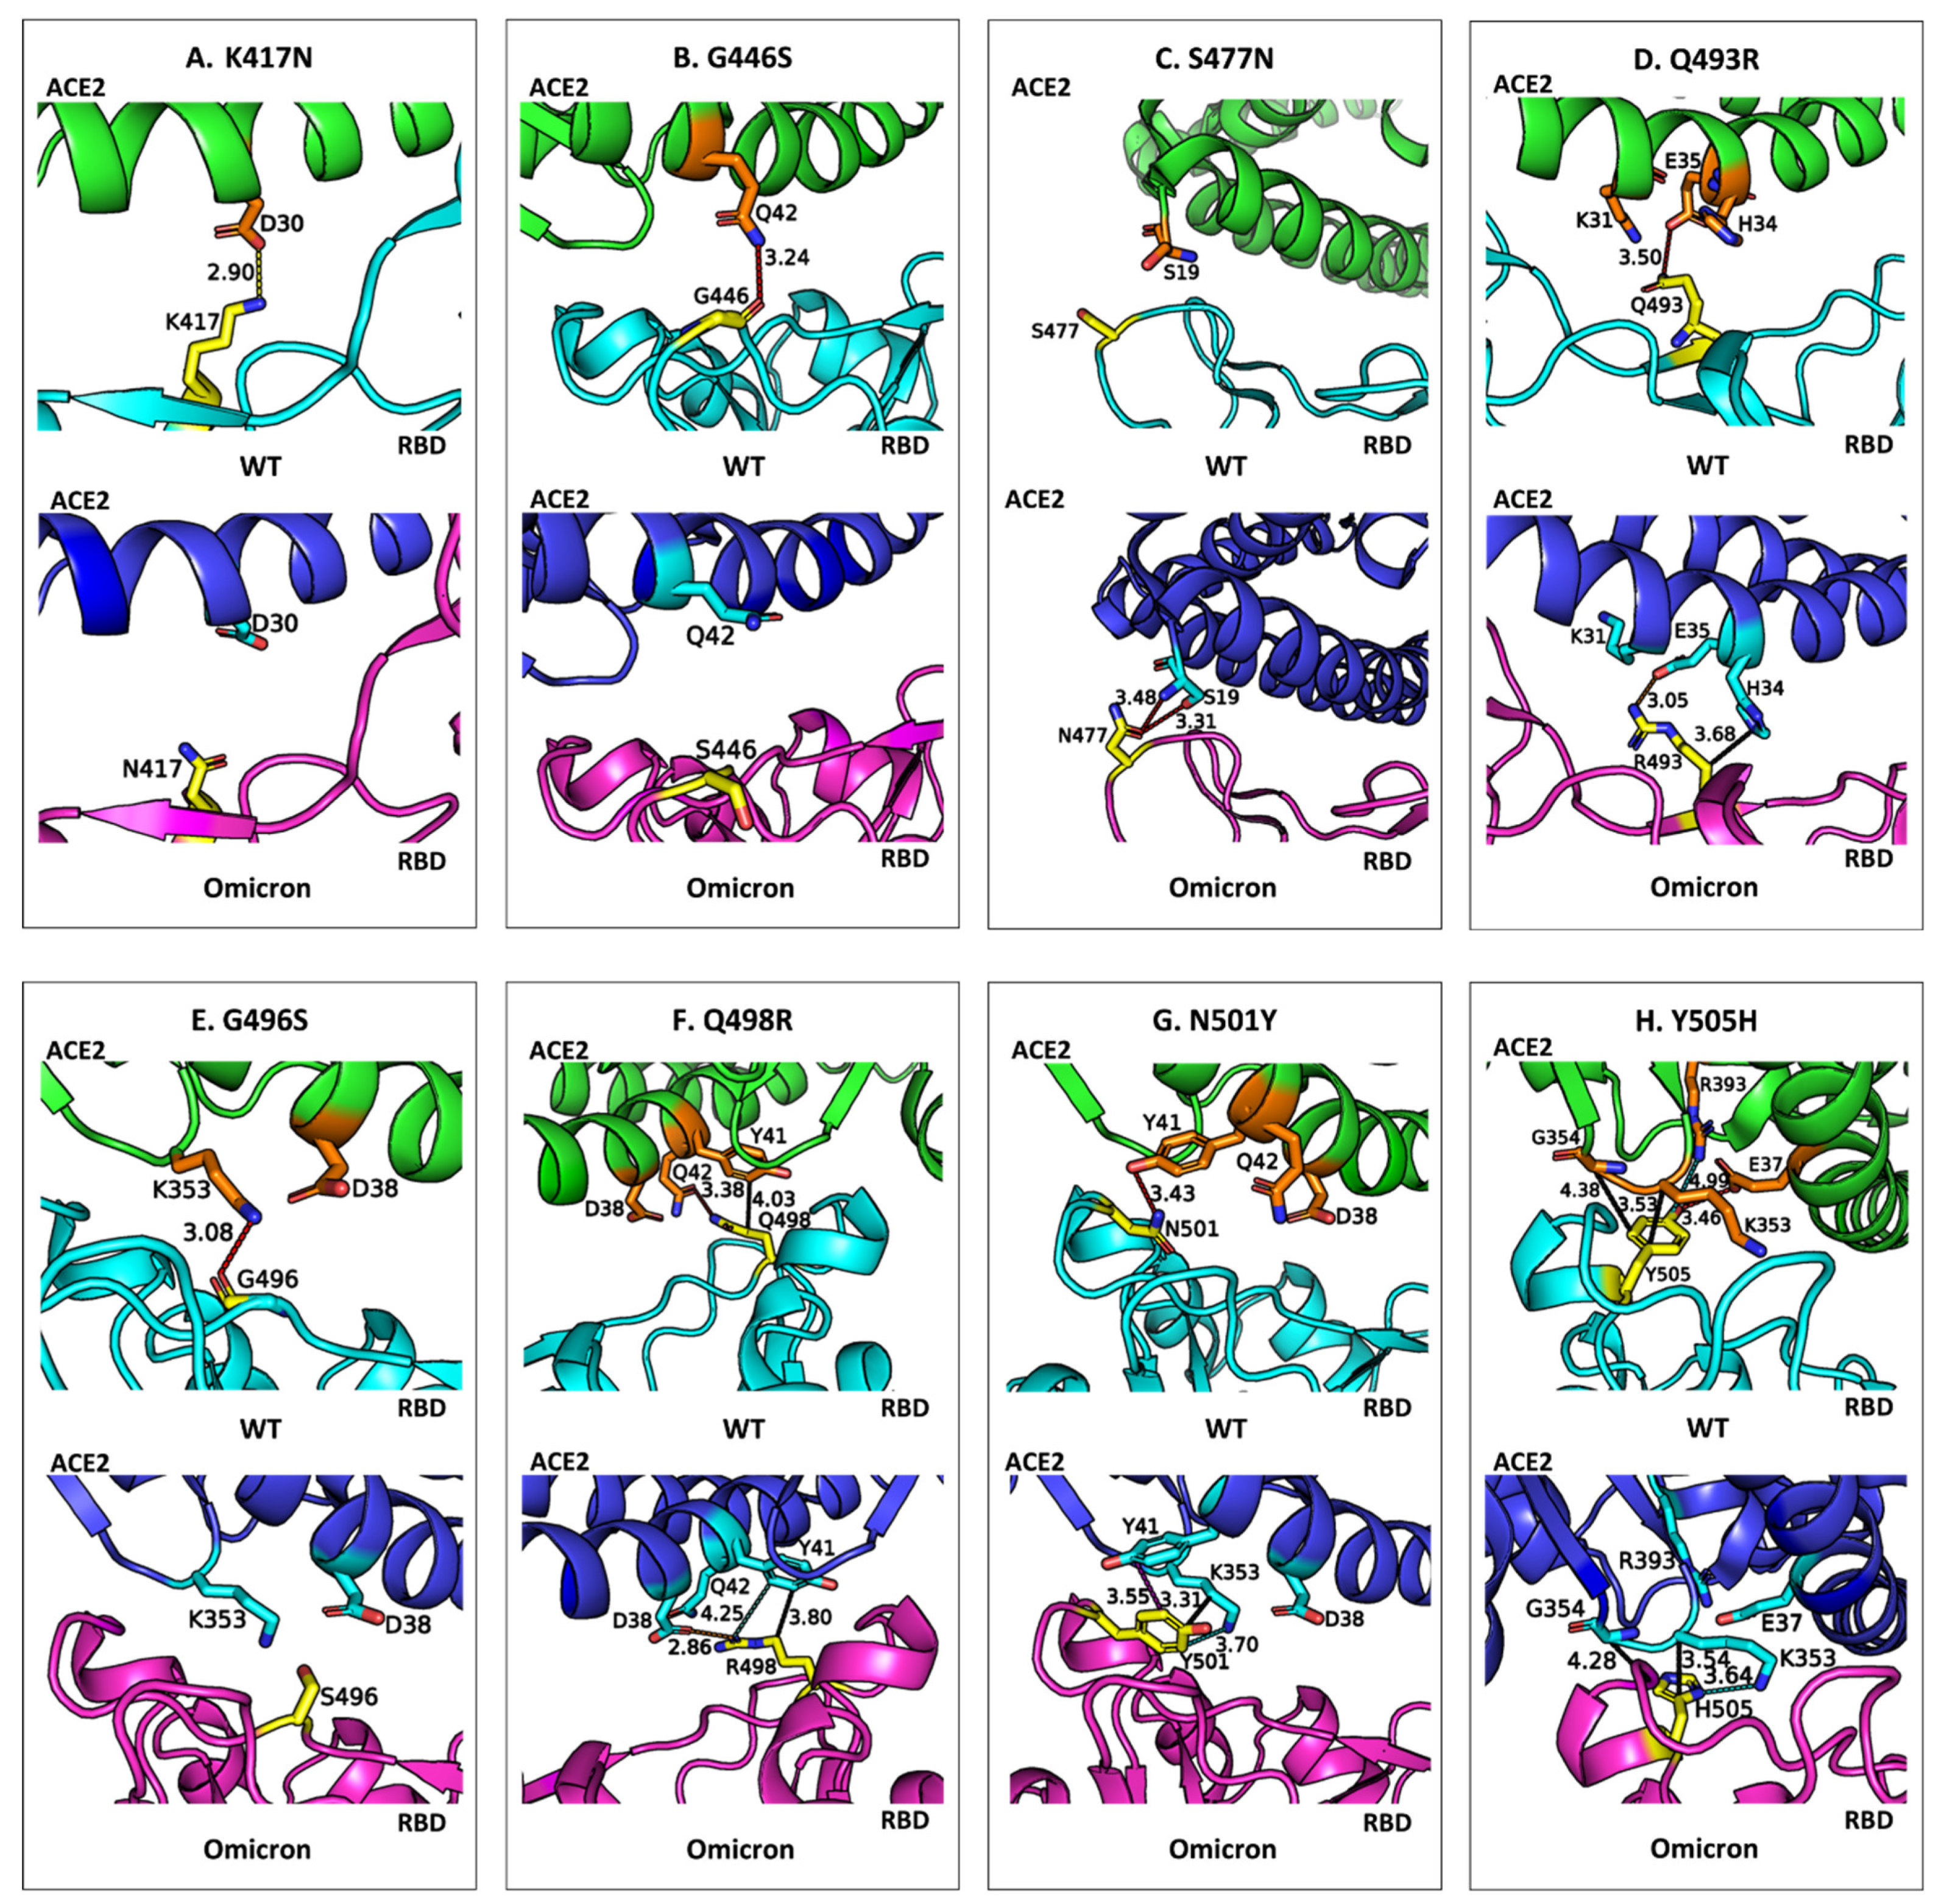
Figure 4 compares the binding environments and non-bonded interactions of eight mutated residues in the RBD of the wild-type SARS-CoV-2 and that of the Omicron variant when bound to the ACE2 receptor. It highlights how mutations in the RBD influence molecular recognition by altering non-bonded interactions such as hydrogen bonds, salt bridges, and π-based interactions (e.g., CH–π, π–π stacking and cation–π interactions). Through detailed visualizations of the WT residues and their Omicron counterparts, the figure underscores the structural and energetic shifts caused by these mutations, which collectively enhance or diminish the binding affinity of the RBD to ACE2.
A careful analysis of
Figure 3 and
Figure 4 leads to the following findings on the impact of residue mutations in RBD:
Stabilizing Mutations: Four of the eight mutations in Omicron result in an enhancement of the binding affinity of Omicron. S477N: Substituting serine (S) with asparagine (N) at position 477 introduces a bifurcated hydrogen bond with ACE2 residue S19, enhancing interaction energy by −1.8 kcal/mol. Q493R: Mutation of glutamine (Q) to arginine (R) at position 493 forms a new salt bridge with E35 in ACE2 and additional CH–π interactions with H34, increasing binding energy by −5.9 kcal/mol. Q498R: Replacing glutamine (Q) with arginine (R) at position 498 strengthens binding by −5.1 kcal/mol through a new salt bridge with D38, as well as cation–π and CH–π interactions with Y41 in ACE2. N501Y: The substitution of asparagine (N) with tyrosine (Y) at position 501 significantly enhances binding affinity by −4.2 kcal/mol. This enhancement arises from new π–π stacking interactions with Y41 and additional CH–π and cation–π interactions with K353 in ACE2.
Destabilizing Mutations: The remaining four mutations weaken the binding affinity of Omicron. K417N: Replacing lysine (K) with asparagine (N) results in a loss of 5.4 kcal/mol in binding affinity. This is attributed to the disruption of an electrostatic interaction with ACE2 residue D30 and the loss of multiple CH–π interactions with neighboring residues. G446S: Glycine (G) at position 446 is replaced by serine (S), causing a slight positional shift that eliminates a hydrogen bond with ACE2 residue Q42, reducing interaction energy by 0.6 kcal/mol. G496S: Mutation of glycine (G) to serine (S) at position 496 reduces binding affinity by 1.9 kcal/mol due to the loss of a hydrogen bond between G496 and K353 in ACE2 caused by the positional alteration of S496. Y505H: Tyrosine (Y) is replaced by histidine (H) at position 505, leading to a loss of 3.3 kcal/mol in binding affinity. The smaller aromatic side chain of histidine disrupts a hydrogen bond with E37 and a cation–π interaction with R393 while retaining some CH–π interactions with K353 and G354. A conformational adjustment in K353 introduces a new cation–π interaction with H505, partially mitigating the energetic loss.
The combined energetic contribution of the mutated residues in the WT RBD to the binding affinity is −25.7 kcal/mol, whereas the corresponding residues in Omicron contribute −31.5 kcal/mol. This increased energetic contribution underscores the significant role of these mutations in enhancing Omicron’s ACE2 binding affinity. Overall, this comparative analysis demonstrates that both stabilizing and destabilizing mutations collectively influence the enhanced binding affinity of Omicron to ACE2. Stabilizing mutations, such as Q493R, Q498R, and N501Y, significantly enhance binding through the introduction of new hydrogen bonds, salt bridges, and π-interactions, while destabilizing mutations like K417N and Y505H partially offset these gains. These findings highlight the intricate balance of molecular interactions driving Omicron’s heightened transmissibility and provide critical insights for therapeutic targeting.
Correlation Between Calculated and Experimental Affinity Changes
We have performed a comparison between theoretically calculated pairwise intermolecular energy differences and experimentally measured binding affinity differences arising from single residue mutations. As described in the
Section 1, DMS experiments measure the impacts of all possible single amino acid substitutions in the RBD of SARS-CoV-2 Omicron variant BA.1 on binding affinity in the form of the polarized Δlog
10K
D [
16]. The latter reflects the change in the logarithm of the dissociation constant (K
D) relative to the wild-type RBD. In the case of forward deep mutational scanning based on the wild-type SARS-CoV-2, negative Δlog
10K
D values indicate mutations that reduce binding affinity (weaken ACE2 interaction), while positive values denote enhanced affinity.
Table 4 presents both theoretically calculated pairwise intermolecular energy differences and experimentally measured binding affinity differences based on the deep mutational scanning of wild-type WT SARS-CoV-2 for eight mutated RBD residues. The interaction energy difference is calculated as
, with negative values indicating a gain in interaction energy for the mutated residue (denoted by an upward arrow, ↑), while positive values indicate a loss (denoted by a downward arrow, ↓). The polarized Δlog
10K
D represents changes in ACE2 binding affinity using the sign conventions stated above. Thus, the upward arrow (↑) indicates an increase in the binding affinity between the RBD and ACE2 due to mutation, while the downward arrow (↓) indicates a decrease, as determined from Δlog
10K
D values.
As shown in
Table 4, there is a strong correlation between the theoretically calculated pairwise intermolecular energy differences and the experimentally measured binding affinity changes. For six out of the eight residues, the direction of change aligns between the theoretical predictions and the experimental measurements, demonstrating the reliability of the theoretical framework in capturing the effects of RBD mutations on ACE2 binding.
Remarkably, the agreement between theory and experiment is even better in the case of reverse deep mutational scanning of the Omicron variant of SARS-CoV-2.
Table 5 presents a comparison between calculated energy differences (
) and experimental DMS data. Since it is a reverse mutation scan starting from the Omicron variant of SARS-CoV-2, positive Δlog
10K
D values indicate mutations that reduce binding affinity (weaken ACE2 interactions), while negative values denote enhanced affinity for the Omicron variant. As can be seen in
Table 5, in seven out of eight cases, the direction of change aligns between the theoretical predictions and the experimental measurements.
From a theoretical modeling perspective, the strong agreement between calculated energy differences and experimental DMS data suggests a potential application of our theoretical approach for predicting the effects of residue mutations in the RBD on its binding affinity with ACE2. However, significant differences exist between the structural models used for theoretical calculations and those underlying the DMS experiments. Specifically, the X-ray crystal structure of the Omicron variant employed in the quantum calculations reflects the collective influence of all 15 mutations, encompassing structural changes resulting from individual residue mutations as well as potential cooperative effects. In contrast, the DMS experiments assess the impact of single mutations in isolation. Furthermore, discrepancies in the direction of change for residues Q493R and Q498R may stem from uncertainties in atomic coordinates inherent to the limited resolution of X-ray crystallographic structural determination. Despite these differences, the observed concordance in the direction of change between theoretical predictions and experimental measurements underscores the robustness of the theoretical framework presented here in capturing the effects of RBD mutations on ACE2 binding. This suggests its promise as a predictive tool for studying mutation-induced changes in protein–protein interactions.
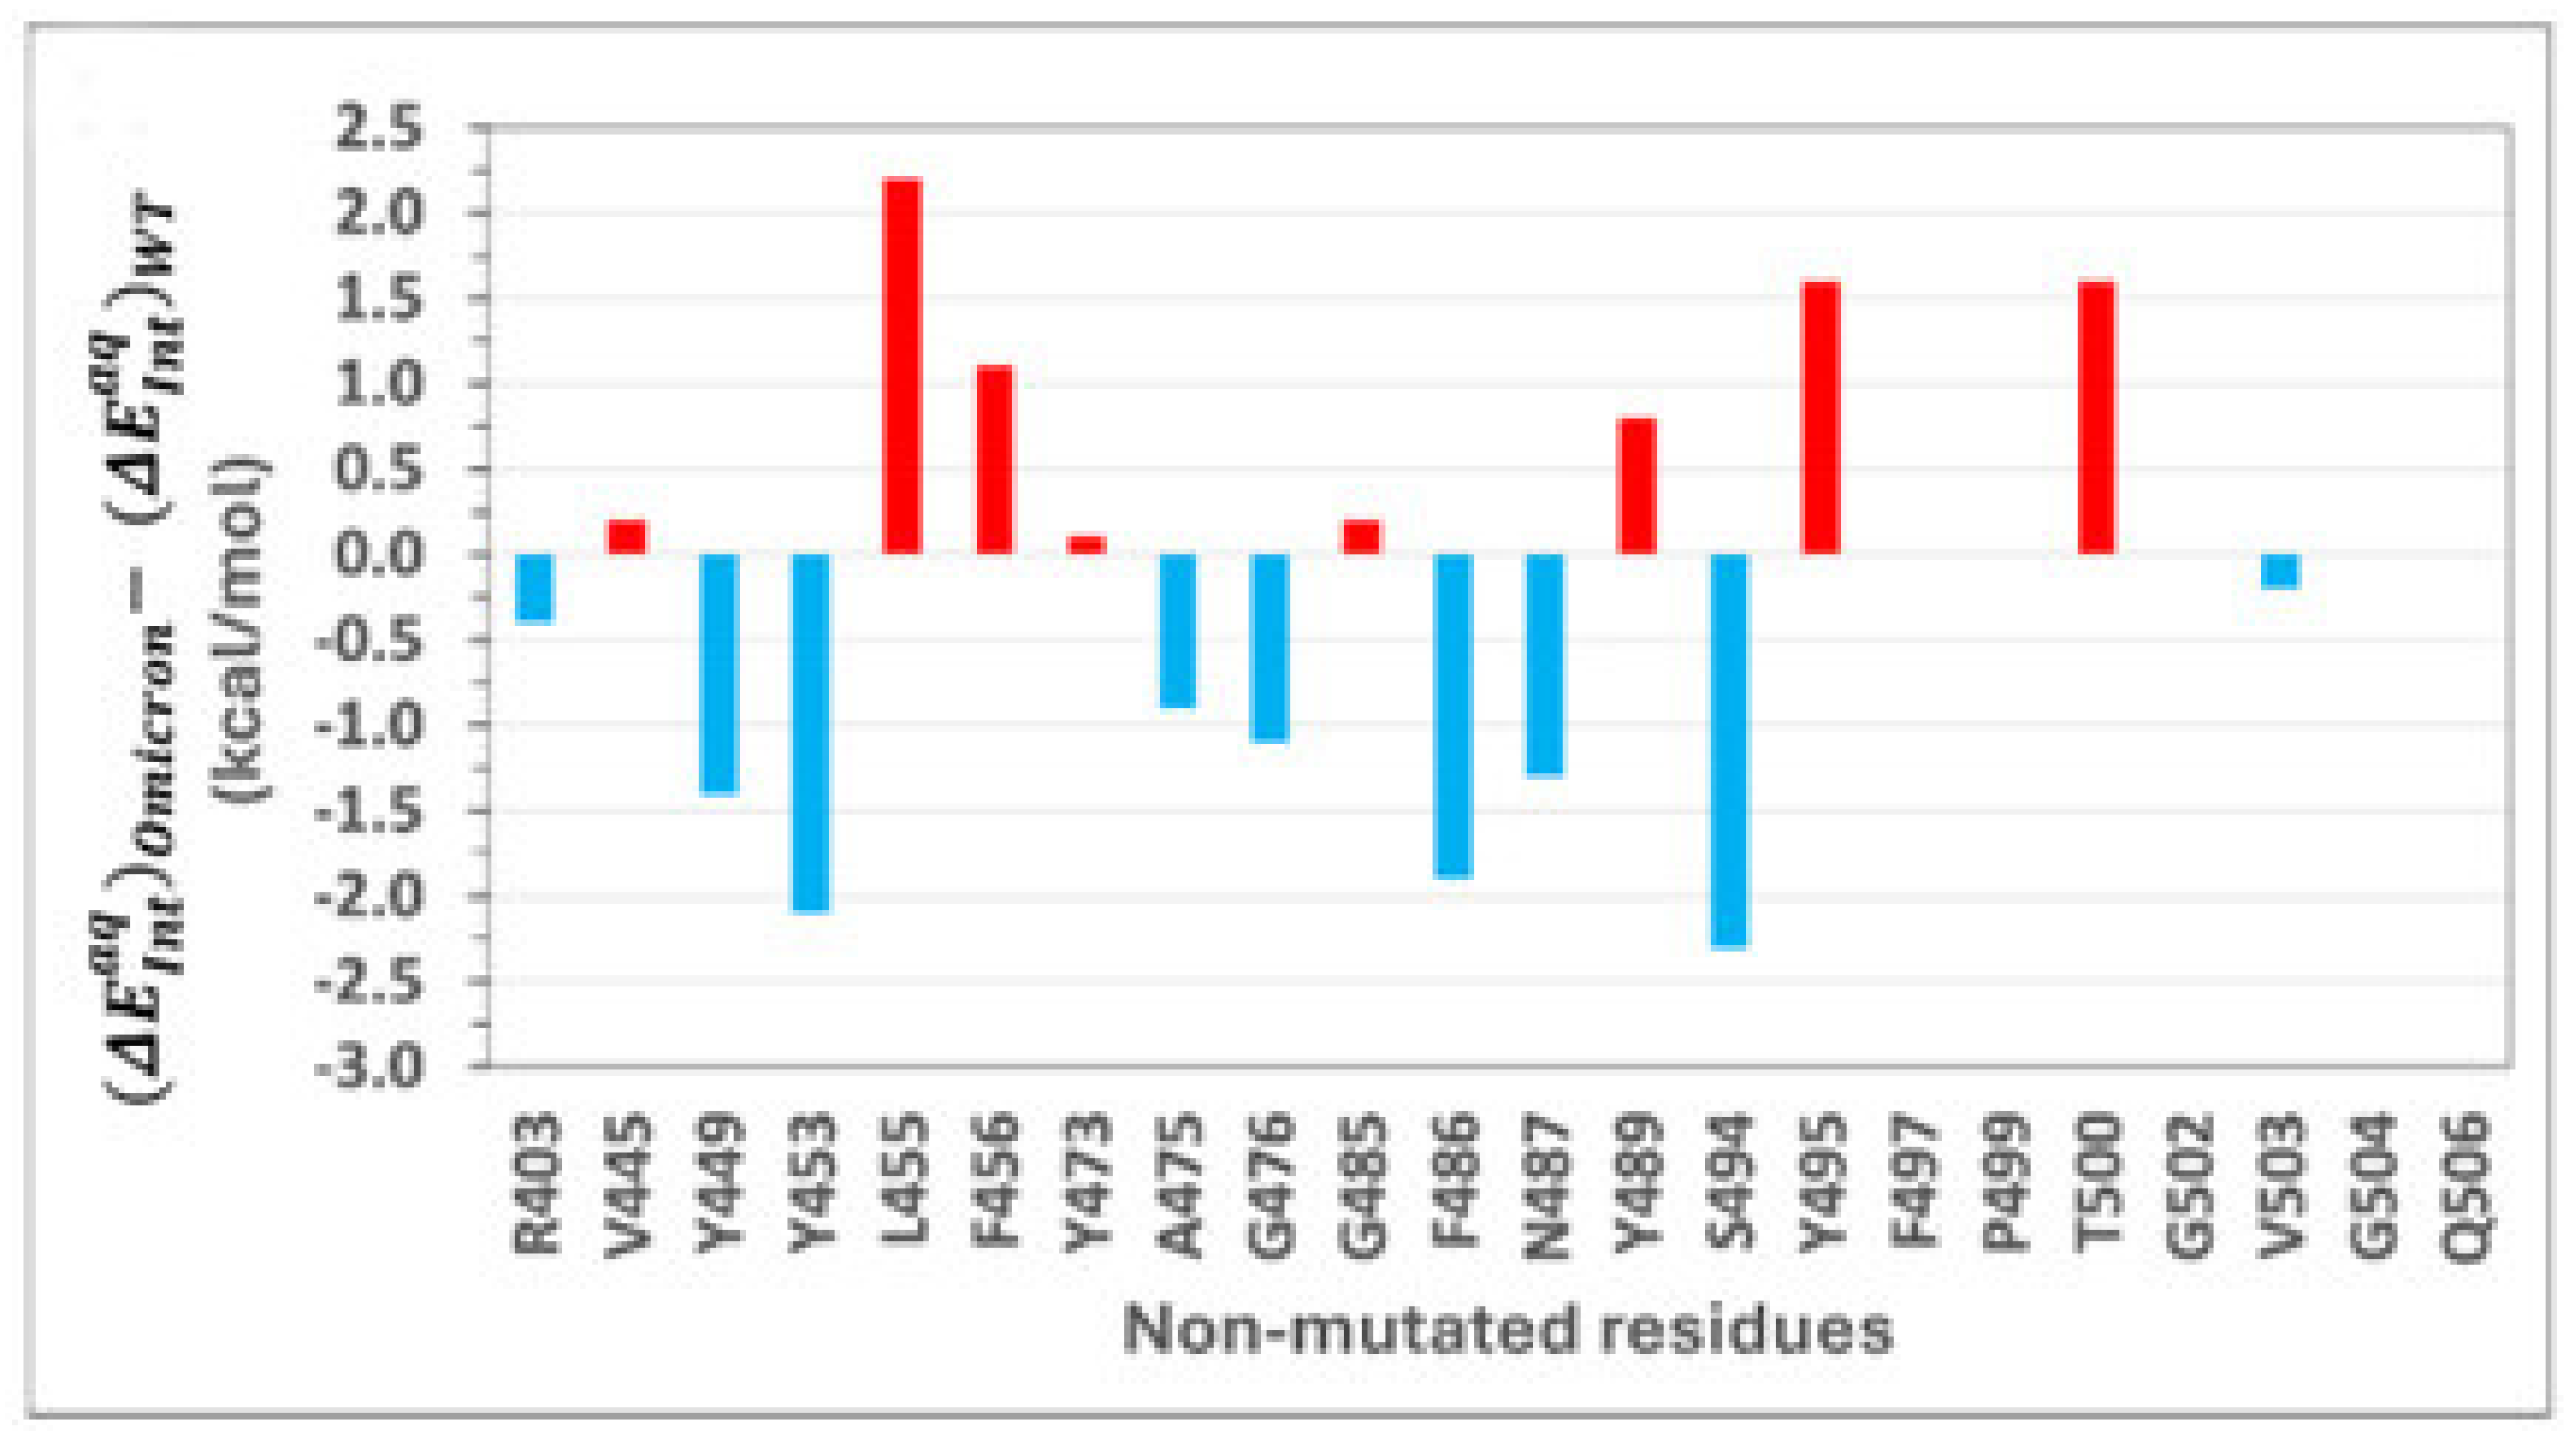
2.4. Role of Non-Mutated Residues in Binding of Omicron
Can mutations in the RBD alter the overall binding affinity not only through direct interactions but also via allosteric effects on the binding environments of non-mutated residues? To address this question, we investigated the energetic contributions of non-mutated residues in both WT and Omicron RBD-ACE2 complexes.
Figure 5 shows intermolecular interaction energy differences
for non-mutated RBD residues between the Omicron and wild-type variants. A detailed list of those interaction energy differences is provided in
Table S1. Residues with negative energy differences represent a gain in interaction energy for Omicron, whereas positive differences indicate a loss. While the number of non-mutated residues in the WT–ACE2 interface is larger than that in the Omicron one, the interaction energies of residues unique to either interface are negligible. Among the 23 non-mutated residues common to both interfaces, only 10 make significant energetic contributions to overall binding.
The magnitudes of interaction energies of some residues are higher in the WT, while others are enhanced in Omicron. Residues such as L455, F456, Y489, Y495, and T500 contribute more significantly to WT binding, whereas residues Y449, Y453, A475, G476, F486, N487, and S494 have greater contributions in Omicron.
This variation in energetic contributions can be linked to the allosteric influence of Omicron’s numerous mutations, which subtly alter the binding environments of non-mutated residues.
Figure 6 provides a detailed comparison of the binding environments and non-bonded interactions of representative non-mutated residues in the RBD of the wild-type SARS-CoV-2 and the Omicron variant. In each panel, the upper part shows one of the WT RBD residues, its surrounding interacting residues in ACE2 (within 5.6 Å), and non-bonded interactions, while the lower part illustrates the same non-mutated residue in Omicron, its surrounding interacting residues in ACE2 (within 5.6 Å), and non-bonded interactions.
As shown in
Figure 6, although these residues remain unchanged, structural rearrangements induced by Omicron mutations influence their alignment, proximity, and binding environment, leading to altered non-bonded interaction strengths. Key residues such as A475 exhibit novel stabilizing interactions in Omicron, including a hydrogen bond with ACE2 residue S19, which is absent in the wild-type structure. Other residues, such as Y453 and F486, show enhanced π–π and CH–π interactions due to improved spatial alignment in the Omicron RBD. These modifications highlight the role of allosteric effects in optimizing binding interfaces: mutations in the RBD induce subtle positional shifts that enhance the interaction energies of non-mutated residues, such as G476 and N487, with ACE2. The non-mutated residues collectively enhance Omicron’s overall binding affinity, with calculations showing an increased contribution of interaction energy from these residues in Omicron compared to WT.
Overall, findings from this work underscore the importance of both the direct and indirect effects of mutations in driving Omicron’s enhanced ACE2 binding affinity. As demonstrated in
Figure 6, direct mutations in the RBD can cascade into broader structural rearrangements, underscoring the interconnectedness of the RBD–ACE2 binding interface and the crucial role of allosteric modulation in driving Omicron’s enhanced transmissibility. This insight provides a nuanced understanding of how indirect effects complement the direct binding contributions of mutations, offering a detailed molecular basis for the variant’s heightened infectivity.
3. Discussion
The recently emerged SARS-CoV-2 variant of concern (VOC), Omicron, has become the dominant global variant due to its extraordinary infection rate and efficient transmission [
10,
11]. Its receptor-binding domain harbors a large number of mutations, many of which are located in the ACE2 binding interface. These mutations influence the strength of binding to ACE2, which is a key determinant of infectivity. Evaluating the effect of these mutations on Omicron’s binding affinity is therefore essential for understanding its transmissibility and designing effective therapeutic interventions. This work makes a significant contribution to the field by establishing a robust theoretical framework for predicting the effects of RBD mutations on the binding affinity of SARS-CoV-2 variants to the ACE2 receptor. The strong concordance between calculated energy differences and experimental deep mutational scanning (DMS) data highlights the reliability of this approach in capturing mutation-induced changes in the virus–host interaction.
It is worth noting that the per-residue interaction energy presented here was derived directly from our quantum chemical (QC) calculations. Compared to indirect energy decomposition schemes based on MM/PBSA and MM/GBSA, this direct QC approach offers greater accuracy and fewer approximations. While MM/PBSA- and MM/GBSA-based schemes rely on molecular mechanics force fields, continuum solvation models, and approximate entropy terms to decompose binding free energies, QC methods calculate interaction energies from first principles, naturally accounting for electronic polarization, charge transfer, and dispersion without empirical parameterization. Consequently, QC calculations minimize the approximations associated with force fields, continuum solvent models, and decomposition protocols, producing a more theoretically rigorous and potentially more accurate representation of intermolecular interactions. Although the computational cost is higher, the fundamental accuracy achieved by direct QC calculations makes them a superior choice for obtaining a detailed and reliable understanding of intermolecular interaction energies, free from the layers of approximations inherent in MM-based methods.
Correlation with Existing Knowledge
Our study aligns with previous findings that mutations in the RBD can both positively and negatively impact binding affinity to ACE2 [
36,
37,
38]. Structural and energetic analyses revealed that Omicron’s RBD–ACE2 interface contains eight mutated residues, a reduction in the number of interacting residues compared to the WT–ACE2 interface. While some mutations, such as K417N, G446S, G496S, and Y505H, were identified as destabilizing due to their disruption of key interactions, others, including S477N, Q493R, Q498R, and N501Y, were found to enhance binding through novel or stronger interactions. These results corroborate previous experimental and computational studies demonstrating the dual impact of Omicron mutations on binding affinity [
18,
20].
The destabilizing mutation K417N, which replaces a positively charged lysine with a neutral asparagine, disrupts the salt bridge with ACE2 residue D30, consistent with its reported role in immune evasion and reduced binding affinity in other variants [
39,
40]. Similarly, G446S and G496S reduce binding affinity by losing critical hydrogen bonds with ACE2 residues Q42 and K353, respectively. The substitution of Y505 with H505 further weakens binding due to the smaller aromatic side chain and loss of phenol-mediated interactions, although it retains some CH–π interactions with ACE2 residues.
Conversely, stabilizing mutations provide insight into Omicron’s enhanced binding affinity. The S477N mutation introduces a bifurcated hydrogen bond with ACE2 residue S19, a structural feature reported in prior studies and confirmed in our calculations. The Q493R and Q498R mutations replace neutral glutamine residues with positively charged arginine, enabling the formation of strong salt bridges with ACE2 residues E35 and D38, respectively. These mutations also establish additional interactions, such as CH–π and cation–π interactions, further strengthening the binding affinity. Finally, the N501Y mutation, present in most VOCs except for Delta, significantly enhances binding affinity by introducing π–π interactions with the ACE2 residue Y41, as well as additional CH–π and cation–π interactions with K353. These findings align with prior studies that reported similar enhancements in binding due to these mutations, including a dramatic increase in binding affinity with combined mutations Q498R and N501Y in vitro [
41].
Modeling the RBD–ACE2 interfaces
To model the binding between the Spike RBD and ACE2, ideally, the entire complex should be considered. However, due to the technical constraints of the B2PLYP method, the protein–protein complex must be reduced to a protein–protein interface. As described above, the RBD–ACE2 interface was constructed based on the geometric proximity of residues from RBD and ACE2, using a 5.6 Å contact distance cutoff. This approach resulted in an interface model comprising 34 RBD residues and 35 ACE2 residues for the wild-type virus, and 31 RBD residues and 34 ACE2 residues for the Omicron variant.
An alternative interface model was generated using the OV + rCSU contact map analysis method [
42], implemented at website
http://pomalab.ippt.pan.pl/GoContactMap (accessed on 12 February 2025). This hybrid approach integrates Overlap (OV) Contact Maps and Repulsive Contacts of Structural Units (rCSU) to enhance the representation of residue interactions in protein structures. The OV contact map defines residue contacts based on the geometric overlap of spherical representations of amino acids, providing an intuitive structural perspective. In contrast, the rCSU contact map refines the conventional Contacts of Structural Units (CSUs) method by incorporating both geometric and chemical properties, including Coulombic interactions, to better capture electrostatic effects. By combining these two approaches, the OV + rCSU method leverages the geometric clarity of OV with the physicochemical precision of rCSU. Its application to the RBD–ACE2 complexes resulted in smaller models of the interfaces, as detailed below.
For the wild-type virus, the refined interface model consists of 26 RBD residues and 26 ACE2 residues. The RBD component includes all residues listed in
Table 1, except for G447, G485, F490, L492, S494, F497, P499, and Q506. Similarly, the ACE2 component includes all
Table 1 residues, except for I21, E23, K26, F32, N49, Q76, A80, E329, and F356. For the Omicron variant, the refined model consists of 25 RBD residues and 26 ACE2 residues. The RBD component retains all
Table 1 residues, except for N417, Q474, G485, F497, P499, and Q506, while the ACE2 component excludes T20, E23, K26, F32, A80, L351, G352, and F356.
Interestingly, the excluded RBD residues contributed negligibly to ACE2 binding affinity. In the wild-type virus, the omitted residues—G447, G485, F490, L492, S494, F497, P499, and Q506—exhibited solution-phase interaction energies of 0.1, −0.1, 0.4, 0.1, −0.2, −0.4, 0.0, and −0.1 kcal/mol, respectively (see
Table 2). The combined energetic contribution of these residues totals only −0.2 kcal/mol. Similarly, for the Omicron variant, the excluded residues—N417, Q474, G485, F497, P499, and Q506—had solution-phase interaction energies of −0.3, 0.0, 0.3, −0.4, 0.0, and −0.1 kcal/mol, respectively (see
Table 3), resulting in a total interaction energy of −0.5 kcal/mol.
Thus, the refined interface models successfully retain all essential RBD residues that contribute meaningfully to intermolecular interactions with ACE2. These findings support the potential of the OV + rCSU contact map method [
42] for future applications in modeling protein–protein interfaces.
Relevance and Significance
Our study confirms that Omicron’s heightened ACE2 binding affinity is a direct result of both stabilizing mutations and subtle structural rearrangements induced by a large number of mutations. Importantly, these mutations also exert allosteric effects on non-mutated residues, altering their binding environment and enhancing overall binding affinity. For example, the formation of a new hydrogen bond between A475 and S19 in ACE2 in Omicron enhances its interaction energy by −0.9 kcal/mol, a feature absent in the WT. These allosteric effects highlight the interconnectedness of the RBD–ACE2 binding interface and the cumulative impact of mutations on overall binding strength.
Notably, the energetic contributions of non-mutated residues to binding affinity are larger than those of mutated residues, underscoring their central role in maintaining strong interactions. The stronger binding observed in Omicron for certain non-mutated residues, such as Y449, Y453, and A475, may result from enhanced geometrical proximity and better alignment caused by structural rearrangements. These findings provide a nuanced understanding of how Omicron mutations affect not only their own interactions but also those of neighboring residues.
Implications for Omicron’s Enhanced Infectivity
The higher binding affinity of Omicron to ACE2, supported by both experimental and theoretical studies, serves as a biophysical explanation for its high infectivity and rapid global spread. The observed interplay of stabilizing and destabilizing mutations demonstrates how Omicron balances immune evasion with enhanced receptor binding, highlighting its evolutionary adaptability. This adaptability underscores the importance of closely monitoring emerging variants and understanding their molecular mechanisms.
Broader Impact and Future Directions
Our findings provide critical insights into the molecular basis of Omicron’s increased transmissibility, which have broader implications for the study of other SARS-CoV-2 variants. Understanding the balance between stabilizing and destabilizing mutations, as well as their allosteric effects, can inform the design of next-generation vaccines and therapeutics. Specifically, targeting stabilizing mutations or exploiting destabilizing ones could provide new strategies to mitigate Omicron’s infectivity.
This research has significant implications for both SARS-CoV-2 and broader protein–protein interaction studies. The ability to predict the effects of residue mutation on binding affinity offers a valuable tool for understanding viral adaptations, guiding the development of antiviral therapies and vaccines. Future work should focus on integrating dynamic structural modeling and explicit solvent effects to refine energetic predictions further. It should be noted that our quantum chemical calculations of interaction energies were based on X-ray crystal structures, which inevitably neglect the conformational dynamics inherent to molecular systems, including thermal fluctuations, large-amplitude motions, and the broader energy landscape encompassing local minima and transition states. This problem is particularly pronounced for flexible regions of proteins, where the crystallographic structure captures only one of many possible conformations. Consequently, these limitations could potentially undermine the accuracy of predicted interaction energies and underscore the need for a more comprehensive approach, such as leveraging molecular dynamics simulations to account for thermal effects.
Furthermore, a recent study by Ray et al. highlights the critical role of not only thermodynamic stability but also binding kinetics in understanding Omicron’s enhanced transmissibility and neutralization resistance compared to earlier variants [
17]. Employing Atomic Force Microscopy coupled with Single-Molecule Force Spectroscopy (AFM-SMFS), Ray et al. precisely measured Omicron’s binding affinity and dissociation kinetics at the single-molecule level. Their findings revealed that Omicron exhibits the lowest dissociation rate (k
off) among the tested variants, meaning it remains bound to ACE2 for a significantly longer duration. Additionally, its equilibrium dissociation constant (K
D) was the lowest, indicating that Omicron forms the tightest and most stable interaction with ACE2. These findings align with epidemiological data, which suggest that Omicron’s increased transmissibility is driven, at least in part, by its enhanced receptor engagement, allowing for more efficient viral entry and infection.
Additionally, experimental validation of the predicted interactions, particularly those involving allosteric effects, will enhance the accuracy and applicability of computational findings. The interplay between computational and experimental approaches will be crucial in addressing ongoing challenges posed by SARS-CoV-2 and its evolving variants. Moreover, the generalizability of this framework to other host–pathogen systems and diverse protein–protein interactions emphasizes its potential to drive advances in virology, molecular biology, and therapeutic design.


