Article

Simulations of Lattice Vibrations in a One-Dimensional Triatomic Network

by
Romualdo Alejandro Ferreyra
1,*,† and
Alfredo Juan
2,†
1
Instituto de Ciencias Físicas–ICIFI, CONICET–UNSAM, Av. 25 de Mayo 1169, San Martín B1650HMK, Buenos Aires, Argentina
2
Instituto de Fisica del Sur–IFISUR, Universidad Nacional del Sur, Av. Alem 1253, Bahía Blanca B8000CPB, Buenos Aires, Argentina
*
Author to whom correspondence should be addressed.
These authors contributed equally to this work.
Physchem 2023, 3(4), 440-450; https://doi.org/10.3390/physchem3040028
Submission received: 15 November 2023 / Revised: 25 November 2023 / Accepted: 28 November 2023 / Published: 5 December 2023
(This article belongs to the Section Solid-State Chemistry and Physics)

Abstract

:
Using equivalent electrical circuits (EEC) is not common practice in several areas of physical chemistry. The phonon concept is used in solid-state works but much less frequently in branches of chemistry. Lattice vibration phenomena present a high complexity when solving equations in real systems. We present here a methodology that crosses disciplines and uses EEC that can be analyzed and solved using freely downloaded computer codes. To test our idea, we started with a one-dimensional lattice dynamics problem with two and three masses. The initial mechanical model is numerically solved, and then an equivalent circuit is solved in the framework of electrical network theory through the formalism of transfer function. Our lattice model is also solved using circuit analysis software. We found the dispersion relationship and the band gaps between acoustical and optical branches. The direct solution of a mechanical model gives the correct answers, however, the electrical analogue could give only a partial solution because the software was not designed to be converted into an analogue simulator. Due to the finite size of the circuit elements, the number of computed frequencies is less than those expected for two unit cells and right for eight. On the other hand, by using a huge number of electrical components, the network behaves like a low-pass filter, filtering higher frequencies.

1. Introduction

Lattice dynamics is an important subject in solid-state physics. However, the amount of papers that use the keyword phonon in chemistry is less extended when compared with physics publications. Accorinti et al. [1] remarked on two ontologies for the matter. At the point when the composition of chemical substances is required, the most well-known model is that presented by the standard atomic model, as per which matter is made out of atoms moving. Nonetheless, there is an alternate philosophy for the instance of solid-state matter in light of the phononic model. As per that model, solids are made out of particles at rest and phonons moving. All branches of engineering will be the workforce to push forward the development of the future materials or electronic devices, in most of which, phonons play an essential role. Rich and Frontiera uncover the role of coherent phonons during the photoinduced phase change in a molecular periodic solid [2]. Recently, Porter et al. explained the role of coherent phonons in antimony in ultrafast laser spectroscopy experiments. This type of experiments is an important tool in physical chemistry to study the dynamics on their natural time scales [3]. As photons are the quantization of the electromagnetic field, phonons are the quantization of the elastic field. A phonon is a quasiparticle related with a compressional wave like sound or a vibration of a crystal lattice and is a collective excitation. It is a common practice in physical and organic chemistry to study molecular vibrations in gas or liquid phases and interpret IR spectra. However, understanding the concept of phonons and their relationship with vibrations requires a much more complex analysis. Several useful concepts that involve phonons are dispersion relationships, optical and acoustical branches, and band gaps. We can start by remembering that elastic or electrical waves always behave similarly. Linear chains of masses and springs are used in classical textbooks to treat lattice vibrations [4,5]. The one-dimensional case is frequently used to explain the basic ideas. Experimental setups can improve the understanding, for instance, a mechanical analogue; a modified linear air track, onto which a linear chain comprised of cars of adjustable mass (particle mass) interconnected by coil springs (interaction force between particles) [6]. Eggert [7] presented a mechanical analogue, a ring formed with springs and masses in series, for a one-dimensional harmonic lattice with periodic boundary conditions, including two oscillators, two set of mass and spring, per unit cell and an isotopic impurity by substituting heavy for light mass and vice-versa. The electrical analogue, a cascade of inductors and capacitors ( L C ) circuits, both experimental [8] and simulated [9] are also used to understand lattice vibrations. The mathematical equations of motion that describe one-dimensional lattice vibrations are isomorphic to those of an electrical circuit, with force constants related to electrical inductances and masses to capacitances. Scott et al. [8] proposed to represent a transmission line, a cascade of L C circuits, of a real circuit, exciting from the input of the electrical network and measuring the frequency response at its output with an oscilloscope. Vega et al. [9] developed a computer-aided modelling electric analogue for lattice dynamics representing a system with two masses with a cascade of adjacent L 1 C 1 and L 2 C 2 circuits, with C 1 = C 2 . This model was solved using a commercial electric circuit analysis software, today obsolete, and compared with the available exact mathematical solutions. Lately, Moy emulated one-dimensional crystals by superconducting coplanar two-dimensional waveguide segments and determined the wave velocity of long-wavelength acoustic phonons [10]. According to their length, some waveguide behaves as inductance and other as capacitance. Once again, we have a transmission line formed by a cascade of L C circuits. Vibrational analysis in several materials such as Benziodoxoles and Benziodazolotetrazoles and Iron carbonyls were reported by Yannacone et al. [11] and by Parker [12]. Vibrational properties of phononic circuits were also described using Green’s function method [13]. Electrochemical impedance spectroscopy users need to choose a relevant EEC to analyze their experimental data. Van Haeverbeke, et al. reviewed the use of EEC across various application domains [14]. Recently, G. Ding et al. [15] indicate that the topological interpretation of phonons is a new platform to be considered in physical chemistry. These authors demonstrated the appearance of ideal nodal-net, nodal-chain, and nodal-cage phonons in LiAlSe 2 , NaMgH 3 and AuBr. The analysis of lattice vibrations of a diatomic chain was extended by Kesavasamy and Krishnamurthy to a one-dimensional triatomic chain [16]. The solutions for the dispersion relations were analyzed for some special cases, such as the vibrations of a monatomic chain and the vibrations of linear AB 2 -type ionic and molecular lattices. Bickham et al. and Kiselev et al. studied localized modes in a one-dimensional monatomic lattice and anharmonic gap mode in a one dimensional diatomic and triatomic lattices [17,18]. More recently, He et al. [19] studied the dual-tuning mechanism for elastic waves in a triatomic lattice with string stiffening. The goal of this manuscript is to simulate mechanical models of three different masses in a linear chain and the electrical analogue, both via graphical user interface (GUI) of modern, easy-to-use free software and a circuit simulator. One of the main advantages of this approach is that almost no special mathematical skills are required for the simulations, and that the components can be easily changed to explore various configurations and obtain the frequency response. This work is structured as follows: in Section 2 present the mathematical equations that describe our models, then in Section 3 the mechanical model is numerically solved, we move on with the electrical analogue model for a one-dimensional triatomic lattice in Section 4, and conclude with Section 5 where we present the main goals and limitations of our simulations.

2. Formulation

Several solid-state physics textbooks explain lattice vibrations in one and three-dimensional lattices [4,5,20]. An exact solution for a triatomic lattice was developed by Kesavasamy and Krishnamurthy [16]. A one-dimensional crystal lattice is a chain with n links or cells ( n ) immersed in an energy potential in such a way that the movement of one cell influences the others. In this work, we will consider a linear triatomic lattice consisting of n unit cells. Each cell has three particles of mass M 1 , M 2 , and M 3 located alternately in the nth unit cell with a periodicity a (see Figure 1). Only the first neighbors’ interactions are considered in this model. As n increases, the border effects become less important, and in the limit we can apply the Born-Von Karman periodic conditions [4]. In this cyclic situation, the n + 1 cell is equivalent to cell 1 (see Figure 2). Let U, V, and W be the displacements of the three masses from the equilibrium positions. The masses are connected with springs with force constant k i .
The equations of motion for small vibrations, and atomic displacements, can be written as [4,5,16]:
M 1 d 2 U n d t 2 = k 2 ( V n U n ) + k 1 ( W n 1 U n ) M 2 d 2 V n d t 2 = k 2 ( U n V n ) + k 3 ( W n V n ) M 3 d 2 W n d t 2 = k 1 ( U n + 1 W n ) + k 3 ( V n W n )
where U n , V n , and W n are harmonic functions describing normal-mode solutions having the form:
U n = U 0 e i ( n K a ω t ) V n = V 0 e i ( n K a ω t ) W n = W 0 e i ( n K a ω t )
where n is an integer, K is the wave number, and ω the oscillation frequency of a normal mode. The differential equations requires:
0 = U 0 ( k 1 ω 2 M 1 + k 2 ) V 0 k 2 W 0 k 1 e i K a 0 = U 0 k 2 + V 0 ( k 2 ω 2 M 2 + k 3 ) W 0 k 3 0 = U 0 k 1 e i K a V 0 k 3 + W 0 ( k 1 ω 2 M 3 + k 3 )
and for a non-trivial solution, the coefficient determinant must be null:
( k 1 ω 2 M 1 + k 2 ) k 2 k 1 e i K a k 2 ( k 2 ω 2 M 2 + k 3 ) k 3 k 1 e i K a k 3 ( k 1 ω 2 M 3 + k 3 ) = 0
Solving Equation (4), we obtain:
M 1 M 2 M 3 ω 6 M 1 M 3 ( k 2 + k 3 ) + M 1 M 2 ( k 1 + k 3 ) + M 2 M 3 ( k 1 + k 2 ) ω 4 + ( M 1 + M 2 + M 3 ) ( k 1 k 2 + k 2 k 3 + k 1 k 3 ) ω 2 2 k 1 k 2 k 3 ( 1 c o s ( K a ) ) = 0
Equation (5) is a cubic equation on ω 2 that provides a dispersion relationship ω ( K ) for the normal modes (that modes when quantized are called phonons). It could be resolved by the formulation of Cardano [21]. However, in this work, we will rely on the practicality of numerical solutions. For a given lattice wave vector K and a lattice constant a, Equation (5) can be numerically solved. The term ( 1 cos ( K a ) ) depends on K a values within an interval of π , so we will consider values for K in the interval [ 0 , π / a ] of the first Brillouin zone by symmetry [5].

3. The Solution for the Mechanical Model

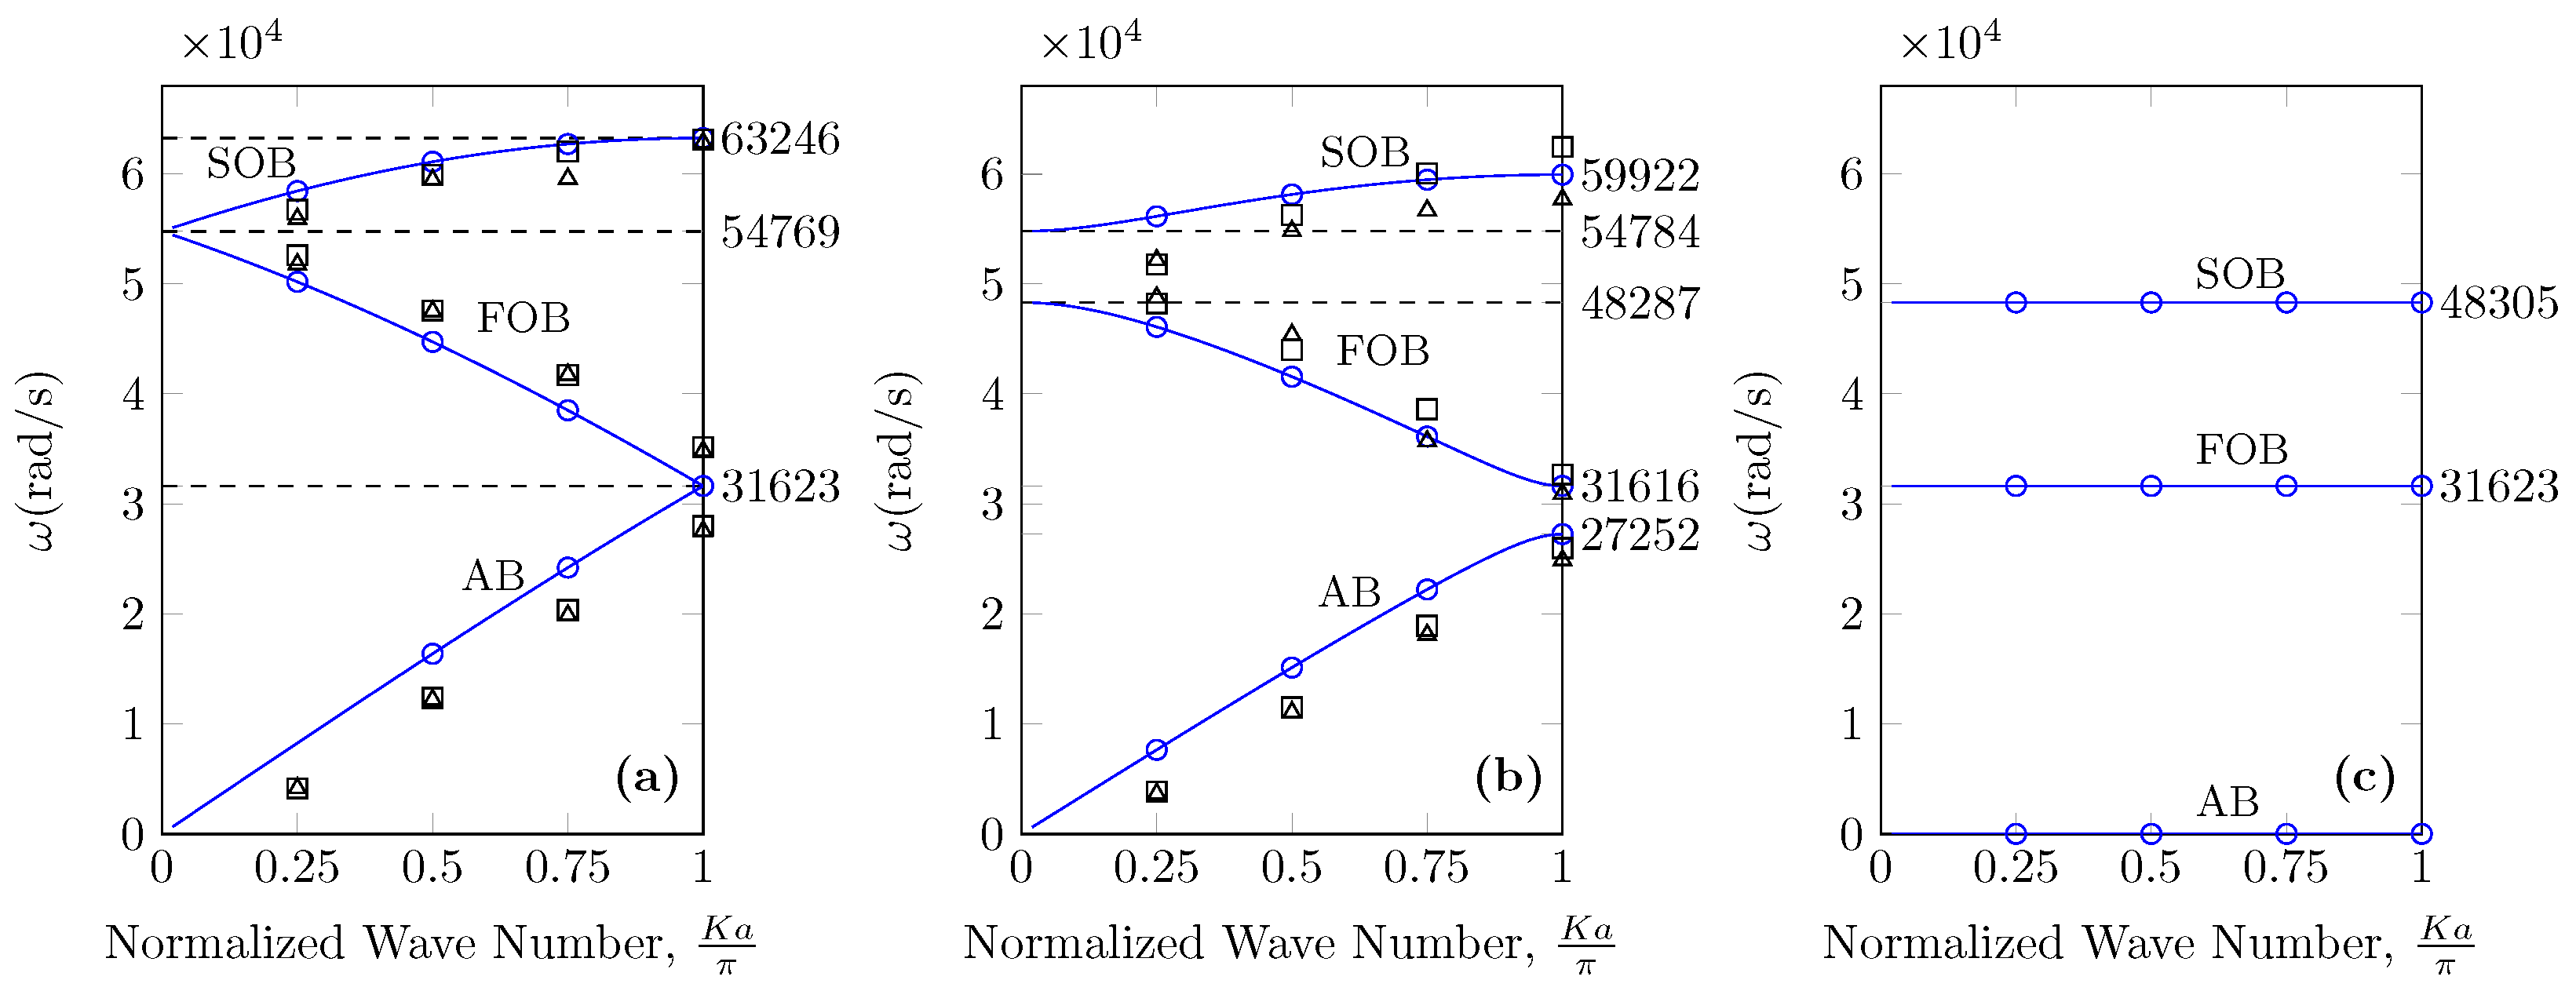
Equation (5) is solved by using Julia programming language [22] for the dispersion relationship ω ( K ) . A GUI is provided as supplementary material (See Julia folder in the supplementary material section). The GUI counts with sliders to set all three masses and spring constants and also the number of unit cells. The resulting dispersion relationship for K : [ 0 , π / a ] of acoustic phonon (AP) and optical (OP) phonon branches, including the band gap, are plotted in a graph. Furthermore, displayed data can be saved in a file with the “txt” extension. Table 1 presents the values of masses and force constants of the atomic configurations studied, the well-known cases of mono-atomic (I) or diatomic (II and III). For case, I, the theoretical frequency limit values for the first Brillouin zone [16] are: k / M , 3 k / M , and 4 k / M . Replacing the values given in Table 1 for k and M in the theoretical expressions, we obtain the values: 31.623, 54.769, and 63.246 krad/s, respectively. From Figure 3a we can see that the obtained values by Julia are in agreement with the theoretical ones. Observe that at K a / π = 1 , these results could lead to a misconception about the frequency band structure, (a) AP branch, (b) and (c) OP branches. The obtained solutions describe waves propagating along the chain with phase velocity ω / K and group velocity d w / d K . The dispersion relationship is the same as the well-known problem of a monoatomic chain [4], with a periodicity of a / 3 . At K = π / a small, the relationship ω ( K ) is almost linear with K (see first branch in Figure 3a). When K π / a increases (upper part of Figure 3a) the dispersion curve becomes flat, that is the group velocity, as expected, drops to zero at the Brillouin boundary. Case II represents the study of normal modes of a one-dimensional lattice with a basis. From [16], the theoretical values for the first Brillouin zone limit frequencies are 0, k ( 1 / M 1 + 2 / M 2 ) , 3 k / M 1 at K = 0 , which gives the values 48.287 and 54.784 krad/s, respectively, for the given values of k, M 1 , and M 2 in Table 1. The dispersion relationship presents a band gap between the so-called optical and the acoustical branches, as expected. The lower branch has the same structure as the single branch we computed in the monoatomic Bravais lattice: ω is linear close to zero for small K π / a , and the curve becomes flat at the edges of the Brillouin zone. With a lattice of p atoms in the unit cell, there will be p 1 optical modes (2 in our case II) and only one acoustic branch for each polarization model. The second gap is a consequence of a 3-atom unit cell with M 1 = M 3 M 2 . Equation (5) was resolved with Julia given the values of 27.252, 31.616, and 59.922 krad/s for K = π / a . For K = 0 , the results given by Julia for n = 50 are coincident with the values obtained analytically by [16] (see Figure 3b). The case III of Table 1 expresses the limit when the spring becomes null. The theoretical frequency limit values (lines in Figure 3c) for the first Brillouin zone [16] are 0, k / M 1 , 2 k / M 2 + k / M 1 , taking the values 0, 31.623, 48.305 krad/s, respectively, for the values from the Table 1 used for k, M 1 , and M 2 for this case. The values obtained by Julia, 0, 31.6228, and 48.3046 krad/s are totally in agreement with the theoretical values.

4. The Electrical Analogue Model

An electrical line, analogous to the one dimensional triatomic lattice, is constructed using the method of association [8,9,16,25]. Two systems are analogous to each other if two conditions are satisfied: (i) The two systems are physically different, (ii) Differential equation modelling these systems are the same. Electrical and mechanical systems are two physically different systems with the same differential equations. There are two types of electrical analogies of translational mechanical systems [26]. Those are the force voltage analogy and the force current analogy. In this work as in Ref. [9], we use the force voltage analogy. Since we have three masses and three springs in the mechanical model, we must have three inductances ( L i with i = 1, 2, and 3) and three capacitors ( C i with i = 1, 2, and 3) in the electrical circuit [9]. Every single mass and spring constant is replaced by an inductance and capacitor, respectively, i.e., M 1 by L 1 and k 1 by 1 / C 1 . The electrical line is shown in Figure 4 for the triatomic unit cell. Figure 5 presents a finite cyclic circuit with 8 unit cells. Each one of them with inductances L 1 , L 2 , and L 3 and capacitors C 1 , C 2 , and C 3 . Their values for the cases I, II, and III are displayed in Table 1. We are using a finite chain because it is easy to simulate that in circuit analysis software, so a direct comparison with the infinite mechanical lattice is not possible. However, we believe that the main aspects are visible and useful from a practical point of view. The electrical equations are completely equivalent to the mechanical system (see reference [9]). The circuit in Figure 5 is two linear lossless, with no resistive elements e.g., resistance, transmission lines. The upper part, M, and the lower part, N, of the network. From an input-output point of view, the parts M and N are in parallel. The resulting electrical line can be analyzed using the electrical network theory [27]. The frequency-dependent voltage transfer function, Z ( ω ) , of a linear system (transmission line in our case) relates the output voltage, V O u t ( ω ) , of the system to its input voltage, V I n ( ω ) . In this case, the transfer function Z ( ω ) can be expressed as Z ( ω ) = V O u t ( ω ) / V I n ( ω ) . The function Z ( ω ) could bring us the normal modes or resonant frequencies of the network. Due to the losslessness of the line, Z ( ω ) will exhibit sharp peaks at these frequencies. The elements are then called L M i , C M i and L N i and C N i , see for i = 1 top Figure 6a,b. Each pair of L M i C M i and L N i C N i is presented in an equivalent circuit with the associated A B C D matrix [27], bottom Figure 6a,b for i = 1 . We proceed to analyze the circuits in Figure 5 whereas R I n indicates input resistances viewed from the generator side. In ideal cases, the R I n is null and the output impedance (not displayed here) is infinite (ideal probe). However, R I n could not be set to zero Ohm, because it is not difficult, but impossible to simulate the circuit in some cases. And R I n had to be fixed to a very small value (>0 Ω ). The resulting electrical analogue in terms of A B C D matrices to solve this electrical model in the ideal case is displayed in Figure 7. All matrices of the same type in M or N were considered together because there is no difference (invariant) when computing the transfer function. Thus, only the matrix A B C D M T i and A B C D N T i need to be obtained. Where A B C D M T i = ( A B C D M i ) n and A B C D N T i = ( A B C D N i ) n with i = 1, 2, and 3 and n the number of unit cells. To obtain the parallel of the two total parts is more convenient to introduce matrices Y M and Y N which are equivalent to A B C D M T o t a l or A B C D N T o t a l , which results from the multiplication of the matrices A B C D M T i and A B C D N T i , respectively. Finally, by adding Y N to, Y M we get the matrix Y T o t a l .
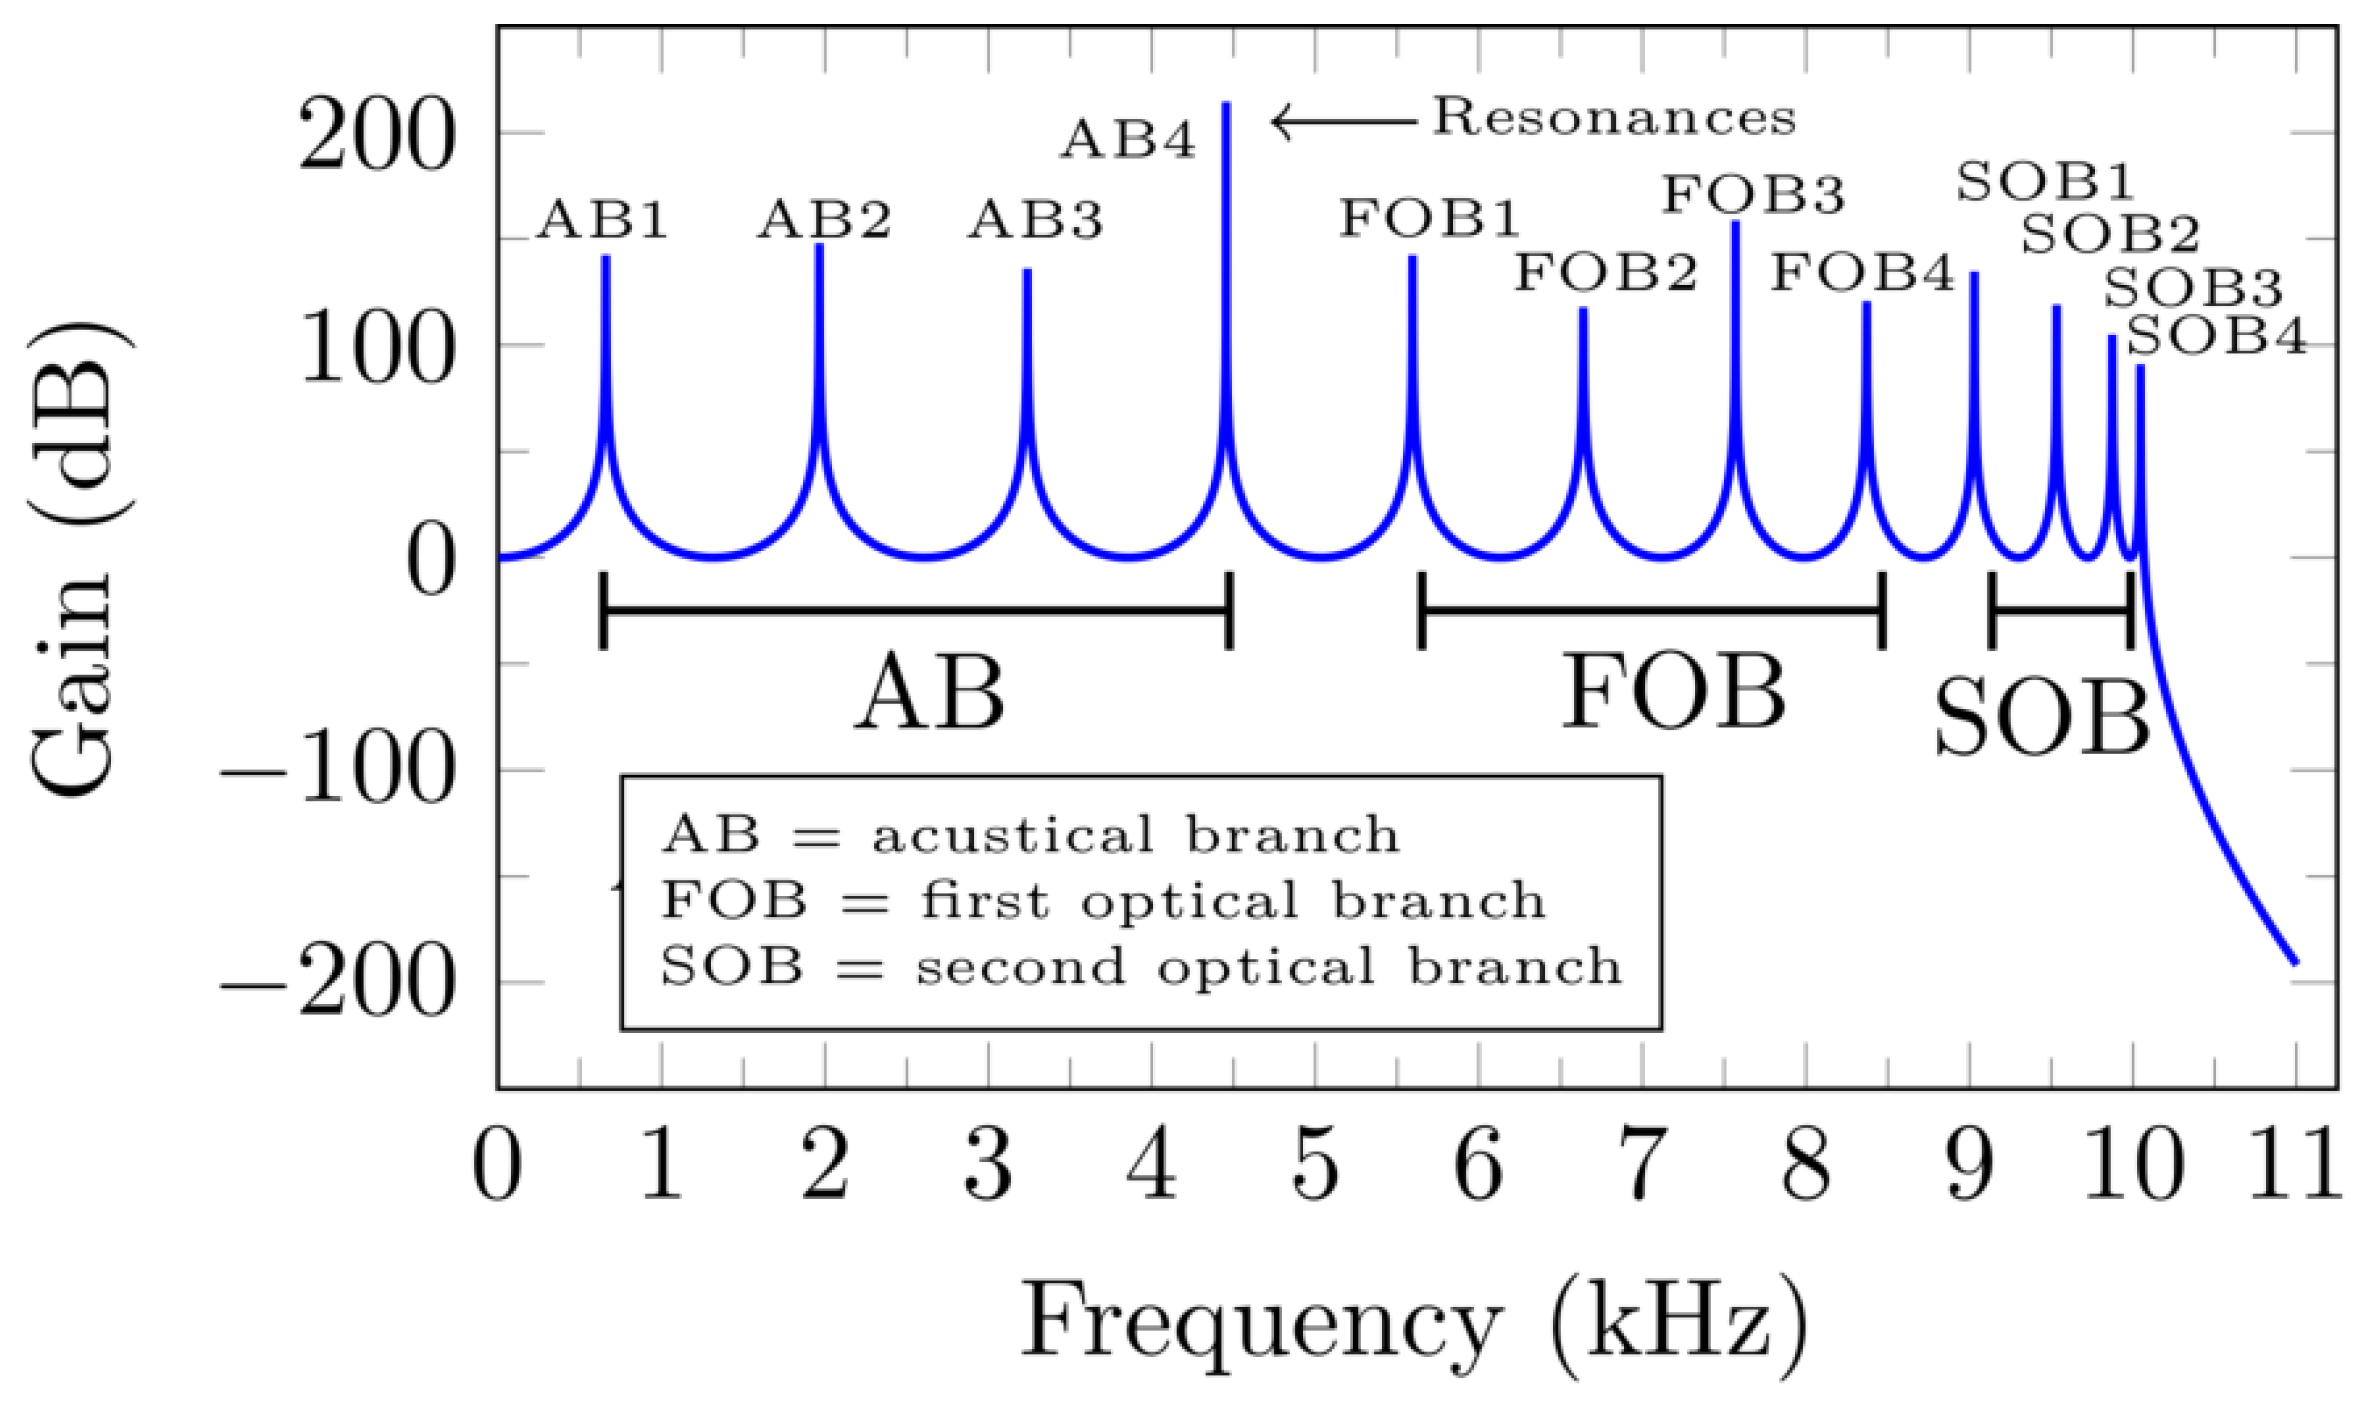
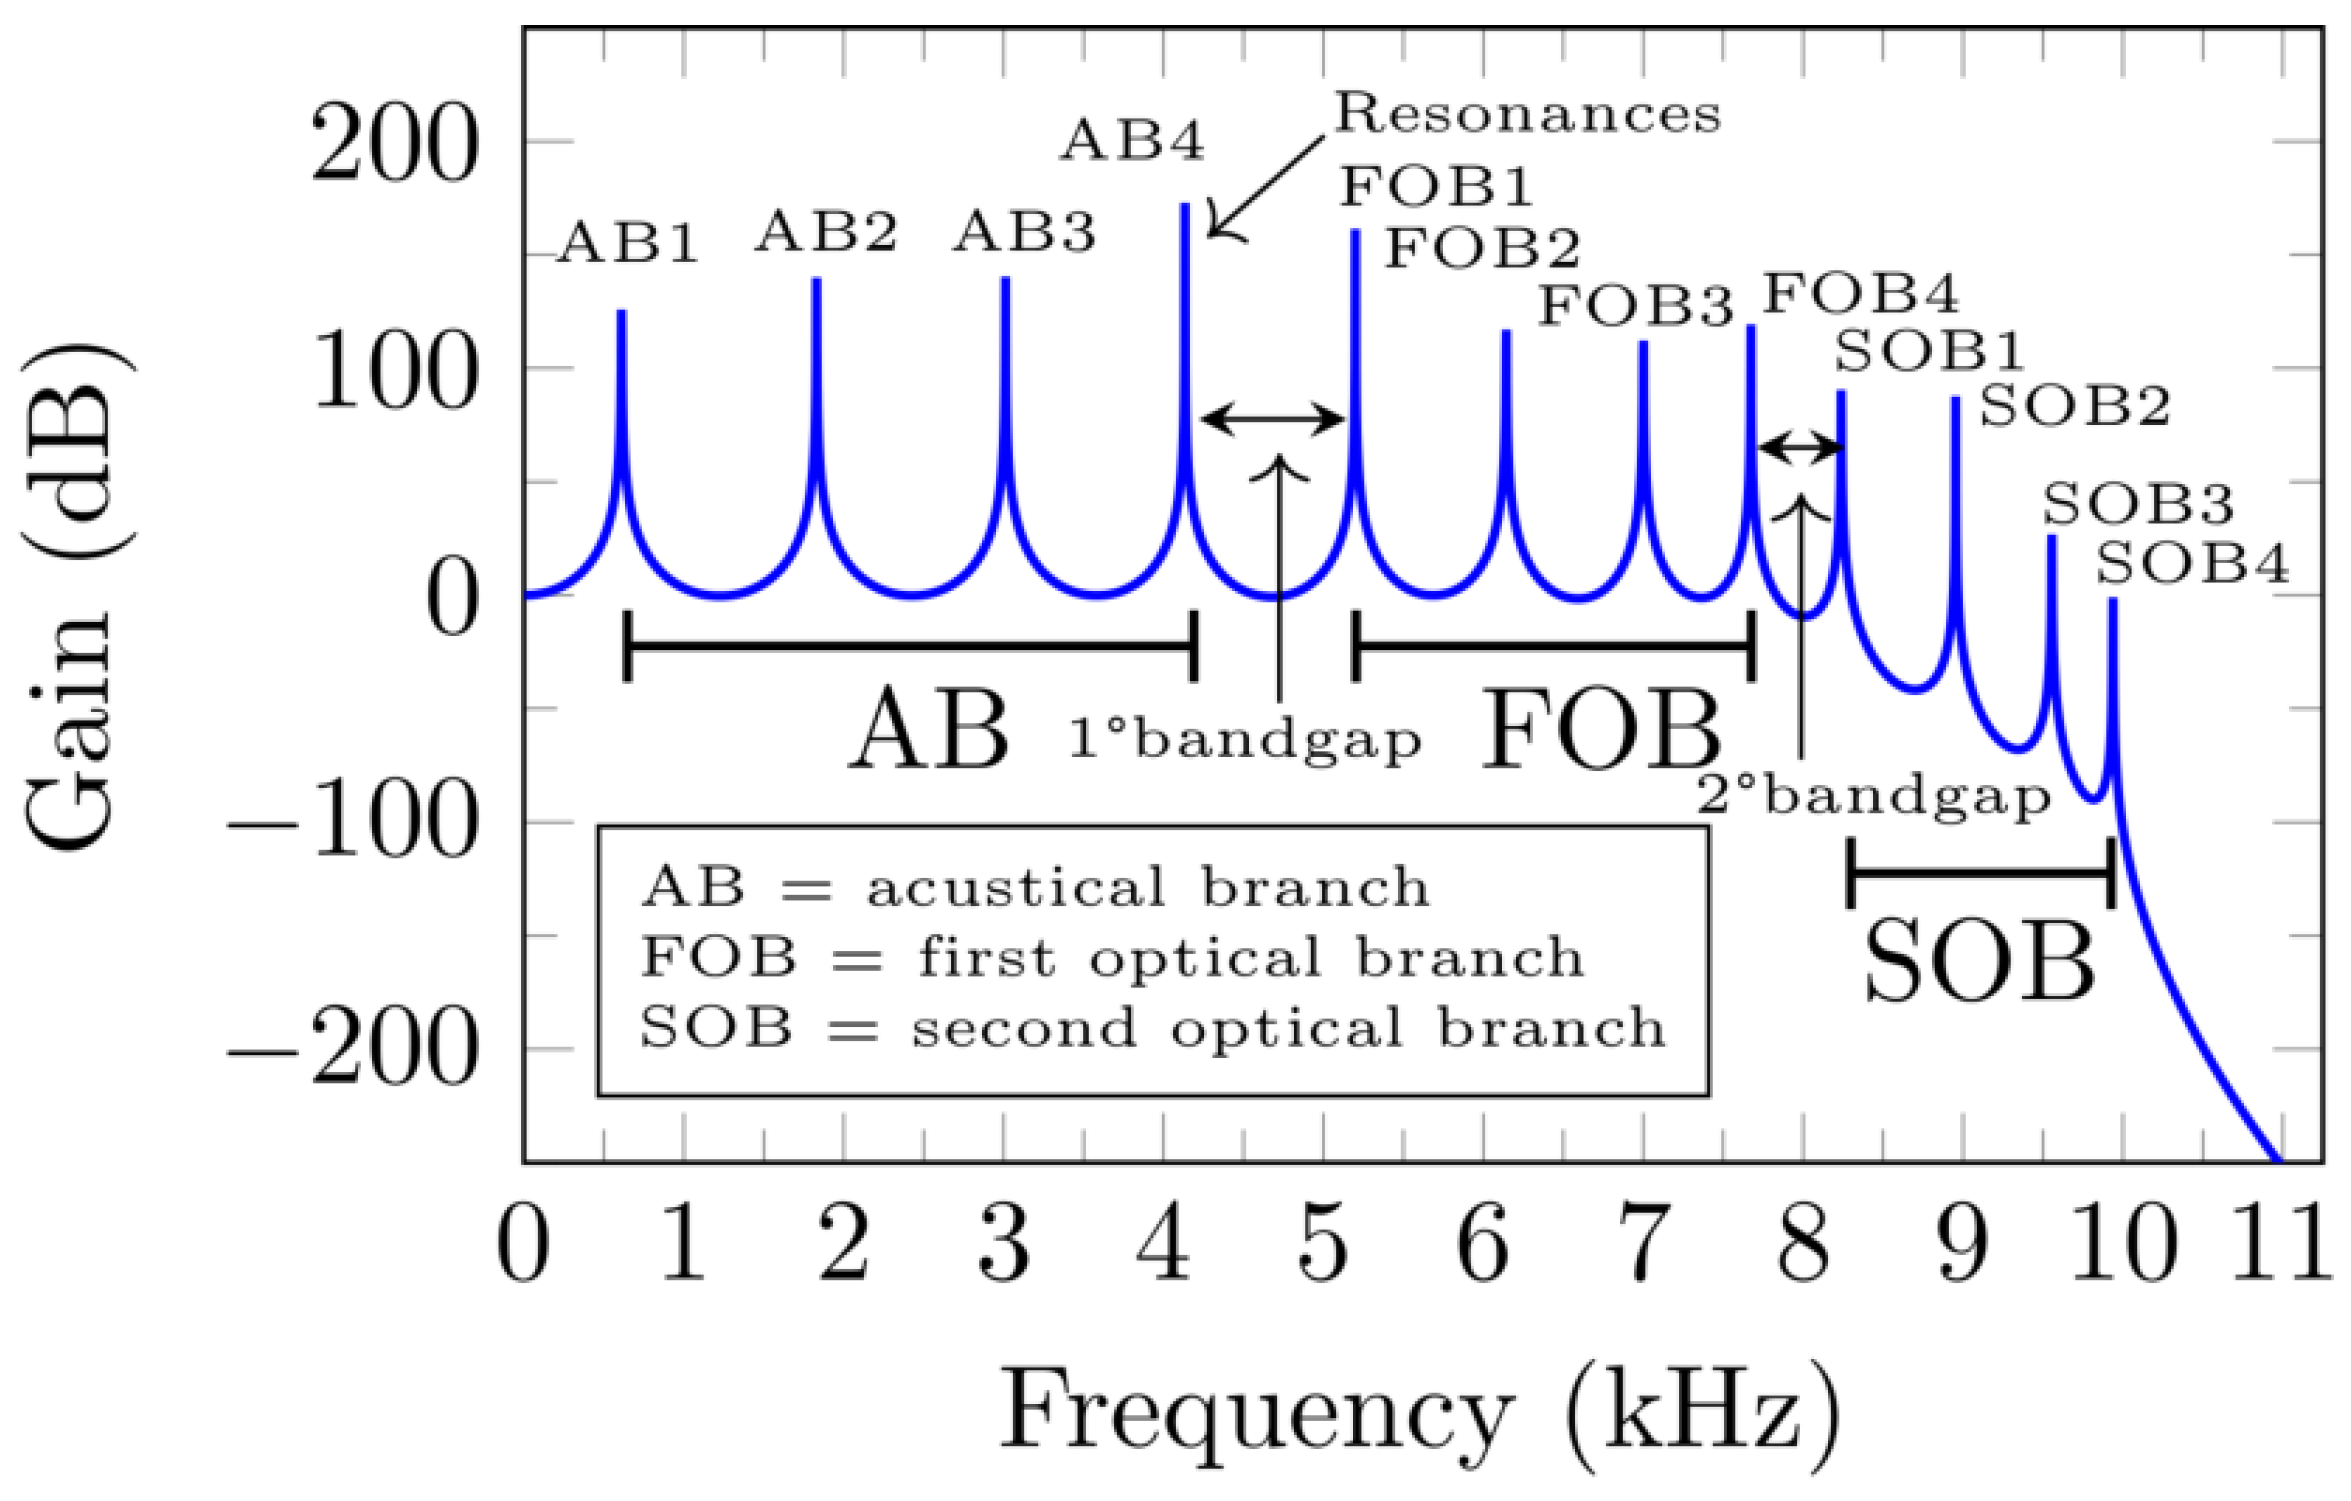
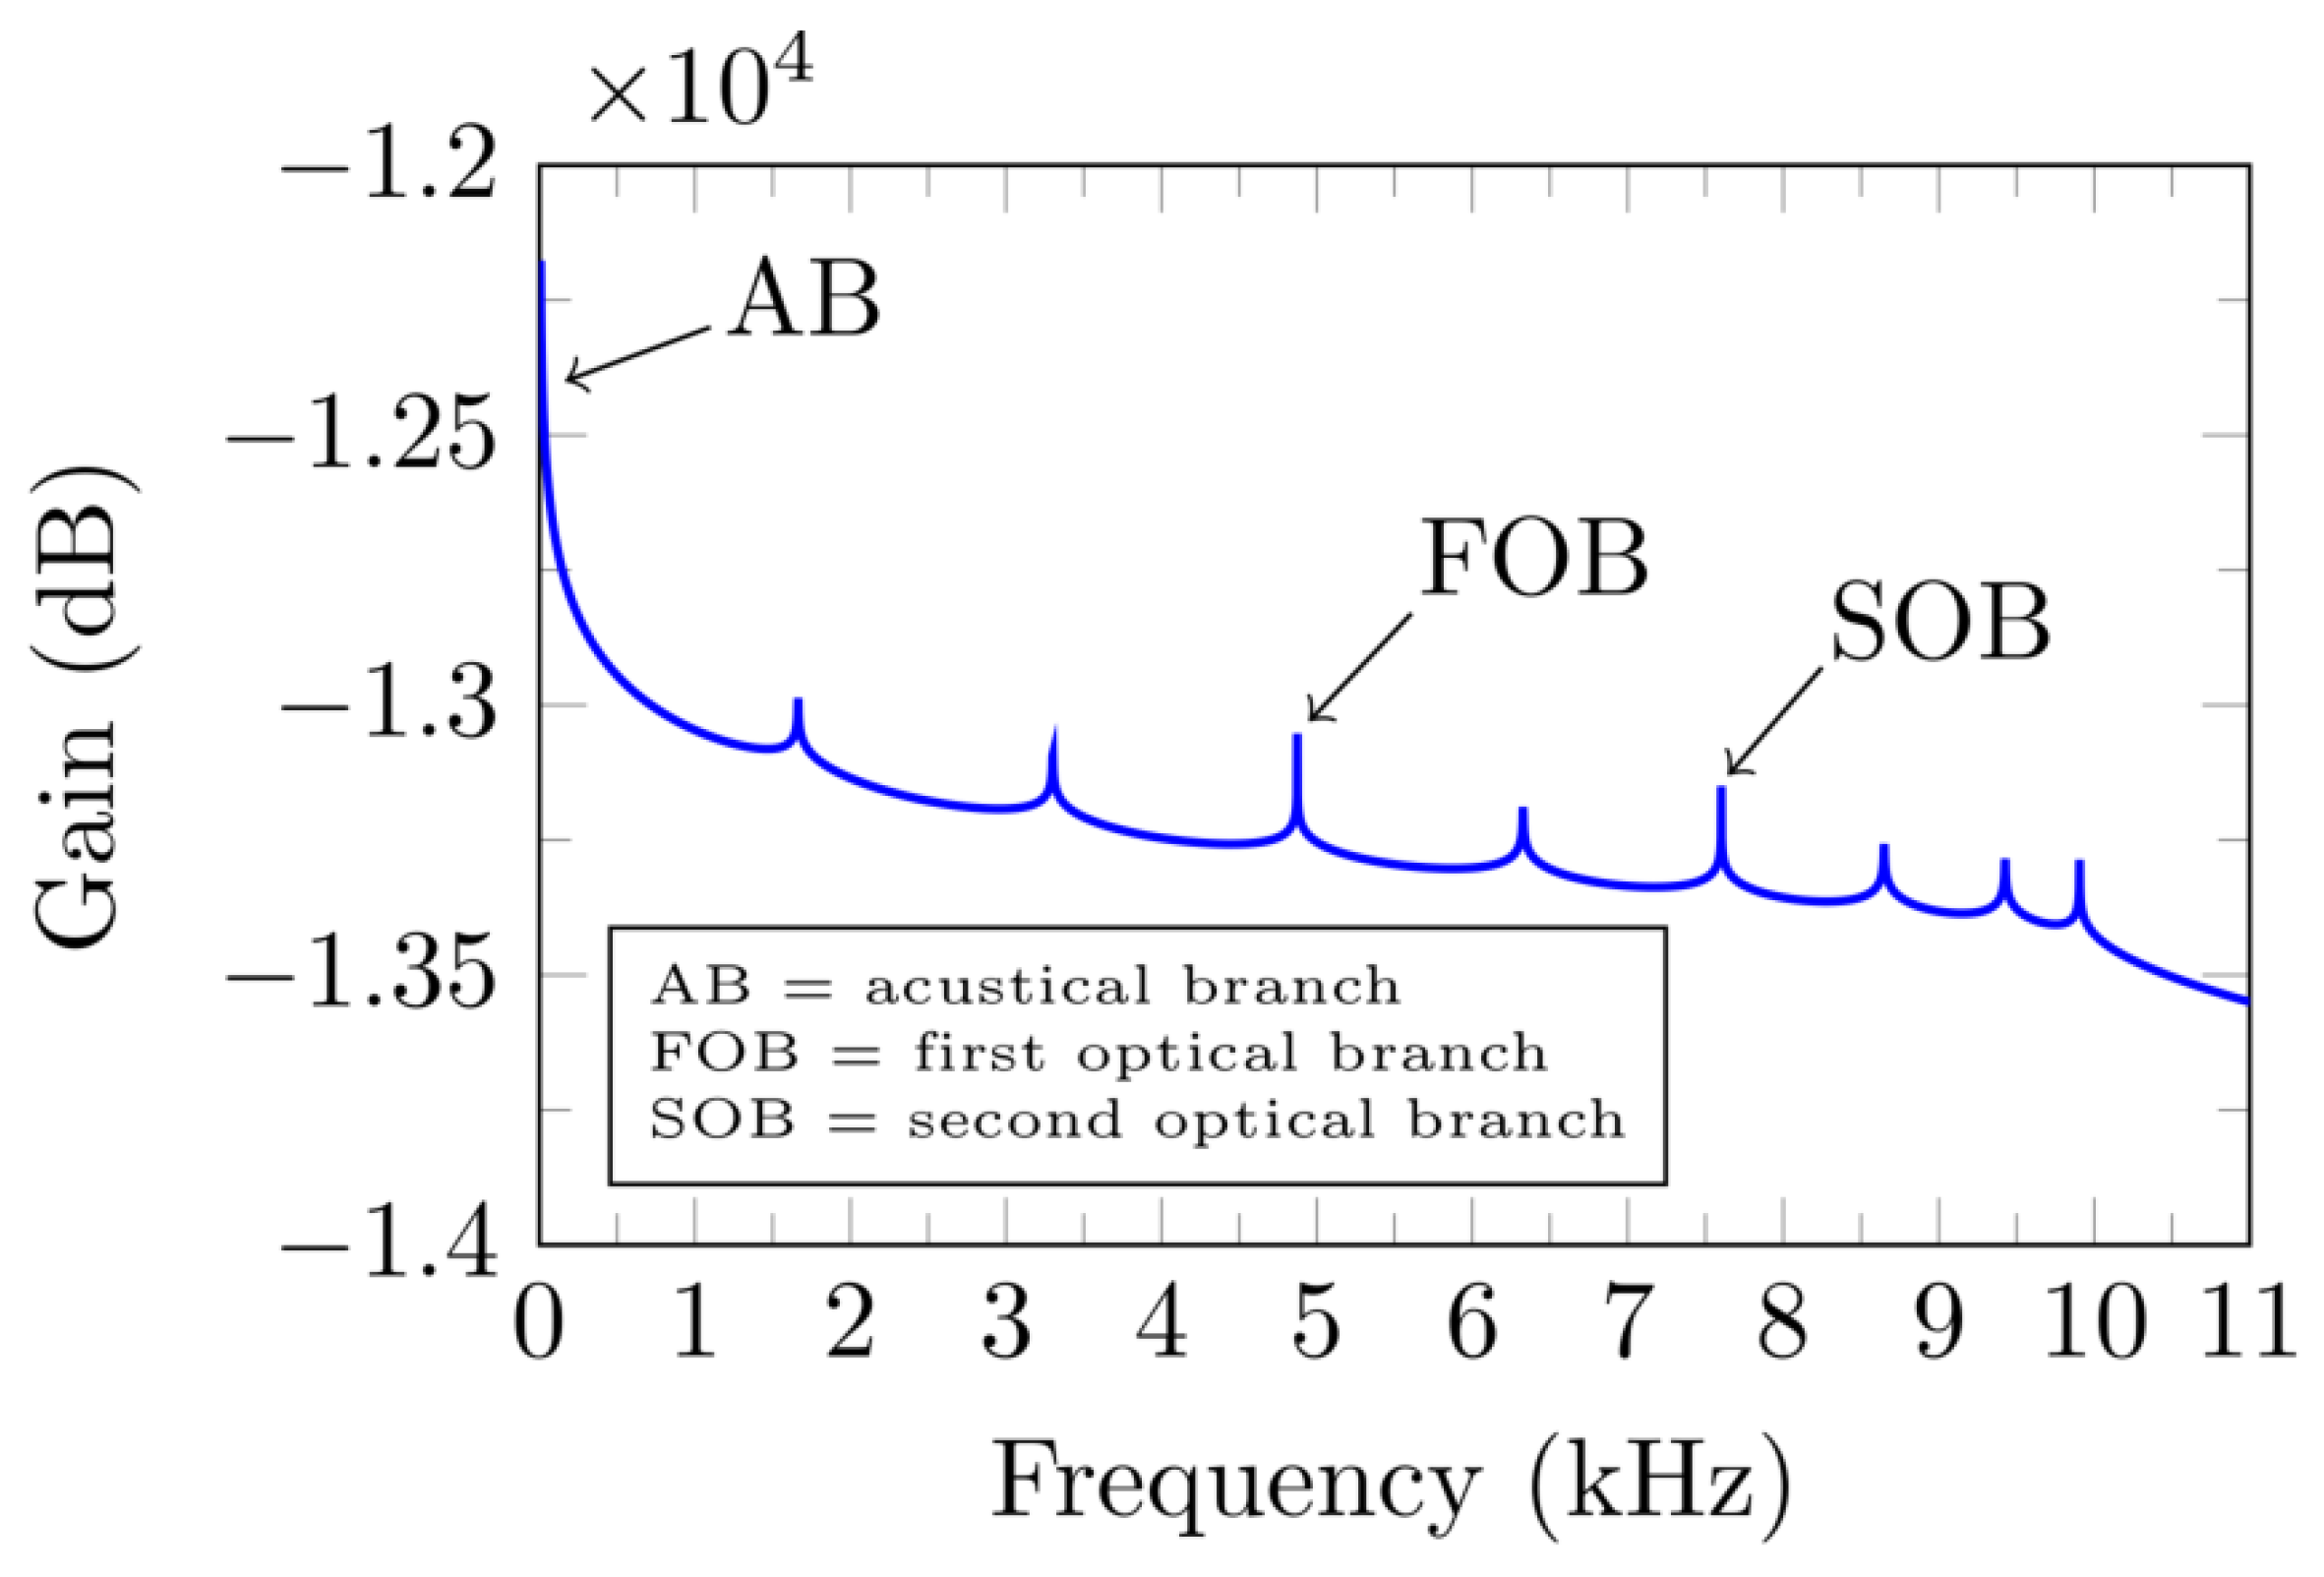
The transfer function Z ( ω ) of the circuit is then obtained through the A B C D T o t a l matrix of the Y T o t a l because the term 1 / A T o t a l ( ω ) is the relationship V O u t / V I n = Z ( ω ) expected from Figure 5. The normal mode frequencies can be determined through the resonance frequencies of the electrical analogue. The resonance frequencies are found exiting the electrical circuit at a net node and observing the gain plot at another node. Some frequencies could not be present due to boundary conditions and excitation mode. The described procedure was implemented in GNU Octave [23]. The Gain = 20 × l o g ( a b s ( 1 / A T o t a l ( ω ) ) ) as a function of frequency was calculated and plotted in Figure 8, Figure 9 and Figure 10 for the cases I, II, and III, respectively, indicated in Table 2 which are the same as those reported by [16]. The utilized GNU Octave code (See GNU Octave folder in the supplementary material section) to generate the plots is provided as supplementary material. The dispersion relationships in cases I and II, observing Figure 8 and Figure 9 can be found as follows. Each of the unit cells has three atoms, and we have four unit cells in M or N parts of the equivalent circuit. That means that for each value of K i a / π = i / 4 with, i = 1 , 2 , 3 , and 4 we have three resonance frequencies, one for each branch of the dispersion relationship. In general, for n / 2 cells per part, n even, we have n / 2 resonances in each branch. Note that the values within the first optical branch (FOB) must be taken in decreasing order, while within the acoustical branch (AB) and the second optical branch (SOB) must be taken in increasing order. For instance, for i = 1 and K 1 a / π = 1 / 4 , the first resonance frequencies of the AB (AB1) and SOB (SOB1) must be taken, whereas the last frequency of resonance of the FOB (FOB4) must be taken. On the other hand, for i = 2 and K 2 a / π = 1 / 2 the values AB2, SOB2, and FOB3 must be taken and so on. Figure 10 shows the dispersion relationships in case III. Note that in this case the number of resonance frequencies is incorrect, we should have just three resonance frequencies, they are indicated on the plot as AB, FOB, and SOB. By plotting the resonance frequency values multiplied by 2 π on the y-axe for each value of K i a / π (x-axe), we can reconstruct the plots of Figure 3a,b. The results are not completely applicable to case III (see Figure 10) where only the direct solution from Julia brings us comparisons with previous theoretical results [16]. The circuit of Figure 5 was directly implemented in the circuit simulator Qucs-S via its GUI. Three Qucs-S files for cases I, II, and III (See Qucs-s folder in the supplementary material section) of the Table 1 are provided as supplementary material. Based on the peaks of the frequency response plots generated with Qucs-S we can construct the branches of the cases I and II in an analogous manner than for the case of the Gain-Frequency plots obtained with GNU-Octave. See Figure 3a,b where the frequency, in Hertz, obtained with Qucs-S are plotted in rad/s. On the other hand, for the case III, the results provided by GNU Octave and Qucs-S are misleading. For the cases I and II, Octave, Qucs-S results are qualitatively correct. However, they are not exact. Table 2 condenses, for cases I, II, and II, all results obtained with Julia, GNU Octave, and Qucs-S as well as the theoretical ones [16].

5. Conclusions

The main conclusion is that the reader must try carefully the result of simulation and the convergence criteria for electrical circuits. The direct solution of a mechanical model gives the correct answers, however, the electrical analogue could give only a partial solution because the software was not designed to be converted into an analogue simulator. The finite size of the circuit elements is always a problem to be considered. Although the number of expected frequencies could be right, their numerical values at higher limits could be distorted. But in any case, the finite electric analogue model play well the role of an approximation. On the other hand, by using a huge number of electrical components, the network behaves like a low-pass filter filtering higher frequencies. In such a case, GNU Octave and Qucs-S results are similar. This may come from similar numerical routines. For a fixed number of cells there are differences between GNU Octave, Julia, and Qucs-S. In the last, we must use resistors to run the simulation. The results of the mechanical equation [22] are in total agreement with the analytical values [16]. The three mass system was validated, and the electrical analogues could be centralized to a more complex crystal lattices, 2D and 3D lattices for example. Our approach provides detailed plots and numerical values for the first time in the Open literature, and a method that does not require any specific mathematical skills to solve the systems. All codes for Julia, GNU Octave, and Qucs-S are provided as supplementary material. The analogue circuit analysis technique could be used to analyze a co-polymer chain under Dynamic mechanical analysis (DMA) measurement.

Supplementary Materials

The following supporting information can be downloaded at: https://www.mdpi.com/article/10.3390/physchem3040028/s1.

Author Contributions

Conceptualization, A.J.; methodology, R.A.F.; software, R.A.F.; validation, R.A.F.; formal analysis, R.A.F.; investigation, A.J. and R.A.F.; resources, A.J.; data curation, R.A.F.; writing—original draft preparation, A.J. and R.A.F.; writing—review and editing, A.J. and R.A.F.; visualization, R.A.F.; supervision, A.J.; project administration, A.J.; funding acquisition, A.J. All authors have read and agreed to the published version of the manuscript.

Funding

This paper was partially supported by grants of CONICET (Argentina National Research Council), Universidad Nacional del Sur (UNS) and by ANPCyT through PICT 4085–2016 and 2019–03491 as well as by SGCyT–UNS PGI.

Data Availability Statement

All pieces of software used as well as their outputs would be provided upon request.

Acknowledgments

The authors would like thank UNS and CONICET for the financial support. R.A.F. and A.J. are members of CONICET.

Conflicts of Interest

The authors declare no conflict of interest.

References

  1. The Case of Phonons: Explanatory or Ontological Priority. Available online: http://philsci-archive.pitt.edu/15428/ (accessed on 26 September 2018).
  2. Rich, C.C.; Frontiera, R.R. Uncovering the Functional Role of Coherent Phonons during the Photoinduced Phase Transition in a Molecular Crystal. J. Phys. Chem. Lett. 2020, 11, 7502–7509. [Google Scholar] [CrossRef] [PubMed]
  3. Porter, I.J.; Zuerch, M.W.; Baranger, A.M.; Leone, S.R. Coherent Phonons in Antimony: An Undergraduate Physical Chemistry Solid-State Ultrafast Laser Spectroscopy Experiment. J. Chem. Educ. 2023, 100, 342–349. [Google Scholar] [CrossRef]
  4. Ashcroft, N.W.; Mermin, N.D. Chapter 22—Classical Theory of the Harmonic Crystal. In Solid State Physics; Saunders College: Philadelphia, PA, USA, 1976; pp. 430–437. [Google Scholar]
  5. Kittel, C. Chapter 4—Phonons I. Crystal Vibrations. In Introduction to Solid State Physics, 8th ed.; Wiley: New York, NY, USA, 2005; pp. 89–104. [Google Scholar]
  6. Runk, R.B.; Stull, J.L.; Anderson, O.L. A Laboratory Linear Analog for Lattice Dynamics. Am. J. Phys. 1963, 31, 915–921. [Google Scholar] [CrossRef]
  7. Eggert, J.H. One-dimensional lattice dynamics with periodic boundary conditions: An analog demonstration. Am. J. Phys. 1997, 65, 108–116. [Google Scholar] [CrossRef]
  8. Scott, P.L. Vibrations of a Lattice Including Defects: Laboratory Demonstrations Using Electrical Analogs. Am. J. Phys. 1972, 40, 260–266. [Google Scholar] [CrossRef]
  9. Vega, D.; Vera, S.; Juan, A. A computer-aided modelling analogue for lattice dynamics. Eur. J. Phys. 1997, 18, 398–403. [Google Scholar] [CrossRef]
  10. Moy, B.T.; Koch, J.; Garg, A. Low-frequency dispersion of phonons in one-dimensional chains. Eur. J. Phys. 2020, 41, 035801. [Google Scholar] [CrossRef]
  11. Yannacone, S.; Sayala, K.D.; Freindorf, M.; Tsarevsky, N.V.; Kraka, E. Vibrational Analysis of Benziodoxoles and Benziodazolotetrazoles. Physchem 2021, 1, 45–68. [Google Scholar] [CrossRef]
  12. Parker, S.F. Assignment of the Vibrational Spectra of Diiron Nonacarbonyl, Fe2(CO)9. Physchem 2022, 2, 108–115. [Google Scholar] [CrossRef]
  13. El Boudouti, E.H.; Akjouj, A.; Dobrzynski, L.; Djafari-Rouhani, B.; Al-Wahsh, H.; Lévêque, G.; Pennec, Y. Chapter 2—Phonon Monomode Circuits. In Phononics, 1st ed.; Interface Transmission Tutorial Book Series; Elsevier Inc.: Amsterdam, The Netherlands, 2018; pp. 19–78. [Google Scholar]
  14. Van Haeverbeke, M.; Stock, M.; De Baets, B. Equivalent Electrical Circuits and Their Use Across Electrochemical Impedance Spectroscopy Application Domains. IEEE Access 2022, 10, 51363–51379. [Google Scholar] [CrossRef]
  15. Ding, G.; Sun, T.; Wang, X. Ideal nodal-net, nodal-chain, and nodal-cage phonons in some realistic materials. Phys. Chem. Chem. Phys. 2022, 24, 11175–11182. [Google Scholar] [CrossRef] [PubMed]
  16. Kesavasamy, K.; Krishnamurthy, N. Lattice vibrations in a linear triatomic chain. Am. J. Phys. 1978, 46, 815–819. [Google Scholar] [CrossRef]
  17. Bickham, S.R.; Kiselev, S.A.; Sievers, A.J. Stationary and moving intrinsic localized modes in one-dimensional monatomic lattices with cubic and quartic anharmonicity. Phys. Rev. B 1993, 47, 14206–14211. [Google Scholar] [CrossRef] [PubMed]
  18. Kiselev, S.A.; Bickham, S.R.; Sievers, A.J. Anharmonic gap mode in a one-dimensional diatomic lattice with nearest-neighbor Born-Mayer-Coulomb potentials and its interaction with a mass-defect impurity. Phys. Rev. B 1994, 50, 9135–9152. [Google Scholar] [CrossRef] [PubMed]
  19. He, C.; Lim, K.-M.; Zhang, F.; Jiang, J. Dual-tuning mechanism for elastic wave transmission in a triatomic lattice with string stiffening. Wave Motion 2022, 112, 102951. [Google Scholar] [CrossRef]
  20. Simon, S.H. Part III—Toy Models of Solids in One Dimension. In The Oxford Solid State Basics; Oxford University Press: Oxford, UK, 2013; pp. 69–110. [Google Scholar]
  21. Wituła, R.; Słota, D. Cardano’s formula, square roots, Chebyshev polynomials and radicals. Math. Anal. Appl. 2010, 363, 639–647. [Google Scholar] [CrossRef]
  22. Bezanson, J.; Edelman, A.; Karpinski, S.; Shah, V.B. Julia: A Fresh Approach to Numerical Computing. SIAM Rev. 2017, 59, 65–98. [Google Scholar] [CrossRef]
  23. Eaton, J.W. GNU Octave Manual. GNU. Available online: https://docs.octave.org/latest/ (accessed on 7 November 2023).
  24. Brinson, M.E.; Kuznetsov, V. A new approach to compact semiconductor device modelling with Qucs Verilog—A analogue module synthesis. Int. J. Numer. Model. Electron. Netw. 2016, 29, 1070–1088. [Google Scholar] [CrossRef]
  25. Feynman, R.P.; Leighton, R.; Sands, M. Chapter 25—Linear Systems and Review. In The Feynman Lectures of Physics I, 6th ed.; Addison-Wesley: Boston, MA, USA, 1977; pp. 25–34. [Google Scholar]
  26. Analogous Electrical and Mechanical Systems. Available online: https://lpsa.swarthmore.edu/Analogs/ElectricalMechanicalAnalogs.html (accessed on 10 October 2023).
  27. Pozar, D.M. Chapter 4—Microwave Network Analysis. In Microwave Engineering, 4th ed.; John Wiley Sons, Inc.: Hoboken, NJ, USA, 2012; pp. 190–211. [Google Scholar]
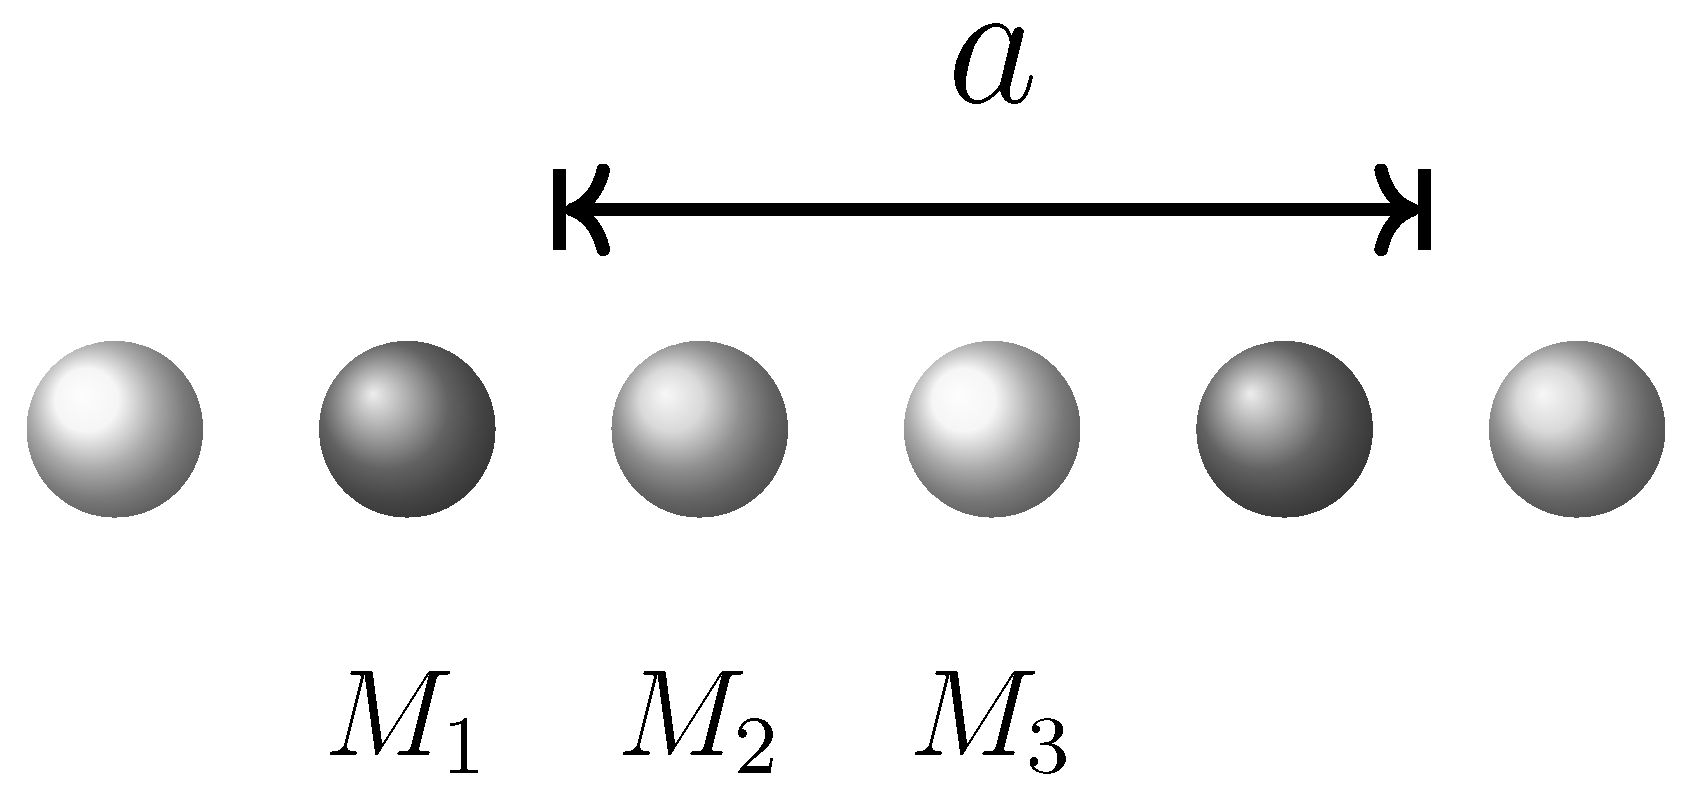
Figure 1. Unit cell in a one-dimensional crystal lattice. a indicates the periodicity of the lattice and M 1 , M 2 , and M 3 the masses of the atoms, which compound the unit cell.
Physchem 03 00028 g001
Figure 2. One-dimensional lattice network of n + 1 unit cells with three atoms each of them and which follows the Born-von Karman boundary conditions.
Physchem 03 00028 g002
Figure 3. Dispersion relationship, for cases I (a), II (b), and III (c), ( ) and ( ) Julia [22] for n = 50 and 4 values of K, respectively, ( ) GNU Octave [23], and ( ) Qucs-S [24]. In (a) numbers are analytically obtained, in (b) analytically (48.287 and 54.784 krad/s) and via Julia (27.252, 31.616, and 59.922 krad/s). In (c) numbers were analytically calculated. The acoustic phonon branch is indicated by label AB and the optical branches first and second by labels FOB and SOB.
Physchem 03 00028 g003
Figure 4. Equivalence between the mechanical model and its electrical analogue. In the electrical analogue, the constants of forces k i are related to capacities 1 / C i , while the masses M i with the inductances L i . The mechanical model is at the top, and its electrical analogue for a triatomic unit cell is at the bottom.
Physchem 03 00028 g004
Figure 5. The electrical analogue of the mechanical model of a one-dimensional atomic chain. The figure shows the electrical model of a crystalline network composed of eight unit cells composed of three different atoms.
Physchem 03 00028 g005
Figure 6. L C circuits and A B C D matrices associated to each atom of the unit cells. (a) belongs to M part, whereas (b) belongs to N part of the circuit of Figure 5.
Physchem 03 00028 g006
Figure 7. Representative block diagram of the electrical network. The figure shows the A B C D matrices for the synthesis of the electrical network.
Physchem 03 00028 g007
Figure 8. Frequency response of the circuit of the Figure 7 with R I n = 0 obtained by GNU Octave for case I. The three different branches are indicated as AB (acoustical branch), FOB (first optical branch), and SOB (second optical branch).
Physchem 03 00028 g008
Figure 9. Frequency response of circuit of the Figure 7 with R I n = 0 by GNU Octave for the case II.
Physchem 03 00028 g009
Figure 10. Frequency response obtained by GNU Octave for the case III. Note that in this case the amount of resonance frequencies is incorrect, we should have just three resonance frequencies, they are indicated on the plot as AB, FOB, and SOB.
Physchem 03 00028 g010
Table 1. Masses and force constants, and inductances and capacitances for the mechanical and electrical analogues of the studied atomic configurations.
Case ICase IICase III
k i M i C i L i k i M i C i L i k i M i C i L i
(N/m)(Kg)(F)(H)(N/m)(Kg)(F)(H)(N/m)(Kg)(F)(H)
i
1 10 6 10 3 10 6 10 3 10 6 10 3 10 6 10 3 10 6 10 3 10 6 10 3
2 10 6 10 3 10 6 10 3 1.5 × 10 6 10 3 0.66 × 10 6 10 3 1.5 × 10 6 0 0.66 × 10 6 0
3 10 6 10 3 10 6 10 3 10 6 10 3 10 6 10 6 10 6 10 3 10 6 10 3
Table 2. Frequency values in kHz for K in the interval [ 0 , π / a ] obtained for the different methods (mechanical model, electrical analogue, and direct simulation for n = 8 cells) and cases studied and for Ref. [16].
Mechanical ModelElectrical AnalogDirect SimulationRef. [16]
IIIIIIIIIIIIIIIIIIIIIIII
1.3131.21500.6600.6100.6610.6010.741
2.6052.40601.9661.8301.6641.9401.822.180
3.8523.53603.2383.0123.3003.1602.983.480
5.0324.33704.4544.1344.8744.3804.044.3604.3370
5.0325.0325.0325.5945.2005.5405.305.0325.032
6.1275.7475.0326.6386.1446.6406.18
7.1176.6135.0327.5707.0027.5607.00
7.9857.3345.0328.3727.6746.3268.2407.587.2008.7177.6875.032
9.2998.9347.6879.0308.2387.6028.9008.787.6808.7177.687
9.7229.2507.6879.5348.9548.6509.4609.108.140
9.9799.4637.6879.8749.5569.4289.4809.388.380
10.0659.5367.68710.0469.9389.90610.009.528.40010.0659.536
Results obtained with Julia (mechanical model), GNU Octave (electrical analogue), and Qucs-S (Direct simulation).
Disclaimer/Publisher’s Note: The statements, opinions and data contained in all publications are solely those of the individual author(s) and contributor(s) and not of MDPI and/or the editor(s). MDPI and/or the editor(s) disclaim responsibility for any injury to people or property resulting from any ideas, methods, instructions or products referred to in the content.