Article

Assignment of the Vibrational Spectra of Diiron Nonacarbonyl, Fe2(CO)9

by
Stewart F. Parker
ISIS Neutron and Muon Facility, STFC Rutherford Appleton Laboratory, Chilton OX11 0QX, UK
Physchem 2022, 2(2), 108-115; https://doi.org/10.3390/physchem2020008
Submission received: 24 February 2022 / Revised: 21 March 2022 / Accepted: 1 April 2022 / Published: 5 April 2022

Abstract

:
Diiron nonacarbonyl, Fe2(CO)9, was discovered in 1905 and was the third metal carbonyl to be found. It was the first to be synthesized by a photochemical route. This is a challenging material to study: it is insoluble in virtually all solvents and decomposes at 373 K before melting. This means that only solid-state spectroscopic data are available. New infrared, Raman and inelastic neutron scattering (INS) spectra have been measured and used to generate a complete assignment of the vibrational spectra of Fe2(CO)9. Density functional theory (DFT) calculations are used to support the assignments; however, for this material, they are much less useful than expected, although the calculated intensities provide crucial information.

1. Introduction

Diiron nonacarbonyl, Fe2(CO)9, (also called iron enneacarbonyl, tri-μ-carbonyl-bis(tricarbonyliron)(Fe—Fe), tri-μ-carbonylhexacarbonyldiiron, see Figure 1 for the structure) was only the third metal carbonyl to be discovered [1] (after Ni(CO)4 [2] and Fe(CO)5 [3]). It was the first synthesized by a photochemical route [1] and was the first to be shown to contain bridging carbonyls by X-ray diffraction [4] and infrared spectroscopy [5].
This is a challenging material to study: it is insoluble in virtually all solvents and decomposes at 373 K before melting. This means that all of the spectroscopic data are for the solid state. The most comprehensive investigations of the vibrational spectroscopy of this iconic molecule are by Butler et al. [6] and Adams and Taylor [7]. Butler et al. [6] measured the Raman spectrum at 295, 100 and 15 K and noted a marked sharpening of the modes as the temperature decreased. They found no evidence of a solid-state structural phase change over the investigated temperature range. The insolubility of the material prevented polarization measurements from being made. They also recorded the infrared spectrum at room temperature. Adams and Taylor [7] measured the infrared spectra of the polycrystalline powder and infrared reflectance spectra of some oriented flakes at ambient temperature and at 77 K. The reflectance data provided symmetry assignments for some of the modes. Both authors noted that normal coordinate calculations would be needed to make definitive assignments in the region below 800 cm−1. If carried out, these were never published, probably because the difficulty of preparing isotopically labelled samples and the absence of polarization data made the assignments uncertain. To my knowledge, there is only one computational study of the vibrational spectra of Fe2(CO)9 [8].
The aim of this paper is to generate a complete assignment of the vibrational spectra of Fe2(CO)9. To this end, new infrared, Raman and inelastic neutron scattering (INS) [9] spectra have been measured. The assignments are supported by density functional theory (DFT) calculations, although we will show that, in this instance, they are much less useful than expected.

2. Materials and Methods

Fe2(CO)9 was purchased from Fluka (97%) and Aldrich (98%) and used as received. Caution: On the removal of a small quantity (~10 mg) of Fe2(CO)9 using a metal spatula from the sample supplied by Fluka, the material self-heated on contact with air. The sample was several years old (there was no expiry date) but had not been opened and had been stored at −20 °C. Fe2(CO)9 is made by a photochemical reaction of Fe(CO)5 in acetic acid. The original paper for the preparation [1] states that, if traces of Fe(CO)5 remain in the product, it may self-heat. This is the most likely explanation here. I note that a second sample from a different supplier (Aldrich) has not resulted in any problems. The spectra reported here are all from the Aldrich sample.
For the INS measurements ~10 g of Fe2(CO)9 was loaded into an In wire-sealed Al can. The sample was quenched in liquid nitrogen immediately before insertion into the indirect geometry, high-resolution, broad-band spectrometer TOSCA [10,11] at ISIS [12]. The spectrum was recorded for ~12 h at ~10 K. TOSCA has detector banks in back and forward scattering [10], the data shown are for the back-scattering detectors only because the signal-to-noise ratio was much better than in the forward-scattering detectors.
Raman spectra of the solid in a quartz cell and, after freezing in liquid nitrogen, were recorded using a Bruker FT-Raman spectrometer (64 scans at 4 cm−1 resolution with 50 mW laser power at 1064 nm with eight times zerofilling (to improve the peak shape)).
Infrared spectra (256 scans at 4 cm−1 resolution with eight times zerofilling) were recorded with a Bruker Vertex 70 FTIR spectrometer. Room-temperature spectra of the solid over the range 50–4000 cm−1 were obtained using the Bruker Diamond ATR accessory and in transmission over the range 50–700 cm−1 as a ~1 wt% pellet in low-density polyethylene. Spectra (300–4000 cm−1) at 170 K were recorded using a SpecAc Golden Gate variable temperature accessory.
DFT calculations were carried out using Gaussian09 [13] and CASTEP (v20) [14]. For Gaussian09, the B3LYP functional with the aug-ccVTZ basis set was used. For the plane-wave, pseudopotential code CASTEP, exchange and correlation were approximated using the Perdew–Burke–Ernzerhof (PBE) functional [15], with the Tkatchenko–Scheffler (TS) dispersion correction scheme [16], within the generalized gradient approximation (GGA). Norm-conserving pseudopotentials were generated on-the-fly (OTFG). The plane-wave cut-off was 1440 eV and the Brillouin-zone sampling of electronic states used a 10 × 10 × 3 Monkhorst–Pack grid (36 k-points). The equilibrium structure was obtained by Broyden–Fletcher–Goldfarb–Shanno (BFGS) geometry optimization, after which the residual forces were converged to zero within ±0.005 eV Å−1. Phonon frequencies were obtained by the diagonalization of dynamical matrices computed using density-functional perturbation theory (DFPT) [17]. An analysis of the resulting eigenvectors was used to map the computed modes to the corresponding irreducible representations of the point group and assign IUPAC symmetry labels. DFPT was also used to compute the dielectric response and the Born effective charges and, from these, the infrared absorptivity was calculated. INS spectra were generated from the Gaussian09 and CASTEP outputs using AbINS [18].

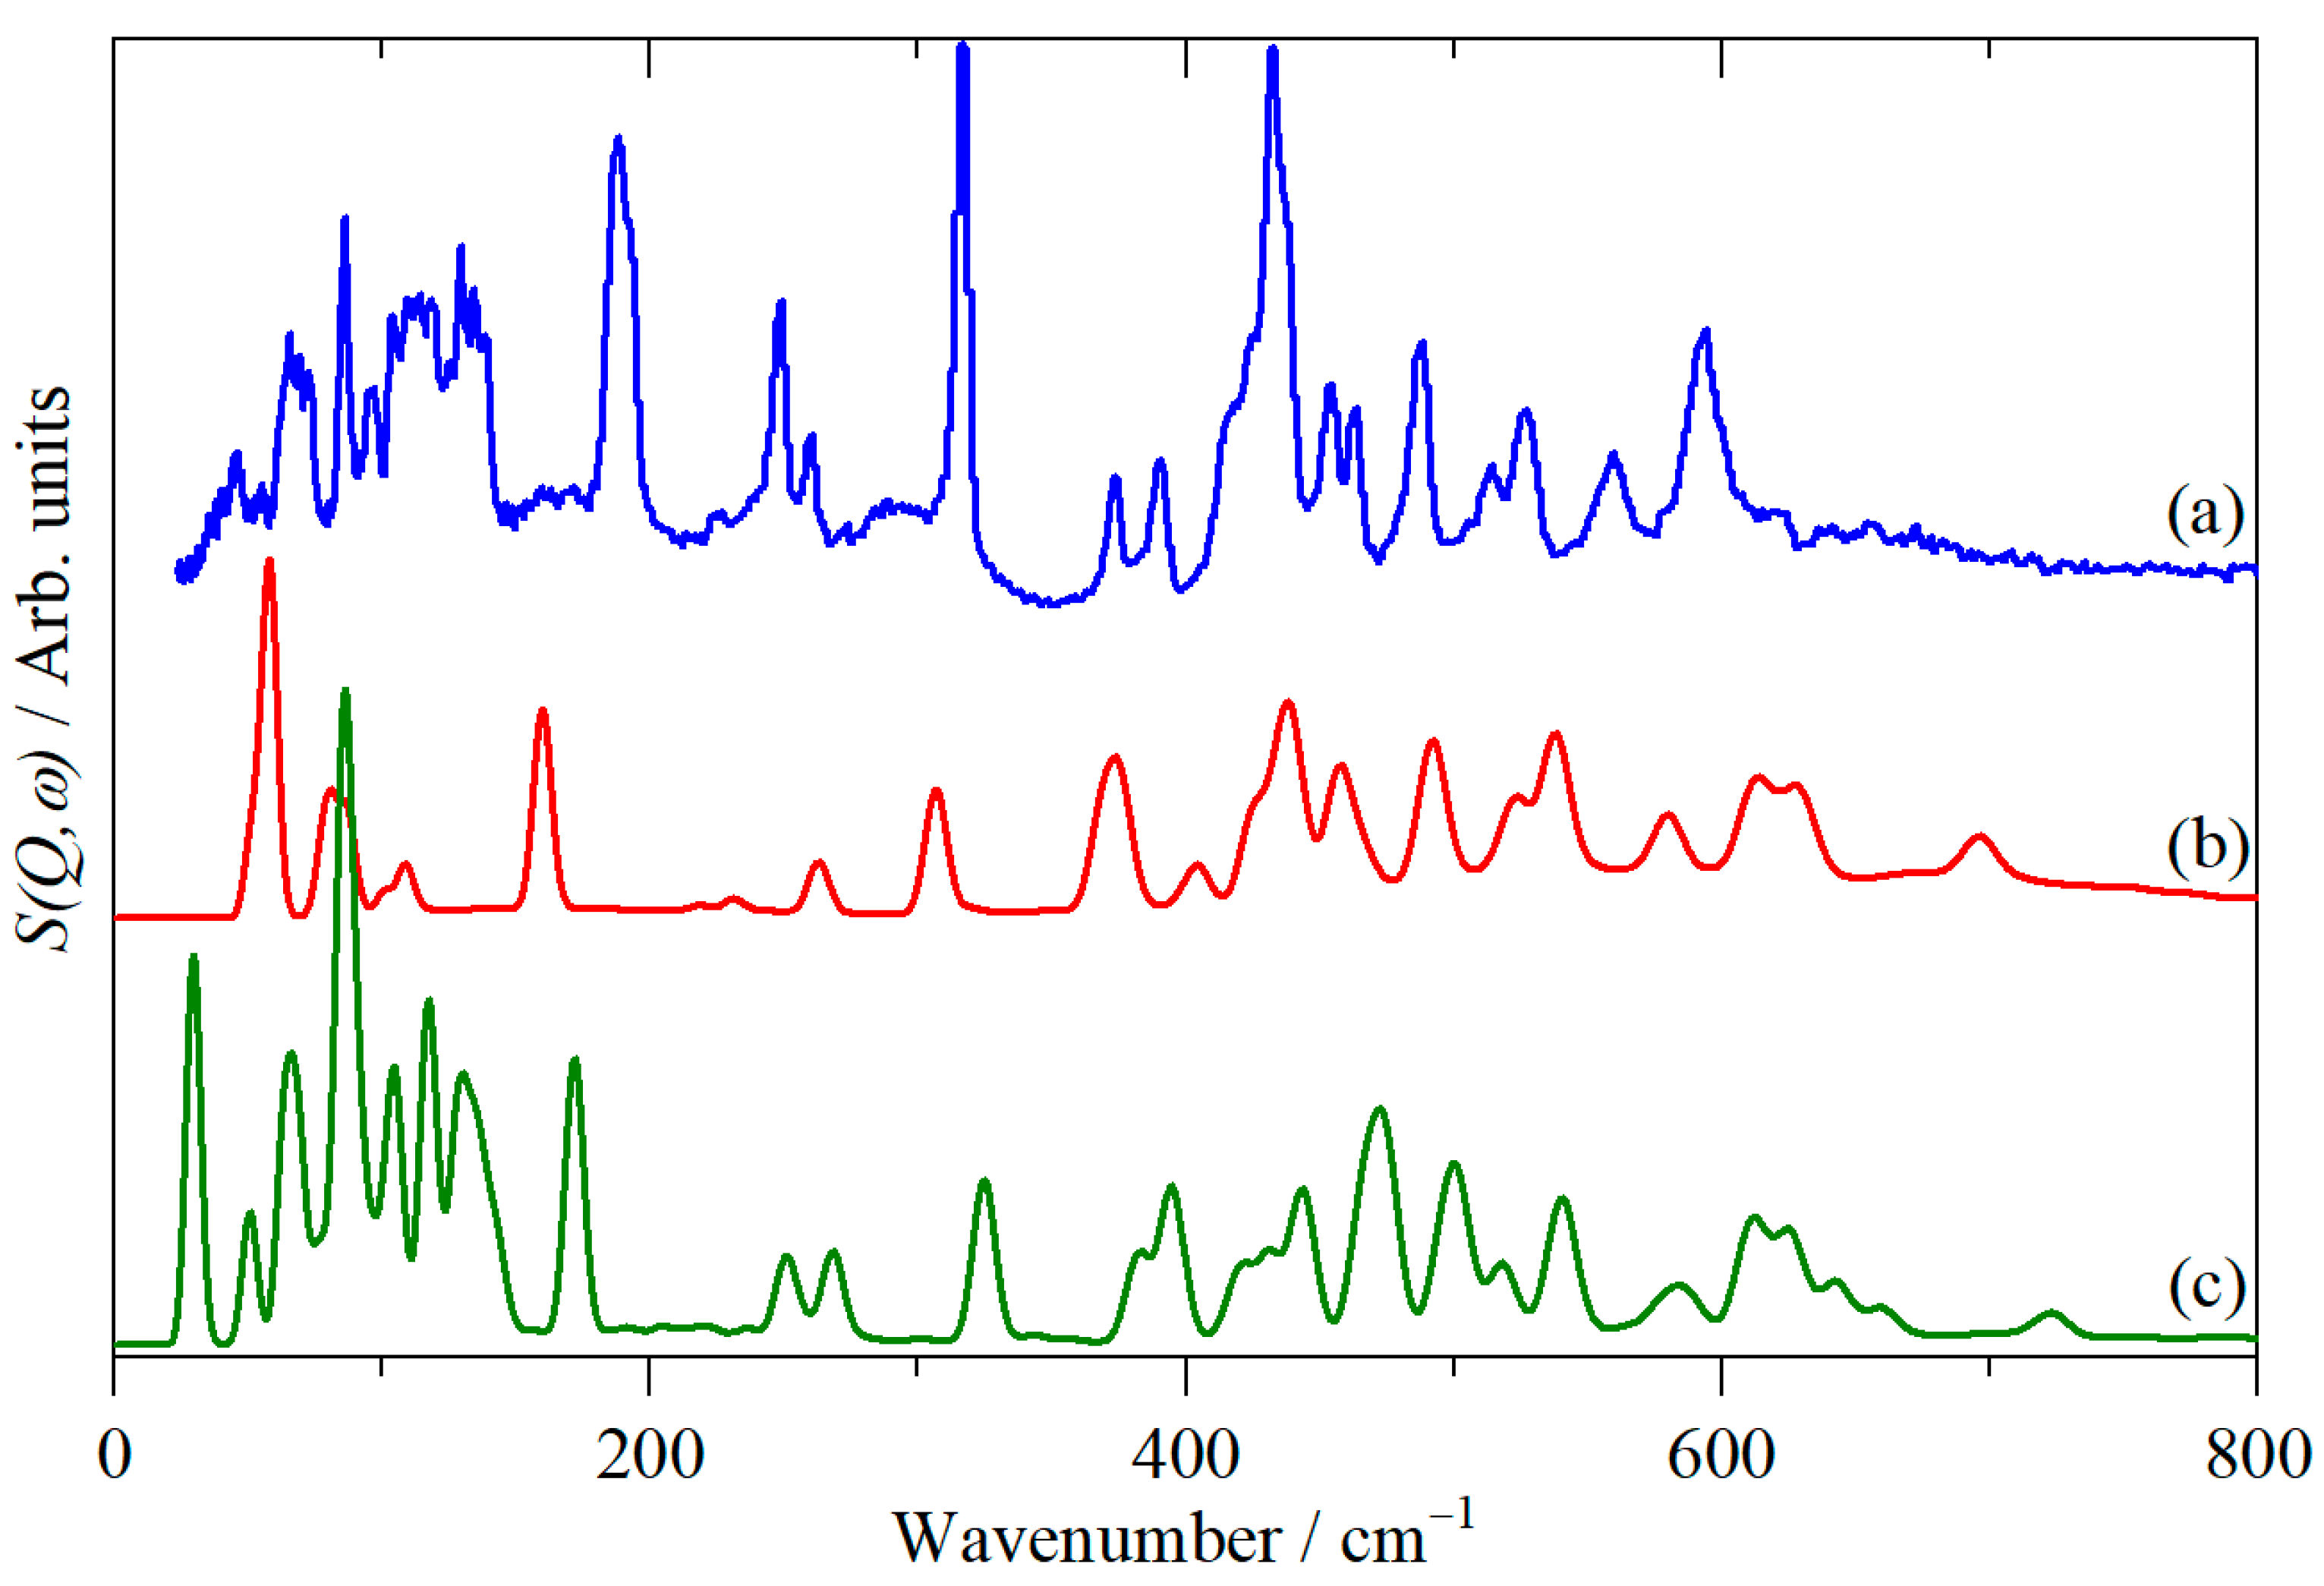
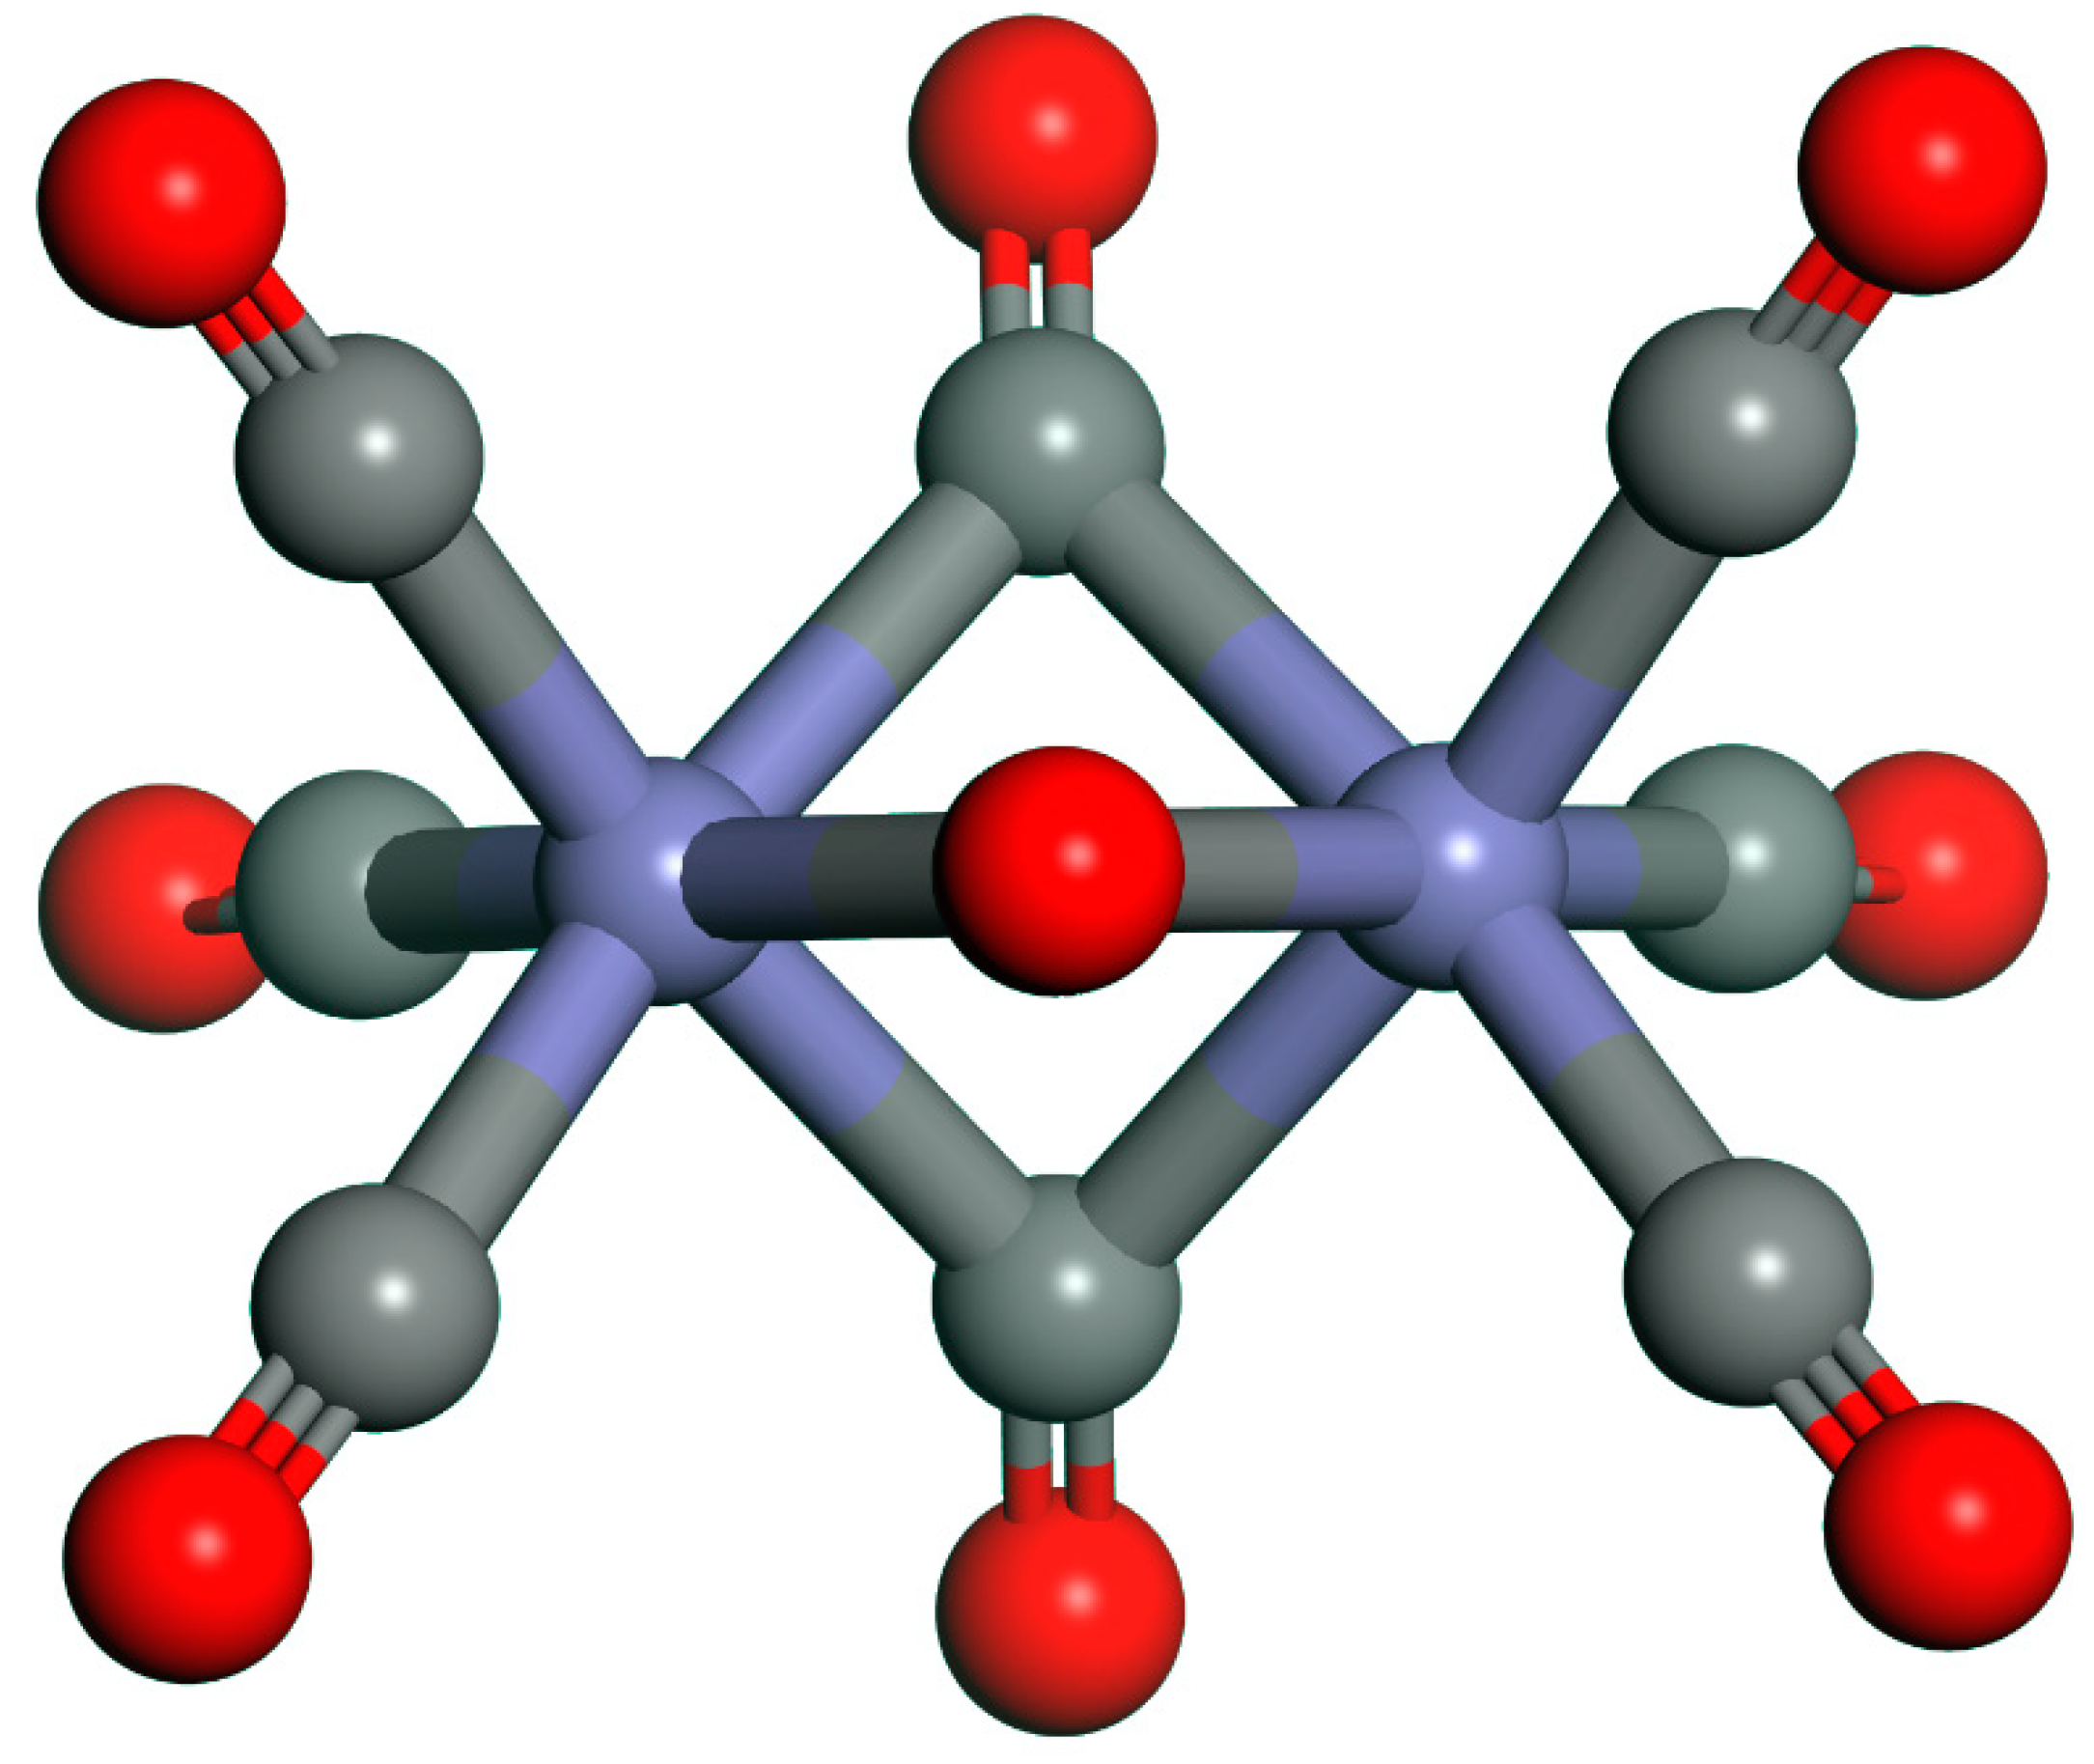
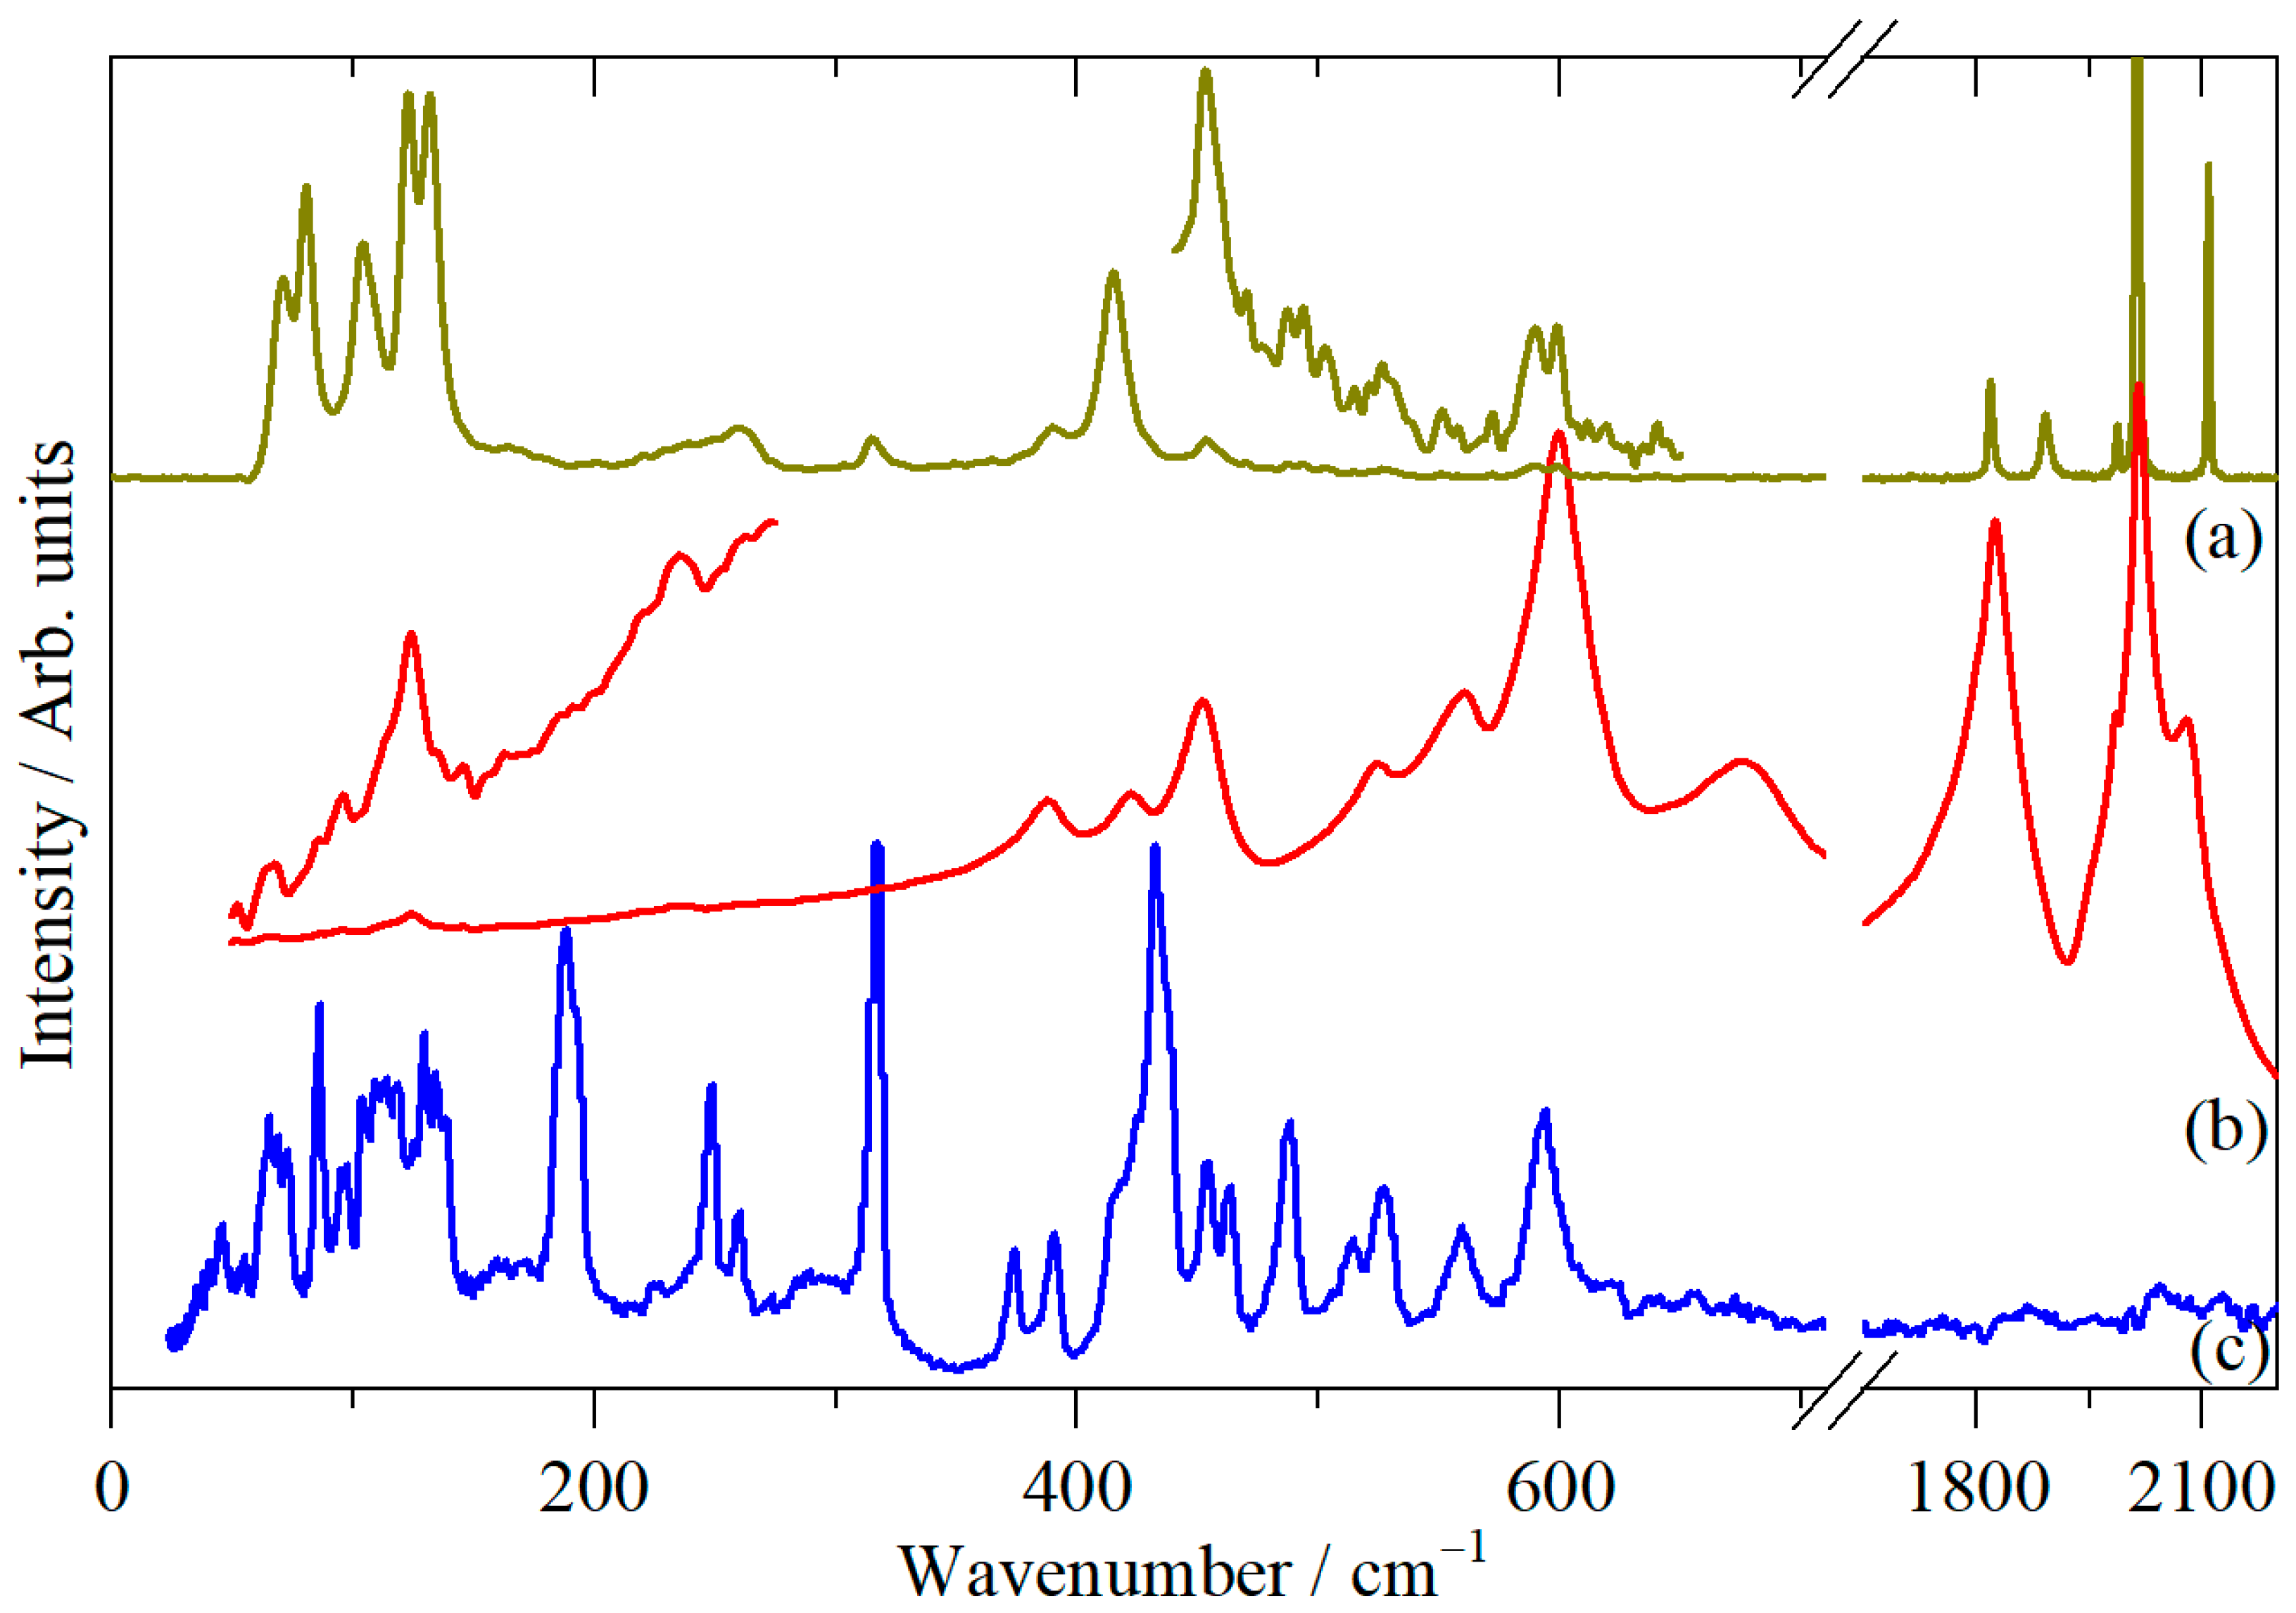
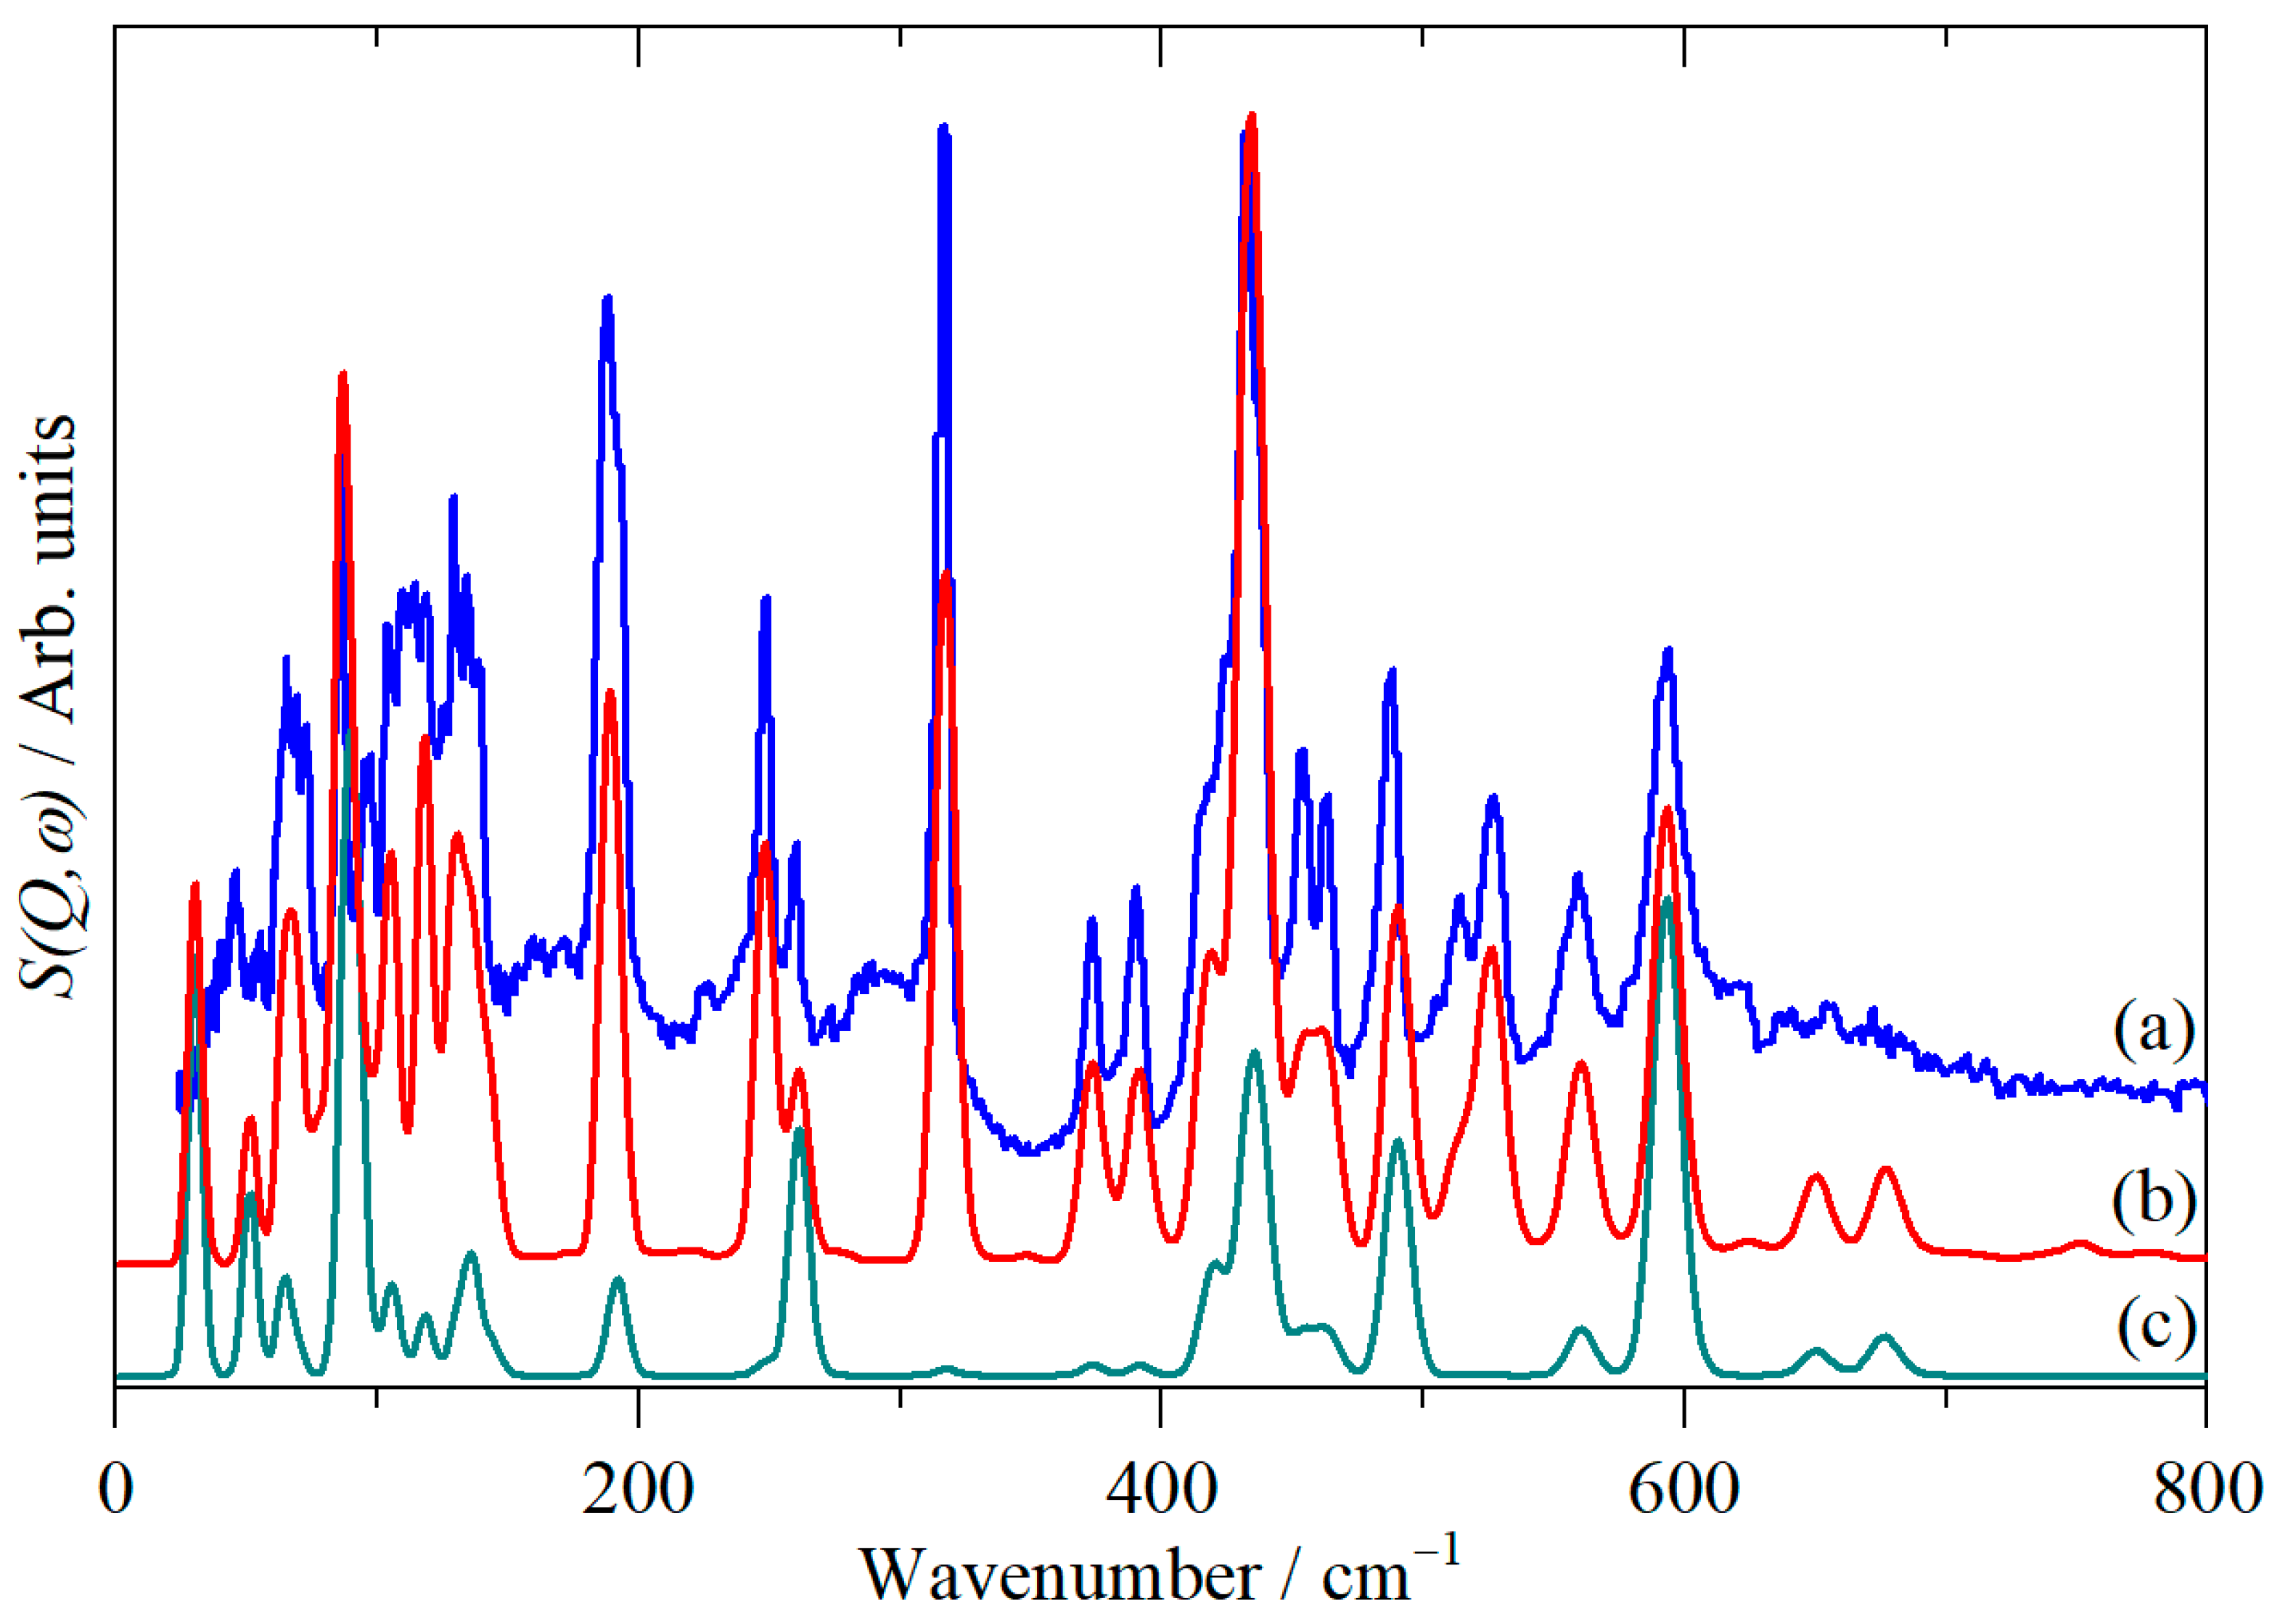
3. Results and Discussion

Figure 2 shows the FT-Raman, infrared and INS spectra of Fe2(CO)9. The infrared and Raman spectra are in accordance with previous work [6,7,19]. The idealized structure of Fe2(CO)9 has D3h symmetry, Figure 1. Single-crystal X-ray diffraction studies [4,20] have shown that, in the primitive cell, there are two molecules that each occupy a C3h site. Adams and Taylor [7] provided a comprehensive analysis of the selection rules for the free molecule and in the crystal, as well as the mode numbering (which is used here); these are reproduced in the Supplementary Material, Figure S1. As may be seen from Figure S1, the presence of two molecules in the primitive cell results in each mode of the free molecule, giving rise to two modes in the crystal: essentially, these are the in-phase and out-of-phase pairs of the free-molecule modes. However, the selection rules mean that the activity of the crystal is the same as that of the site. Thus, an Aʹ mode of the C3h site group is Raman-active and infrared-forbidden; this correlates to an Ag + Bu factor group pair, where the Ag is Raman-allowed, and the Bu mode is forbidden in both spectroscopies. This occurs for all the modes: those that are Raman-allowed in C3h only have a Raman-active component, those that are infrared-allowed in C3h only have an infrared-active component and those that are allowed in both have both infrared- and Raman-allowed components. There are no selection rules in INS spectroscopy [9]; thus, all the modes are allowed. In principle, this means that both components of the factor group pair should occur in the INS spectrum, i.e., each mode should be a doublet. However, as Figure 2c shows, this is not the case demonstrating that the factor group-splitting is small. This means that, to a good approximation, the selection rules for C3h symmetry are valid.
In the C≡O stretch region (1700–2200 cm−1), three bands are present in the infrared and five in the Raman spectra, as in Figure 2a,b. This is completely in agreement with the prediction of the selection rules (see Figure S1) and with the spectra of Butler et al. [6] and Adams and Taylor [7]. As can be seen from Figure 2c, the INS does not provide any new or useful information in this region. There are three reasons for this. The intensity of an INS band depends, in part, on the amplitude of motion of the atoms in that mode [9]. Stretching modes have smaller amplitudes of motion than deformation modes, and so are intrinsically weaker. Secondly, with TOSCA (and this type of instrument in general) the resolution degrades with increasing energy transfer, such that, at 2000 cm−1, it is about two times poorer than at ~500 cm−1. Thirdly, the INS intensity is damped by a Debye–Waller factor, which, on TOSCA, also increases with the increasing energy transfer. The overall effect of these factors is that modes that are intrinsically weak in the INS, are further attenuated by the Debye–Waller factor and broadened by the resolution function. This combination of factors renders these modes almost invisible in the INS spectrum. There are no reasons to doubt the existing assignments [7] in this region.
In contrast, the region below 700 cm−1 is much more complex and the INS provides new information, e.g., modes are observed at 188, 374 and 513 cm−1 for the first time. Some general considerations are as follows: infrared modes with no Raman counterpart are A˝, Raman modes with no infrared counterpart are Aʹ or E˝ and modes that occur in both the infrared and Raman spectra are Eʹ. As noted in [7], metal carbonyls with only terminal carbonyls (i.e., those bonded to only one atom) do not have any modes in the 200–350 cm−1 region, so modes in this range must be associated with the bridging carbonyls. The presence of two molecules in the unit cell means that there will be three acoustic translational modes, three optic translational modes and six librational modes. These occur below 200 cm−1 and are all present in the INS spectrum, which explains its complexity in this region. The selection rules are such that there are no infrared active lattice modes. It is also useful to note that the intensity of an INS mode is determined by the amplitude of vibration, thus, for the same type of motion (Fe–C stretch, Fe–C≡O bend, OC–Fe–CO bend), an E–type mode will be approximately twice as strong as an A–type mode.
These generalisations allow for some of the modes to be assigned, e.g., the mode at 598 cm−1, seen in both the infrared and Raman spectra and relatively intense in the INS, must be an Eʹ mode. Similarly, the strong Raman mode at 425 cm−1 with no infrared counterpart, which is relatively weak in the INS, must be an Aʹ mode. However, for molecules as complex as Fe2(CO)9, computational studies generally provide reliable assignments. Comparison with the INS spectrum is a stringent test of the calculation [9], as the intensities do not depend on electronic factors (the dipole moment derivatives and the polarisability) as they do for infrared and Raman spectroscopy.
Figure 3a shows the experimental spectrum and Figure 3b shows that generated from an isolated molecule DFT calculation. I note that the calculated transition energies (except for the C≡O stretch region) are generally very close to those of previous work [8]. It can be seen that the agreement is weak. To test if this was the result of the intermolecular interactions, a calculation of the complete unit cell was carried out by periodic-DFT; Table S1 compares the observed and calculated geometries for the isolated and periodic calculations. It can be seen that both calculations are in good agreement with the experiment. The calculated spectrum is shown in Figure 3c (the transition energies and assignments are given in Table S2). At best, this shows a marginal improvement over the isolated molecule calculation, demonstrating that the intermolecular interactions are not significant enough to greatly perturb the spectra.
The poor agreement is both surprising and disappointing. A similar study of the hexacarbonyls Cr(CO)6, Mo(CO)6 and W(CO)6 [21] provided excellent agreement. However, the computational work does provide some useful information. In Figure 3c, the 500–800 cm−1 region is reasonably well-described, suggesting that the assignments are reliable here, as is the region below 150 cm−1. It is also noteworthy that the relative intensities of the modes generated from the two calculations (which used different programs; see Section 2) are similar. This is a consequence of the invariance of the mode eigenvectors; as was shown elsewhere [22], provided that the structure is reliably calculated (as is the case here), the eigenvectors, which contain the atomic displacements needed to calculate the INS spectrum, are insensitive to the transition energy. This means that we can shift the peak positions to match the observed profile. This is analagous to the scaling that is commonly applied to calculated spectra.
The results are shown in Figure 4. It proved impossible to achieve good results with the isolated molecule calculation because, although the factor group-splitting is generally small, (less than 10 cm−1 in most cases; see Table S1), it is significant in several cases. The assignments are given in the last column of Table 1. It can be seen that the agreement is now excellent, as in Figure 4a,b.
In the region 150–800 cm−1, the assignments generally agree with previous work, although there are exceptions. Thus, ν30 is clearly seen at 490 cm−1, a much lower value than the previously assigned ~600 cm−1. This highlights the value of the INS intensity data because the calculated intensity with ν3, ν13 and ν30 near 600 cm−1 would result in a mode that was too intense. Similarly, the intensity of the feature at 433 cm−1 shows that it must be composed of several modes.
The effect of the intermolecular interactions is most clear in the region below 150 cm−1. From Table 1, it can be seen that the lowest energy internal modes are significantly upshifted in the periodic-DFT calculation as compared to the isolated molecule calculations (cf. columns 5–7 with 8 for the lowest-energy mode in each symmetry class). As noted earlier, there is reasonable agreement between the observed and calculated profiles in this region, and the modes have not been adjusted. Exact agreement would not be expected because the calculation was only carried out for the modes at the Brillouin zone Γ-point and INS spectroscopy is sensitive to all wave vectors across the entire Brillouin zone. The lattice modes are likely to show vibrational dispersion (variation in transition energy with wavevector), which results in the broadening of the features, and this is not captured by the calculation.
The INS intensity depends on the amplitude of motion and the scattering cross-section. By setting the cross-section of the C and O atoms to zero, the Fe contribution is revealed, and this is shown in Figure 4c. This provides some confirmation of the assignments. Thus the intense mode at 590 cm−1, assigned to ν13, is an asymmetric stretch of the terminal carbonyls. On the basis of its sensitivity to 54Fe isotope substitution [23], the mode at 260 cm−1 was assigned to the Fe–Fe stretch mode. An Fe–Fe bond is required by electron counting rules, but the current thinking is that there is no Fe–Fe bond; instead one of the Fe–C(O)–Fe linkages is best described as a “3-centre 2-electron” bond [24]. As the symmetric stretch of all three Fe–C(O)–Fe linkages would involve Fe displacement, it would still be isotope-sensitive. At a lower energy, the intense mode at 90 cm−1, (ν36) is a distortion of the Fe2C3 core of the molecule. The mode at 65 cm−1 was previously assigned as a translational mode [25], while the mode visualisations show that it is a librational mode. The lowest-energy feature at 32 cm−1 is an optic translational mode.

4. Conclusions

This work has provided the first complete assignment of the vibrational spectra of Fe2(CO)9. While most of the assignments are in general agreement with previous work, there are several notable differences. The absence of selection rules in INS spectroscopy means that the modes that are derived from the infrared- and Raman-forbidden (in D3h symmetry) modes are observed for the first time.
The most surprising aspect of this work is how poorly DFT is able to describe the molecule. As Figure 3b,c shows, the calculated INS spectra show, at best, modest agreement with the experimental INS spectrum. This ability to compare observed and calculated INS spectra is one of the great strengths of this technique and provides a rigorous test of computational studies.

Supplementary Materials

The following are available online at https://www.mdpi.com/article/10.3390/physchem2020008/s1, Figure S1: The selection rules and mode numbering for Fe2(CO)9. Table S1: Comparison of the observed and calculated geometries for the isolated molecule (Gaussian) and periodic calculations (CASTEP) of Fe2(CO)9. Table S2: Transition energies, infrared intensities and assignments for Fe2(CO)9 from a periodic-DFT (CASTEP) calculation.

Funding

This work was funded by the Science and Technology Facilities Council (STFC).

Institutional Review Board Statement

Not applicable.

Informed Consent Statement

Not applicable.

Data Availability Statement

The dataset (infrared, Raman and INS spectra) and computational studies supporting this article is available from the Science and Technology Facilities data repository (eData) at http://dx.doi.org/10.5286/edata/752.

Acknowledgments

The STFC Rutherford Appleton Laboratory is thanked for access to neutron beam facilities. Computing resources (time on the SCARF compute cluster for the CASTEP calculations) was provided by STFC’s e-Science facility. This research was performed with the aid of facilities at the Research Complex at Harwell, including the FT-Raman spectrometer. The author would like to thank the Research Complex for access to, and support of, these facilities and equipment.

Conflicts of Interest

The author declares no conflict of interest.

References

  1. Dewar, J.; Jones, H.O. The physical and chemical properties of iron carbonyl. Proc. Roy. Soc. 1905, A76, 558–577. [Google Scholar] [CrossRef] [Green Version]
  2. Mond, L.; Langer, C.; Quincke, F. Action of carbon monoxide on nickel. J. Chem. Soc. Trans. 1890, 57, 749–753. [Google Scholar] [CrossRef] [Green Version]
  3. Mond, L.; Langer, C. On iron carbonyls. J. Chem. Soc. Trans. 1891, 59, 1090–1093. [Google Scholar] [CrossRef] [Green Version]
  4. Powell, H.M.; Ewens, R.V.G. The crystal structure of iron enneacarbonyl. J. Chem. Soc. 1939, 286–292. [Google Scholar] [CrossRef]
  5. Sheline, R.K.; Pitzer, K.S. The infrared spectra and structures of the iron carbonyls. J. Amer. Chem. Soc. 1950, 72, 1107. [Google Scholar] [CrossRef]
  6. Butler, I.S.; Kishner, S.; Plowman, K.R. Vibrational spectra of solid tri-μ-carbonyl(hexacarbonyl)di-iron(0) Fe2(CO)9. J. Mol. Struct. 1978, 43, 9. [Google Scholar] [CrossRef]
  7. Adams, D.M.; Taylor, I.D. Solid-state metal carbonyls Part 3.-An infrared study of Fe2(CO)9, tri-μ-carbonyl(hexacarbonyl)di-iron(0). J. Chem. Soc. Faraday Trans. 1982, 78, 1551–1559. [Google Scholar] [CrossRef]
  8. Jang, J.H.; Lee, J.G.; Lee, H.; Xie, Y.; Schaefer III, H.F. Molecular structures and vibrational frequencies of iron carbonyls: Fe(CO)5, Fe2(CO)9 and Fe3(CO)12. J. Phys. Chem. A 1998, 102, 5298–5304. [Google Scholar] [CrossRef]
  9. Mitchell, P.C.H.; Parker, S.F.; Ramirez-Cuesta, A.J.; Tomkinson, J. Vibrational Spectroscopy with Neutrons, with Applications in Chemistry, Biology, Materials Science and Catalysis; World Scientific: Singapore, 2005. [Google Scholar]
  10. Parker, S.F.; Fernandez-Alonso, F.; Ramirez-Cuesta, A.J.; Tomkinson, J.; Rudić, S.; Pinna, R.S.; Gorini, G.; Fernández Castañon, J. Recent and future developments on TOSCA at ISIS. J. Phys. Conf. Ser. 2014, 554, 12003. [Google Scholar] [CrossRef]
  11. Pinna, R.S.; Rudić, S.; Parker, S.F.; Armstrong, J.; Zanetti, M.; Škoro, G.; Waller, S.P.; Zacek, D.; Smith, C.A.; Capstick, M.J.; et al. The neutron guide upgrade of the TOSCA spectrometer. Nucl. Instrum. Methods Phys. Res. Sect. A 2018, 896, 68–74. [Google Scholar] [CrossRef] [Green Version]
  12. The ISIS Neutron and Muon Source. Available online: https://www.isis.stfc.ac.uk/Pages/About.aspx (accessed on 14 February 2022).
  13. Frisch, M.J.; Trucks, G.W.; Schlegel, H.B.; Scuseria, G.E.; Robb, M.A.; Cheeseman, J.R.; Scalmani, G.; Barone, V.; Petersson, G.A.; Nakatsuji, H.; et al. Gaussian 09; Gaussian, Inc.: Wallingford, CT, USA, 2016. [Google Scholar]
  14. Clark, S.J.; Segall, M.D.; Pickard, C.J.; Hasnip, P.J.; Probert, M.J.; Refson, K.; Payne, M.C. First principles methods using CASTEP. Z. Krist. 2005, 220, 567–570. [Google Scholar] [CrossRef] [Green Version]
  15. Perdew, J.; Burke, K.; Ernzerhof, M. Generalized gradient approximation made simple. Phys. Rev. Lett. 1996, 77, 3865–3868. [Google Scholar] [CrossRef] [PubMed] [Green Version]
  16. Tkatchenko, A.; Scheffler, M. Accurate molecular van der Waals interactions from ground-state electron density and free-atom reference data. Phys. Rev. Lett. 2009, 102, 073005. [Google Scholar] [CrossRef] [PubMed] [Green Version]
  17. Refson, K.; Clark, S.J.; Tulip, P.R. Variational density-functional perturbation theory for dielectrics and lattice dynamics. Phys. Rev. B 2006, 73, 155114. [Google Scholar] [CrossRef] [Green Version]
  18. Dymkowski, K.; Parker, S.F.; Fernandez-Alonso, F.; Mukhopadhyay, S. AbINS: The modern software for INS interpretation. Physica B 2018, 551, 443–448. [Google Scholar] [CrossRef]
  19. Safa, M.; Dong, Z.; Huang, Y. Examining the structural changes in Fe2(CO)9 under high external pressures by Raman spectroscopy. Can. J. Chem. 2007, 85, 866–872. [Google Scholar] [CrossRef]
  20. Cotton, F.A.; Troup, J.M. Accurate determination of a classic structure in the metal carbonyl field: Nonacarbonyldi-iron. J. Chem. Soc. Dalton 1974, 800–802. [Google Scholar] [CrossRef]
  21. Parker, S.F.; Jayasooriya, U.A. Assignment of the solid state spectra of the group VI hexacarbonyls by inelastic neutron scattering spectroscopy. Phys. Chem. Chem. Phys. 2019, 21, 24950–24955. [Google Scholar] [CrossRef] [PubMed]
  22. Tomkinson, J.; Parker, S.F. Exploiting the quasi-invariance of molecular vibrational eigenvectors. Spectrochim. Acta 2011, 79A, 2017–2019. [Google Scholar] [CrossRef] [PubMed]
  23. Cooper, C.B., III; Onaka, S.; Shriver, D.F.; Daniels, L.; Hance, R.L.; Hutchinson, B.; Shipley, R. Metal isotope and temperature effects on the Raman spectra of diironenneacarbonyl, Fe2(CO)9, and triirondodecacarbonyl, Fe3(CO)12. Identification of Fe-Fe stretching frequencies. Inorg. Chim. Acta 1977, 24, L92. [Google Scholar] [CrossRef]
  24. Green, J.C.; Green, M.L.H.; Parkin, G. The occurrence and representation of three-centre two-electron bonds in covalent inorganic compounds. Chem. Commun. 2012, 48, 11481–11503. [Google Scholar] [CrossRef] [PubMed]
  25. Herber, R.H.; Fischer, J. Lattice-dynamics from Raman and Mössbauer studies - Extension to organometallic compound of iron. Can. J. Spectrosc. 1974, 19, 21–24. [Google Scholar]
Figure 1. The structure of Fe2(CO)9.
Physchem 02 00008 g001
Figure 2. Vibrational spectra of Fe2(CO)9. (a) FT-Raman below room temperature, (b) transmission infrared as a polyethylene disc at room temperature and (c) INS at ~10 K. The insets in (a,b) are ×10 ordinate expansions of the regions 440–650 cm−1 and 40–275 cm−1 respectively.
Physchem 02 00008 g002
Figure 3. Comparison of observed and calculated INS spectra of Fe2(CO)9. (a) Experimental, (b) generated from an isolated molecule DFT calculation and (c) generated from a periodic-DFT calculation of the complete unit cell at the Brillouin zone Γ-point.
Physchem 02 00008 g003
Figure 4. Comparison of observed and calculated INS spectra of Fe2(CO)9. (a) Experimental, (b) generated from a periodic-DFT calculation of the complete unit cell at the Brillouin zone Γ-point after adjustment of the modes for the best fit and (c) as (b) but showing only the modes that involve motion of the iron atoms. (c) is ×5 ordinate expanded relative to (b).
Physchem 02 00008 g004
Table 1. Comparison of assignments (in D3h symmetry) of Fe2(CO)9.
Previous Work/cm−1 This Work/cm−1
D3hButler
[6]
Adams
[7]
Jang [8] a
BP86/DZP
Jang [8] a
B3LYP/DZP
B3LYP
aug-ccVTZ
CASTEP
Average b
CASTEP
Range c
Final d
ν1 A 1 2112 2079(0)2170(0)2183207412109
ν2 A 1 1891 1895(0)1957(0)1964187501893
ν3 A 1 480 620(0)624(0)6226431593
ν4 A 1 415 478(0)466(0)4664950433
ν5 A 1 260 399(0)397(0)4054200415
ν6 A 1 137 255(0)259(0)2632691260
ν7 A 1 237 79(0)83(0)8612311117/128
ν8 A 2 508(0)525(0)5245190433
ν9 A 2 371(0)376(0)3693831317
ν10 A 2 77(0)82(0)7813512129/141
ν11 E 201620202013(1322)2101(1527)2115197802015
ν12 E 181418171870(682)1918(899)1924180901824
ν13 E 604605624(134)631(120)6306261593
ν14 E 528525532(4)545(10)5395410513/526
ν15 E 390390461(25)455(40)4574750438
ν16 E 451454433(1)438(7)4384441391/416
ν17 E 175174376(0)374(1)3773960317
ν18 E 126126107(1)110(1)1091335123
ν19 E 10610585(0)88(0)891062106
ν20 E 838554(0)58(0)5986186
ν21 A 1 417(0)427(0)4264321317
ν22 A 1 51(0)54(0)53931187/99
ν23 A 2 20882038(1747)2120(2210)21342038422079
ν24 A 2 690675(798)697(763)69769262650/676
ν25 A 2 564573(98)583(165)5815989560
ν26 A 2 426451(18)434(52)4334752422
ν27 A 2 130225(2)228(1)2322512192
ν28 A 2 16693(0)98(0)1011417138/145
ν29 E 1990 2008(0)2096(0)2110197601988
ν30 E 590 604(0)617(0)6136121490
ν31 E 493 486(0)491(0)4925021453/463
ν32 E 468 452(0)443(0)4414671433
ν33 E 315 314(0)313(0)3083250248
ν34 E 114 159(0)159(0)1601720188
ν35 E 89 82(0)78(0)811191118
ν36 E 67 75(0)55(0)5890488/92
a Values in parentheses are the infrared intensity in km mol−1. b Average of the factor group components (see Table S2 for the individual values of the components). c Difference between highest and lowest factor group components. d “Final” is the best choice for the transition energy of the given mode, based on the assignment scheme used to generate Figure 4b. Note that these are experimental values, not calculated ones.
Publisher’s Note: MDPI stays neutral with regard to jurisdictional claims in published maps and institutional affiliations.

