Article

Predicting 1,9-Decadiene−Water Partition Coefficients Using the 3D-RISM-KH Molecular Solvation Theory

1
Department of Mechanical Engineering, University of Alberta, 10-203 Donadeo Innovation Centre for Engineering, 9211-116 Street NW, Edmonton, AB T6G 1H9, Canada
2
Department of Biological Sciences, University of Alberta, Edmonton, AB T6G 2E8, Canada
3
Nanotechnology Research Centre, National Research Council of Canada, 11421 Saskatchewan Drive, Edmonton, AB T6G 2M9, Canada
*
Author to whom correspondence should be addressed.
Physchem 2021, 1(2), 215-224; https://doi.org/10.3390/physchem1020015
Submission received: 19 July 2021 / Revised: 9 August 2021 / Accepted: 30 August 2021 / Published: 4 September 2021
(This article belongs to the Special Issue Physical Chemistry Perspectives for the New Decade)

Abstract

:
The Three-Dimensional Reference Interaction Site Model (3D-RISM) with Kovalenko−Hirata (KH) closure is applied to calculate the 1,9-Decadiene/Water partition coefficients for a diverse class of compounds. The liquid state of 1,9-Decadiene is represented with the united atom TraPPE force field parameters. The 3D-RISM-KH computed partition functions are in good agreement with the experimental results. Our computational scheme can be used for a quantitative structure partitioning prediction for decadiene-water system, which has been used in membrane-mimicking of the egg-lecithin/water permeability experiments.

1. Introduction

Rapid development of computational methods and tools yielded a vast collection of drug/drug-like compounds that can potentially be used for drug development as well as drug repurposing. Such drug development programs involve (bio-)physical property predictions, quantitative structure activity relationships, applicability domain calculations, etc. The bottleneck in such activities is an accurate prediction of bioavailability of a drug candidate. Bioavailability depends on the physical and chemical properties of a molecule. Within the physical property domain, solubility and permeability are key factors. These two together constitute one of the major challenges in biophysics, i.e., the prediction of permeability through the cell membrane. Permeability in turn depends on a series of solvation/desolvation couples for its way to target tissue(s). Several molecular structure and activity relationships were developed over the years to incorporate lipid-membrane permeability in the absorption−distribution−metabolism−excretion (ADME) studies of drug candidates and risk assessments of chemical exposures [1,2,3,4]. The membrane permeability models have attracted a lot of attention in both experimental and computational points of view, owing to elaborate experimental setups and requirement of non-trivial molecular simulations. The most common permeations across any barrier are diffusion-controlled. Modeling such permeation processes often makes assumptions to simplify an otherwise very complex process. A direct mimic of a membrane/bi-layer model generally approximates a homogenous and isotropic bilayer, in its simplest form. An extension of this model is a more realistic version where the permeability coefficient is related to the local permeability of the solute for a given region of the bilayer and interfacial resistance. While this process works reasonably well for small molecules, other considerations are needed for peptides [5]. A common practice in experimental permeability determination is to replace the actual membrane with solvent(s) of “adequate” physico-chemical properties. While such replacements have innate issues, they are easier to set up and can often be used in a high throughput manner. One such example is the use of the non-polar 1,9-decadiene (DED) molecule as a membrane mimic of egg-lecithin membrane. The egg-lecithin membrane (also known as the black lipid membrane) is used in experiments for calculating the bilayer permeability of compounds [6,7,8]. The DED/Water partitioning thus attracted attention as an estimator of lecithin−water permeability as well as an excellent descriptor of chemical selectivity in lecithin membrane permeability [9,10,11]. It is important to point out that the success of such correlations between a membrane mimic and actual membrane permeability depends on the uncertainty in Kmimic/water calculations, membrane composition (and in turn, density of phospholipids), ionic strength, etc. Detailed molecular studies of liquid state of DED are conspicuously absent in literature, although interesting quantitative structure activity relationships for DED/Water partitioning were reported using molecular descriptors based on linear free energy relationships [12,13,14]. Theoretical modeling of permeability as well as partitioning requires detailed involvement of solvents and solvation free energies in molecular partitioning. Continuum solvation models are thus a suitable candidate to calculate explicit solvation free energy terms that are required in partition function calculation. However, a continuum model for DED is not available yet.
The statistical mechanics-based 3D-RISM-KH molecular solvation theory is an alternative to the continuum solvation model in the sense that it represents a solvent molecule with a fixed number of solvent sites, with sizes and charges based on the choice of force field parameters around a solute of arbitrary shape. This theory provides direct correlation functions (DCFs) for all species in solution [15,16,17] by expressing any molecular system with a six-dimensional vector consisting of three positional {r} and orientational degrees of freedom {Θ}, each in the molecular Ornstein–Zernike equation (MOZ) via the pair correlation functions (PCF) of r and Θ of liquids, in three dimensions (3D). Solvent is represented with a finite number of sites (γ) around a solute with the 3D correlation function (hγ(r)):
h γ ( r ) = α d r c α ( r r ) χ α γ ( r )
The 3D-site distribution function (gγ) is calculated as gγ(r) = hγ(r) + 1 and consists of all the interactions among all the solvent sites [18,19]. The physical characteristics of a given solvent/solution, e.g., density and dielectric constant, are used as input in an RISM calculation. For instance, the bulk susceptibility function reflects the shape and orientation of the solvent and is constructed from the intramolecular correlation function ωαγ from the dielectrically consistent RISM (DRISM):
χαγ(r) = ωαγ(r) + ωαγ(r) ραhαγ(r)
The computational speed and accuracy of an RISM calculation depends on the nature of a closure relation for integrating the infinite chain of diagrams produced through Equation (1). The Kovalenko−Hirata closure (KH) has proven to be the most stable, numerically, and provides the solvation structure with reasonable accuracy at a modest computational cost, amongst a handful of successful closure relations [20]. The KH closure approximation accounts for both electrostatic and non-polar features of the liquid and has the following form:
g γ ( r ) = { exp ( u γ ( r ) / ( k B T ) + h γ ( r ) c γ ( r ) ) for g γ ( r ) 1 1 u γ ( r ) / ( k B T ) + h γ ( r ) c γ ( r ) for g γ ( r ) > 1
The KH closure combines the so-called mean spherical approximation (applied to the spatial part with solvent density enrichment, gγ(r) > 1) with the hypernetted chain (HNC) applied to the spatial part with solvent density depletion, gγ(r) < 1, and provides numerical stability and accuracy. While the KH closure is known to underestimate the height of strong associative peaks, these errors are mitigated by broadening of the peaks, and this often corrects the solvation thermodynamics and structure. For further theoretical details of the theory, please refer to [21,22,23]. It is important to keep in mind that the predicted solvation free energy with any theoretical model is not absolute. The excess chemical potentials obtained from the 3D-RISM-KH theory have a qualitative relation with the experimental solvation free energies, and a more quantitative measure can be obtained by careful calibration using the so-called “universal correction” scheme [24] and using the partial molar volume (PMV, ) computed from extending the RISM formalism with the Kirkwood−Buff theory and isothermal compressibility (χT):
= k B T χ T ( 1 γ ρ γ d r c γ ( r ) )
The objective of this manuscript is to first establish a 3D-RISM-KH-based computational protocol to describe the liquid state of DED. This theoretical framework is then validated against traditional molecular dynamics (MD) simulations. The 3D-RISM-KH-based calculations are then extended to calculate excess chemical potentials of 48 solutes in DED and in water. These excess chemical potentials are then used as molecular solvation descriptors with other 2D descriptors to develop a quantitative structure partitioning model using machine learning techniques. This work serves as a proof of concept for successful application of the 3D-RISM-KH solvation energy descriptors in predictive modeling of the decadiene−water partition of small molecules.

2. Materials and Methods

Database preparation: The experimental DED/Water molecular partitioning for small molecules (KDED/W) was collected from the work of Nitsche and co-workers [14]. For logKDED/W data, the reported standard errors in the KDED/W are ignored. This dataset is also a part of those reported by Abraham et al. [12].
Molecular dynamics (MD) simulations: The MD simulations of liquid DED were done using the GROMACS software package [25]. The molecule was parameterized using the all-atom OPLS and CHARMM force fields. The OPLS parameters were generated from the LigParGen server with the 1.14*CM1A-LBCC charge assignment protocol [26,27,28]. The CHARMM parameters were developed using the SWISSPARAM webserver [29,30]. Additionally, the united atom GROMOS parameters were also used for the MD simulations of DED. These parameters were obtained from the Automated Topology Builder webserver [31,32,33]. For all the liquid phase simulation, a homogeneous cubic simulation box with 256 solvent molecules was generated. The initial energy-minimized solvent box was subjected to 500 ps NVT and NPT equilibration without any constraints under periodic boundary conditions. The target temperature was set to 298 K and the target pressure to 1 bar using Berendsen thermostat. The temperature and density profiles were used to judge the adequacy of the equilibration steps. The final production runs were 5 ns long. All the radial distribution functions were calculated using the built-in functions of the GROMACS package from the production simulation trajectories.
Three-dimensional RISM-KH calculations: The lowest energy conformation of all the solutes generated using the OpenBabel toolkit with MMFF94 force field was further used for all the RISM calculations [34]. The 3D-RISM-KH-based excess chemical potential and partial molar volume (used as descriptors in the prediction) were calculated for all the solutes using our in-house 3D-RISM-KH code, a working version of which is implemented in the AMBERTOOLS suite of programs [35]. We used the Transferable Potentials for Phase Equilibria family of force fields (TraPPE) of Siepmann and co-workers for a 1,9-decadiene molecule [36,37]. This is a united atom force field with no charges on the carbon sites. The extended-RISM (X-RISM) formalism was used for calculating susceptibility functions of DED molecule. The geometry of the DED molecule was used after optimizing with the ANTECHAMBER module of AMBERTOOLS. For susceptibility calculations of the water solvent, the dielectric-RISM (DRISM) formalism was used with the modified SPCe force field parameters [38]. The solute force field parameters are summarized in Figure 1. We employed the generalized Amber force field (GAFF) parameters with the AM1-BCC charges for all the solutes [39,40]. The 3D-RISM-KH calculations for the solute molecules were performed using a uniform cubic 3D-grid of 128 × 128 × 128 points in a box of size 64 × 64 × 64 Å3 to represent a solute with a few solvation layers. The convergence accuracy was set to 10−5 in the modified direct inversion in the iterative subspace (MDIIS) solver. The excess chemical potentials (exchem) of the solutes in each solvent were used as additional descriptors for the QSAR models. All the solutes were treated as their neutral form, unless otherwise mentioned in the discussion section.
Two-dimensional molecular descriptor generation: Molecular descriptors were generated from the corresponding SMILES strings of the solute molecules using the publicly available PaDEL-Descriptor software [41].
Machine learning and statistical modeling [42,43]: The machine learning predictive models for molecular partitioning were developed with the above-generated molecular descriptors. The statistical importance analysis of the descriptors, machine learning calculations, and performance indices of models were calculated via the “Extreme Gradient Boosting” (XGBoost) and random forest (RF) technique used successively by optimizing the parameters reducing the relative mean square error (RMSE). The training set used in the machine learning protocols contained 80% of the randomly chosen data from the dataset.

3. Results and Discussion

In the following sections, we have detailed our findings on comparing and contrasting the results of the RISM-KH simulation of liquid DED with the MD simulations using both the all-atom and united atom versions of the current generation force fields. Subsequently, we have shown the applicability of the 3D-RISM-KH protocol developed herein in predicting DED−Water partitioning of a diverse set of compounds.
The lack of experimental data on the liquid state of DED made it difficult to compare the simulation results for accuracy. There is handful of chemical literature on molecular simulations involving DED in the context of a membrane mimic [10,44,45,46]. The dielectric constant of the DED molecule (2.16) was adopted from the works of Lomize et al. [45]. For the MD simulations with different force fields, the equilibration step yielded a reasonable density of the system (Table 1).
The intermolecular separations, as observed from the radial distribution function (RDF) for alkene atoms (1 and 2 in Figure 1) and saturated CH2 centers (3 in Figure 1), are consistent among the different force fields used (Table 2). A compact arrangement of DED molecules in the liquid state exists, which is an excellent property for mimicking a lipid membrane. As evident from the relatively short intermolecular separations of saturated sites (~2.5–3.9 Å, based on force field choice), the core of the liquid structure is more compact than the terminal parts. It is possible that an aliphatic π-interaction for the terminal alkene groups of DED molecule exists in the liquid state. For ethylene dimers, the intermolecular distances were reported to be ~3.8 Å from gas phase geometry optimizations at the coupled cluster level with the correlation consistent basis sets [46]. The partial distribution functions from the RISM-KH calculations with the TraPPE parameters for liquid DED are qualitatively similar to those from the MD simulations but with certain deviations. For instance, the first maxima for the alkene sites have two overlapping peaks. These terminal groups are packed closer than those obtained from the MD simulations (Figure 2). The second maxima of these distribution functions appear at the distance slightly lower than those from the MD simulations, although qualitatively in the similar region for both the types of calculations. The alkane groups are less tightly packed in the RISM-KH calculations.
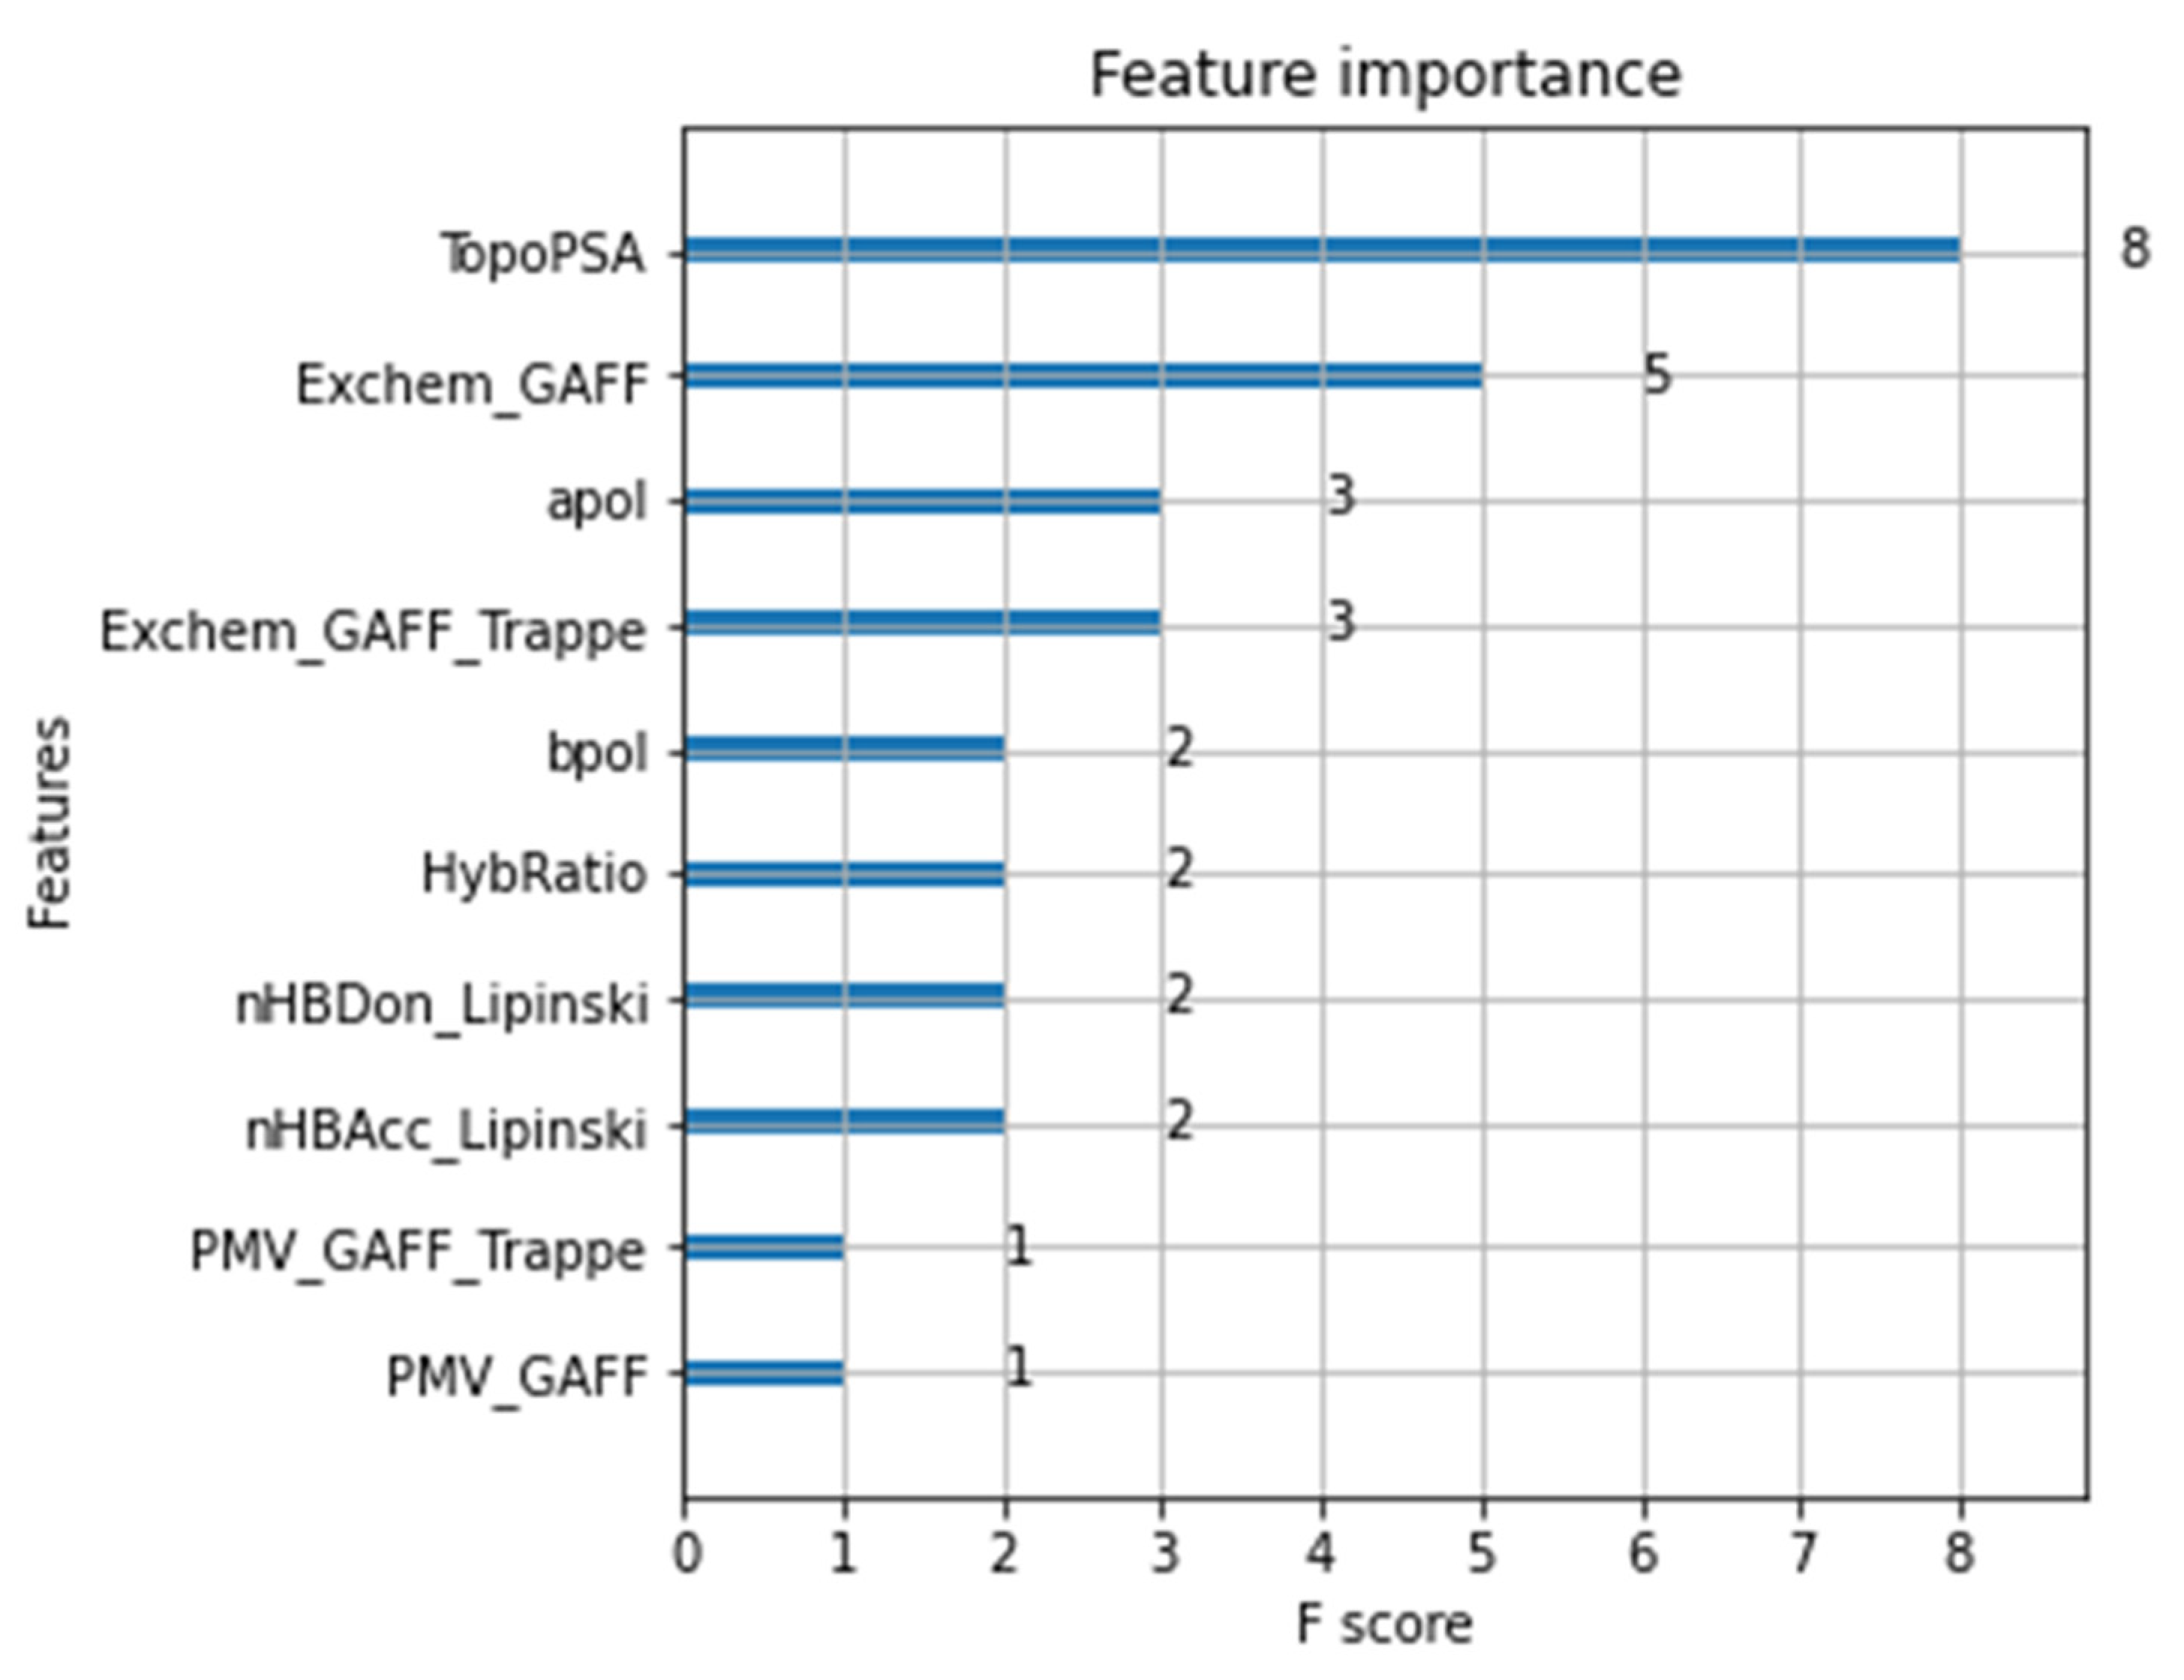
To calculate the DED/Water partition coefficients, we used the DED susceptibility function calculated using the TraPPE parameters and the water susceptibility functions with the modified SPCe parameters using the RISM formalism. The excess chemical potentials calculated from the 3D-RISM-KH theory for DED and water medium as well as the partial molar volume (PMV) of the solutes in the two solvents were used as molecular descriptors. Molecular polarity is an important factor for partitioning between two solvents of opposite polarity. Hence, we have used the topological polar surface area (TopoPSA) [47] and the polarity indices calculated from the connectivity table of the molecule (apol, bpol). The number of hydrogen bond donors and acceptors in the solute molecules is also incorporated in the initial calculations (calculated based on Lipinski’s convention). Hybridization ratios of solutes were another structural descriptor. All the statistical manipulations and machine learning methods were done using the standard Python® implementations. A sample set of the script for XGBoost, linear regression, and random forest methods is provided in the GitHub link. The target function for all the machine learning was logKDED/W collected from the work of Nitsche and coworkers [14]. The most important parameters for predicting the partition coefficients are TPSA and excess chemical potentials in DED and water medium. The polarity index apol also has a positive effect on predictive power. The parameters with the least influence in the prediction scheme are bpol, hydrogen bond donor/acceptor count, PMVs, and hybridization ratio count (Figure 3).
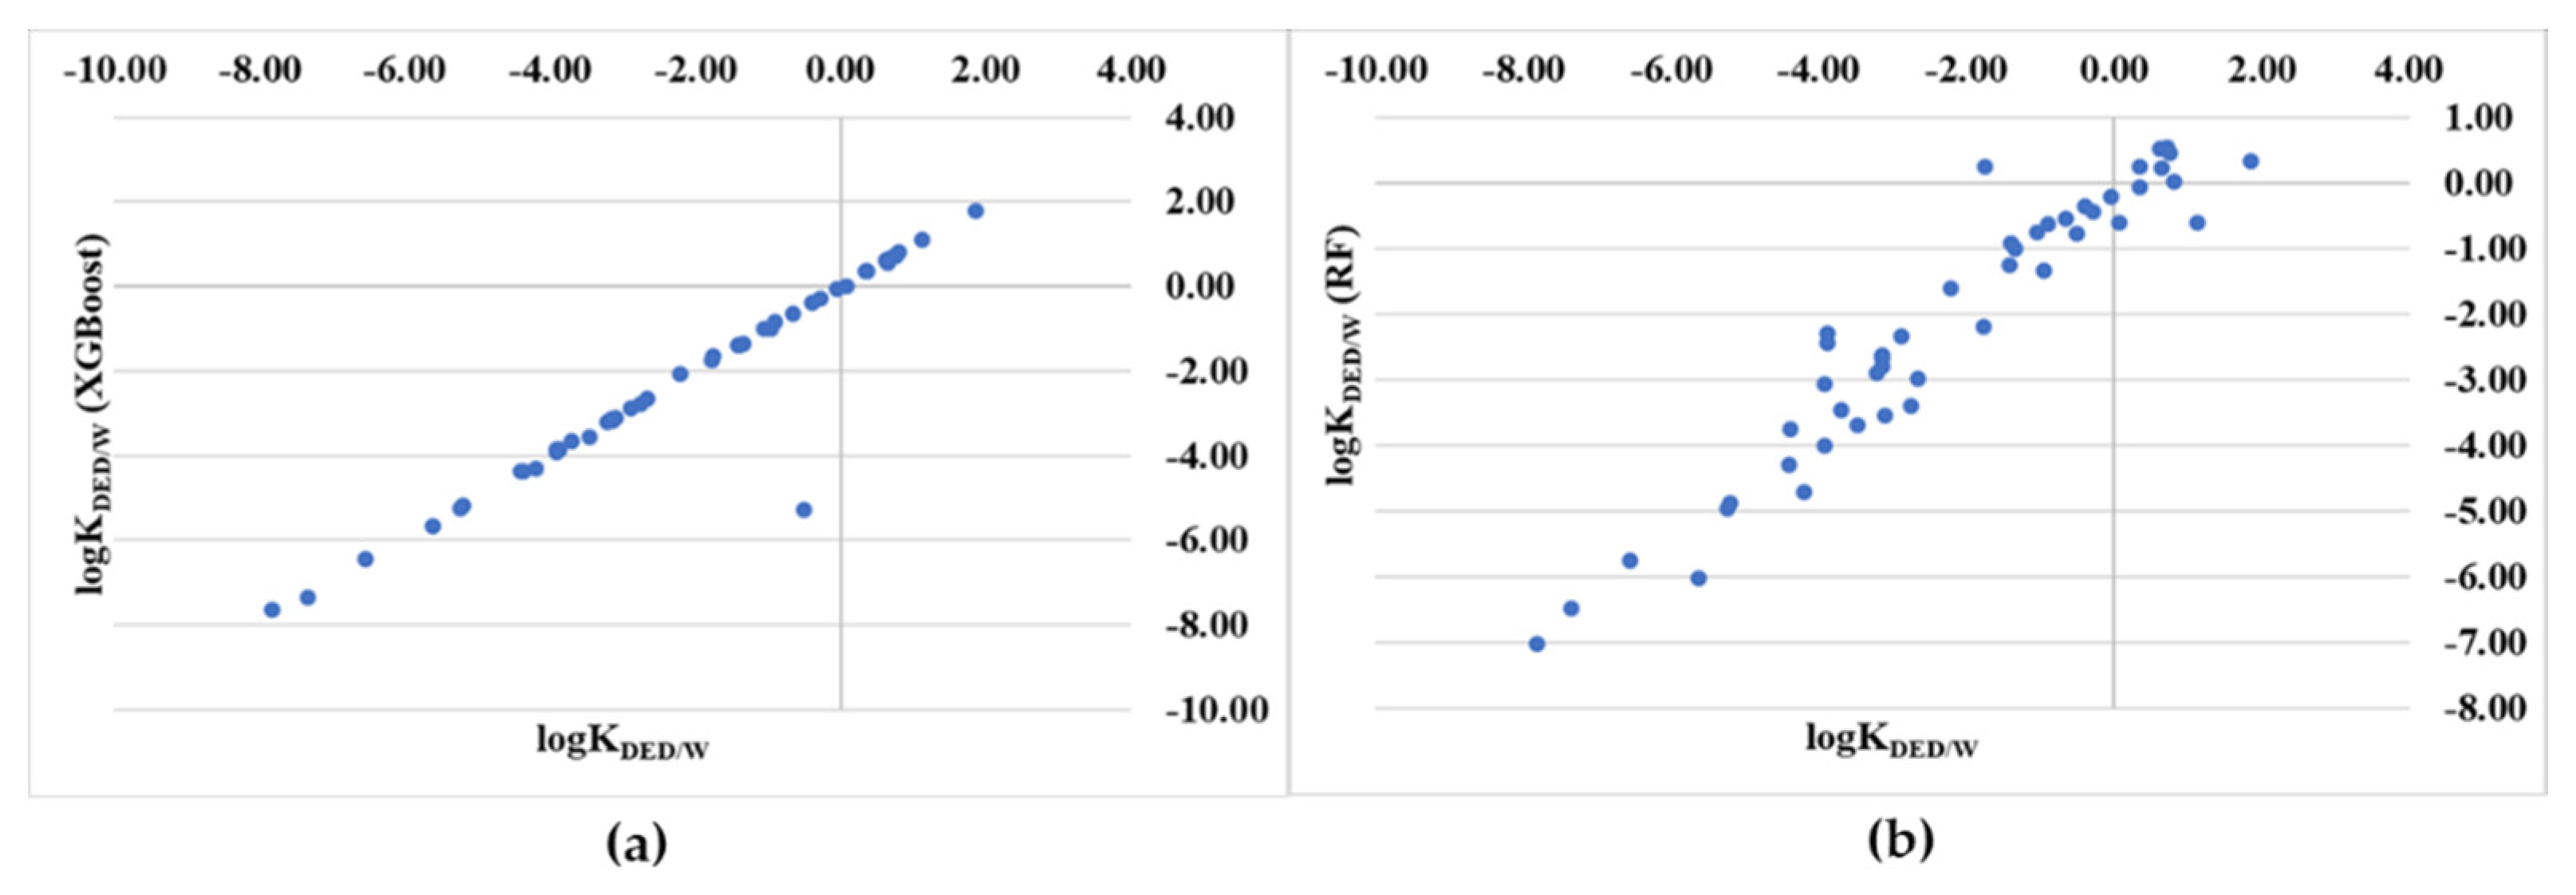
The 3D-RISM-KH descriptors (excess chemical potentials and PMVs in decadiene and water) are used with the aforementioned important 2D descriptors for quantitative structure activity modeling. The XGBoost method yielded an overall relative mean square error (RMSE) of 1.09 units for the test set. Prediction of the entire dataset by XGBoost yielded an RMSE of 0.05 unit. The small error in the prediction could be an effect of overfitting due to the small dataset. The random forest (RF) predictions yielded RMSEs of 1.14 and 0.68 units for test set and the whole dataset, respectively. Application of the simple linear regression model resulted in larger RMSEs, 1.23 and 0.92 units for the test and whole dataset, respectively. In order to judge the performance gain in predicting partition coefficients by incorporating the 3D-RISM-KH computed solvation descriptors, we have built predictive models using only 2D-moleculae descriptors, from here on denoted as XGB-2D-Descriptor Model. This model also yielded excellent predictions (RMSEs of 0.13 and 1.04 units for the whole data set and the test set, respectively) but with albeit higher RMSE than those computed by the XGBoost method with the 3D-RISM-KH solvation descriptors. The calculated partition coefficients and statistical correlation of the XGBoost and the random forest machine learning models’ computed partition coefficients with experimental data are provided in Table 3 and Figure 4. The statistical correlations of these machine learning models for the test set and the whole dataset of 48 compounds are provided in Table 4. The earlier predictions by Abraham and coworkers [12] and by Nitsche and coworkers [13] had also reported excellent predictive models with empirical descriptors.

4. Conclusions

The 3D-RISM-KH molecular solvation theory was used to first generate suitable solvent susceptibility functions of liquid 1,9-decadiene. The choice of the force field, viz. TraPPE, was guided by the nonpolar nature of DED and also by the fact that it offers a reduction in the number of solvent sites with different atomic parameters, thus helping in the convergence of the MDIIS solver used for the RISM calculations. The XRISM-KH computed partial distribution functions showed qualitative agreement with the radial distributions obtained from the all-atom and united atom MD simulations. There are some differences observed in the nature of molecular packing in the liquid DED computations by the RISM and MD methods. The RISM calculations provide a more compact ordering of the terminal region than what was observed from the MD simulation data. In the absence of experimental results, it is impossible to comment on these differences. The quantitative predictions of the DED/Water partition coefficients for 48 solutes were done using the excess chemical potentials in DED and water solvents as descriptors with a few other 2D molecular descriptors. Amongst the three different machine learning models, the XGBoost method provided the best performance, followed by the random forest and multiple linear regression methods. The benzoic acid system is an outlier in the XGBoost method. This solvent combination is referred to as a mimic of lecithin/water permeation of molecules, and hence, it is useful in drug development applications. The 48 solutes used in this study cover a vast class of chemical functionality including peptide bond analogs, and so a broad applicability of this quantitative prediction scheme is anticipated. In summary, the present work serves as a proof of concept of successful application of the 3D-RISM-KH calculated excess chemical potentials of solutes in the 1,9-decadiene and water solvents as descriptors in predicting decadiene-water partitioning.

Author Contributions

Conceptualization, D.R. and A.K.; methodology, D.R. and A.K.; software, D.R. and A.K.; formal analysis, D.R., D.D. and A.K.; writing—original draft preparation, D.R. and D.D.; writing—review and editing, D.R., D.D. and A.K.; funding acquisition, A.K. All authors have read and agreed to the published version of the manuscript.

Funding

This work was financially supported by the NSERC Discovery Grant (RES0029477), Alberta Innovates AARP VII Research Grant (RES0043948), and Alzheimer Society of Alberta and Northwest Territories AARP VII Research Grant (RES0043949).

Institutional Review Board Statement

Not applicable.

Informed Consent Statement

Not applicable.

Data Availability Statement

GitHub link for the python notebooks: https://github.com/droy2021/droy2021/tree/main/ESM_Decadiene (accessed on 30 August 2021).

Acknowledgments

Generous computing time provided by WestGrid (www.westgrid.ca) and Compute Canada/Calcul Canada (www.computecanada.ca) is acknowledged.

Conflicts of Interest

The authors declare no conflict of interest.

References

  1. Bennion, B.J.; Be, N.A.; McNerney, M.W.; Lao, V.; Carlson, E.M.; Valdez, C.A.; Malfatti, M.A.; Enright, H.A.; Nguyen, T.H.; Lightstone, F.C.; et al. Predicting a Drug’s Membrane Permeability: A Computational Model Validated with in Vitro Permeability Assay Data. J. Phys. Chem B 2017, 121, 5228–5237. [Google Scholar] [CrossRef] [PubMed] [Green Version]
  2. Lanevskij, K.; Didziapetris, R. Physicochemical QSAR Analysis of Passive Permeability across Caco-2 Monolayers. J. Pharm. Sci. 2019, 108, 78–86. [Google Scholar] [CrossRef] [Green Version]
  3. Leung, S.S.F.; Sindhikara, D.J.; Jacobson, M.P. Simple Predictive Models of Passive Membrane Permeability Incorporating Size-Dependent Membrane-Water Partition. J. Chem. Inf. Model. 2016, 56, 924–929. [Google Scholar] [CrossRef] [PubMed]
  4. Roy, D.; Dutta, D.; Wishart, D.S.; Kovalenko, A. Predicting PAMPA permeability using the 3D-RISM-KH theory: Are we there yet? J. Comput.-Aided Mol. Des. 2021, 35, 261–269. [Google Scholar] [CrossRef]
  5. Burton, P.S.; Conradi, R.A.; Hilgers, A.R.; Ho, N.F.H.; Maggiora, L.L. The relationship between peptide structure and transport across epithelial cell monolayers. J. Control. Rel. 1992, 19, 87–97. [Google Scholar] [CrossRef]
  6. Mueller, P.; Rudin, D.O.; Tien, H.T.; Wescott, W.C. Reconstruction of cell membranes structure in vitro and its transformation into an excitable system. Nature 1962, 94, 979–980. [Google Scholar] [CrossRef] [PubMed]
  7. Lomize, A.L.; Pogozheva, I.D. Physics-Based Method for Modeling Passive Membrane Permeability and Translocation Pathways of Bioactive Molecules. J. Chem. Inf. Model. 2019, 51, 3198–3213. [Google Scholar] [CrossRef] [PubMed]
  8. Lomize, A.L.; Hage, J.M.; Schnitzer, K.; Golobokov, K.; LaFaive, M.B.; Forsyth, A.C.; Pogozheva, I.D. PerMM: A Web Tool and Database for Analysis of Passive Membrane Permeability and Translocation Pathways of Bioactive Molecules. J. Chem. Inf. Model. 2019, 59, 3094–3099. [Google Scholar] [CrossRef]
  9. Mayer, P.T.; Anderson, B.D. Transport across 1,9-decadiene precisely mimics the chemical selectivity of the barrier domain in egg lecithin bilayers. J. Pharm. Sci. 2002, 91, 640–646. [Google Scholar] [CrossRef]
  10. Xiang, T.-X.; Anderson, B.D. The relationship between permeant size and permeability in lipid bilayer membranes. J. Memb. Biol. 1994, 140, 111–122. [Google Scholar] [CrossRef]
  11. Cao, Y.; Xiang, T.-X.; Anderson, B.D. Development of Structure−Lipid Bilayer Permeability Relationships for Peptide-like Small Organic Molecules. Mol. Pharm. 2008, 5, 371–388. [Google Scholar] [CrossRef]
  12. Abraham, M.H.; Acree, W.E., Jr. Linear free-energy relationships for water/hexadec-1-ene and water/deca-1,9-diene partitions, and for permeation through lipid bilayers; comparison of permeation systems. New J. Chem. 2012, 36, 1798–1806. [Google Scholar] [CrossRef]
  13. Nitsche, J.M.; Kasting, G.B. A critique of Abraham and Acree’s correlation for deca-1,9-diene/water partition coefficients. New J. Chem. 2013, 37, 283–285. [Google Scholar] [CrossRef]
  14. Nitsche, J.M.; Kasting, G.B. A correlation for 1,9-decadiene/water partition coefficients. J. Pharm. Sci. 2013, 102, 136–144. [Google Scholar] [CrossRef] [PubMed]
  15. Chandler, D.; McCoy, J.D.; Singer, S.J. Density functional theory of nonuniform polyatomic systems. I. General formulation. J. Chem. Phys. 1986, 85, 5971–5976. [Google Scholar] [CrossRef]
  16. Chandler, D.; McCoy, J.D.; Singer, S.J. Density functional theory of nonuniform polyatomic systems. II. Rational closures for integral equations. J. Chem. Phys. 1986, 85, 5977–5982. [Google Scholar] [CrossRef]
  17. Lowden, L.J.; Chandler, D. Solution of a new integral equation for pair correlation functions in molecular liquids. J. Chem. Phys. 1973, 59, 6587–6595. [Google Scholar] [CrossRef]
  18. Kovalenko, A. Molecular theory of solvation: Methodology summary and illustrations. Cond. Matt. Phys. 2015, 18, 32601. [Google Scholar] [CrossRef] [Green Version]
  19. Palmer, D.S.; Frolov, A.; Ratkova, E.; Fedorov, M.V. Towards a universal method for calculating hydration free energies: A 3D reference interaction site model with partial molar volume correction. J. Phys. Condens. Matt. 2010, 22, 492101. [Google Scholar] [CrossRef]
  20. Kovalenko, A.; Hirata, F. A molecular theory of liquid interfaces. Phys. Chem. Chem. Phys. 2005, 7, 1785–1793. [Google Scholar] [CrossRef] [PubMed]
  21. Kovalenko, A. Multiscale Modeling of Solvation. In Springer Handbook of Electrochemical Energy; Breitkopf, C., Swider-Lyons, K., Eds.; Springer: Berlin/Heidelberg, Germany, 2017. [Google Scholar]
  22. Kovalenko, A.; Gusarov, S. Multiscale methods framework: Self-consistent coupling of molecular theory of solvation with quantum chemistry, molecular simulations, and dissipative particle dynamics. Phys. Chem. Chem. Phys. 2017, 20, 2947–2969. [Google Scholar] [CrossRef] [PubMed]
  23. Ratkova, E.L.; Palmer, D.S.; Fedorov, M.V. Solvation Thermodynamics of Organic Molecules by the Molecular Integral Equation Theory: Approaching Chemical Accuracy. Chem. Rev. 2015, 13, 6312–6356. [Google Scholar] [CrossRef] [PubMed] [Green Version]
  24. Misin, M.; Palmer, D.S.; Fedorov, M.V. Predicting Solvation Free Energies Using Parameter-Free Solvent Models. J. Phys. Chem. B 2016, 120, 5724–5731. [Google Scholar] [CrossRef] [PubMed] [Green Version]
  25. Abraham, M.J.; Murtola, T.; Schulz, R.; Páll, S.; Smith, J.C.; Hess, B.; Lindahl, E. GROMACS: High performance molecular simulations through multi-level parallelism from laptops to supercomputers. SoftwareX 2015, 1–2, 19–25. [Google Scholar] [CrossRef] [Green Version]
  26. Jorgensen, W.L.; Tirado-Rives, J. Potential energy functions for atomic-level simulations of water and organic and biomolecular systems. Proc. Natl. Acad. Sci. USA 2005, 102, 6665–6670. [Google Scholar] [CrossRef] [Green Version]
  27. Dodda, L.S.; Vilseck, J.Z.; Tirado-Rives, J.; Jorgensen, W.L. 1.14*CM1A-LBCC: Localized Bond-Charge Corrected CM1A Charges for Condensed-Phase Simulations. J. Phys. Chem. B 2017, 121, 3864–3870. [Google Scholar] [CrossRef] [Green Version]
  28. Dodda, L.S.; de Vaca, I.C.; Tirado-Rives, J.; Jorgensen, W.L. LigParGen web server: An automatic OPLS-AA parameter generator for organic ligands. Nucl. Acid. Res. 2017, 45, W331–W336. [Google Scholar] [CrossRef] [Green Version]
  29. Zoete, V.; Cuendet, M.A.; Grosdidier, A.; Michielin, O. SwissParam: A fast force field generation tool for small organic molecules. J. Comput. Chem. 2011, 32, 2359–2368. [Google Scholar] [CrossRef]
  30. Brooks, B.R.; Brooks, C.L., III; MacKerell, A.D., Jr.; Nilsson, L.; Petrella, R.J.; Roux, B.; Won, Y.; Archontis, G.; Bartels, C.; Boresch, S.; et al. CHARMM: The biomolecular simulation program. J. Comput. Chem. 2009, 30, 1545–1614. [Google Scholar] [CrossRef]
  31. Malde, A.K.; Zuo, L.; Breeze, M.; Stroet, M.; Poger, D.; Nair, P.C.; Oostenbrink, C.; Mark, A.E. An Automated Force Field Topology Builder (ATB) and Repository: Version 1.0. J. Chem. Theory Comput. 2011, 7, 4026–4037. [Google Scholar] [CrossRef] [PubMed]
  32. Koziara, K.B.; Stroet, M.; Malde, A.K.; Mark, A.E. Testing and validation of the Automated Topology Builder (ATB) version 2.0: Prediction of hydration free enthalpies. J. Comput.-Aided Mol. Des. 2014, 28, 221–233. [Google Scholar] [CrossRef] [PubMed]
  33. Schmid, N.; Eichenberger, A.P.; Choutko, A.; Riniker, S.; Winger, M.; Mark, A.E.; van Gunsteren, W.F. Definition and testing of the GROMOS force-field versions 54A7 and 54B7. Eur. Biophys. J. 2011, 40, 843–856. [Google Scholar] [CrossRef] [PubMed]
  34. O’Boyle, N.M.; Banck, M.; James, C.A.; Morley, C.; Vandermeersch, T.; Hutchison, G.R. Open Babel: An open chemical toolbox. J. Cheminfo. 2011, 3, 33. [Google Scholar] [CrossRef] [Green Version]
  35. Case, D.A.; Ben-Shalom, I.Y.; Brozell, S.R.; Cerutti, D.S.; Cheatham, T.E., III; Cruzeiro, V.W.D.; Darden, T.A.; Duke, R.E.; Ghoreishi, D.; Gilson, M.K.; et al. AMBER 2018; University of California: San Francisco, CA, USA, 2018. [Google Scholar]
  36. Wick, C.D.; Martin, M.G.; Siepmann, J.I. Transferable Potentials for Phase Equilibria. 4. United-Atom Description of Linear and Branched Alkenes and Alkylbenzenes. J. Phys. Chem. B 2000, 104, 8008–8016. [Google Scholar] [CrossRef] [Green Version]
  37. Martin, M.G.; Siepmann, J.I. Transferable Potentials for Phase Equilibria. 1. United-Atom Description of n-Alkanes. J. Phys. Chem. B 1998, 102, 2569–2577. [Google Scholar] [CrossRef]
  38. Pettitt, B.; Rossky, P. Integral equation predictions of liquid state structure for waterlike intermolecular potentials. J. Chem. Phys. 1982, 77, 1451–1457. [Google Scholar] [CrossRef]
  39. Wang, J.; Wang, W.; Kollman, P.A.; Case, D.A. Automatic atom type and bond type perception in molecular mechanical calculations. J. Mol. Graph. Model. 2006, 25, 247260. [Google Scholar] [CrossRef]
  40. Jakalian, A.; Jack, D.B.; Bayly, C.I. Fast, efficient generation of high-quality atomic charges. AM1-BCC model: II. Parameterization and validation. J. Comput. Chem. 2002, 23, 1623–1641. [Google Scholar] [CrossRef]
  41. Yap, C.W. PaDEL-descriptor: An open source software to calculate molecular descriptors and fingerprints. J. Comput. Chem. 2011, 32, 1466–1476. [Google Scholar] [CrossRef]
  42. Kuhn, M.; Johnson, K. Applied Predictive Modeling; Springer: Berlin/Heidelberg, Germany, 2018. [Google Scholar]
  43. Erić, S.; Kalinić, M.; Ilić, K.; Zloh, M. Computational classification models for predicting the interaction of drugs with P-glycoprotein and breast cancer resistance protein. SAR QSAR Environ. Res. 2014, 25, 939–966. [Google Scholar] [CrossRef]
  44. Xiang, T.-X.; Anderson, B.D. A computer simulation of functional group contributions to free energy in water and a DPPC lipid bilayer. Biophys. J. 2002, 82, 2052–2066. [Google Scholar] [CrossRef] [Green Version]
  45. Lomize, A.L.; Pogozheva, I.D.; Mosberg, H.I. Anisotropic Solvent Model of the Lipid Bilayer. 1. Parameterization of Long-Range Electrostatics and First Solvation Shell Effects. J. Chem. Inf. Model. 2011, 51, 918–929. [Google Scholar] [CrossRef] [PubMed] [Green Version]
  46. Kin, K.S.; Karthikeyan, S.; Singh, N.J. How Different Are Aromatic π Interactions from Aliphatic π Interactions and Non-π Stacking Interactions? J. Chem. Theory Comput. 2011, 7, 3471–3477. [Google Scholar]
  47. Ertl, P.; Rhode, B.; Selzer, P. Fast Calculation of Molecular Polar Surface Area as a Sum of Fragment-Based Contributions and Its Application to the Prediction of Drug Transport Properties. J. Med. Chem. 2000, 43, 3714–3717. [Google Scholar] [CrossRef]
  48. Kim, S.; Chen, J.; Cheng, T.; Gindulyte, A.; He, J.; He, S.; Li, Q.; Shoemaker, B.A.; Thiessen, P.A.; Yu, B.; et al. PubChem in 2021: New data content and improved web interfaces. Nucl. Acid. Res. 2011, 49, D1388–D1395. [Google Scholar] [CrossRef] [PubMed]
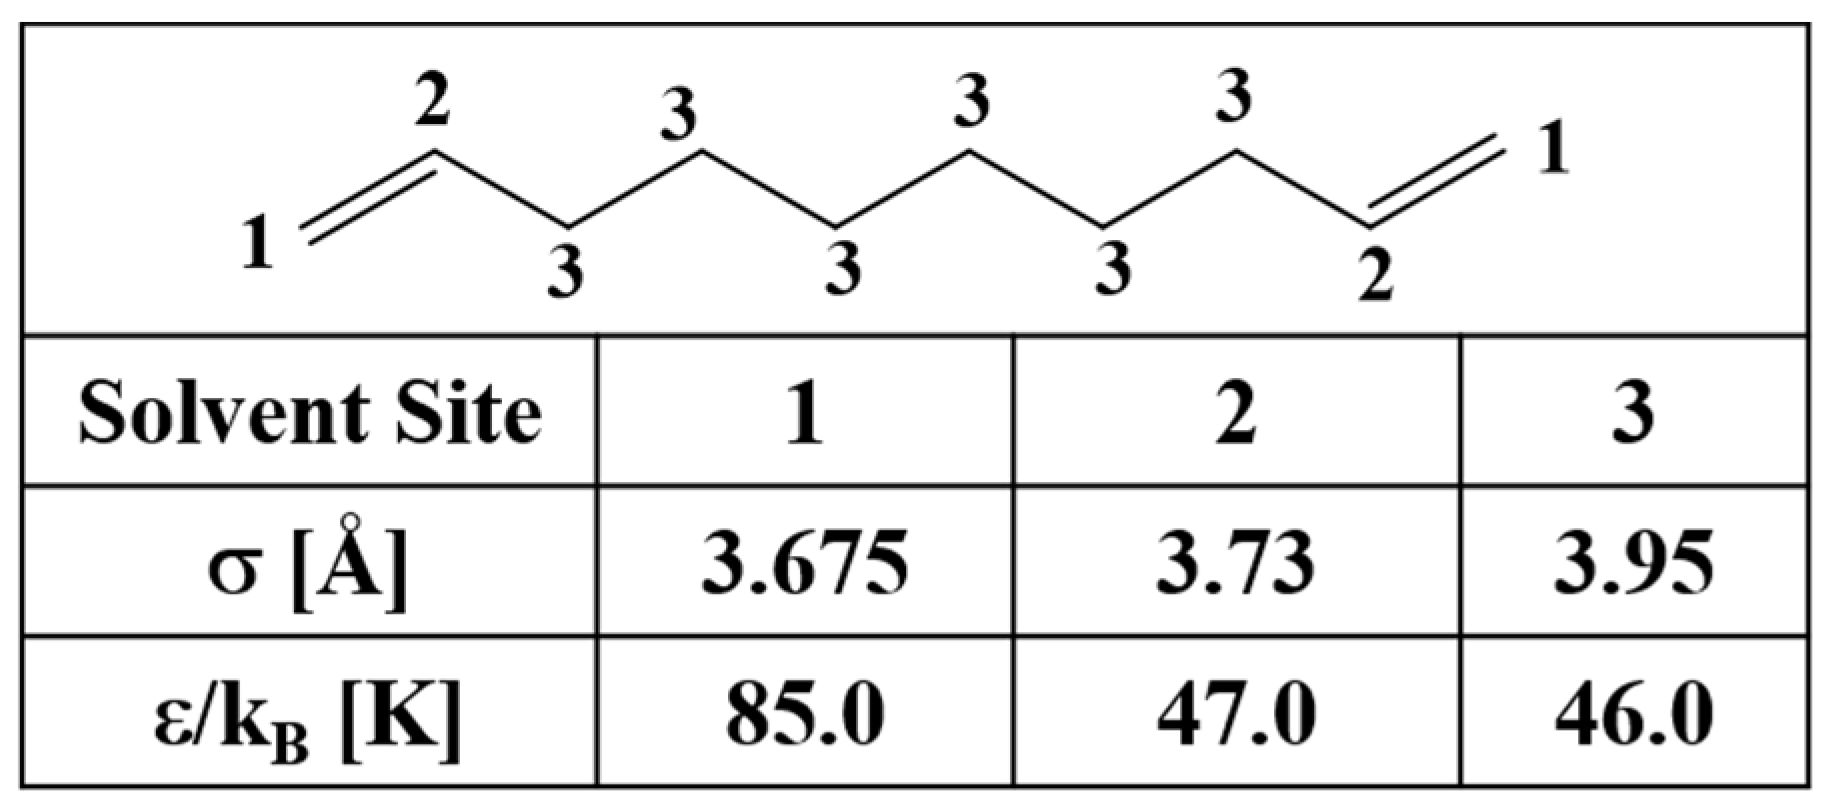
Figure 1. Atomic size parameters of the 1,9-decadiene solvent used in this work.
Physchem 01 00015 g001
Figure 2. Radial distribution functions from the MD simulations with (a) CHARMM, (b) OPLS, and (c) GROMOS force fields, and partial distribution functions from the X-RISM-KH simulations with (d) TraPPE force field parameters.
Physchem 01 00015 g002
Figure 3. Feature importance for the quantitative partitioning calculations using the XGBoost method.
Physchem 01 00015 g003
Figure 4. Correlation between (a) XGBoost computed and (b) random forest computed partition coefficients (logKDED/W) with the experimental results.
Physchem 01 00015 g004
Table 1. Density (in g/cm3) of 1,9-Decadiene from the MD simulations with different force field parameters.
MethodDensityError Estimate
Experimental0.75-
CHARMM0.7410.049
GROMOS0.7510.036
OPLS0.7280.068
Table 2. First and second maxima of the RDFs from the MD simulations and the partial distribution functions (in Å) from the RISM-KH calculation of liquid 1,9-decadiene.
Force Fieldg(C1-C1) ag(C2-C2) ag(CH2-CH2) a
CHARMM4.06/9.045.1/8.682.48/3.12
OPLS3.94/9.025.06/8.862.56/3.22
GROMOS-UA4.06/8.945.08/8.72.54/3.88
RISM-KH (TraPPE)2.58 (3.88)/8.482.42 (4.2)/8.655.22/9.18
a Solvent sites are provided in Figure 1. C1 is the terminal H2C = site (1), C2 = CH- site (2), and CH2 is the saturated alkane site (3).
Table 3. Experimental and computed decadiene−water partition coefficients (logK) of 48 solutes.
CID aLogK bXGB cRF dLR eCID aLogK bXGB cRF dLR e
63241.851.790.331.73284−3.21−3.21−2.90−3.13
264 *−1.41−1.39−1.26−1.04176−2.89−2.88−2.34−2.22
1292−3.15−3.13−2.64−3.29178 *−3.89−3.85−2.45−2.52
10010.620.610.500.54190 *−5.24−5.23−4.97−3.70
5610−1.35−1.36−1.00−1.06243−0.51−5.28−0.79−0.97
9727 *−1.75−1.660.250.0968470.340.370.250.68
68,313 *−0.90−0.85−0.640.9071230.760.730.441.14
46570.650.560.220.112201 *0.810.820.022.96
104,735 *1.121.09−0.600.8920,039−4.19−4.29−4.72−4.77
7470−0.05−0.07−0.22−0.6413,730−5.62−5.66−6.01−6.24
74,234 *−0.28−0.28−0.44−1.915755−3.10−3.10−3.55−3.01
308,473 *−0.96−0.99−1.33−1.575754 *−2.76−2.79−3.40−1.87
270,871 *−1.77−1.76−2.20−2.25999−1.05−1.00−0.76−1.61
76,360 *−3.14−3.15−2.67−2.3231,374−2.21−2.06−1.61−0.63
220,005−3.92−3.93−4.00−4.5165840.070.00−0.61−1.46
23,273,690−4.40−4.37−4.29−4.6115,684,457 *−3.89−3.84−2.30−2.96
97,479−3.47−3.56−3.69−3.9712,539,853 *−3.13−3.16−2.79−3.41
129,821,671−3.70−3.65−3.46−4.462,728,789−2.66−2.66−2.98−3.60
129,821,666 *−4.38−4.38−3.75−5.60248,474−0.40−0.40−0.36−1.52
129,821,670−5.19−5.19−4.88−4.63222,175−0.66−0.65−0.540.70
129,821,665−6.55−6.45−5.74−5.154,048,7980.360.37−0.08−0.03
17,851,005−7.35−7.35−6.47−6.6790,265 *−1.40−1.39−0.93−0.49
54,472,514−7.82−7.63−7.03−6.8310010.620.610.500.47
962−3.92−3.85−3.08−3.4431,2420.710.690.540.79
a Pubchem CID of the solutes [48]. Molecules in the test set are marked with an asterisk (*). b Experimental logK. c logK computed using the XGBoost method. d logKDED/W computed using the random forest method. e logKDED/W computed using the multiple linear regression model.
Table 4. Performance metrices of the machine learning model in the quantitative predictions of logKDED/W.
StatisticsXGBoostRandom Forest (RF)Linear Regression (LR)XGB-2D-Descriptor Model
The Full Dataset
RMSE 0.050.680.920.12
Spearman Correlation0.990.940.930.99
Pearson Correlation0.990.960.920.99
R20.990.900.840.99
Test Set
RMSE1.091.141.231.04
Spearman Correlation0.720.730.880.75
Pearson Correlation0.800.840.840.82
R20.640.670.540.67
Publisher’s Note: MDPI stays neutral with regard to jurisdictional claims in published maps and institutional affiliations.