Article

Effect of Headstarting Eggstrands of the Endangered Houston Toad (Bufo = [Anaxyrus] houstonensis) from a Captive Assurance Colony on Native Breeding Pond Microbiomes

by
Andrea Villamizar
1,
Spandana Vemulapally
1,
Trina Guerra
1,
Maryanne E. Tocidlowski
2,
Michael R. J. Forstner
1,* and
Dittmar Hahn
1
1
Department of Biology, Texas State University, 601 University Drive, San Marcos, TX 78666, USA
2
Houston Zoo, Inc., 1513 Cambridge St., Houston, TX 77030, USA
*
Author to whom correspondence should be addressed.
Conservation 2025, 5(2), 25; https://doi.org/10.3390/conservation5020025
Submission received: 31 March 2025 / Revised: 9 May 2025 / Accepted: 21 May 2025 / Published: 27 May 2025

Abstract

:
The bacterial community in water from the Houston-toad captive assurance colony held at the Houston Zoo, TX, was used for comparison to the native pond bacterial composition by Ilumina-based 16S rRNA V3 amplicon sequencing. We analyzed composite sediment–water samples from native breeding ponds before and after the release of eggstrands, focusing on opportunistic pathogens of the genus Mycobacterium within the phylum Actinobacteria. Proximal native breeding ponds without headstarting were analyzed for comparison. Tank-water samples from holding facilities (NACQ, Rm1, Rm3, Rm4) showed similar bacterial profiles, with sequences identifying Proteobacteria (57.8 ± 6.2% of all reads), Bacteriodetes (28.1 ± 8.9% of all reads), and Firmicutes (4.1 ± 2.0% of all reads) generally accounting for more than 90% of all reads. Actinobacteria were identified in low abundance, accounting for 1.4 ± 1.1% of all reads, with Nocardiaceae being the most prominent group (54 to 75% of reads), followed by Microbacteriaceae (6 to 12%) and Mycobacteriaceae (1 to 3%). In the pond samples, Proteobacteria remained the most prominent phylum, comprising about 30% of all reads, though other phyla such as Acidobacteria, Actinobacteria, Bacteriodetes, Chloroflexi, Cyanobacteria, Firmicutes, Planctomycetes, Verrucomicrobia, and others were also well represented, ranging from 1% to 15%, with individual phyla peaking at specific sampling times. The prevalence of Actinobacteria sequences varied widely among ponds (<1 to 11% of all reads) and over time (10% and 1%). Most mycobacteria sequences retrieved from tank water were not detected in pond water. Thus, the potential introduction of opportunistic mycobacteria pathogens with tank water from holding facilities and eggstrands via headstarting does not seem to lead to the establishment of these bacteria in natal ponds.

1. Introduction

Historic and continuing habitat loss, the introduction of alien species, climate change, environmental pollution, pathogens, and their interactions have been identified as key factors behind the significant declines in amphibian populations, effecting both their abundance and diversity [1,2,3,4]. These impacts are particularly severe for habitat specialists, as even minor environmental changes can be harmful to their populations [5]. The Houston toad (Bufo houstonensis) is endemic to Texas, utilizing breeding habitats now found in the remnant patches of forest and woodland savannahs in only eight counties in Central Texas. It persists at low population levels and continues to decline in numbers [6]. Listed as endangered by the International Union for Conservation of Nature (IUCN), its decline is attributed to habitat loss, droughts, and predation by imported fire ants (Solenopsis invicta) [6]. Reductions in habitat patch size, connectivity, and overall forest health have impacted the wild population by reducing toad metapopulation dynamics [3]. Hybridization with a congener, Bufo nebulifer (Gulf-Coast toad), may be a factor [3], but concurrent competition with this common toad is also very likely to be negatively impacting a range of species.
Houston-toad populations are monitored using audio data from chorusing males during the spring breeding period. The best available data for the species is from consistent monitoring in Bastrop County, a municipality (~230,000 ha in size) on the western edge of the species distribution [3]. The trend data from these surveys indicate that in the 1980s, scientists detected between 30 and 1000 toads per pond [3]. By the 1990s, the estimate for the entire county (i.e., hundreds of ponds) was 2000 individuals [3]. By the early 2000s, estimates were lowered to 100–200 total individuals for all of Bastrop County [3].
Conservation strategies for endangered amphibians often involve headstarting programs [7,8,9]. For the Houston toad, intensive population management began in 2007, and involved the collection of less than 50% of any given eggstrand from natal ponds, raising the offspring in captivity, and then releasing large numbers of tadpoles or metamorphic juveniles back into their original breeding ponds and nearby habitat [10]. Integrated into this program are efforts that include population assessments, habitat recovery, and restoration carried out by private landowners, zoos, state and federal agencies, and university researchers. Those efforts have coincided with the establishment of captive assurance colonies at institutions like the Houston, Dallas, and Fort Worth Zoos, and the San Marcos National Fish Hatchery and Technology Center, with eggstrands generated in assurance colonies being released into their original ponds as part of the headstarting efforts [11].
While headstarting can help to boost populations in the wild, it comes with several challenges and concerns [12,13]. Besides economic pressures for resource allocation to fund headstarting programs, challenges include the increased susceptibility of animals to diseases in high-density propagation facilities, disease transmission in holding facilities and to the natural environment, pronounced stress and mortality of animals in holding facilities, difficulties of released animals adapting to conditions in the wild, and a reduction or change in the genetic diversity of populations at native sites [13]. Recently, we evaluated potential pathogen transmission threats from captive to free-ranging toads, with a major emphasis on mycobacteria that have been found in the skin lesions of many amphibians [14,15,16]. These infections are often opportunistic, resulting from suboptimal environmental conditions in toad holding facilities [17]. Using microbiome sequence characterization, we detected a variety of opportunistic bacterial pathogens in captive animals that were normally detected in amphibian microbiomes outside of the occurrence of lesions as well as in natal ponds, indicating that the potential reintroduction even of diseased animals into their natural habitat would not change the diverse community of microbial taxa present at natal ponds [18]. Thus, the presence of mycobacteria in the captive assurance colony did not pose a novel exogeneous threat to the remaining wild populations, as these bacteria were ubiquitous in the natural pond habitats with and without Houston toads [18].
The goal of this study was to expand on these initial microbiome analyses and include analyses of substrate and water sample microbiomes in holding facilities as well as those in composite water–sediment samples of native breeding ponds for Houston toads. Native breeding ponds that were not used in headstarting in addition to headstarted ponds were sampled before and after the Houston-toad eggstrands, produced in a captive assurance colony held at the Houston Zoo, were placed in the ponds. Special emphasis was placed on the analyses of mycobacteria in these environmental samples to assess their presence in both holding facilities and native breeding ponds, in addition to the potential transfers and establishment of these organisms in breeding ponds after the release of eggstrands.

2. Materials and Methods

Sampling and DNA extraction: Holding facilities for eggs and tadpoles at the Houston Zoo are 75 L glass tanks located in three climate-controlled rooms. Water consists of purified water (Vantage® MicRO2 Reverse Osmosis Unit; Xylem, Tewksbury, MA, USA) that has been reconstituted from a mixture of 26% calcium chloride, 30% magnesium sulfate heptahydrate, 24% potassium bicarbonate, and 20% sodium bicarbonate (0.08 g L−1). Water samples were obtained in sterile 50 mL tubes from holding facilities in two buildings, namely the NACQ and Coastal buildings. From the NACQ building, water samples were obtained from a reservoir with reconstituted water (n = 10) (further referred to as NACQ), four tanks in room 1 (Rm1), and five tanks in room 3 (Rm3), while 10 tanks were sampled in room 4 (Rm4), which is located in the Coastal building. These samples were taken on 17 March 2021 to be coincident to ongoing pond sampling. Additional samples were also taken from fresh (moss, n = 1) and used substrates (n = 3) from holding tubs of adult Houston toads.
Six ponds (identified as ponds 1, 2, 5, 7, 9, and 12) at Griffith League Ranch, Bastrop, TX, that were native breeding ponds for Houston toads, were sampled. All of these ponds are permanent, not ephemeral, but they can become dry during the most extreme drought conditions. Three of the ponds (1, 7, and 9) are not used in the headstarting efforts, while ponds 2, 5, and 12 are used in headstarting by releasing Houston-toad eggstrands produced in a captive assurance colony held at the Houston Zoo in order to increase toad populations. Biosecurity protocols in the headstarting efforts included the use of single-use plastic aquaculture bags for the transportation of eggstrands, thorough cleaning of all transport containers holding those bags after each use, and the use of single-site eggstrand-protecting net bags within the ponds. Those predator-exclusion net bags were solarized after each use, but never moved offsite. Two weeks before the release (12 February), directly after the release (24 February), and about 4 weeks (19 March) and also 6 months (28 August) after the release, composite water and sediment samples (approx. 1/1, vol/vol) were retrieved with sterile 50 mL tubes at a depth of 4–10cm, about 1 m from the shoreline of the pond. Samples were processed the same day.
The processing of samples from the holding facilities and ponds included the mixing of water and sediment by shaking, followed by the transfer of 1 mL subsamples to 2 mL cryotubes and centrifugation at 14,000× g for 5 min. The supernatant was discarded, and DNA was extracted from the remaining pellet (about 300 mg wet weight) using the SurePrepTM Soil DNA Isolation Kit (Fisher Scientific, Houston, TX, USA), with small modifications [19]. These modifications included omission of the humic acid removal step, while the initial bead-beating step was carried out with 50% of the recommended liquid. The remaining 50% of the liquid was used to re-extract the sample after the bead-beating step. The DNA concentrations in extracts were measured with a Qubit® 2.0 Fluorometer (Life Technologies, Carlsbad, CA, USA).
Illumina amplicon sequencing: Amplicons of 16S rRNA gene fragments (approx. 350 bp) were obtained from DNA extracts using primer 515f and barcoded primer 806r, both of which included linker sequences, following the instructions from the Earth Microbiome Project [20,21,22]. This protocol was designed and tested by the Earth Microbiome Project to amplify prokaryotes (bacteria and archaea) using paired-end 16S community sequencing on the Illumina platform. In order to overcome some of the potential limitations (e.g., primer mismatch or DNA concentration issues), we utilized both standardized DNA concentrations (as above), but also an appropriate annealing temperature. Volumes of 100 µL with 1× Taq Buffer, 1.5 mM MgCl2, 0.2 mM deoxyribonucleotide triphosphates (dNTPs), 0.2 µM primers, 2.5 µg/µL bovine serum albumin, 1U Taq polymerase (GenScript, Inc., Piscataway, NJ, USA), and 1 µL DNA extract (10–40 ng) were used for amplifications that included an initial denaturation at 94 °C for 3 min followed by 35 cycles of 94 °C for 45 s, 50 °C for 60 s, and 72 °C for 90 s, with a final 72 °C extension for 10 min. The PureLink® PCR Purification Kit (Invitrogen, Waltham, MA, USA) was used to clean amplicons, which were then checked for quality and DNA concentration on a 2200 TapeStation System (Agilent Technologies, Santa Clara, CA, USA) using the Agilent DNA D1000 ScreenTape (Agilent Technologies).
Samples were analyzed on an Illumina MiSeq v3 (Illumina, Inc., San Diego, CA, USA) with paired-end 2 × 300 base pair (bp) reads using the respective sequencing and index sequence primers.
Bioinformatics: Demultiplexed fastq files containing the raw sequence reads were imported into R version 4.1.1 [23] and processed with the DADA2 pipeline version 1.20.0 [24]. After quality checking using the plotqualityprofile function with a maximum of two expected errors per read (maxEE = 2), the forward and reverse paired reads were filtered to remove low-quality reads and trimmed to 250 and 150 bp, respectively, using the filterandtrim function. Following error rate estimation and dereplication, the forward and reverse sequences were concatenated using the mergePairs function. A core sample inference algorithm was used to infer Amplicon Sequence Variants (ASVs) using the dada function, and the ASV table was constructed using the makeSequenceTable function. This was followed by bimera removal using the removeBimeraDenovo function. The sequence table was then used to assign taxonomy using the assignTaxonomy function and comparing against the DADA2 formatted reference fasta files from the database RefSeq+RDP (NCBI RefSeq 16S rRNA database supplemented by RDP).
Reads identifying mycobacteria were assembled in Geneious 11.1.5 (Biomatters Ltd., Auckland, New Zealand) and aligned using the Geneious alignment tool. These reads were checked in GenBank/EMBL databases using the BLAST 2.16 [25]. Representative sequences from confirmed strains were added from GenBank/EMBL databases, and all sequences were re-aligned. We evaluated the identity and relationship among the amplified sequences amplified using neighbor joining (NJ) [26], and maximum likelihood (ML) [27] analyses from within Geneious 11.1.5. For the NJ analyses, we utilized the HKY85 model to correct for substitution bias [28]. For the ML analyses, model parameters were estimated by the general time reversible (GTR) model with gamma [29] and used in a heuristic search using RAxML [30]. Bootstrap values [31] were estimated from a heuristic search with random stepwise sequence addition for 10,000 NJ and 10,000 ML iterations.
Statistical analysis: The Operational Taxonomic Unit (OTU) table, taxonomic table, and sample metadata table were then combined in a phyloseq class object using the phlyoseq function in the phyloseq R package version 1.36.0 for further downstream analysis [32]. ASVs were aggregated at the genus level using the tax_glom function, and the subset_taxa function was used to subset objects to only the Mycobacterium genus. ASVs were then transformed to relative abundances using the transform_sample_counts function in order to reduce the strong effects of potentially over-sampled taxa. Principal Coordinate Analysis (PCoA) ordination based on the Bray–Curtis distance was performed with these relative abundances using the ordinate function and plots were generated using the plot_ordination function.

3. Results

Illumina-based 16S rRNA V3 amplicon sequencing resulted in a total of 4.9 million effective reads from 33 samples from holding facilities with 23,352 to 405,412 reads per sample (mean ± SD: 90,476 ± 65,357) and 12.2 million effective reads from 24 pond samples (six ponds at four sampling times, with 118,418 to 534,641 reads per sample, mean = 214,188 ± 95,773).
We differentiated reads from sequences for the final input set for subsequent confirmation to a taxonomic sequence identity. On the phylum level, all tank-water samples in the holding facilities (NACQ, Rm1, Rm3, Rm4) were very similar, with sequences identifying Proteobacteria (range = 49.1–66.4%; mean = 57.8 ± 6.2% of all reads), Bacteriodetes (range = 17.3–41.4%; mean = 28.1 ± 8.9% of all reads), and Firmicutes (range = 0.9–6.2%; mean = 4.1 ± 2.0% of all reads) generally accounting for more than 90% of all sequences (Figure 1). Actinobacteria were identified in low abundance, accounting for 1.4 ± 1.1% of all reads in tank-water samples at the holding facilities. In the fresh substrate, all phyla present and/or dominating profiles in tank water were detected at a very low prevalence (generally below 1% of all reads, except for Proteobacteria that were present at 2.2% of all reads). The majority of reads (96.6% of 193,555 reads) represented phyla not detected in tank water in large percentages (Figure 1). In contrast, reads of the used substrate largely resembled phyla found in tank water, with Proteobacteria (86.5 ± 11.0% of 286,640 ± 149,268 reads) and Firmicutes (3.8 ± 2.5% of all reads) representing the largest number of reads (Figure 1). Actinobacteria accounted for 2.2 ± 3.2% of all reads (Figure 1).
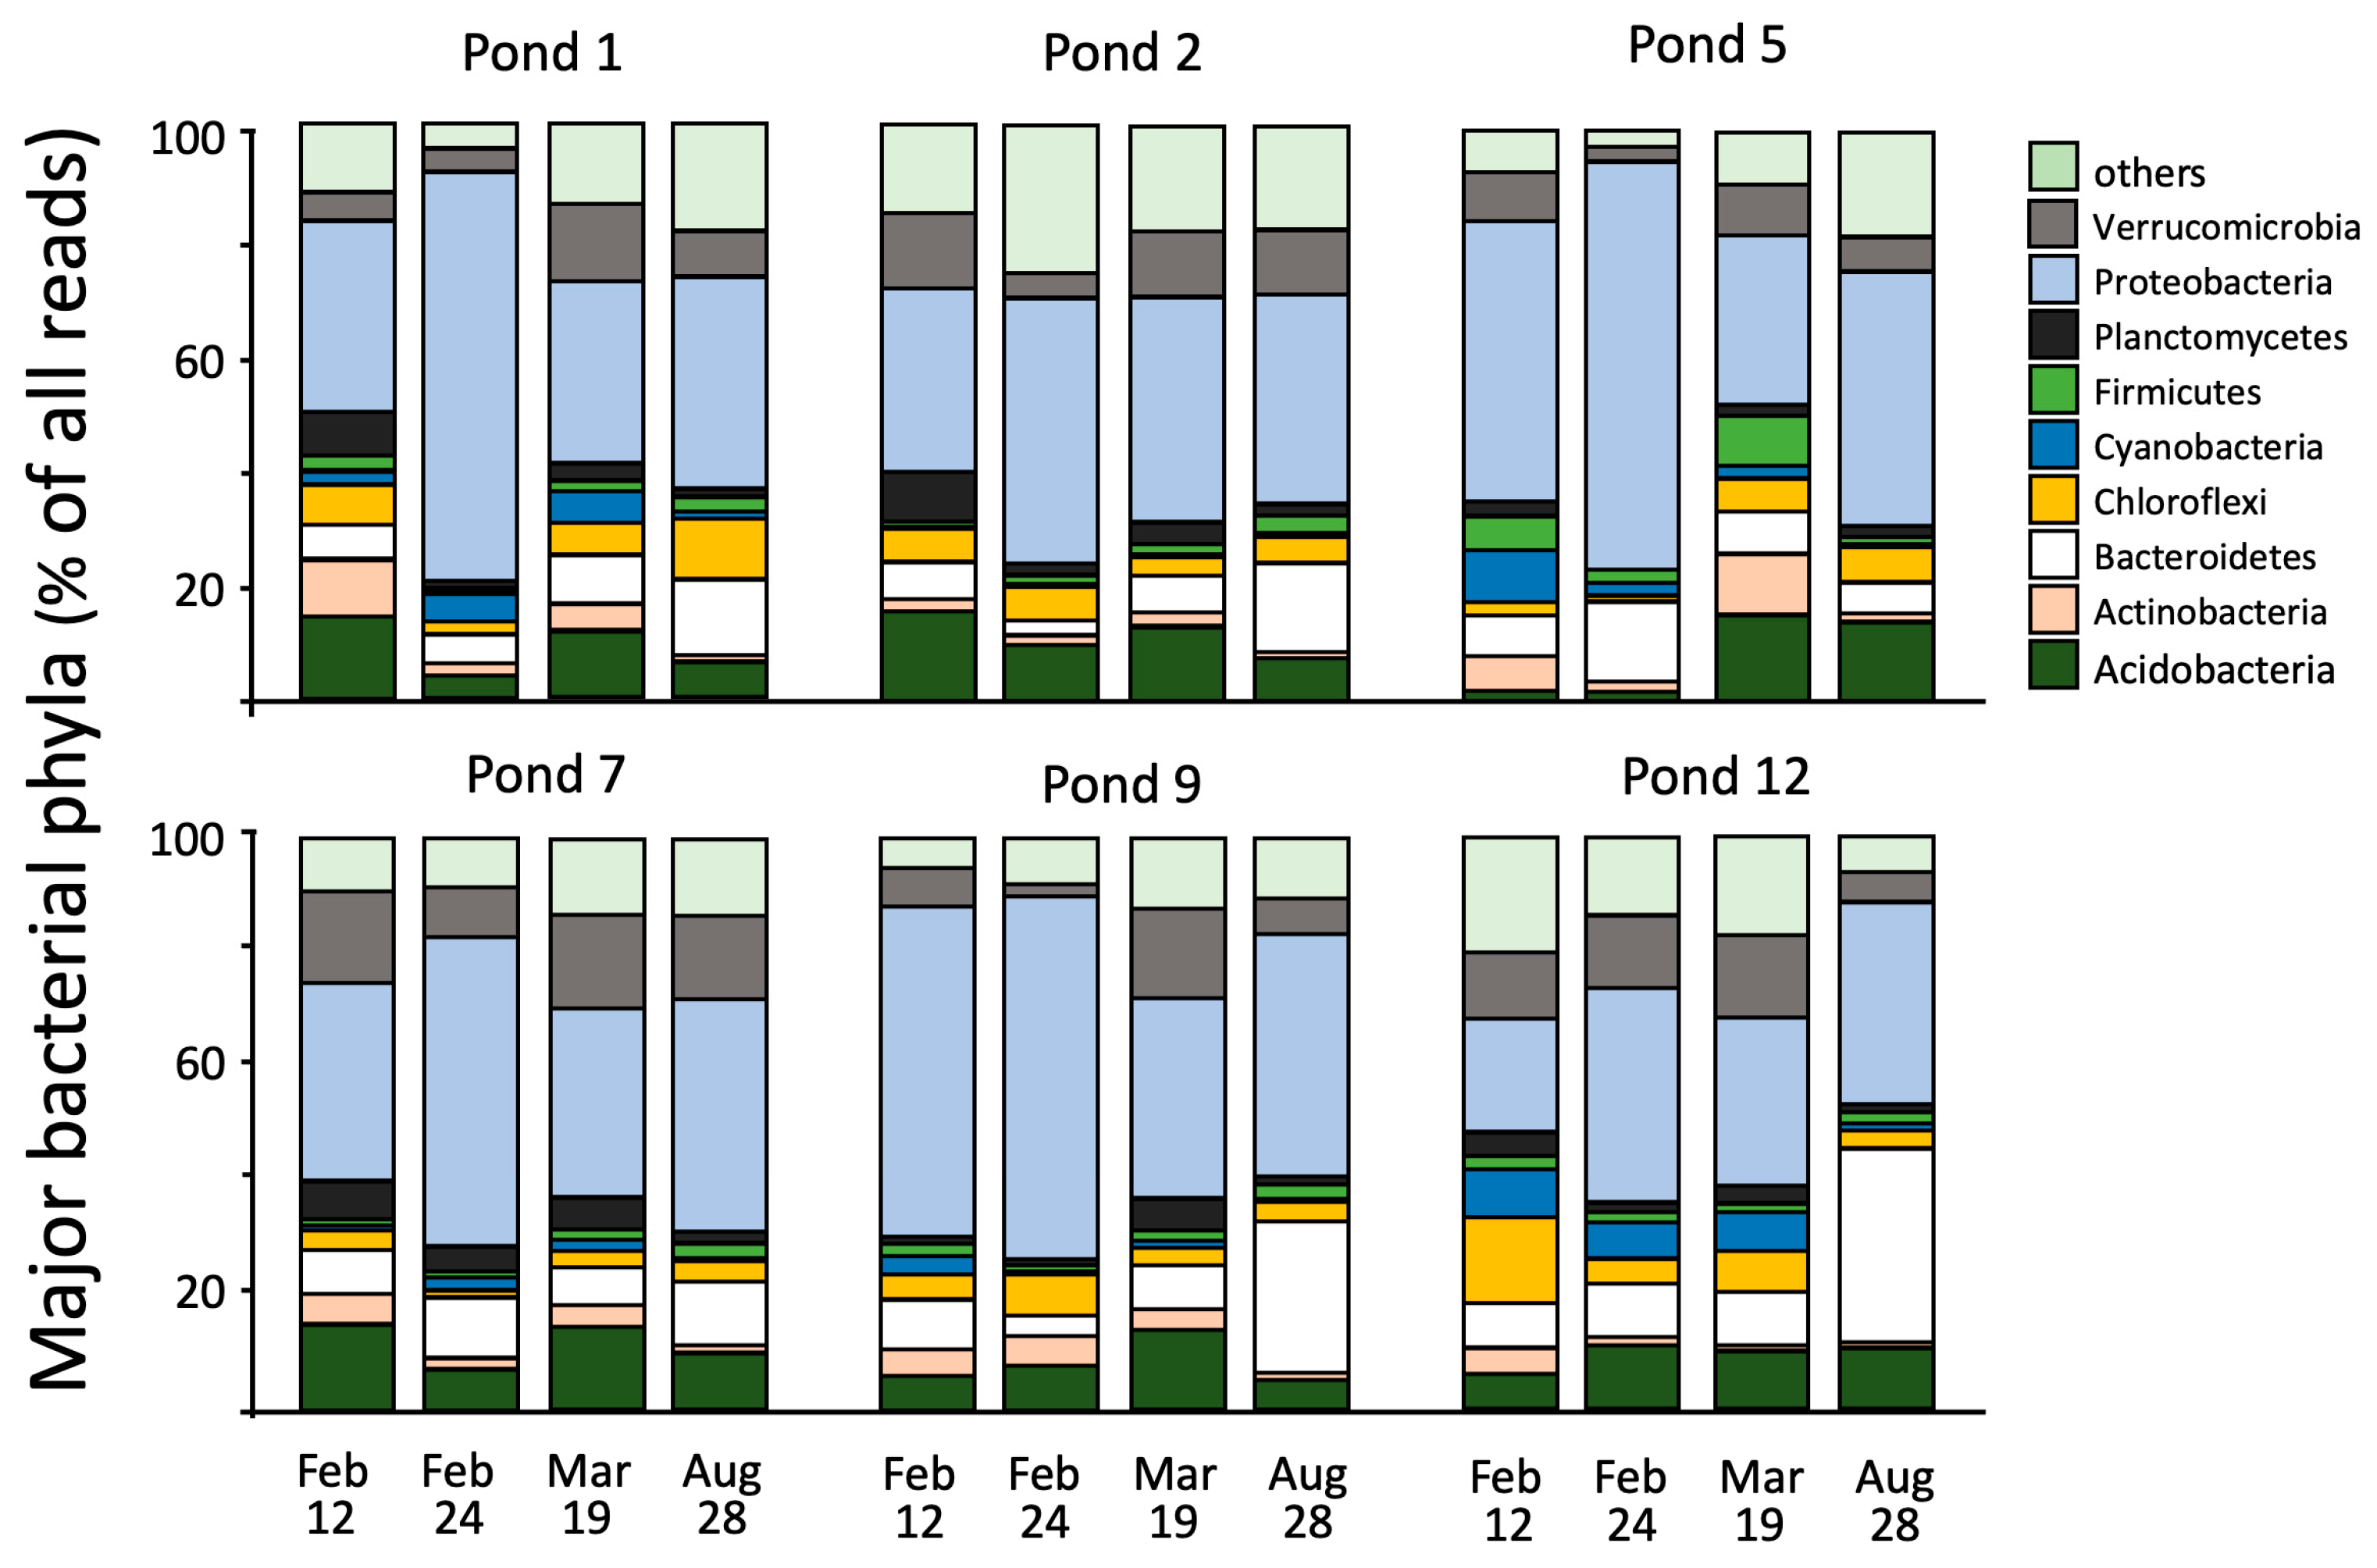
Microbiomes in composite water–sediment samples from ponds, similar to tank-water samples in the holding facilities, predominantly comprised reads representing Proteobacteria at all sampling times (12 February, 24 February, 19 March, and 28 August) (Figure S1). Their numbers remained relatively constant at around 30% of all reads, except on 24 February, the time of eggstrand release, when they surged up to 70% (Figure 2, Figure S1). Unlike tank-water samples, other phyla such as Acidobacteria, Actinobacteria, Bacteriodetes, Chloroflexi, Cyanobacteria, Firmicutes, Planctomycetes, Verrucomicrobia, and others were present in large numbers (ranging from 1% to 15%), with individual phyla peaking at specific sampling times (Figure 2). For instance, Firmicutes and Actinobacteria decreased in samples during the period of initial eggstrand release but recovered by March. While the abundance of Firmicutes remained unchanged in August (Figure S1), Actinobacteria numbers were at their lowest (about 1% of all reads) (Figure S2); however, Bacteriodetes populations generally increased over time, peaking on August 28 (Figure 2, Figure S1).
Reads in tank-water samples at holding facilities representing Actinobacteria (1.4 ± 1.1% of all reads) were assigned to three major families, namely Nocardiaceae, Microbacteriaceae, Mycobacteriaceae, as well as others (Figure 1). While variability was high between individual tanks, Nocardiaceae were generally the most prominent group in tank water from Rooms 1, 3, and 4 (54 to 75% of reads identifying Actinobacteria), followed by Microbacteriaceae (6 to 12%) and Mycobacteriaceae (1 to 3%). The same groups were present in the reconstituted reservoir water, in the NACQ, though at different prevalences (Nocardiaceae at 11%, Microbacteriaceae at 25%, and Mycobacteriaceae at 20%) (Figure 1). The microbiome of the used substrate (moss) was more diverse than those in the water samples, with Microbacteriaceae (up to 38%) dominating, and with smaller populations of Actinospicaceae (12%), Mycobacteriaceae (4%), Nocardiaceae (2%), Geodermatophilaceae (<1%), and Corynebacteriaceae (<0.1%) (Figure 1). Actinobacteria in the fresh substrate were entirely represented by Micrococcaceae (Figure 1). The remaining sequences represented a large variety of phyla at abundances generally below 1% of all reads.
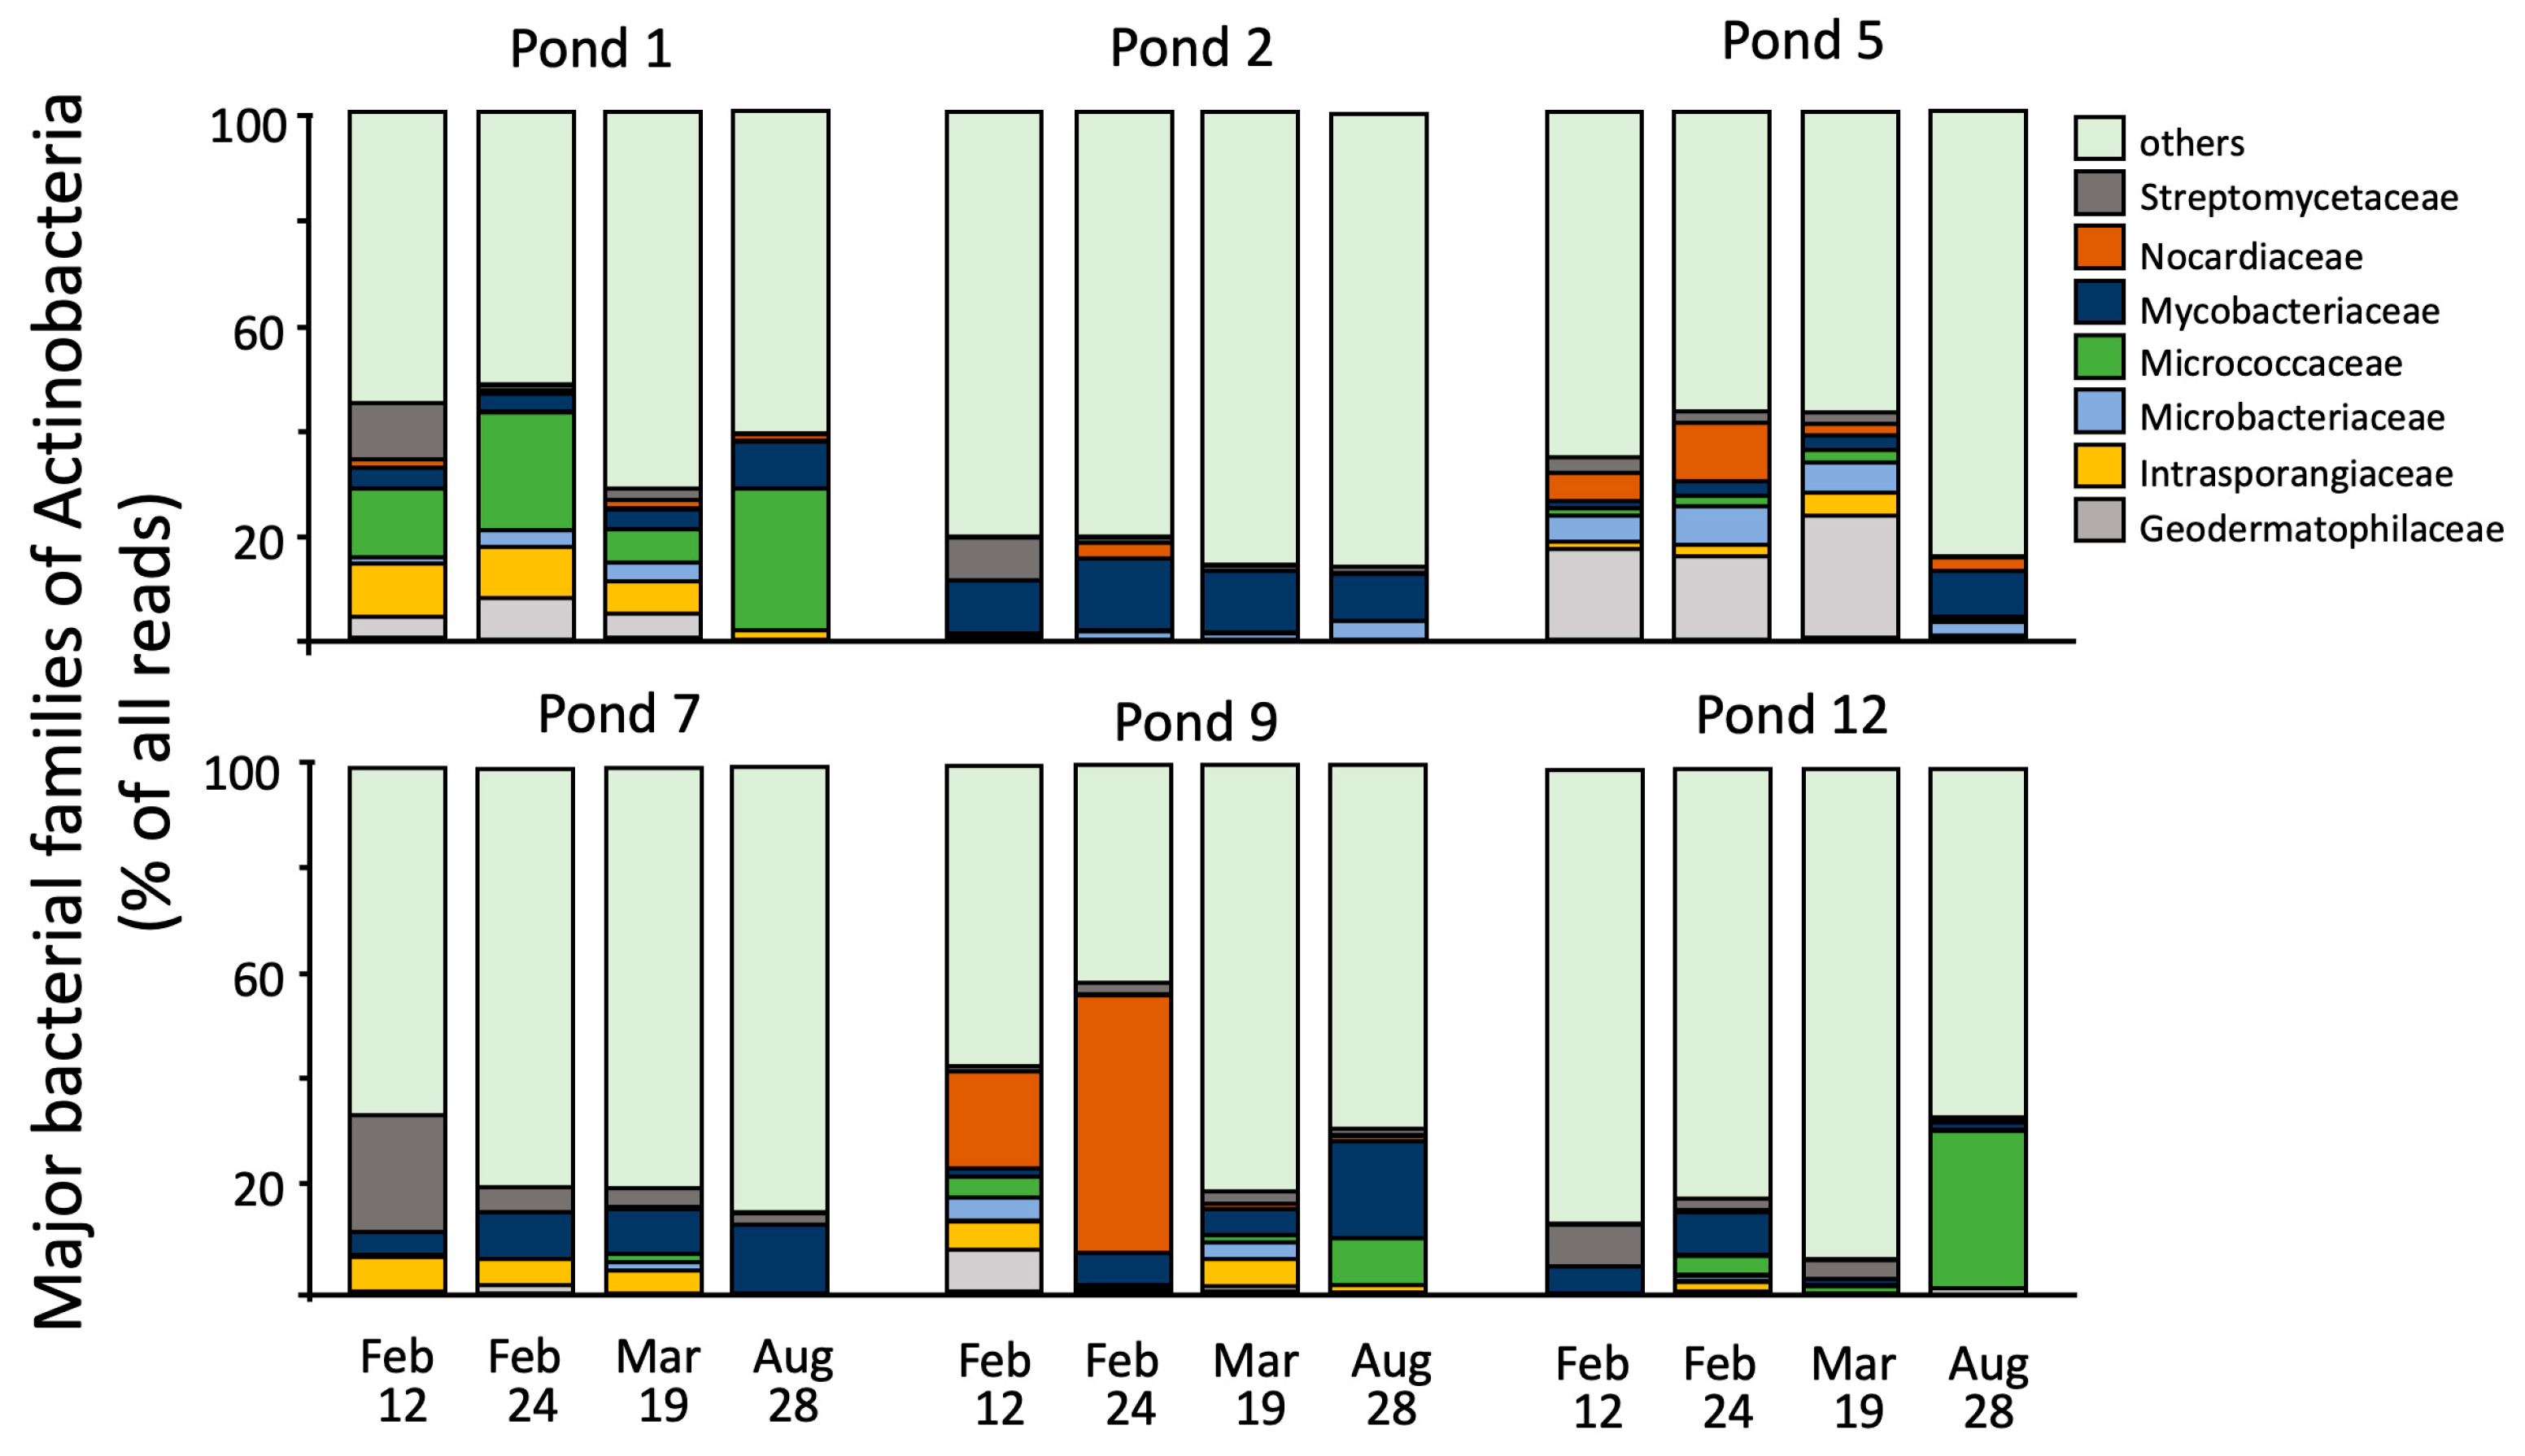
In the pond samples, the prevalence of reads representing Actinobacteria varied widely among ponds and over time. For example, in March, ponds P5 and P12 showed a range of <1 to 11% of all reads, while pond P1 had 10% in February and 1% in August (Figure S2). The most prominent families identified in all or most ponds were the Geodermatophilaceae, Intrasporangiaceae, Microbacteriaceae, Micrococcaceae, Mycobacteriaceae, Nocardiaceae, and Streptomycetaceae, but together they accounted for only about 50% or fewer of the Actinobacteria reads (Figure 3). Distribution and prevalence patterns of these families were pond specific, and similar in each pond for the three Spring samples, but these sometimes differed from the Fall samples. Mycobacteria were present in all pond samples at all times, with the highest values often occurring in August (e.g., P9: 2%, 6%, and 5% in Spring, and 19% in the Fall). Ponds P1, P5, and P7 showed similar patterns and values; however, P2 values were consistently high at about 10%, while P12 declined from about 5% to 2% (Figure 3 and Figure S2).
Comparative sequence analyses of Mycobacteriaceae revealed 23 sequences that were identical or similar to those of 16S rRNA gene fragments of the described Mycobacterium species (Figure 4). Eight of these sequences were only found in samples from holding facilities (i.e., water and substrate), while 12 sequences were unique to pond samples (Figure 4). The remaining three sequences were found in both samples from holding facilities and ponds (Figure 4). Identified species included both rapid- and slow-growing mycobacteria, most representing clinical isolates of the Mycobacterium chelonaeabscessus complex, Mycobacterium jacuzzi, Mycobacterium elephantis, Mycobacterium celeriflavum, Mycobacterium obuense, Mycobacterium goodie, or Mycobacterium marinum, Mycobacterium palustre, and Mycobacterium szulgai; however, environmental isolates such as Mycobacterium diernhoferi, Mycobacterium palauense, and Mycobacterium pyrenivorans were also identified (Figure 4). Reads seq516, seq607, and seq1980 that were found in both samples from holding facilities and ponds, though not in all samples and not at all times, represent M. palauense, M. marinum, and M. palustre, respectively (Supplementary Table S1). Individual sequences were often not present in all samples from the same location, changed in abundance over time, or were present in few samples/locations or even only in one sample (Supplementary Table S1).
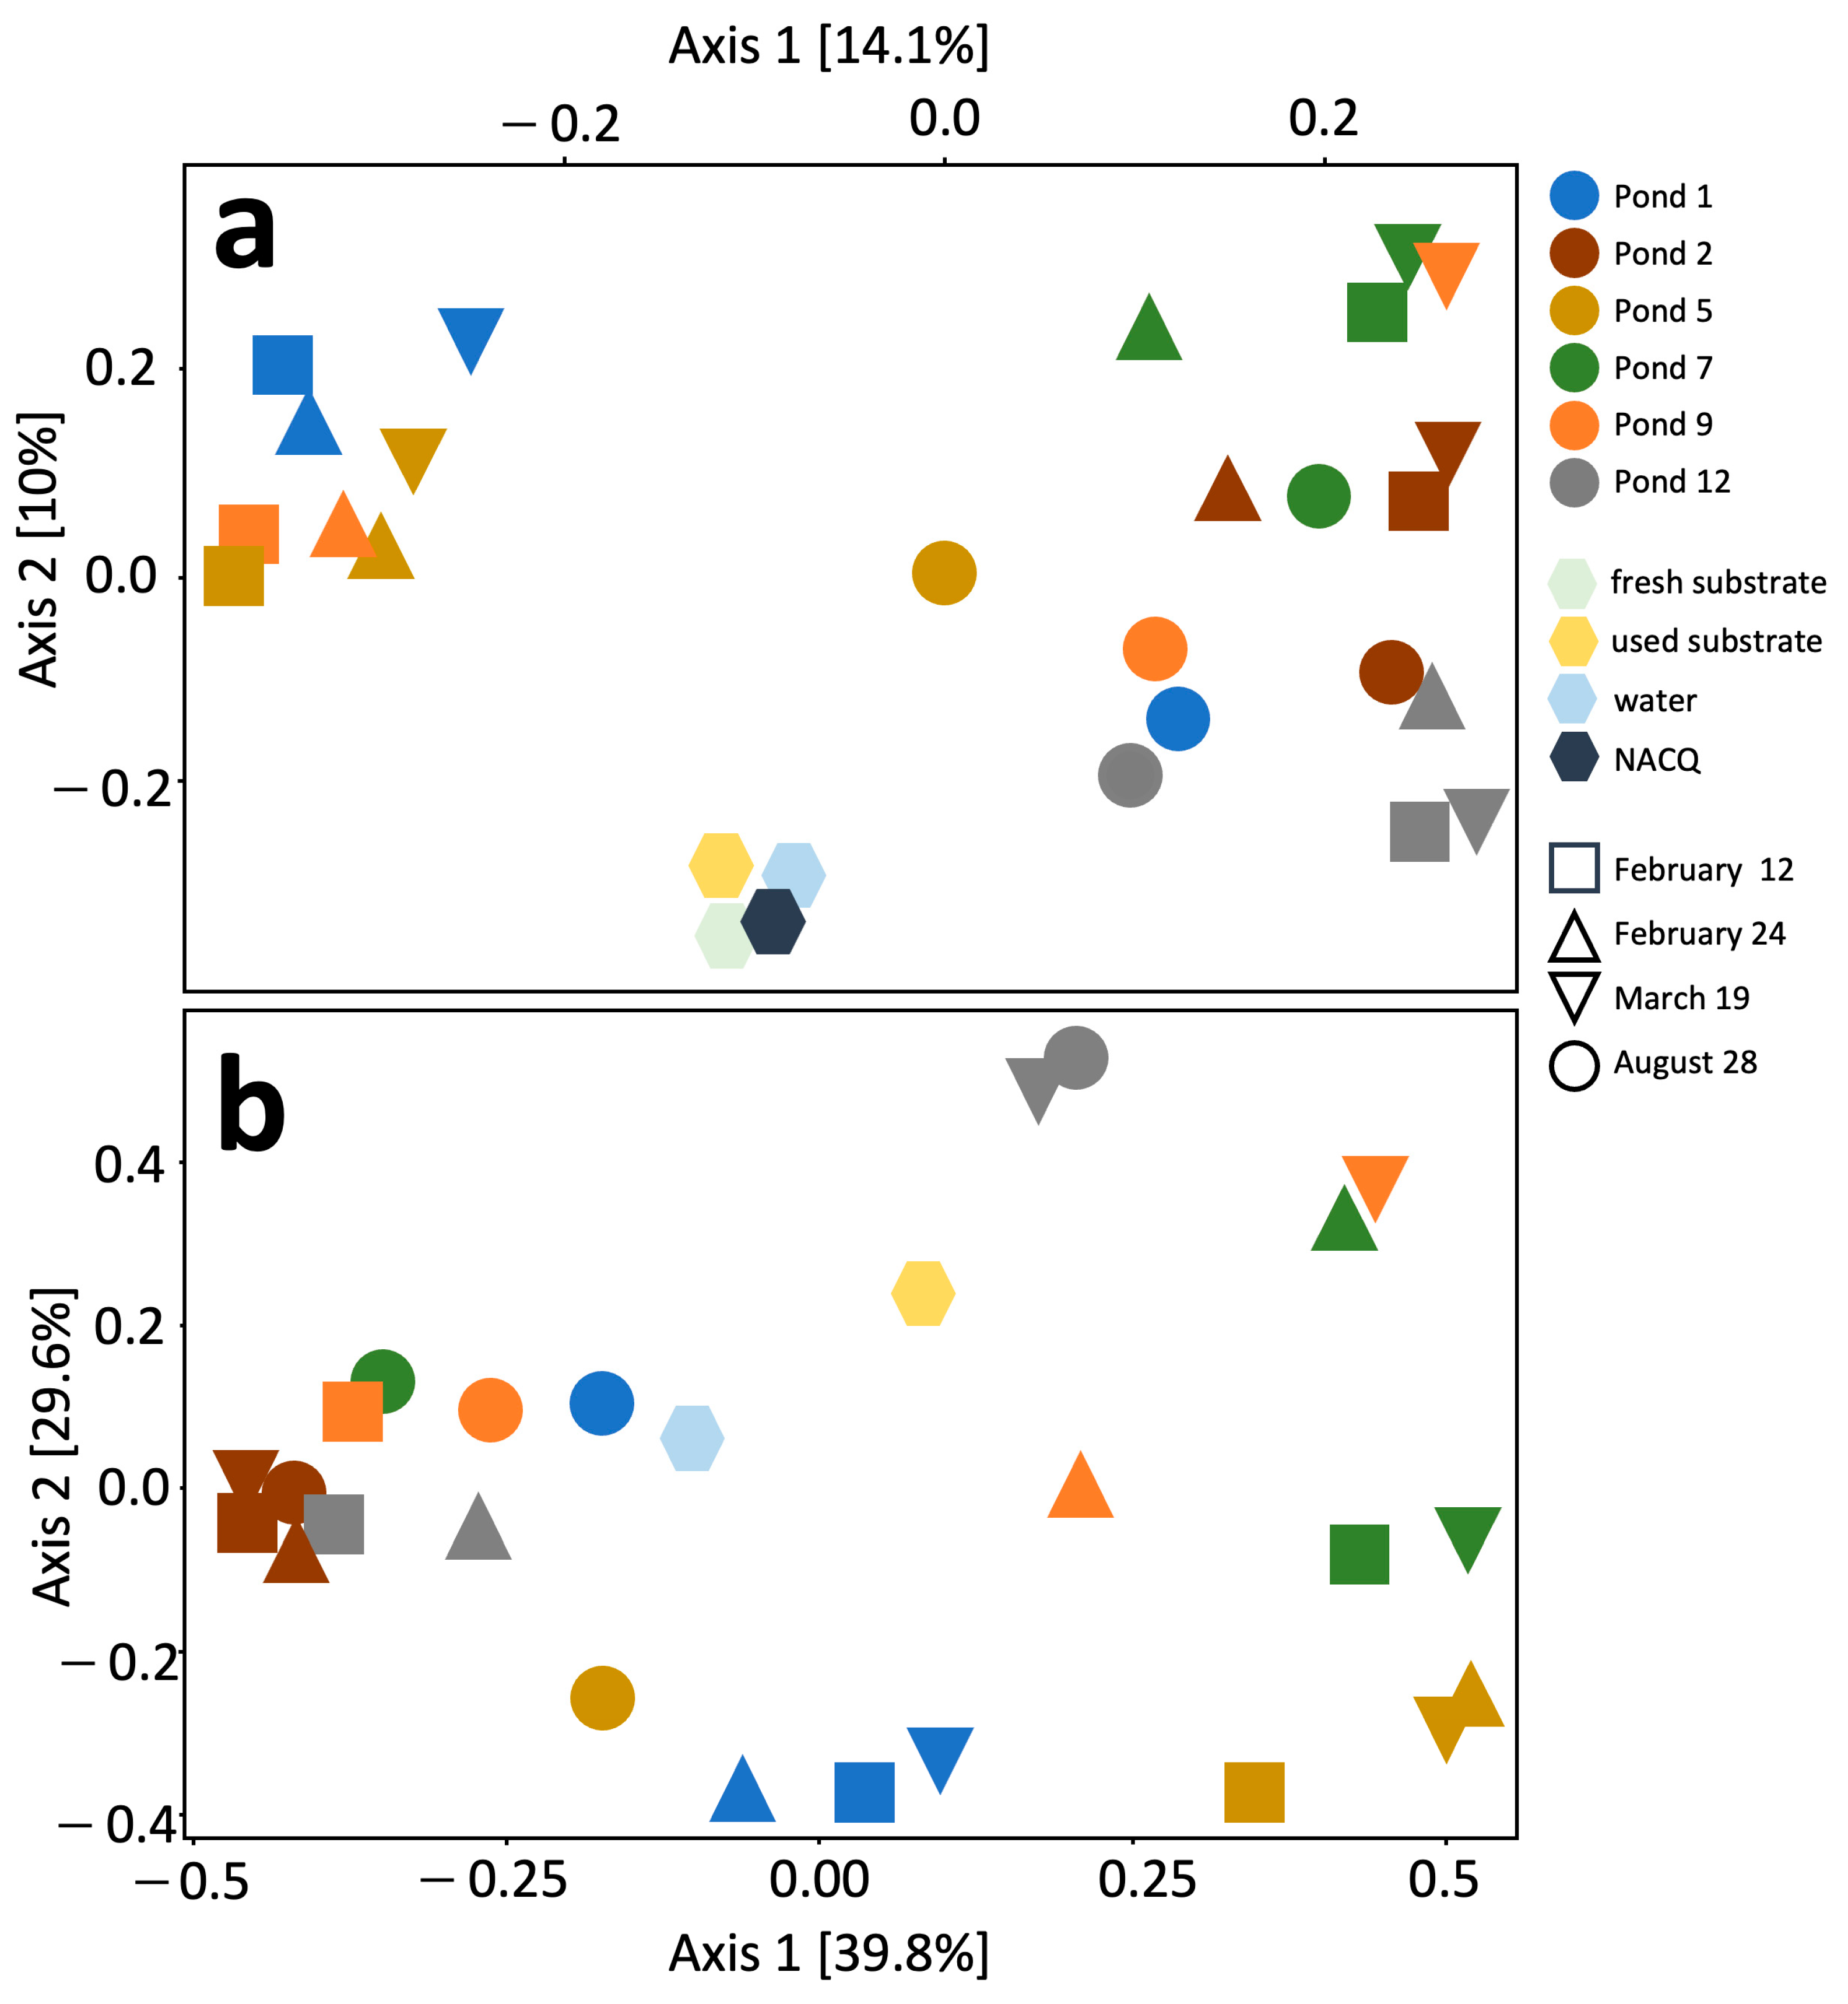
Principal Coordinate Analyses (PCoAs) at both the phylum level (Figure 5a) and the Actinobacteria level (Figure 5b) revealed that Spring samples from individual ponds generally clustered together. Fall samples of some ponds (P2, P7, P12) clustered with Spring samples, while those of others (P1, P5) were distinct from Spring samples. For pond 9, the February samples clustered together, whereas the March and August samples were distinct (Figure 5).

4. Discussion

Non-tuberculous mycobacteria have been found in various water sources (surface-, ground- and sea-water) [33], submerged biofilms [34], and artificial systems like water treatment plants and municipal water systems [33,35]. These bacteria are also present in terrestrial habitats such as soil, earthworm casts, peat, and wood [33,36,37]. Generally, their abundance is low, e.g., 102–105 colony-forming units (CFU) per liter of water [38], or 103 to 104 CFU per cm2 of biofilm [34]. Some mycobacterial species have been found to be opportunistic pathogens, but most mycobacteria are saprophytic and thus autochthonous members of terrestrial and aquatic microbial communities [39,40]. Illumina-based 16S rRNA V3 amplicon sequencing helped us to detect sequences of mycobacteria in pond-water samples [18], but at abundances too low for qPCR-based detection [41]. In contrast, tissue-lesion samples from Houston toads showed abundances that were two to three orders of magnitude higher [18], that could be quantified by qPCR [41]. Unlike environmental samples, clinical samples like tissue lesions provide nutrient-rich environments that potentially enrich opportunistic mycobacteria [14,16]. Thus, our current results confirm that mycobacteria are present in low abundance in environmental samples, i.e., tank water in holding facilities and composite water–sediment samples from ponds. This supports previous statements about the common occurrence of mycobacteria in aquatic and terrestrial ecosystems [40,42], including the biofilms of water distribution systems [43,44].
The abundance of Actinobacteria in tank water was low (about 1% of all reads), with that of mycobacteria being even lower though with high sample variability (about 0.1 to 0.01%). In pond samples, actinobacteria generally decreased over time with the lowest abundance being observed in the Fall (about 1% of all reads). The importance of mycobacteria within the actinobacteria increased over time with the highest abundance occurring in the Fall, however, without obvious changes in the overall values, i.e., percentage of all reads. Tank-water and pond-sediment–water samples differed in their abundance, distribution patterns, and seasonal stability of bacterial phyla, with higher diversity occurring in the pond samples. The pond samples, however, showed very similar patterns of the abundance, distribution, and stability of bacterial phyla to our previous study [18] and other sequencing-based studies of bacterial communities in ponds [45,46,47]. Depending upon the pond, changes in the abundance of phyla were noticed for the individual sampling times (e.g., the non-significant (p = 0.18) increases in Proteobacteria during the eggstrand release or of Bacteriodetes in the Fall sample). In general, however, the abundance, distribution, and stability of bacterial phyla or families within the actinobacteria before and after the eggstrand release were very similar among headstarted ponds and ponds that never received eggstrands. Thus, the introduction of eggstrands from tank water did not result in substantial changes to the microbiomes in the ponds. Although we did not collect environmental data, we can speculate that microbiome differences for some ponds in the Fall are more likely to be a function of seasonal changes such as higher water temperatures (ponds 2, 5, and 7) and/or a reduction in water quality/availability resulting in increased disturbance and fecal deposition by wildlife like feral hogs (ponds 1, 9, and 12). The ponds are generally quite small (>0.1 ha) and have limited macrophytes in most years, but macrophyte influences, especially in the daily cycle of nighttime hypoxic changes, may also be influencing these variations.
Many mycobacterial species identified in our study, both in tank and pond water, have been previously documented in pond water and sediments [18,39,40]. These include potential pathogens such as members of the M. chelonae–abscessus complex [48,49], M. pallens, M. fortuitum, M. marinum [14,50], M. avium [42], or M. fortuitum [51]. In our previous study, members of the M. chelonae–abscessus complex were the only mycobacteria detected in skin lesions of the Houston toad, often together with other bacteria like Pseudomonadaceae and Enterbacteriaceae, while other mycobacterial species were not detected [18]. Members of the M. chelonae–abscessus complex had also been detected in ponds 2, 10, and 12, with pond 12 exclusively harboring this complex [18]. Our current study also identified the M. chelonae–abscessus complex in pond 12, though it was not represented by the same sequence found in our previous study. This sequence was only detected once, i.e., in the first Spring sample from pond 12, and not in subsequent samples or other ponds (Supplementary Table S1). Sequences representing Mycobacterium species were detected in all tank and pond water in each sampling.
All other sequences representing mycobacteria in ponds show a large seasonal variation in their presence, absence or abundance, with many unique sequences for individual samples. Most sequences retrieved from tank water were not detected in pond water, and those three sequences that were detected were usually present only in individual ponds and specific samples from these ponds. Thus, the potential introduction of opportunistic pathogens of the genus Mycobacteria with tank water from holding facilities and eggstrands does not seem to result in the establishment of these bacteria in natal ponds.
The situation is very likely to be different among pathogens or diseases, where a key example would be Ranavirus. In Chinese Giant salamanders (Andrias davidianus), Ranavirus outbreaks are documented in captive colonies [52] and within wild populations [53] of this critically endangered salamander. Similarly, the European water frog (Pelophylax sp.) is considered to be an invasive species in some locations, where it is perceived as a vector for the spread of Ranavirus to native frogs [54]. In these studies the direct linkage of transmission from captive to wild, or among wild populations, is not confirmed but logically deduced.
Our findings support our previous study that suggested that even the reintroduction of diseased animals into their natural habitat does not add new mycobacteria or alter the diverse microbial community in these habitats [18]. Therefore, the headstarting of eggstrands from holding facilities appears to be a safe procedure for the conservation of endangered animals like the Houston toad, without the risk of Mycobacterial disease transmission to the natural environment. We believe that investigating and monitoring for potential disease transmission in conservation headstarting or reintroduction programs should occur and should be a normal part of the long-term monitoring projects in conservation projects.

Supplementary Materials

The following supporting information can be downloaded at: https://www.mdpi.com/article/10.3390/conservation5020025/s1, Figure S1: Prevalence of reads identifying Proteobacteria, Bacteriodetes, and Firmicutes in pond samples, Figure S2: Prevalence of reads identifying Actinobacteria in pond samples generally declined over time from approx. 10% to 1% of all reads (a), while reads identifying Mycobacteria within Actinobacteria generally increased from approx. <5% to up to 20% (b); Table S1: Abundance of reads identifying Mycobacteria species (in % of all Mycobacteriaceae) in different Houston-toad habitats (Houston Zoo: NACQ and tank water from Rm1, Rm3, and Rm4; and used substrate; Griffith League Ranch: ponds 1, 2, 5, 7, 9, and 12). Columns with increasing intensity of shades from light to dark identify sampling dates of 12 February, 24 February, 19 March, and 28 August.

Author Contributions

Conceptualization, A.V., D.H. and M.R.J.F.; methodology, S.V., T.G., A.V., D.H. and M.R.J.F.; software, S.V. and D.H.; validation, A.V., M.E.T., D.H. and M.R.J.F.; formal analysis, S.V. and D.H.; investigation, A.V., M.E.T., D.H. and M.R.J.F.; resources, M.E.T., D.H. and M.R.J.F.; data curation, S.V., T.G., A.V., D.H. and M.R.J.F.; writing—original draft preparation, A.V., D.H. and M.R.J.F.; writing—review and editing, A.V., M.E.T., D.H. and M.R.J.F.; visualization, S.V., D.H. and M.R.J.F.; supervision, M.E.T., D.H. and M.R.J.F.; project administration, D.H. and M.R.J.F.; funding acquisition, D.H. and M.R.J.F. All authors have read and agreed to the published version of the manuscript.

Funding

This research received no external funding.

Data Availability Statement

Data are available on request to MF (who will seek a free depository for easier access).

Acknowledgments

The authors are indebted to the Department of Biology and the Texas State University Graduate College for their financial support. The Alexander Stone Endowment for Genetics provided direct material support for this project. We worked in collaboration with the Capitol Area Council of the Boy Scouts of America, the Houston Zoo, Inc., Texas Parks and Wildlife Department (TPWD SPR-0102-191), and the United States Fish and Wildlife Service (TE-039544). Without the direct and ongoing efforts by the Houston Zoo, Inc., toad keepers, we could not have completed this study. We are indebted to the willingness and support that all of these groups provided to enable this assessment.

Conflicts of Interest

Author Maryanne E. Tocidlowski was employed by the not-for-profit company Houston Zoo, Inc. The remaining authors declare that the research was conducted in the absence of any commercial or financial relationships that could be construed as a potential conflict of interest.

References

  1. Blaustein, A.R.; Urbina, J.; Snyder, P.W.; Reynolds, E.; Dang, T.; Hoverman, J.T.; Han, B.; Olson, D.H.; Searle, C.; Hambalek, N.M. Effects of emerging infectious diseases on amphibians: A review of experimental studies. Diversity 2018, 10, 81. [Google Scholar] [CrossRef]
  2. Bucciarelli, G.M.; Blaustein, A.R.; Garcia, T.S.; Kats, L.B. Invasion complexities: The diverse impacts of nonnative species on amphibians. Copeia 2014, 4, 611–632. [Google Scholar] [CrossRef]
  3. Hermann, C.; Gilbreath, H. Revised recovery plan for the Houston toad (Anaxyrus [Bufo] houstonensis). In Species Profile for Houston Toad (Bufo houstonensis); U.S. Fish and Wildlife Service: Albuquerque, NM, USA, 2022; pp. 1–78. [Google Scholar]
  4. Tornabene, B.J.; Blaustein, A.R.; Briggs, C.J.; Calhoun, D.M.; Johnson, P.T.J.; McDevitt-Galles, T.; Rohr, J.R.; Hoverman, J.T. The influence of landscape and environmental factors on ranavirus epidemiology in a California amphibian assemblage. Freshw. Biol. 2018, 63, 639–651. [Google Scholar] [CrossRef]
  5. Klaus, J.M.; Noss, R.F. Specialist and generalist amphibians respond to wetland restoration treatments. J. Wildl. Manag. 2016, 80, 1106–1119. [Google Scholar] [CrossRef]
  6. Duarte, A.; Brown, D.J.; Forstner, M.R.J. Documenting extinction in real time: Decline of the Houston toad on a primary recovery site. J. Fish. Wildl. Manag. 2014, 5, 363–371. [Google Scholar] [CrossRef]
  7. Brannelly, L.A.; Sharma, P.; Wallace, D.K. Captive breeding in the endangered alpine tree frog, Litoria verreauxii alpina. Peerj 2023, 11, e15179. [Google Scholar] [CrossRef]
  8. Clulow, J.; Trudeau, V.L.; Kouba, A.J. Amphibian Declines in the Twenty-First Century: Why We Need Assisted Reproductive Technologies. Adv. Exp. Med. Biol. 2014, 753, 275–316. [Google Scholar] [CrossRef]
  9. Silla, A.J.; Byrne, P.G. The role of reproductive technologies in amphibian conservation breeding programs. Annu. Rev. Anim. Biosci. 2019, 7, 499–519. [Google Scholar] [CrossRef]
  10. Forstner, M.R.J.; Crump, P. Houston toad population supplementation in Texas, USA. In Global Re-Introduction Perspectives; Soorae, P.S., Ed.; IUCN/SSC Re-introduction Specialist Group & Abu Dhabi Environmental Agency: Gland, Switzerland, 2011; pp. 71–76. [Google Scholar]
  11. Fratzke, A.; Howard, L.L.; Tocidlowski, M.E.; Armien, A.; Oliveira, F.; Ritchie, B.; Berlin, E.; Snook, E. Chlamydia pneumoniae Polioencephalomyelitis and Ganglionitis in Captive Houston Toads (Anaxyrus houstonensis). Vet. Pathol. 2019, 56, 789–793. [Google Scholar] [CrossRef]
  12. Browne, R.K.; Luo, Q.; Wang, P.; Mansour, N.; Kaurova, S.A.; Gakhova, E.N.; Shishova, N.V.; Uteshev, V.K.; Kramarova, L.I.; Venu, G.; et al. Ecological civilisation and amphibian sustainability through reproduction biotechnologies, biobanking, and conservation breeding programs (RBCs). Animals 2024, 14, 1455. [Google Scholar] [CrossRef]
  13. Calatayud, N.E.; Jacobs, L.E.; Williams, C.L.; Steiner, C.C.; Shier, D.M. Recovering an endangered frog species through integrative reproductive technologies. Theriogenology 2022, 191, 141–152. [Google Scholar] [CrossRef] [PubMed]
  14. Ferreira, R.; Fonseca, L.D.; Afonso, A.M.; da Silva, M.G.; Saad, M.H.; Lilenbaum, W. A report of mycobacteriosis caused by Mycobacterium marinum in bullfrogs (Rana catesbeiana). Vet. J. 2006, 171, 177–180. [Google Scholar] [CrossRef] [PubMed]
  15. Martinho, F.; Heatley, J.J. Amphibian mycobacteriosis. Vet. Clin. North. Am. Exot. Anim. Pr. 2012, 15, 113–119. [Google Scholar] [CrossRef] [PubMed]
  16. Sanchez-Morgado, J.M.; Gallagher, A.; Johnson, L.K. Mycobacterium gordonae infection in a colony of African clawed frogs (Xenopus tropicalis). Lab. Anim. 2009, 43, 300–303. [Google Scholar] [CrossRef]
  17. Pessier, A.P. An overview of amphibian skin disease. Semin. Avian Exot. Pet. 2002, 11, 162–174. [Google Scholar] [CrossRef]
  18. Vemulapally, S.; Villamizar, A.; Guerra, T.; Tocidlowski, M.E.; Spradley, M.; Mays, S.; Forstner, M.R.J.; Hahn, D. Mycobacteria in skin lesions and the habitat of the endangered Houston Toad (Anaxyrus houstonensis). J. Wildl. Dis. 2021, 57, 503–514. [Google Scholar] [CrossRef]
  19. Samant, S.; Sha, Q.; Iyer, A.; Dhabekar, P.; Hahn, D. Quantification of Frankia in soils using SYBR Green based qPCR. Syst. Appl. Microbiol. 2012, 35, 191–197. [Google Scholar] [CrossRef]
  20. Caporaso, J.G.; Lauber, C.L.; Walters, W.A.; Berg-Lyons, D.; Huntley, J.; Fierer, N.; Owens, S.M.; Betley, J.; Fraser, L.; Bauer, M.; et al. Ultra-high-throughput microbial community analysis on the Illumina HiSeq and MiSeq platforms. Isme J. 2012, 6, 1621–1624. [Google Scholar] [CrossRef]
  21. Caporaso, J.G.; Lauber, C.L.; Walters, W.A.; Berg-Lyons, D.; Lozupone, C.A.; Turnbaugh, P.J.; Fierer, N.; Knight, R. Global patterns of 16S rRNA diversity at a depth of millions of sequences per sample. Proc. Natl. Acad. Sci. USA 2011, 108, 4516–4522. [Google Scholar] [CrossRef]
  22. Gilbert, J.A.; Jansson, J.K.; Knight, R. The Earth Microbiome project: Successes and aspirations. BMC Biol. 2014, 12, 69. [Google Scholar] [CrossRef]
  23. R Core Team. R: A Language and Environment for Statistical Computing; R Foundation for Statistical Computing: Vienna, Austria, 2022; p. 571. [Google Scholar]
  24. Callahan, B.J.; McMurdie, P.J.; Rosen, M.J.; Han, A.W.; Johnson, A.J.A.; Holmes, S.P. DADA2: High-resolution sample inference from Illumina amplicon data. Nat. Methods 2016, 13, 581–583. [Google Scholar] [CrossRef] [PubMed]
  25. Pearson, W.R.; Lipman, D.J. Improved tools for biological sequence comparison. Proc. Natl. Acad. Sci. USA 1988, 85, 2444–2448. [Google Scholar] [CrossRef]
  26. Saitou, N.; Nei, M. The Neighbor-joining Method: A new method for reconstructing phylogenetic trees. Mol. Biol. Evol. 1987, 4, 406–425. [Google Scholar]
  27. Stamatakis, A. RAxML-VI-HPC: Maximum likelihood-based phylogenetic analyses with thousands of taxa and mixed models. Bioinformatics 2006, 22, 2688–2690. [Google Scholar] [CrossRef]
  28. Hasegawa, M.; Kishino, H.; Yano, T. Dating of human-ape splitting by a molecular clock of mitochondrial DNA. J. Mol. Evol. 1985, 22, 160–174. [Google Scholar] [CrossRef]
  29. Tavaré, S. Some probabilistic and statistical problems in the analysis of DNA sequences. Am. Math. Soc. Lect. Math. Life Sci. 1986, 17, 57–86. [Google Scholar]
  30. Felsenstein, J. Confidence limits of phylogenies: An approach using the bootstrap. Evolution 1985, 39, 783–791. [Google Scholar] [CrossRef] [PubMed]
  31. McMurdie, P.J.; Holmes, S. Phyloseq: An R package for reproducible interactive analysis and graphics of microbiome census data. PLoS ONE 2013, 8, e61217. [Google Scholar] [CrossRef]
  32. Schulzerobbecke, R. Mycobacteria in the Environment. Immun. Infekt. 1993, 21, 126–131. [Google Scholar]
  33. Schulzerobbecke, R.; Janning, B.; Fischeder, R. Occurrence of Mycobacteria in biofilm samples. Tuber. Lung Dis. 1992, 73, 141–144. [Google Scholar] [CrossRef]
  34. Dovriki, E.; Gerogianni, I.; Petinaki, E.; Hadjichristodoulou, C.; Papaioannou, A.; Gourgoulianis, K. Isolation and identification of nontuberculous mycobacteria from hospitalized patients and drinking water samples-examination of their correlation by chemometrics. Environ. Monit. Assess. 2016, 188, 1–15. [Google Scholar] [CrossRef] [PubMed]
  35. Modra, H.; Bartos, M.; Hribova, P.; Ulmann, V.; Hubelova, D.; Konecny, O.; Gersl, M.; Kudelka, J.; Voros, D.; Pavlik, I. Detection of mycobacteria in the environment of the Moravian Karst (Bull Rock Cave and the relevant water catchment area): The impact of water sediment, earthworm castings and bat guano. Vet. Med Czech 2017, 62, 153–168. [Google Scholar] [CrossRef]
  36. Peeters, C.; Depoorter, E.; Praet, J.; Vandamme, P. Extensive cultivation of soil and water samples yields various pathogens in patients with cystic fibrosis but not Burkholderia multivorans. J. Cyst. Fibros. 2016, 15, 769–775. [Google Scholar] [CrossRef]
  37. Stamatakis, A. RAxML version 8: A tool for phylogenetic analysis and post-analysis of large phylogenies. Bioinformatics 2014, 30, 1312–1313. [Google Scholar] [CrossRef]
  38. Fischeder, R.; Schulzerobbecke, R.; Weber, A. Occurrence of Mycobacteria in drinking-water samples. Zbl Hyg. Umweltmed. 1991, 192, 154–158. [Google Scholar]
  39. Hruska, K.; Kaevska, M. Mycobacteria in water, soil, plants and air: A review. Vet. Med. Czech 2012, 57, 623–679. [Google Scholar] [CrossRef]
  40. Roguet, A.; Therial, C.; Saad, M.; Boudahmane, L.; Moulin, L.; Lucas, F.S. High mycobacterial diversity in recreational lakes. Antonie Leeuwenhoek 2016, 109, 619–631. [Google Scholar] [CrossRef] [PubMed]
  41. Villamizar, A.; Vemulapally, S.; Guerra, T.; Tocidlowski, M.E.; Forstner, M.R.J.; Hahn, D. Quantification of members of the Mycobacterium chelonae-abscessus complex in lesions of the endangered Houston toad (Anaxyrus houstonensis). Syst. Appl. Microbiol. 2022, 45, 126342. [Google Scholar] [CrossRef] [PubMed]
  42. Nishiuchi, Y.; Iwamoto, T.; Maruyama, F. Infection sources of a common non-tuberculous mycobacterial pathogen, Mycobacterium avium complex. Front Med. (Lausanne) 2017, 4, 27. [Google Scholar] [CrossRef]
  43. Feazel, L.M.; Baumgartner, L.K.; Peterson, K.L.; Frank, D.N.; Harris, J.K.; Pace, N.R. Opportunistic pathogens enriched in showerhead biofilms. Proc. Natl. Acad. Sci. USA 2009, 106, 16393–16399. [Google Scholar] [CrossRef]
  44. Gomez-Smith, C.K.; LaPara, T.M.; Hozalski, R.M. Sulfate reducing bacteria and Mycobacteria dominate the biofilm communities in a chloraminated drinking water distribution system. Environ. Sci. Technol. 2015, 49, 8432–8440. [Google Scholar] [CrossRef] [PubMed]
  45. Fan, L.; Hu, G.; Qiu, L.; Meng, S.; Wu, W.; Zheng, Y.; Song, C.; Li, D.; Chen, J. Variations in bacterioplankton communities in aquaculture ponds and the influencing factors during the peak period of culture. Environ. Pollut. 2020, 258, 113656. [Google Scholar] [CrossRef] [PubMed]
  46. Jeong, C.Y.; Ham, J.H. Comparative analysis of the microbial community in the sediments of two constructed wetlands differentially influenced by the concentrated poultry feeding operations. J. Soils Sediments 2017, 17, 557–566. [Google Scholar] [CrossRef]
  47. Mania, I.; Gorra, R.; Colombo, N.; Freppaz, M.; Martin, M.; Anesio, A.M. Prokaryotic diversity and distribution in different habitats of an alpine rock glacier-pond system. Microb. Ecol. 2019, 78, 70–84. [Google Scholar] [CrossRef]
  48. Barrows, M.; Koeppel, K.; Michel, A.; Mitchell, E. Mycobacterial arthritis and synovitis in Painted reed frogs (Hyperolius marmoratus). J. Comp. Pathol. 2017, 156, 275–280. [Google Scholar] [CrossRef] [PubMed]
  49. Green, S.L.; Lifland, B.D.; Bouley, D.M.; Brown, B.A.; Wallace, R.J.; Ferrell, J.E. Disease attributed to Mycobacterium chelonae in South African clawed frogs (Xenopus laevis). Comp. Med. 2000, 50, 675–679. [Google Scholar]
  50. Haridy, M.; Tachikawal, Y.; Yoshida, S.; Tsuyuguchi, K.; Tomita, M.; Maeda, S.; Wada, T.; Ibi, K.; Sakai, H.; Yanai, T. Mycobacterium marinum infection in Japanese forest green tree frogs (Rhacophorus arboreus). J. Comp. Pathol. 2014, 151, 277–289. [Google Scholar] [CrossRef]
  51. Gcebe, N.; Michel, A.L.; Hlokwe, T.M. Non-tuberculous Mycobacterium species causing mycobacteriosis in farmed aquatic animals of South Africa. Bmc Microbiol. 2018, 18, 1–11. [Google Scholar] [CrossRef]
  52. Dong, W.; Zhang, X.; Yang, C.; An, J.; Qin, J.; Song, F.; Zeng, W. Iridovirus Infection in Chinese Giant Salamanders, China, 2010. Emerg. Infect. Dis. 2011, 17, 2388–2389. [Google Scholar] [CrossRef]
  53. Chen, Z.; Gui, J.; Gao, X.; Pei, C.; Hong, Y.; Zhang, Q. Genome architecture changes and major gene variations of Andrias davidianus ranavirus (ADRV). Vet Res. 2013, 44, 101. [Google Scholar] [CrossRef]
  54. Lisachova, L.S.; Lisachov, A.P.; Ermakov, O.A.; Svinin, A.O.; Chernigova, P.I.; Lyapkov, S.M.; Zamaletdinov, R.I.; Pavlov, A.V.; Zaks, S.S.; Fayzulin, A.I.; et al. Continent-Wide Distribution of CMTV-Like Ranavirus, from the Urals to the Atlantic Ocean. Ecohealth, 2025; 1–12, Epub ahead of print. [Google Scholar] [CrossRef] [PubMed]
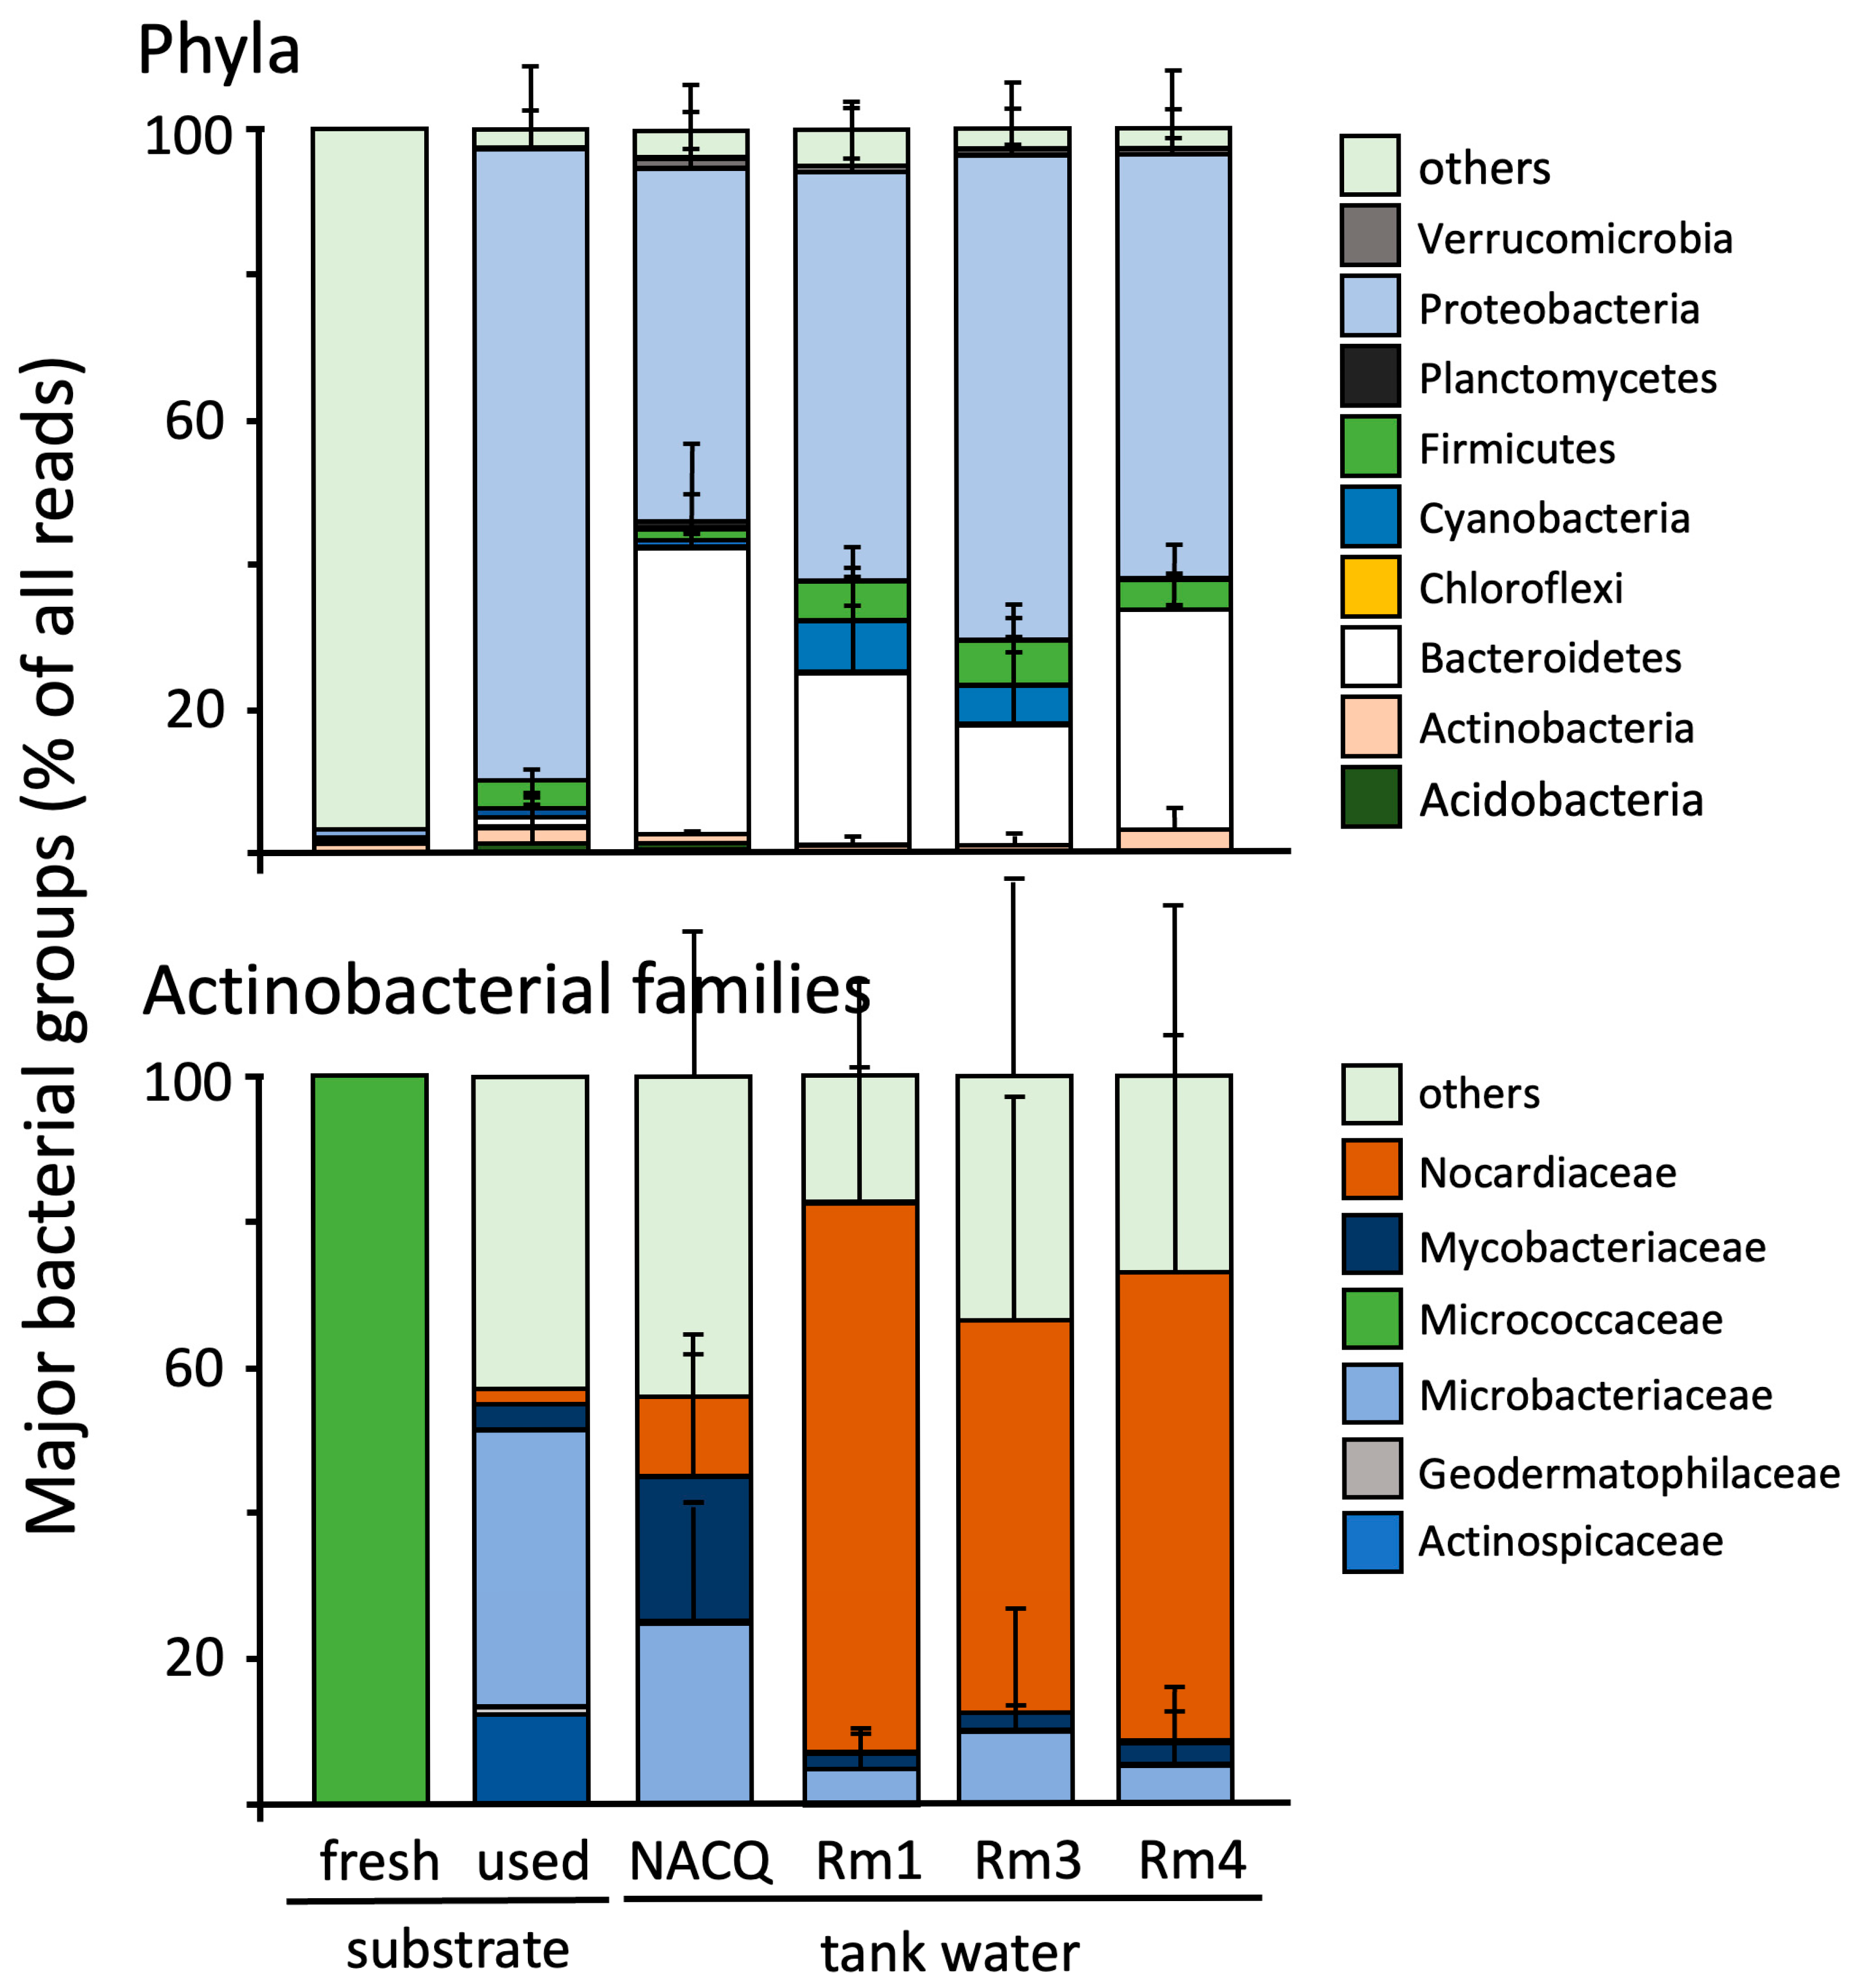
Figure 1. Assignment of Illumina reads to major bacterial phyla, and to major families within the phylum Actinobacteria for husbandry tanks of Houston toad at the Houston Zoo.
Conservation 05 00025 g001
Figure 2. Reads were generated from 16S rRNA gene amplicons containing sequences identifying major phyla in composite water–sediment samples from ponds at Griffith League Ranch (GLR), Bastrop, Texas. Reads were generated following the instructions from the Earth Microbiome Project [20] and analyzed on the Illumina MiSeq v3 (Illumina, Inc., San Diego, CA, USA). Raw reads were characterized and the sequences identified using the Dada2 R package (version 1.8) [24] and a Dada2 formatted reference sequence database.
Conservation 05 00025 g002
Figure 3. Sequences identified within the family Mycobacteriaceae that were recovered from pond water–sediment samples from the Griffith League Ranch (GLR), Bastrop, Texas. Reads were generated following the instructions from the Earth Microbiome Project [20] and analyzed on the Illumina MiSeq v3 (Illumina, Inc., San Diego, CA, USA). Raw reads were characterized and the sequences identified using the Dada2 R package (version 1.8) [24] and a Dada2 formatted reference sequence database.
Conservation 05 00025 g003
Figure 4. Phylogram of the 16S rRNA gene fragment relationships for reads identified as mycobacteria. The analytical matrix included alignment to representative sequences from confirmed strains using the Geneious alignment tool in Geneious 11.1.5 (Biomatters Ltd., Auckland, New Zealand). Neighbor joining (NJ) and maximum likelihood (ML) analyses were conducted using the tools included within Geneious 11.1.5. Bootstrap values from a NJ bootstrap analysis (10,000 replicates), using the HKY85 correction, and ML bootstrap (10,000 replicates) values were noted for clades with greater than 50% bootstrap support. All results were plotted on the NJ bootstrap topology. Highlighted reads indicate those only found in holding facilities (blue), only found in ponds (yellow), or found in both (green).
Conservation 05 00025 g004
Figure 5. Principal Coordinate Analysis (PCoA) performed with relative abundances of phyla (a) and Actinobacteria families (b).
Conservation 05 00025 g005
Disclaimer/Publisher’s Note: The statements, opinions and data contained in all publications are solely those of the individual author(s) and contributor(s) and not of MDPI and/or the editor(s). MDPI and/or the editor(s) disclaim responsibility for any injury to people or property resulting from any ideas, methods, instructions or products referred to in the content.