Article

Implementation and Costs of an Agroforestry System in a Degraded Area of the Brazilian Semi-Arid Region

by
Israel Pereira de Quadro
1,
Antônio Gilvan da Cruz de Souza
1,
Danilo Batista Nogueira
2,
Isac Gabriel Abrahão Bomfim
1 and
Aelton Biasi Giroldo
1,*
1
Instituto Federal de Educação, Ciência e Tecnologia do Ceará—Campus Crateús, Crateús 63708-260, Brazil
2
Instituto Federal de Educação, Ciência e Tecnologia do Ceará—Campus Umirim, Umirim 62660-000, Brazil
*
Author to whom correspondence should be addressed.
Conservation 2025, 5(2), 20; https://doi.org/10.3390/conservation5020020
Submission received: 5 March 2025 / Revised: 24 April 2025 / Accepted: 26 April 2025 / Published: 29 April 2025

Abstract

:
Agroforestry systems (ASs) are increasingly recognized as effective strategies for ecological restoration and sustainable land use in semi-arid regions. This study aimed to evaluate the implementation and early outcomes of an AS established in a degraded urban area in the Brazilian semi-arid region. Specifically, we analyzed the system’s establishment process, estimated its costs, assessed structural development over time, and compared species performance and carbon accumulation across different biodiversity arrangements. After three years, the system accumulated 17.69 Mg ha−1 of carbon and demonstrated significant basal area growth, particularly among fast-growing species such as Ceiba glaziovii, Gliricidia sepium, and Moringa oleifera. These species enhanced overall system productivity and likely contributed to increases in soil organic matter, facilitating the establishment of more demanding, slow-growing species. Cost analysis indicated a total implementation and maintenance estimate of BRL 57,468.79 ha−1 (USD 11,096.29) over three years, with irrigation and maintenance accounting for 44.39%, labor and site preparation 31.59%, and seedling production 24.02%. Although the system proved viable under institutional support, its replicability for smallholders remains dependent on reliable water access or implementation aligned with the rainy season. The use of nursery seedlings enhanced seedling survival and system feasibility. The broader adoption of agroforestry in semi-arid regions will require supportive public policies and technical assistance. Strengthening government programs such as PNAE and PRONAF is essential, as these initiatives can promote system adoption by facilitating access to credit while also reducing costs, particularly when short-cycle crops grown within the system are sold to local schools. It is important to note that agroforestry costs vary depending on the intended objectives, species diversity, and arrangement design. Therefore, technical assistance is critical to guiding smallholders in selecting and implementing context-appropriate systems. Our findings reinforce the potential of agroforestry systems to promote carbon sequestration, restore degraded lands, and support food security and sustainable development in climate-vulnerable regions.

Graphical Abstract

1. Introduction

The Brazilian semi-arid region suffers from water scarcity, a negative water balance, intense solar radiation, and a well-defined rainy season, often coupled with saline soils and water. Local farming practices contribute further to desertification, as farmers usually have limited access to technology. This region is considered the driest and most populated semi-arid zone on the planet. It features a unique biome known as the Caatinga, which is also the most biodiverse among the world’s dry biomes [1]. The Caatinga is characterized by high spatial and temporal variability in precipitation, averaging around 800 mm per year and an aridity index below 0.50, making it highly vulnerable to global climate change [2,3]. This biome has also suffered from unsustainable exploitation. Although the Caatinga accounts for approximately 32% of the total area of Seasonal Deciduous Tropical Forests (SDTF) worldwide, only 7.96% is legally protected. Among these protected areas, less than 20% are under strict conservation (National Parks and National Heritage Private Reserves), while more than 80% fall within Environmental Protection Areas that allow some degree of use [4,5]. In general, the remaining Caatinga landscape is vulnerable. Chronic anthropic disturbances threaten its biodiversity and natural resources, gradually eroding vital ecosystem services in ways that may be less evident than outright habitat destruction [6,7]. With only a small portion under protection and widespread persistent disturbances, conserving natural resources increasingly depends on the management and land-use practices outside protected areas, requiring a balance between multiple uses and conservation [6,8,9]. Meanwhile, land management in Brazil is largely based on monocultures, occupying around 80% of the nation’s arable lands and contributing significantly to environmental degradation [10,11].
In the semi-arid region, land use is predominantly carried out by family-based smallholders who rely on forest resources for both subsistence and income. Seeking swift economic returns, producers often adopt low-cost management techniques, commonly slash-and-burn for pasture, charcoal production, or establishing monocultures [12,13]. This slash-and-burn system, known locally as broca, involves cutting and burning vegetation to fertilize the soil with the ashes. Many traditional farmers in the area view these practices as their only viable options, typically growing one or two crops (mainly beans and corn). However, such practices degrade the soil, hinder medium- to long-term regeneration, reduce biodiversity, deplete soil fertility, and diminish groundwater recharge [14,15,16,17]. Therefore, there is a need for alternative systems that mitigate anthropogenic impacts while reconciling conservation with economic and social outcomes, such as agroforestry systems.
Agroforestry systems (ASs) present an alternative to traditional practices by integrating ecological concepts that preserve ecological interaction and progressively enhance ecosystem services over time [18,19]. Examples of these services include increased groundwater recharge, improved ecological relationships (e.g., pollination, seed dispersal, facilitation, and natural pest control), thereby reducing the need for agricultural chemicals and fertilizers, which represent a significant portion of agricultural costs [20,21,22,23]. Under ecological management, natural nutrient cycling and water percolation in the soil are promoted, dampening the effects of intense rains in the semi-arid region and reducing dependence on external inputs [23,24,25,26,27]. These systems also support forage production, vital for feeding livestock during critical periods of the year, and can be employed to restore degraded areas by improving soil conditions, maximizing positive ecological interactions, and encouraging natural succession [28,29]. In situations where barriers to succession exist, natural regeneration can be optimized by planting nurse species, such as nitrogen fixers or those reducing light intensity and water loss [30,31]. Additionally, agroforestry systems sequester and store carbon both above and below ground, exceeding typical carbon storage levels found in the dominant monocultures of the Brazilian semi-arid region [32,33].
When implemented in urban settings, agroforestry systems provide aesthetic enhancements and vital ecosystem services. In areas adjacent to watercourses, they improve ecosystems by producing biomass that captures CO2, retaining water in the soil, mitigating runoff and erosion, and reducing sedimentation in water bodies. These systems may also lessen societal noise, help restore biodiversity by reinforcing ecological connectivity and multifunctionality in degraded landscapes, support psychological well-being through contact with nature, and offer venues for physical activities, thus positively influencing the physical and mental health of local communities [34,35]. Additionally, they promote awareness of Caatinga conservation and its associated benefits, fostering socio-environmental engagement and environmental education [11,36,37].
Thus, the objectives of this study were to (i) analyze the implementation of an agroforestry system in a degraded urban area; (ii) estimate its establishment costs, under the hypothesis that early-stage implementation costs would be primarily driven by nursery production, harrowed preparation, and irrigation infrastructure [38,39,40]; (iii) assess its development over time; (iv) examine differences in growth and carbon stock among the introduced species; and (v) compare carbon sequestration across the distinct biodiversity arrangements. Based on the ecological traits of the selected species and their arrangement within the agroforestry system, we hypothesized that (1) species with rapid growth and nitrogen-fixing capacity would contribute disproportionately to aboveground biomass and carbon accumulation in the early stages of system development [41]; (2) biodiversity arrangements with greater functional complementarity would exhibit higher structural development and carbon accumulation than less diverse configurations [42,43,44].

2. Materials and Methods

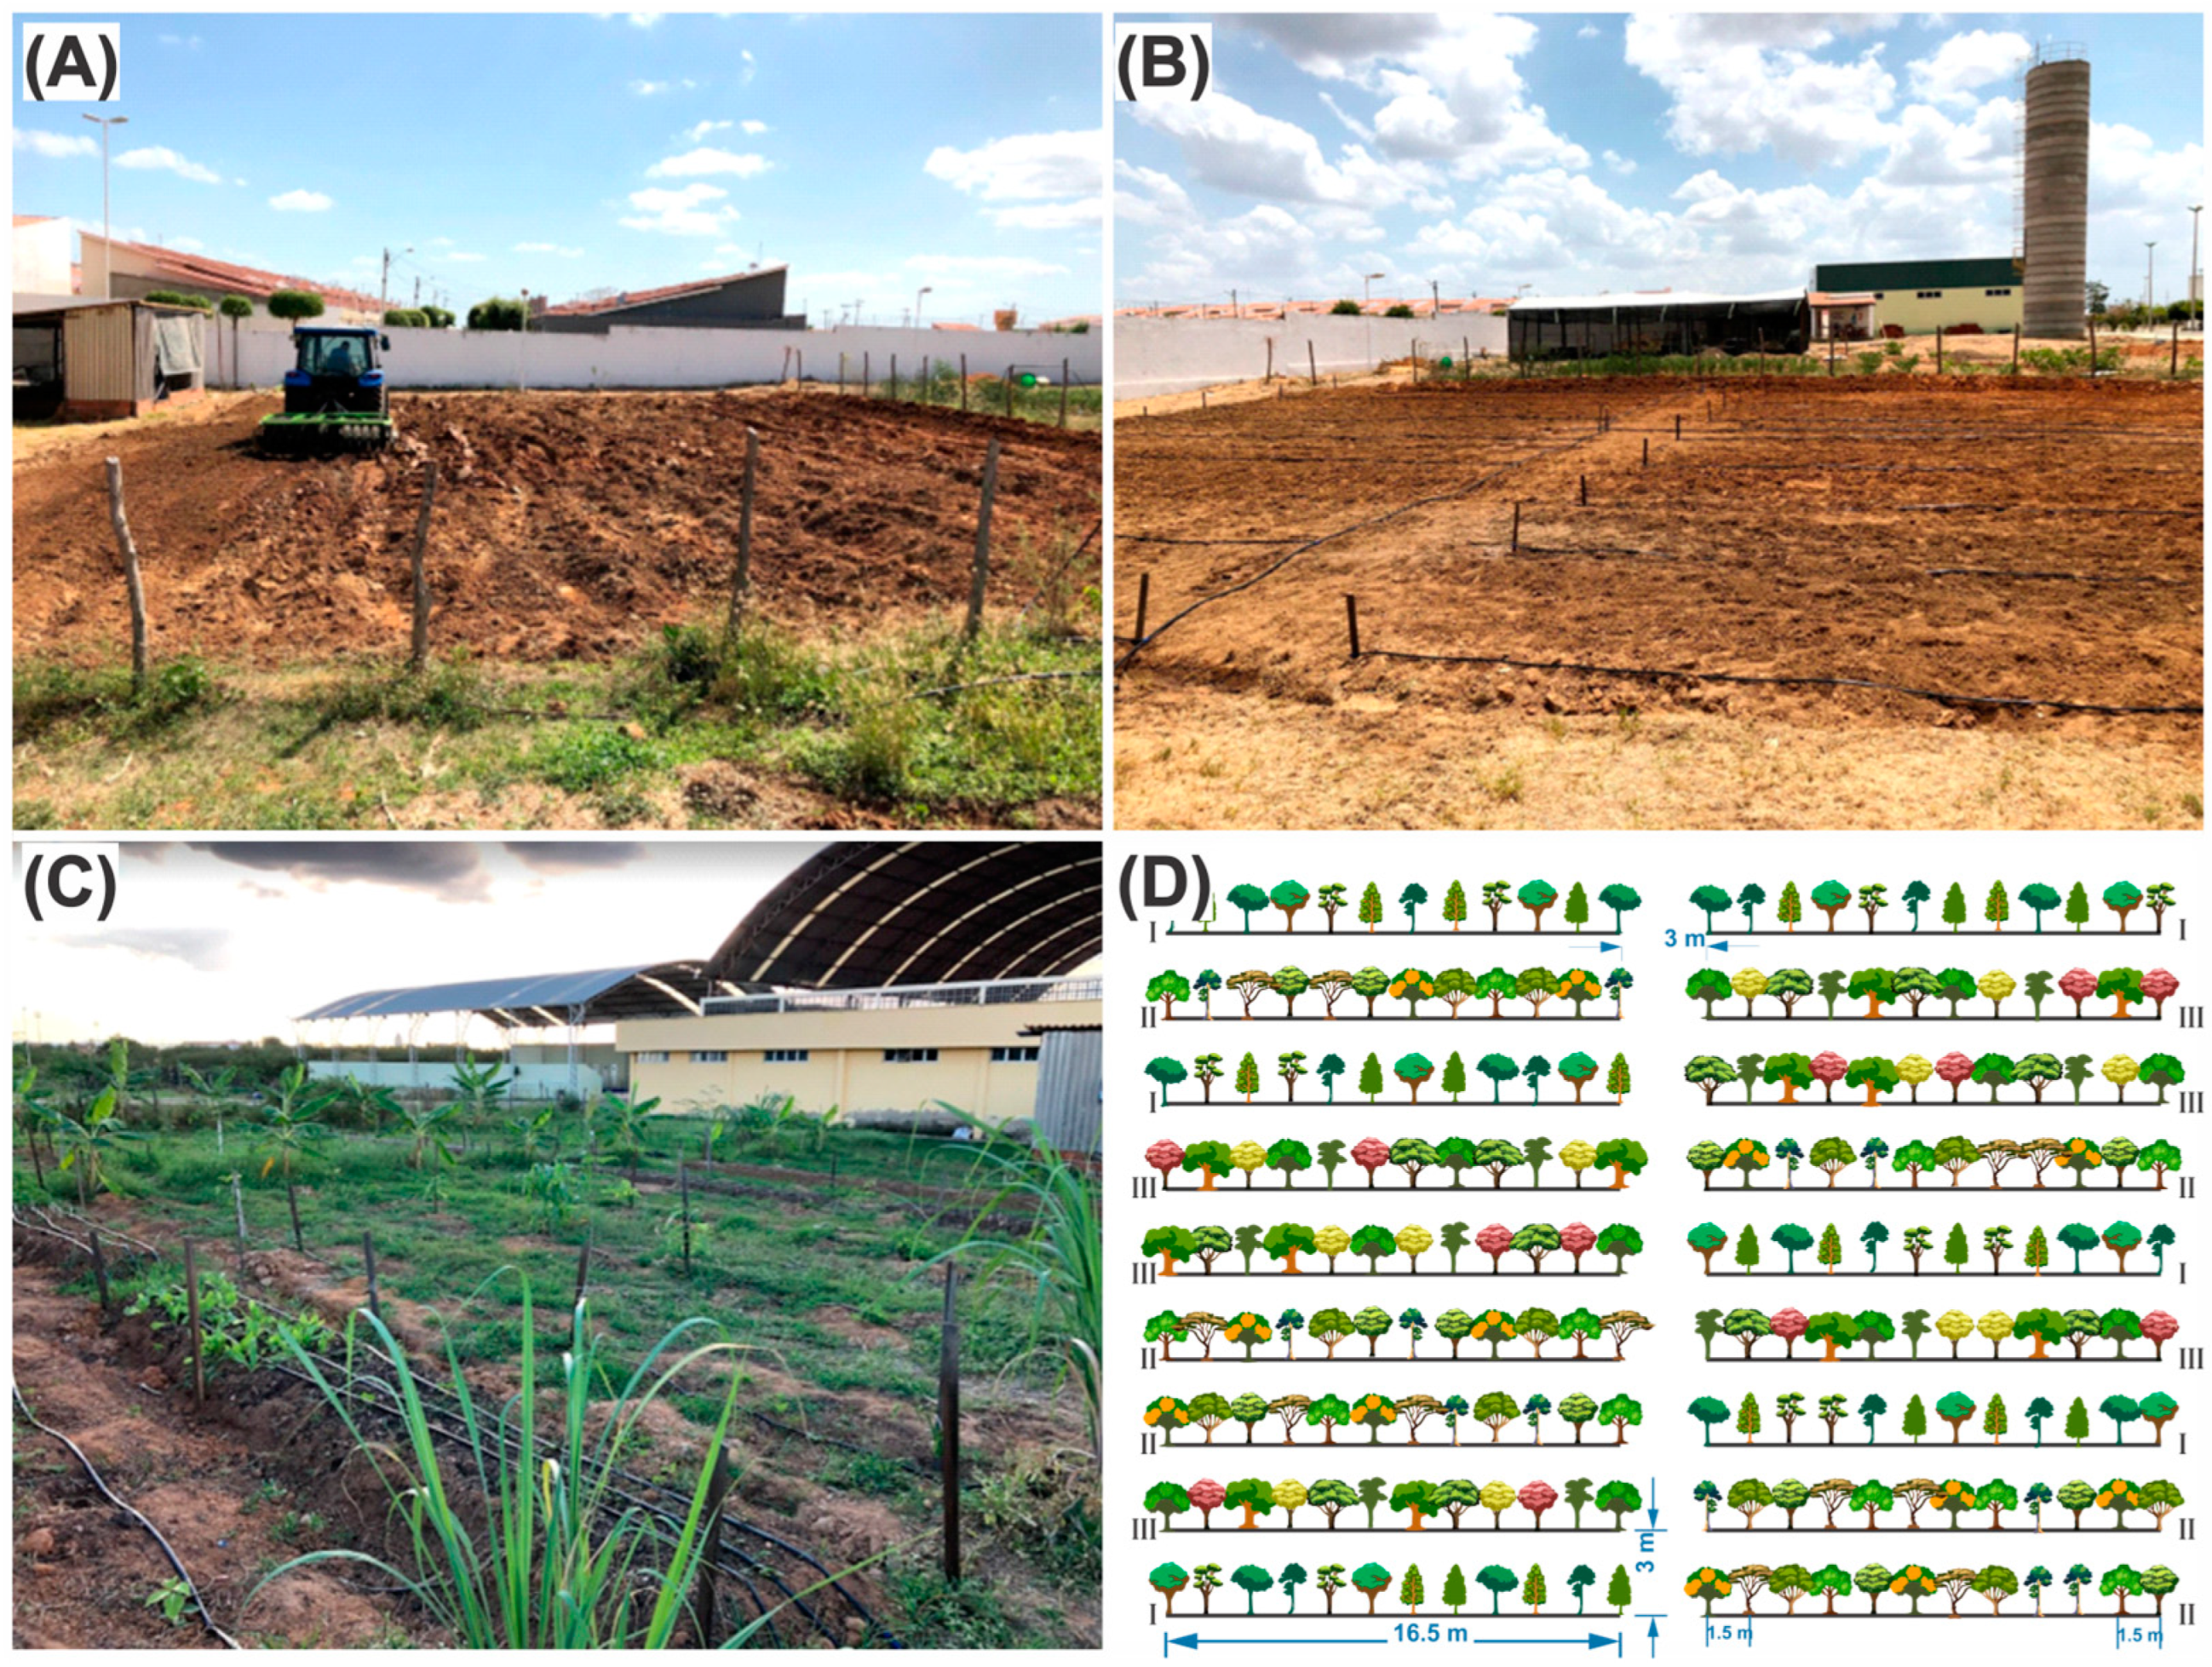
2.1. Implantation Process and Costs

The agroforestry system (AS) initially underwent a failed implantation attempt, in which plant species were introduced through direct seeding to minimize implementation costs, as recommended by Raupp et al. (2020) [45]. Before direct seeding, the area was plowed and harrowed (Figure 1A,B), followed by the establishment of 18 planting rows, each 16.5 m long, with seeds of selected species placed at intervals of 1.5 m (Figure 1C,D).
This method likely failed primarily due to several unfavorable conditions, possibly including insufficient soil moisture, seed predation, weed competition, and low germination rates. After six months, only two individuals of Anacardium occidentale survived, representing less than 1% survival of the original planting. Considering these challenges, we decided to shift the methodology towards using pre-grown seedlings, ensuring greater establishment success and survival [46].
The new methodology (Figure 1C) involved using 4-month-old nursery-grown seedlings to address previous establishment challenges. A total of 216 seedlings from 18 semi-arid-adapted species were selected based on criteria including rapid growth, drought tolerance, soil improvement, and socioeconomic benefits (fruit, forage, and wood production).
To ensure comparability, we retained the original layout (18 rows × 3 m spacing, 12 seedlings/row at 1.5 m intervals), but tested three biodiversity arrangements (Table 1), each replicated across six rows. Each biodiversity arrangement (I, II, and III) was designed to include a variety of species capable of providing fruit, forage, and timber. In practice, each group was assembled flexibly to ensure multiple ecological and economic functions, rather than adhering to a strict ratio of species for each purpose. Additionally, we combined fast-growing with slower-growing species to secure both an early supply of biomass and organic matter to the soil and longer-term productivity. Table 1 highlights each species’ primary use (fruit, forage, or timber), demonstrating how each one contributes to the system’s resilience and multifunctionality in the semi-arid context.
The selection of species within each biodiversity arrangement was based on their functional traits and intended contributions to the agroforestry system. Arrangement I emphasized fast-growing species with low to intermediate wood density, such as Moringa oleifera and Ceiba glaziovii, to promote rapid biomass accumulation and early structural development. Arrangement II prioritized species with intermediate growth rates and ecological functions such as nitrogen fixation, aiming to balance productive output with improved soil fertility (e.g., Gliricidia sepium, Cenostigma pyramidale). Arrangement III included predominantly slow-growing hardwood species, such as Libidibia ferrea, Talisia esculenta, and Handroanthus impetiginosus, selected for their long-term carbon storage capacity and contribution to structural resilience. While all arrangements were designed to provide fruit, timber, and forage services, they differed in their expected performance timelines and in the relative proportion of species associated with pioneer or late-successional strategies.
Considering the essential role of goats and sheep for smallholder livelihoods in the Caatinga, we also took into account the need for forage-producing species in agroforestry systems. As Miccolis et al. (2019) highlight, incorporating species like Gliricidia sepium can help maintain animal health in the dry season and reduce grazing pressure on regenerating native vegetation [52]. Therefore, we integrated forage trees (e.g., Moringa oleifera, Gliricidia sepium), alongside fruit and timber species, to balance livestock needs with ecological restoration goals in our agroforestry design.
Three months after planting, seedling mortality was assessed, and dead seedlings (approximately 14%) were replaced using seedlings readily available in the nursery. The replacements included species adapted to local semi-arid conditions, such as Ceiba glaziovii, Mimosa caesalpiniaefolia, Anadenanthera colubrina, Cenostigma pyramidale, and Tamarindus indica, as well as other locally available species (Morus alba, Gliricidia sepium, Malpighia emarginata, and Spondias purpurea). Although not all of these species are fast-growing, their selection was based primarily on nursery availability, ecological suitability to semi-arid conditions, and their potential to enhance ecosystem functionality and biodiversity within the agroforestry system. Notably, all individuals of Hymenaea sp. initially planted in one of the biodiversity arrangements died within the first months and were replaced by Mimosa caesalpiniaefolia, a species well-adapted to local edaphoclimatic conditions. Similarly, all seedlings of Astronium urundeuva failed to survive and were not replaced by a single substitute species; instead, their positions were filled with a mix of species already present within the same arrangement and individuals of Gliricidia sepium, selected for their local availability and ecological compatibility. Although the original biodiversity arrangements were carefully planned with six distinct species each, early seedling mortality and subsequent replanting with nursery-available species led to inevitable modifications in species composition within the rows. In order to reflect the actual structure and functioning of the agroforestry system over time, all surviving and replanted individuals were considered as part of the biodiversity group corresponding to their original row. This strategy preserved the integrity of the experimental design while acknowledging the adaptive decisions often required in field-based agroforestry systems under semi-arid conditions. Additionally, individuals of the invasive species Leucaena leucocephala spontaneously germinated and established in the area without deliberate planting and were therefore included in subsequent phytosociological analyses.
To enhance seedling survival and initial establishment, drip irrigation was installed. Irrigation lines were distributed along each row, with emitters every 20 cm providing water at a flow rate of 1.6 L per hour. The irrigation was activated daily for one hour during the critical initial six-month dry period, totaling approximately 388.8 m3 (equivalent to 436.3 mm over the 891 m2 experimental area), with an average daily application of about 2.42 mm. This supplemental irrigation proved essential, particularly given the pronounced interannual precipitation variability recorded at the study site between April 2019 and April 2022 (329 mm in 2019, 1065 mm in 2020, 650 mm in 2021, and 544 mm in 2022). These annual data further illustrate the climatic fluctuations and highlight the necessity of irrigation, a strategy that significantly improved seedling survival and growth during the establishment phase.
Costs were calculated considering all steps involved in the establishment and initial maintenance of the system, including harrowing, nursery production, labor for planting and maintenance, irrigation installation and water usage, and weed control measures. Costs were calculated in Brazilian currency (Reais—BRL), with values converted to US dollars (USD) based on the exchange rate of 24 February 2023 (1 BRL = 0.1930837 USD). Detailed cost estimates are clearly presented in Table 2.

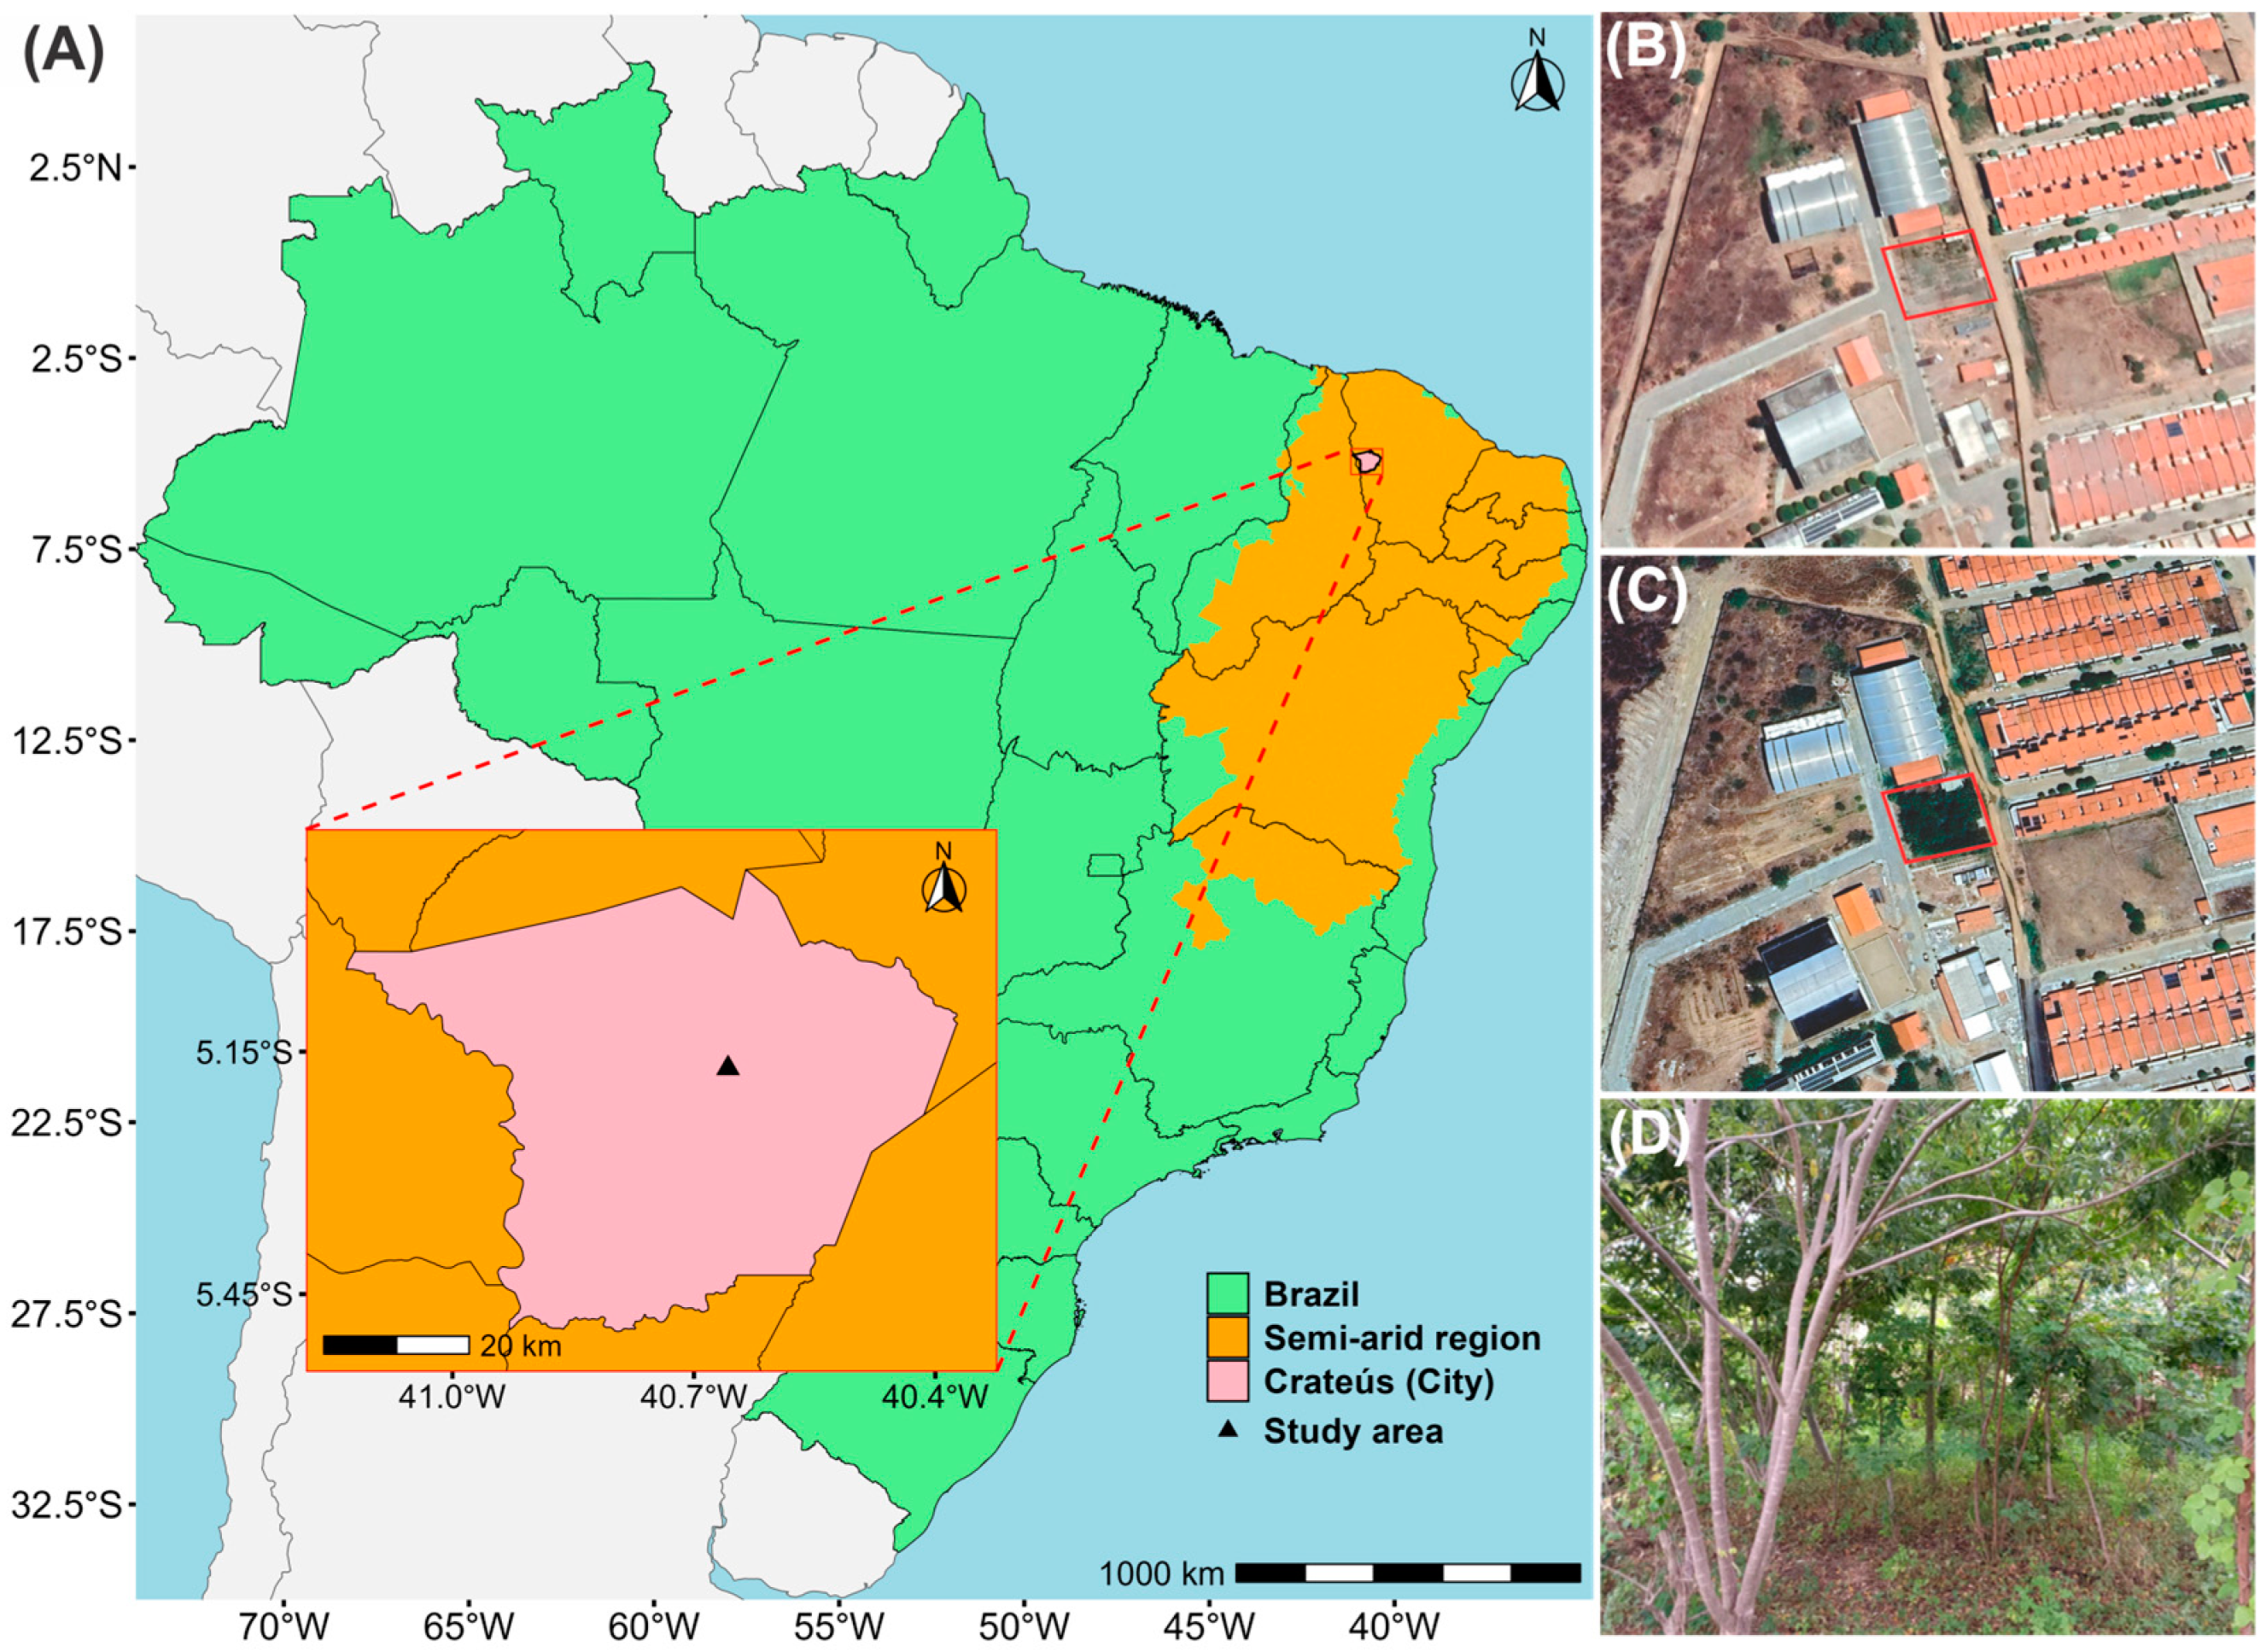
2.2. Characterization of the Study Area

The agroforestry system (AS) was established on the campus of the Federal Institute of Education, Science, and Technology of Ceará (IFCE), located in the municipality of Crateús, Ceará, Brazil (5°10′18.01″ N, 40°39′28.31″ W) (Figure 2). Crateús is situated approximately 350 km from the state capital, Fortaleza, and has a population of 75,394 inhabitants, with a population density of 25.29 inhabitants km−2 [53]. The municipality lies within the semi-arid Caatinga morphoclimatic domain [54], characterized by average annual rainfall ranging from 500 mm to 800 mm. Rainfall predominantly occurs from January to June, with peak precipitation in March and April. This region exhibits considerable temporal and spatial variability in rainfall patterns and experiences a high rate of evapotranspiration, contributing to overall arid conditions [55,56].
Crateús comprises two primary geomorphological domains: the Sertaneja Depression, formed by the Precambrian crystalline basement, and the Ibiapaba Sedimentary Plateau, derived from the Serra Grande formation dating to the Devonian period [57].
Vegetation types in the municipality include open shrub caatinga, carrasco, arboreal caatinga, and tropical dry forest [58,59]. The specific sampling area for this study is situated to the right of the Torão stream, adjacent to the Poti River. Before urban expansion and deforestation, this site was likely characterized by gallery forest vegetation, as soils in this area are classified as Fluvic Neosol, typically found in regions subject to alluvial sediment deposition. The area currently experiences challenges related to water drainage due to shallow soils with low permeability, resulting in temporary waterlogging during periods of intense rainfall. Additionally, nearby areas exhibit rocky outcrops and intrusions, further affecting local hydrology and soil conditions.

2.3. Phytosociological Analysis

All individuals were measured for diameter, height from the ground, and maximum height within the sampling area. For phytosociological analysis, each planting row was treated as a sampling unit with dimensions of 3 m width by 16.5 m length, totaling a sampled area of 891 m2 across all 18 rows. From these measurements, several phytosociological parameters were calculated at the species level across the entire agroforestry system. Abundance (n) was determined as the total number of individuals per species. Absolute Density (AD) was obtained by dividing the number of individuals per species by the sampled area, expressed per hectare. Relative Density (RD) corresponded to the proportion of individuals of each species relative to the total number of individuals of all species, expressed as a percentage. Absolute Frequency (AF) was calculated as the percentage of sampling units in which a given species occurred, and Relative Frequency (RF) represented the percentage ratio of each species’ absolute frequency relative to the sum of all species’ absolute frequencies. Absolute Dominance (DoA) represented the sum of basal areas of all individuals of a given species per hectare, converted from field measurements in cm2 to m2. Relative Dominance (DoR) was the percentage contribution of each species to the total basal area of the community. Finally, the Importance Value Index (IVI), an integrative measure of ecological significance, was computed by summing each species’ RD, RF, and DoR values, then dividing the total by three, in order to limit the IVI to a maximum value of 100% [60].
In addition, the aboveground carbon stock (C, Mg per individual) was estimated using the allometric equation proposed by Scolforo et al. (2015) [61]: C = e−10.7501678493+2.0580637328ln(DBH)+0.8604515609ln(H), where DBH is the diameter at breast height (cm), H is the total height of the tree (m), and ln is the natural logarithm. For individuals with multiple stems, this equation was applied separately to each stem, and the total carbon stock per individual was calculated by summing the results obtained for all stems. The resulting carbon stock values were then aggregated by species and biodiversity arrangement for descriptive and comparative analyses (Table 3).
To assess differences in aboveground carbon stock and basal area among biodiversity arrangements, we calculated the total values per row (i.e., summing all individuals within each line). These totals reflect the productive capacity of each biodiversity arrangement per sampling unit and were used as dependent variables in separate one-way ANOVA models, with biodiversity arrangement as a fixed effect. As the assumptions of normality and homoscedasticity were met for both datasets, post-hoc comparisons were performed using Tukey’s Honest Significant Difference (HSD) test.
In contrast, statistical comparisons of aboveground carbon stock and basal area among species were conducted using the non-parametric Kruskal–Wallis test, as the data violated parametric assumptions. When significant differences were detected (p < 0.05), we applied pairwise post-hoc tests using Dunn’s test, with p-values adjusted using the Benjamini–Hochberg procedure to control the false discovery rate. All phytosociological calculations (abundance, frequency, dominance, IVI), as well as descriptive and inferential statistical analyses, were conducted using R software, version 4.4.1 [62].

3. Results and Discussion

3.1. Implementation and Maintenance Cost

Although agroforestry has repeatedly been shown to offer strong ecological benefits, there remains a notable research gap regarding its implementation in semi-arid biomes such as the Caatinga. A recent systematic review found that only 19% of the Brazilian agroforestry literature focuses on this biome, despite its extensive degradation and critical role in restoration [63].
Within agroforestry systems, labor commonly represents the greatest cost. On smallholder farms, where financial limitations are more pronounced, labor can account for the largest expense during the first three years of establishment [46,64]. In this study, labor was provided by volunteers and students from IFCE courses; however, the projected labor requirement was approximately 10 working days, with a five-person team spending two days digging holes and transplanting seedlings. Even under volunteer-based conditions, all labor inputs were monetized at local market rates to simulate a real-world scenario. Hence, efforts to reduce labor costs by mobilizing community labor can significantly enhance feasibility and scalability under resource-constrained settings.
Irrigation presented another central challenge. Due to the Caatinga’s prolonged dry season, farmers who choose to plant outside of the rainy period typically require supplemental water, for which reliable access is often lacking. In our case, irrigation water was sourced from a local utility. The drip lines (270 m total) cost BRL 110.16 (USD 21.27), and the drip system—operating at 1.6 L h−1 per emitter spaced every 20 cm—consumed roughly 64.8 m3 per month over six months, which, at a price of BRL 4.92 m−3 (USD 0.95 m−3), led to monthly irrigation costs of BRL 318.80 (USD 61.56). Drip irrigation is particularly suitable for semi-arid regions due to its efficient water delivery and minimal evaporation, and it improves soil permeability by delivering water directly to the root zone [65,66]. Nevertheless, sustainable use of irrigation in agroforestry requires reliable infrastructure, and uncertainties in water availability or high conversion costs may inhibit broader adoption, particularly if subsidies or support mechanisms are lacking [67]. The study area was also mowed three times with a brush cutter at an estimated BRL 120.00 (USD 23.17) per session, encompassing fuel and labor.
The integration of short-cycle crops adapted to early successional stages (Figure 1C) further enhanced the system’s multifunctionality. Although these crops (lettuce, kale, arugula, okra, peppers, corn, sunflower) were not commercialized, they provided fresh produce for volunteers and offset food expenses while the system’s longer-term fruit trees were established. Similarly, an analysis of integrated production systems in semi-arid Bahia showed that including vegetables and forage in agroecological setups boosted food security and farmer satisfaction [68]. Despite the lack of direct market income, short-cycle crops can buffer economic risk during the initial phase, increase diet diversity, and improve resilience. Additional public programs, providing technical assistance, water infrastructure, or subsidized inputs, can further support the adoption of agroforestry by smallholders [69]. In this sense, initiatives such as the Programa Nacional de Fortalecimento da Agricultura Familiar (PRONAF—National Program for the Strengthening of Family Farming), which provides credit to family farmers, and the Programa Nacional de Alimentação Escolar (PNAE—National School Feeding Program), which mandates that a significant share of school-meal procurement comes from smallholder production, are pivotal to making agroecological systems financially feasible [70]. By bridging funding gaps and guaranteeing stable markets, these programs help ensure both the short-term viability of agroforestry crops and the long-term sustainability of the system.
Seedling production was carried out at IFCE, but costs were calculated at local market prices for seeds, substrate, containers, and labor, averaging BRL 5.00 (USD 0.96) per seedling. In total, 216 seedlings were planted, plus 30 replacements for mortality, resulting in BRL 1230 (USD 237.49). These figures align with broader evidence that nursery inputs and planting material often account for more than half of restoration project costs [38]. In remote regions—particularly among smallholder farms in semi-arid areas—the logistical burden associated with seedling transport can substantially elevate production expenses, emphasizing the need for locally managed nurseries and decentralized propagation strategies.
Overall, implementing our system costs an estimated BRL 57,468.79 (USD 11,096.29) per hectare. Maintenance costs, including irrigation and mowing, constituted the largest share of expenses (44.39%), followed by infrastructure and labor for site preparation (31.59%), and seedling production (24.02%). These proportions differ from those of other agroforestry models in Brazil. Oliveira et al. (2024), for example, reported a total of BRL 28,164.60 per hectare, with 57% allocated to seedlings and propagules, nearly half of which stemmed from avocado alone, while commercial mulch was also a major operational outlay [71]. In contrast, Araújo et al. (2020) documented a high-input successional agroforestry system costing BRL 336,640.76 (USD 105,200.24; BRL 3.20 per USD at the time of the study) per hectare, where inputs represented 36.09%, harvesting 17.90%, site preparation 14.25%, maintenance 13.37%, and planting operations 13.07% [40]. These notable variations illustrate how system design, species selection, propagation strategies, and infrastructure access critically shape cost structures [39]. Although labor was provided by volunteers, all activities were monetized using local market rates to simulate a realistic financial scenario. Producers who rely on their own labor, plant during the rainy season, or adopt strategies such as sourcing alternative water or using direct seeding could substantially reduce implementation costs. Therefore, our cost estimate provides a useful baseline for planning but should be adjusted according to local socioeconomic and environmental conditions, particularly in contexts where cost-efficiency is critical for smallholder adoption and long-term sustainability.
Despite cost challenges, farmers in the semi-arid region of Paraíba reported that agroforestry can improve food security, soil protection, and family income [36]. Water scarcity during dry periods and the higher labor demands remained the primary obstacles to scaling and maintaining these systems, with monthly maintenance costs ranging from BRL 200.00 to BRL 500.00 (USD 38.62 to USD 96.54; BRL 1.00 = USD 0.193), figures consistent with our estimates. In many instances, technical assistance was initially absent, underscoring the need for structured planning and institutional support to secure viability and replicability [36]. Beyond environmental benefits, agroforestry has been shown to bolster resilience and livelihoods in the Brazilian semi-arid region. A participatory assessment of 15 family-based agroforestry systems (SAFs) across Pernambuco found that mature systems could accumulate over 150 t ha−1 of aboveground biomass and capture up to 10 t ha−1 year−1 of CO₂ equivalents [72]. Farmers participating in these SAFs also highlighted species diversity, food autonomy, and water-management strategies, such as rainwater cisterns, as central to system resilience. Consequently, scaling agroforestry in drylands demands not only biophysical feasibility but robust institutional engagement, consistent water access, and ongoing investments in extension services, infrastructure, and nursery networks.
If expenditures are extrapolated linearly, the projected annual cost per hectare would be BRL 19,156.26 (USD 3698.76). However, outcomes are strongly influenced by local factors, such as farm size, labor availability, and rainfall patterns. Farmers who synchronize planting with the wet season can substantially curb irrigation and preparation costs, whereas large-scale adopters may consider direct seeding or natural regeneration to reduce costs [38,46]. Nonetheless, such approaches can have lower establishment rates and might be less suitable in heavily degraded or legally mandated restoration sites, where more intensive methods prove necessary. Semi-arid restoration initiatives have demonstrated the success of combining local knowledge, affordable technology, and supportive public policies to build resilience at scale [69].
Despite growing awareness of agroforestry as a key strategy for ecological restoration and climate adaptation, uptake remains limited in many resource-poor semi-arid regions. A global review identified consistent barriers: insufficient technical know-how, limited market options, labor intensity, high initial costs, and a lack of professional support [67,73]. These barriers closely mirror our findings, where implementation demanded substantial labor, six months of irrigation, and introduced complexities in species selection, design, and replanting, yet provided no immediate financial return. Although institutional support and volunteer labor were helpful in our case, broader replicability in typical smallholder environments demands extension services, cost-effective inputs, and public incentives. That said, agroforestry can often generate income for producers during development, prompting further research into optimal species combinations for maximal and rapid returns. Where restoration is prioritized, management actions and species choices should emphasize proven ecological outcomes, such as enhanced biodiversity or improved soil fertility [52,74].
Agroecological models are increasingly recognized as viable alternatives to conventional agriculture in marginal landscapes, notably for their potential to unite productivity, ecological resilience, and social justice. Small-scale, diversified systems can be more productive when total output is considered, while also demonstrating higher energy efficiency, resilience to climate shocks, and supporting food sovereignty. Such attributes resonate with our experimental agroforestry system, wherein an 891 m2 plot yielded a variety of short- and longer-cycle crops, maintained soil coverage, and contributed to carbon sequestration with limited external inputs. Still, as global evidence indicates, the widespread success and scalability of these approaches hinge on strong institutional frameworks, especially public policies, technical support, and stakeholder involvement, to ensure access to water, planting materials, and agroecological know-how [64,69,73,75]. In semi-arid regions characterized by both biophysical constraints and social vulnerabilities, these support systems are indispensable for realizing agroforestry’s full potential as a pathway toward sustainable development.

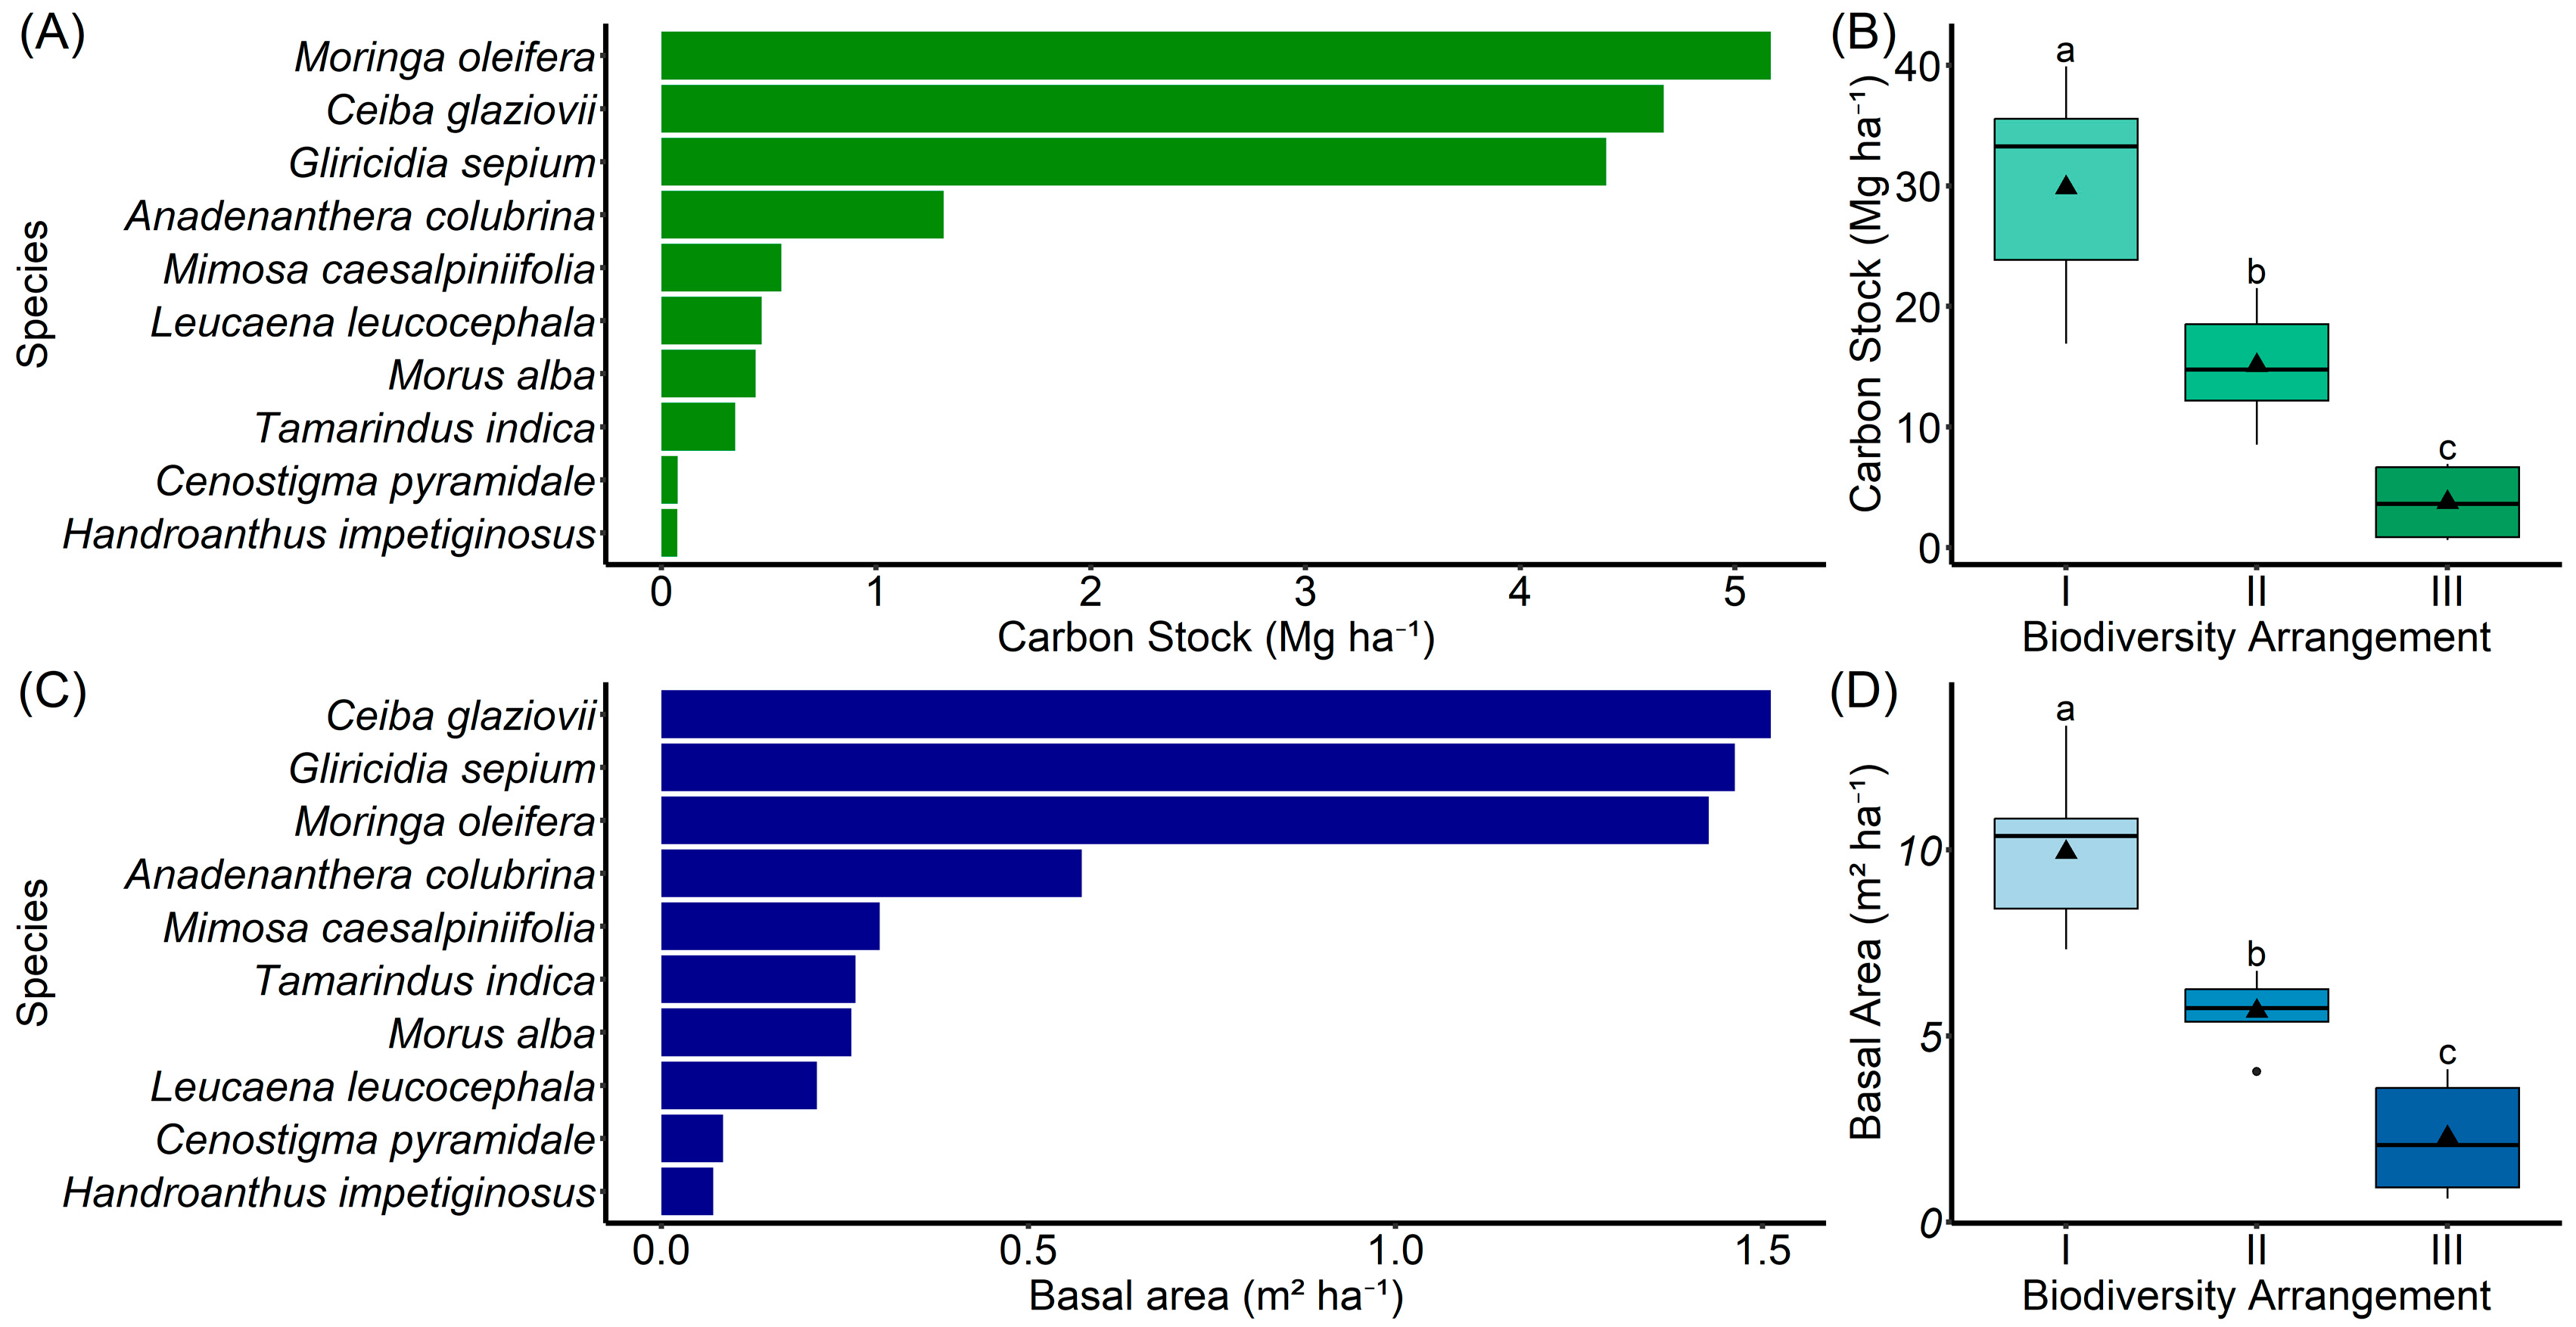
3.2. Species Composition, Diversity, and Structural Dominance in the Agroforestry System

The agroforestry system supported a diverse set of 19 woody species, totaling 148 individuals after three years. The Fabaceae family was the most representative (Table 3), accounting for over half the individuals (79) and eight different species (Table 3). This dominance aligns with the ecological and functional plasticity of the family in semi-arid environments, as many Fabaceae species are nitrogen fixers, allowing them to grow faster after leaf loss in the dry season, yet they are drought-tolerant and are capable of rapid early establishment in degraded soils [76,77]. In terms of overall community structure, the system presented a plant density of 166.11 ind ha−1, a basal area of 6.37 m2 ha−1, and an aboveground carbon stock of 17.69 Mg ha−1 after just three years (Table 3). This structure reflects not only the diversity introduced through planting but also selective survival, which appears to have favored fast-growing, stress-resilient species. Phytosociological analysis revealed that five species—Ceiba glaziovii, Tamarindus indica, Gliricidia sepium, Moringa oleifera, and Anadenanthera colubrin (Table 3)—together accounted for nearly 50% of the total IVI. Ceiba glaziovii, in particular, had the highest IVI in the system, likely due to its vigorous growth, large canopy, and ecological function as an emergent species that improves microclimate and soil protection. Similarly, Gliricidia sepium showed high frequency and basal area, aligning with its known ecological role as a biomass producer, nitrogen fixer, and dry-season forage provider [78], making it a strategic species for early-stage productivity and multifunctionality in Caatinga restoration systems [79,80,81].

3.3. Aboveground Carbon Stock, Basal Area, and Carbon Credit Potential in the Agroforestry System

Almost 44% of Brazilian CO2 emissions resulted from land-use changes, followed by 28% from agricultural activities [61]. Compared with other land-use types, agroforestry systems are known to increase carbon sequestration and function as an effective carbon sink. However, our understanding of their sequestration potential remains limited and highly dependent on site-specific management and environmental conditions [82,83]. In this study, the aboveground carbon stock varied significantly among species (Kruskal–Wallis χ2 = 121.1, p < 0.001—Figure 3A), with post-hoc pairwise comparisons revealing numerous significant differences (adjusted p < 0.05, Benjamini–Hochberg correction; Table 3). Among the 19 species analyzed, Moringa oleifera, Ceiba glaziovii, and Gliricidia sepium stood out as the principal contributors, accumulating 5.167, 4.669, and 4.401 Mg ha−1, respectively. These species alone accounted for over 80% of the system’s total aboveground carbon, underscoring their central role in early-stage biomass accumulation and ecosystem service delivery. To illustrate their dominance, the ten species with the highest aboveground carbon stocks are presented in Figure 3A, which collectively represent over 99% of the total carbon accumulated in the system.
A few additional species, such as Leucaena leucocephala and Mimosa caesalpiniifolia, showed intermediate carbon stocks (~0.4–0.5 Mg ha−1), while most of the remaining species, including Amburana cearensis, Talisia esculenta, and Spondias purpurea, contributed negligibly (<0.01 Mg ha−1). These values reflect either low individual abundance or early development stages of slower-growing species. It is important to note that the allometric model used for carbon estimation in this study does not incorporate wood density as a predictive variable. As shown in Table 2, species with dense wood, such as Libidibia ferrea (1.22 g cm−3), Talisia esculenta (1.10 g cm−3), and Tamarindus indica (0.98 g cm−3), tended to accumulate modest carbon according to the model. However, their true long-term carbon storage potential may be underestimated. Conversely, species with softer wood and faster growth, such as Moringa oleifera (0.26 g cm−3) and Ceiba glaziovii (0.59 g cm−3), may present inflated short-term carbon estimates. These findings highlight the need to integrate wood density in future modeling approaches to improve carbon accounting accuracy in mixed-species systems.
Aboveground carbon stock also differed significantly among the biodiversity arrangements (F2,15 = 25.34, p < 0.001—Figure 3B). Biodiversity I accumulated the highest carbon stock (29.85 Mg ha−1), followed by Biodiversity II (15.12 Mg ha−1), and Biodiversity III (3.74 Mg ha−1). All pairwise differences were statistically significant according to Tukey’s HSD test (p < 0.05), confirming that species composition had a strong influence on biomass production and carbon sequestration potential in the early years of system development.
To complement carbon estimates, we also assessed basal area, a structural parameter reflecting species’ spatial and volumetric occupation. Basal area differed significantly among species (Kruskal–Wallis χ2 = 117.52, p < 0.001—Figure 3C), with Ceiba glaziovii, Gliricidia sepium, and Moringa oleifera again ranking highest (1.51, 1.46, and 1.43 m2 ha−1, respectively). These values further demonstrate their structural dominance in the system. Anadenanthera colubrina and Mimosa caesalpiniifolia followed with intermediate values (~0.57 and 0.30 m2 ha−1), while several species, such as Amburana cearensis and Talisia esculenta, contributed less than 0.01 m2 ha−1.
Basal area also varied significantly among biodiversity arrangements (F2,15 = 33.57, p < 0.001—Figure 3D), with Biodiversity I again presenting the highest mean value (9.94 m2 ha−1), followed by Biodiversity II (5.67 m2 ha−1) and Biodiversity III (2.27 m2 ha−1). The observed trends in basal area closely mirrored those in carbon stock, reinforcing the conclusion that early-stage ecosystem structure and function are shaped by biodiversity configuration.
Although the hypothesis that higher levels of functional complementarity enhance carbon accumulation and structural development is well-supported in the literature [44], our experimental design did not allow for a rigorous test of this relationship, as the number of species per planting line was relatively uniform across all arrangements. Furthermore, we did not observe any evidence supporting this hypothesis in the lines that included nitrogen-fixing species, as these configurations did not exhibit higher biomass or basal area compared to others. These findings suggest that the potential facilitative effects of nitrogen fixation did not translate into measurable gains in early system productivity under the conditions of this study. Instead, our results indicate that early performance was largely driven by the individual vigor and dominance of a few fast-growing species, particularly Ceiba glaziovii, Moringa oleifera, and Anadenanthera colubrina, even in plots with lower functional diversity. This aligns with previous findings from Shimamoto et al. [41], who emphasize that early carbon accumulation in agroforestry systems is often dominated by fast-growing species, while slow-growing taxa tend to contribute more significantly to biomass and carbon storage over the long term.
On average, the agroforestry system accumulated 17.69 Mg ha−1 of aboveground carbon after three years. Although this is below the average carbon stock of preserved Caatinga vegetation (35.4 Mg ha−1) [61], it is notable given the system’s early age, wide spacing, and functional diversity strategy. As the system matures, carbon accumulation is expected to increase until reaching a plateau, with contributions from both fast-growing pioneers and slow-developing climax species. Thus, current estimates likely understate the long-term carbon potential of the system.
Although this study focused exclusively on aboveground carbon stocks, we acknowledge the limitation of not accounting for belowground carbon, particularly Soil Organic Carbon (SOC), which restricts a complete evaluation of the system’s carbon sequestration potential. No measurements of initial or post-establishment SOC were performed, limiting the ability to assess the full carbon balance. However, studies in tropical and semi-arid agroforestry systems demonstrate that SOC can represent a substantial and often dominant portion of total ecosystem carbon, especially under systems with deep-rooted species and organic matter inputs from litter and root turnover [84,85,86]. SOC tends to accumulate more slowly than aboveground biomass, but its contribution increases steadily over time and can exceed 100 Mg ha−1 in well-structured systems [33,87]. In systems with functional integration of trees and crops, particularly in degraded or nutrient-poor soils, SOC gains are associated with improved soil structure, enhanced microbial activity, and greater belowground biomass inputs [88,89]. Moreover, studies indicate that the proportion of SOC relative to total carbon is especially high in open-canopy or early-successional systems, where aboveground carbon is still developing [90,91]. These findings emphasize the importance of including stratified and temporal SOC assessments to accurately estimate the long-term carbon sequestration potential of agroforestry systems in semi-arid regions.
From an economic standpoint, based on the carbon credit market value of 3 March 2023 (“CFI2Z1- Future Carbon Credit”; EUR 89.27 = BRL 487.24 = USD 94.09 per Mg CO2), the average carbon value per hectare in this agroforestry system over the three-year study period is estimated at approximately USD 1689.86 (BRL 8619.28). This value is highly dependent on biodiversity configuration. Specifically, biodiversity arrangement I, which has the highest carbon stock (29.85 Mg/ha), could yield USD 2808.59 (BRL 14,329.11). Biodiversity II (15.12 Mg/ha) could yield USD 1422.64 (BRL 7257.27), while biodiversity III (3.74 Mg ha−1) would generate USD 351.90 (BRL 1795.74). These estimates emphasize that species selection is not only an ecological decision but also an economic one. Fast-growing, high-biomass species, like Moringa oleifera, Gliricidia sepium, and Ceiba glaziovii, can be strategically incorporated into early phases of system development to accelerate carbon accumulation and increase short-term returns. In contrast, late-successional species, such as Anadenanthera colubrina, Cenostigma pyramidale, Libidibia ferrea, and Amburana cearensis, though slower to develop, act as long-term carbon sinks and enhance structural complexity over time.

4. Conclusions

This study successfully evaluated the implementation and early performance of an agroforestry system in a degraded urban area of the Brazilian semi-arid region, demonstrating its technical feasibility and relevance for restoration under local conditions. The total cost of establishment and maintenance over three years was estimated at BRL 57,468.79 ha−1 (USD 11,096.29), a value considered relatively low when compared to high-input agroforestry models. This reinforces the economic viability of such systems, especially when supported by cost-reducing strategies such as aligning planting with the rainy season, using local nurseries, and selecting species with rapid early growth and multifunctional traits.
The system showed consistent structural development, with annual increases in basal area and aboveground biomass, particularly among fast-growing species. It also provided important ecosystem services, including the sequestration of 17.69 Mg C ha−1 in three years, and delivered socioeconomic benefits by supplying food for family consumption, despite the lack of crop commercialization. Species-specific monitoring confirmed that Ceiba glaziovii, Gliricidia sepium, and Moringa oleifera were the main contributors to early growth and carbon accumulation, reinforcing their strategic role in the initial successional stages.
Although biodiversity arrangements with different functional compositions were tested, no significant differences in carbon stock or structural development were observed, indicating that functional diversity alone did not enhance system performance in the short term. Thus, the first hypothesis, regarding the disproportionate contribution of nitrogen-fixing and fast-growing species, was partially supported, while the second, predicting higher performance in functionally complementary arrangements, was not confirmed. Early system dynamics appear to have been shaped more by the ecological traits of dominant species than by functional diversity as a whole.
Future research should focus on optimizing species combinations and spatial configurations, quantifying belowground carbon dynamics, and assessing the medium- and long-term socioeconomic outcomes of agroforestry systems. Investments in water access, technical assistance, and seedling availability remain crucial to expanding the adoption and long-term success of agroforestry as a strategy for ecological restoration and sustainable rural development in semi-arid regions.

Author Contributions

Conceptualization and methodology, A.B.G. and D.B.N.; formal analysis, A.B.G.; investigation, system implementation, and management, A.B.G., D.B.N., I.G.A.B. and A.G.d.C.d.S.; data collection, I.P.d.Q., I.G.A.B. and A.B.G.; writing—original draft preparation, I.P.d.Q. and A.B.G.; writing—review and editing, I.G.A.B. and A.B.G. All authors have read and agreed to the published version of the manuscript.

Funding

This research received no external funding.

Institutional Review Board Statement

Not applicable.

Informed Consent Statement

Not applicable.

Data Availability Statement

The datasets generated and/or analyzed during the current study are available from the corresponding author on reasonable request.

Acknowledgments

We thank the Federal Institute of Education, Science and Technology of Ceará (IFCE campus Crateús) for the infrastructure provided and water supplementation. We thank Rodrigues, A.J.O.; Mascena, V.M., and Silva, M.F. for all the help in implementing the system and occasionally maintaining it.

Conflicts of Interest

The authors declare no conflicts of interest.

References

  1. Silva, J.M.C.; Barbosa, L.C.F.; Leal, I.R.; Tabarelli, M. The caatinga: Urderstanding the challenges. In Caatinga: The Largest Tropical Dry Forest Region in South America; Silva, J.M.C., Leal, I.R., Tabarelli, M., Eds.; Springer: Cham, Switzerland, 2017; pp. 3–19. [Google Scholar]
  2. Zomer, R.J.; Xu, J.; Trabucco, A. Version 3 of the Global Aridity Index and Potential Evapotranspiration Database. Sci. Data 2022, 9, 409. [Google Scholar] [CrossRef] [PubMed]
  3. Andrade, E.M.; Aquino, D.N.; Chaves, L.C.G.; Lopes, F.B. Water as capital and its uses in the Caatinga. In Caatinga: The Largest Tropical Dry Forest Region in South America; Silva, J.M.C., Leal, I.R., Tabarelli, M., Eds.; Springer: Cham, Switzerland, 2017; pp. 281–302. [Google Scholar]
  4. Teixeira, L.P.; Lughadha, E.N.; Silva MVCda Moro, M.F. How much of the Caatinga is legally protected? An analysis of temporal and geographical coverage of protected areas in the Brazilian semiarid region. Acta Bot. Bras. 2021, 35, 473–485. [Google Scholar] [CrossRef]
  5. Teixeira, M.G.; Venticinque, E.M.; Lion, M.B.; Pinto, M.P. The Brazilian Caatinga protected areas: An extremely unbalanced conservation system. Environ. Conserv. 2021, 48, 287–294. [Google Scholar] [CrossRef]
  6. Antongiovanni, M.; Venticinque, E.M.; Fonseca, C.R. Fragmentation patterns of the Caatinga drylands. Landsc. Ecol. 2018, 33, 1353–1367. [Google Scholar] [CrossRef]
  7. Antongiovanni, M.; Venticinque, E.M.; Matsumoto, M.; Fonseca, C.R. Chronic anthropogenic disturbance on Caatinga dry forest fragments. J. Appl. Ecol. 2020, 57, 2064–2074. [Google Scholar] [CrossRef]
  8. Nelson, A.; Chomitz, K.M. Effectiveness of strict vs. multiple use protected areas in reducing Tropical Forest fires: A global analysis using matching methods. PLoS ONE 2011, 6, e22722. [Google Scholar] [CrossRef] [PubMed]
  9. Bhagwat, S.A.; Willis, K.J.; Birks, H.J.B.; Whittaker, R.J. Agroforestry: A refuge for tropical biodiversity? Trends Ecol. Evol. 2008, 23, 261–267. [Google Scholar] [CrossRef] [PubMed]
  10. Lapola, D.M.; Martinelli, L.A.; Peres, C.A.; Ometto, J.P.; Ferreira, M.E.; Nobre, C.A.; Aguiar, A.P.D.; Bustamante, M.M.; Cardoso, M.F.; Costa, M.H.; et al. Pervasive transition of the Brazilian land-use system. Nat. Clim. Change 2014, 4, 27–35. [Google Scholar] [CrossRef]
  11. Altieri, M.A.; Nicholls, C.I. Agroecology and the reconstruction of a post-COVID-19 agriculture. J. Peasant. Stud. 2020, 47, 881–898. [Google Scholar] [CrossRef]
  12. Melo, F.P.L. The socio-ecology of the Caatinga: Understanding how natural resource use shapes an ecosystem. In Caatinga: The Largest Tropical Dry Forest Region in South America; Silva, J.M.C., Leal, I.R., Tabarelli, M., Eds.; Springer: Cham, Switzerland, 2017; pp. 369–382. [Google Scholar]
  13. Schulz, C.; Koch, R.; Cierjacks, A.; Kleinschmit, B. Land change and loss of landscape diversity at the Caatinga phytogeographical domain—Analysis of pattern-process relationships with MODIS land cover products (2001–2012). J. Arid Environ. 2017, 136, 54–74. [Google Scholar] [CrossRef]
  14. Miller, P.M.; Kauffman, J.B. Effects of slash and burn agriculture on species abundance and composition of a tropical deciduous forest. Ecol. Manag. 1998, 103, 191–201. [Google Scholar] [CrossRef]
  15. Mamede Mde, A.; de Araújo, F.S. Effects of slash and burn practices on a soil seed bank of caatinga vegetation in Northeastern Brazil. J. Arid Environ. 2008, 72, 458–470. [Google Scholar] [CrossRef]
  16. Leal, L.C.; Andersen, A.N.; Leal, I.R. Anthropogenic disturbance reduces seed-dispersal services for myrmecochorous plants in the Brazilian Caatinga. Oecologia 2014, 174, 173–181. [Google Scholar] [CrossRef]
  17. Ribeiro, E.M.S.; Santos, B.A.; Arroyo-Rodríguez, V.; Tabarelli, M.; Souza, G.; Leal, I.R. Phylogenetic impoverishment of plant communities following chronic human disturbances in the Brazilian Caatinga. Ecology 2016, 97, 1583–1592. [Google Scholar] [CrossRef] [PubMed]
  18. FAO. HLPE Agroecological and Other Innovative Approaches for Sustainable Agriculture and Food Systems that Enhance Food Security and Nutrition; FAO: Rome, Italy, 2019. [Google Scholar]
  19. Mottet, A.; Bicksler, A.; Lucantoni, D.; De Rosa, F.; Scherf, B.; Scopel, E.; López-Ridaura, S.; Gemmil-Herren, B.; Bezner Kerr, R.; Sourisseau, J.M.; et al. Assessing transitions to sustainable agricultural and food systems: A tool for agroecology performance evaluation (TAPE). Front. Sustain. Food Syst. 2020, 4, 579154. [Google Scholar] [CrossRef]
  20. Altieri, M.A. Agroecology: The science of natural resource management for poor farmers in marginal environments. Agric. Ecosyst. Environ. 2002, 93, 1–24. [Google Scholar] [CrossRef]
  21. Kennedy, C.M.; Lonsdorf, E.; Neel, M.C.; Williams, N.M.; Ricketts, T.H.; Winfree, R.; Bommarco, R.; Brittain, C.; Burley, A.L.; Cariveau, D.; et al. A global quantitative synthesis of local and landscape effects on wild bee pollinators in agroecosystems. Ecol. Lett. 2013, 16, 584–599. [Google Scholar] [CrossRef]
  22. Jose, S. Agroforestry for Ecosystem Services and Environmental Benefits: An Overview. Agroforest. Syst. 2009, 76, 1–10. [Google Scholar] [CrossRef]
  23. Cana Verde, B.S.; Brandão, H.C.R.S.; Souza, J.C.D.; Silva, D.M.L.D. Influence of agroforestry systems on phosphorus export from small tropical watersheds. Agrofor. Syst. 2023, 97, 785–798. [Google Scholar] [CrossRef]
  24. Fahad, S.; Chavan, S.B.; Chichaghare, A.R.; Uthappa, A.R.; Kumar, M.; Kakade, V.; Pradhan, A.; Jinger, D.; Rawale, G.; Yadav, D.K.; et al. Agroforestry Systems for Soil Health Improvement and Maintenance. Sustainability 2022, 14, 14877. [Google Scholar] [CrossRef]
  25. Sacramento, J.A.A.S.D.; Araújo, A.C.D.M.; Escobar, M.E.O.; Xavier, F.A.D.S.; Cavalcante, A.C.R.; Oliveira, T.S.D. Soil carbon and nitrogen stocks in traditional agricultural and agroforestry systems in the semiarid region of Brazil. Rev. Bras. Cienc. Solo 2013, 37, 784–795. [Google Scholar] [CrossRef]
  26. Gliessman, S.R. Agroecology: The Ecology of Sustainable Food Systems, 3rd ed.; CRC Press: Boca Raton, FL, USA, 2014. [Google Scholar]
  27. Menezes, R.S.C.; Salcedo, I.H.; Elliott, E.T. Microclimate and nutrient dynamics in a silvopastoral system of semiarid northeastern Brazil. Agrofor. Syst. 2002, 56, 27–38. [Google Scholar] [CrossRef]
  28. Bishaw, B.; Soolanayakanahally, R.; Karki, U.; Hagan, E. Agroforestry for sustainable production and resilient landscapes. Agrofor. Syst. 2022, 96, 447–451. [Google Scholar] [CrossRef]
  29. Sarto, M.V.; Borges, W.L.; Bassegio, D.; Nunes, M.R.; Rice, C.W.; Rosolem, C.A. Deep soil water content and forage production in a Tropical Agroforestry System. Agriculture 2022, 12, 359. [Google Scholar] [CrossRef]
  30. Fagundes, M.; Weisser, W.; Ganade, G. The role of nurse successional stages on species-specific facilitation in drylands: Nurse traits and facilitation skills. Ecol. Evol. 2018, 8, 5173–5184. [Google Scholar] [CrossRef] [PubMed]
  31. Montesinos-Navarro, A.; Verdú, M.; Querejeta, J.I.; Valiente-Banuet, A. Nurse plants transfer more nitrogen to distantly related species. Ecology 2017, 98, 1300–1310. [Google Scholar] [CrossRef] [PubMed]
  32. Lorenz, K.; Lal, R. Soil organic carbon sequestration in agroforestry systems. A review. Agron. Sustain. Dev. 2014, 34, 443–454. [Google Scholar] [CrossRef]
  33. Tonucci, R.G.; Vogado, R.F.; Silva, R.D.; Pompeu, R.C.F.F.; Oda-Souza, M.; Souza, H.A.D. Agroforestry system improves soil carbon and nitrogen stocks in depth after land-use changes in the Brazilian semi-arid region. Rev. Bras. Cienc. Solo 2023, 47, e0220124. [Google Scholar] [CrossRef]
  34. Vaarst, M.; Escudero, A.G.; Chappell, M.J.; Brinkley, C.; Nijbroek, R.; Arraes, N.A.; Andreasen, L.; Gattinger, A.; De Almeida, G.F.; Bossio, D.; et al. Exploring the concept of agroecological food systems in a city-region context. Agroecol. Sustain. Food Syst. 2018, 42, 686–711. [Google Scholar] [CrossRef]
  35. Woodcock, J.; Edwards, P.; Tonne, C.; Armstrong, B.G.; Ashiru, O.; Banister, D.; Beevers, S.; Chalabi, Z.; Chowdhury, Z.; Cohen, A.; et al. Public health benefits of strategies to reduce greenhouse-gas emissions: Urban land transport. Lancet 2009, 374, 1930–1943. [Google Scholar] [CrossRef]
  36. Lucena, R.J.D.; Lima, J.R.D.; Bakke, I.A. Dynamic organization of two agroforestry systems in the semi-arid region of Paraíba and their contribution to improving the socio-economic conditions of farming families. Ciência Rural 2023, 53, e20200512. [Google Scholar] [CrossRef]
  37. Victório CP, Silva MGCF da. Urban and community agroforestry: An experience in Campo Grande, West Zone of Rio de Janeiro. InterEspaço 2020, 6, e202034. [Google Scholar] [CrossRef]
  38. Brancalion, P.H.; Meli, P.; Tymus, J.R.; Lenti, F.E.; Benini, R.M.; Silva, A.P.M.; Isernhagen, I.; Holl, K.D. What makes ecosystem restoration expensive? A systematic cost assessment of projects in Brazil. Biol. Conserv. 2019, 240, 108274. [Google Scholar] [CrossRef]
  39. Kimball, S.; Lulow, M.; Sorenson, Q.; Balazs, K.; Fang, Y.C.; Davis, S.J.; O’Connell, M.; Huxman, T.E. Cost-effective ecological restoration. Restor. Ecol. 2015, 23, 800–810. [Google Scholar] [CrossRef]
  40. Araújo, J.B.C.N.; Souza, A.N.; Joaquim, M.S.; Mattos, L.M.; Lustosa Junior, I.M. Use of the activity-based costing methodology (ABC) in the cost analysis of successional agroforestry systems. Agrofor. Syst. 2020, 94, 71–80. [Google Scholar] [CrossRef]
  41. Shimamoto, C.Y.; Botosso, P.C.; Marques, M.C.M. How much carbon is sequestered during the restoration of tropical forests? Estimates from tree species in the Brazilian Atlantic forest. Ecol. Manag. 2014, 329, 1–9. [Google Scholar] [CrossRef]
  42. Hooper, D.U.; Adair, E.C.; Cardinale, B.J.; Byrnes, J.E.; Hungate, B.A.; Matulich, K.L.; Gonzalez, A.; Duffy, J.E.; Gamfeldt, L.; O’Connor, M.I. A global synthesis reveals biodiversity loss as a major driver of ecosystem change. Nature 2012, 486, 105–108. [Google Scholar] [CrossRef]
  43. Turnbull, L.A.; Levine, J.M.; Loreau, M.; Hector, A. Coexistence, niches and biodiversity effects on ecosystem functioning. Ecol. Lett. 2013, 16, 116–127. [Google Scholar] [CrossRef]
  44. Weiskopf, S.R.; Isbell, F.; Arce-Plata, M.I.; Di Marco, M.; Harfoot, M.; Johnson, J.; Lerman, S.B.; Miller, B.W.; Morelli, T.L.; Mori, A.S.; et al. Biodiversity loss reduces global terrestrial carbon storage. Nat. Commun. 2024, 15, 4354. [Google Scholar] [CrossRef]
  45. Raupp, P.P.; Ferreira, M.C.; Alves, M.; Campos-Filho, E.M.; Sartorelli, P.A.R.; Consolaro, H.N.; Vieira, D.L.M. Direct seeding reduces the costs of tree planting for forest and savanna restoration. Ecol. Eng. 2020, 148, 105788. [Google Scholar] [CrossRef]
  46. Pérez, D.R.; González, F.; Ceballos, C.; Oneto, M.E.; Aronson, J. Direct seeding and outplantings in drylands of Argentinean Patagonia: Estimated costs, and prospects for large-scale restoration and rehabilitation. Restor. Ecol. 2019, 27, 1105–1116. [Google Scholar] [CrossRef]
  47. Nowak, D.J. Understanding i-Tree: 2021 Summary of Programs and Methods; USDA Forest Service: Madison, WI, USA, 2021. [CrossRef]
  48. Lorenzi, H. Árvores Brasileiras: Manual de Identificação e Cultivo de Plantas Arbóreas Nativas do Brasil. Vol. 2, 4th ed.; Instituto Plantarum: Nova Odessa, Brazil, 2013. [Google Scholar]
  49. Lorenzi, H. Árvores Brasileiras: Manual de Identificação e Cultivo de Plantas Arbóreas Nativas do Brasil. Vol. 1, 6th ed.; Instituto Plantarum de Estudos da Flora: São Paulo, Brazil, 2014. [Google Scholar]
  50. Lorenzi, H. Árvores Brasileiras: Manual de Identificação e Cultivo de Plantas Arbóreas Nativas do Brasil. Vol. 3, 1st ed.; Instituto Plantarum: Nova Odessa, Brazil, 2009. [Google Scholar]
  51. Carvalho, P.E.R. Espécies Arbóreas Brasileiras. Vol. 2; Embrapa Informação Tecnológica: Colombo, Brazil, 2006. [Google Scholar]
  52. Miccolis, A.; Peneireiro, F.M.; Vieira, D.L.M.; Marques, H.R.; Hoffmann, M.R.M. Restoration through agroforestry: Options for reconciling livelihoods with conservation in the Cerrado and Caatinga biomes in Brazil. Exp. Agric. 2019, 55, 208–225. [Google Scholar] [CrossRef]
  53. IBGE. Censo Brasileiro de 2022 2023. Available online: https://www.ibge.gov.br/estatisticas/downloads-estatisticas.html (accessed on 7 February 2024).
  54. Ab’Sáber, A. Os Domínios de Natureza no Brasil: Potencialidades Paisagísticas; Ateliê Editorial: São Paulo, Brazil, 2003. [Google Scholar]
  55. De Oliveira, J.R.F. O Clima Urbano em Cidade de Pequeno Porte no Semiárido Cearense: O Caso de Crateús. Ph.D Thesis, Universidade Federal do Ceará, Fortaleza, Brazil, 2020. [Google Scholar]
  56. de Sousa Monte, A.M. A planície fluvial do rio Poti nos municípios de Novo Oriente e Crateús-CE: Os barramentos e suas repercussões socioambientais. Rev. GeoUECE 2021, 3, 332–335. [Google Scholar]
  57. Costa, F.G. Geologia e Recursos Minerais da Folha Crateús—SB.24-V-C-III: Estados do Ceará e Piauí. Escala 1:100.000; CPRM: Fortaleza, Brazil, 2017. [Google Scholar]
  58. IPECE. Perfil Municipal 2017—Crateús; IPECE: Fortaleza, Brazil, 2018. [Google Scholar]
  59. Melo, E.T.; Sales, M.C.L.; de Oliveira, J.G.B. Aplicação do índice de vegetação por diferença normalizada (NDVI) para análise da degradação ambiental da microbacia hidrográfica do riacho dos Cavalos, Crateús-CE. Raega-O Espaço Geográfico Análise 2011, 23, 520–533. [Google Scholar] [CrossRef]
  60. Moro, M.F.; Martins, F.R. Métodos de levantamento do componente arbóreo-arbustivo. In Fitossociologia no Brasil: Métodos e Estudos de Caso; Felfili, J.M., Eisenlohr, P.V., Melo, M.M.d.R.F., Andrade, L.A., Meira Neto, J.A.A., Eds.; Editora UFV: Viçosa, Brazil, 2013; pp. 174–212. [Google Scholar]
  61. Scolforo, H.F.; Scolforo, J.R.S.; Mello, C.R.; Mello, J.M.; Ferraz Filho, A.C. Spatial distribution of aboveground carbon stock of the arboreal vegetation in Brazilian Biomes of Savanna, Atlantic Forest and Semi-Arid Woodland. PLoS ONE 2015, 10, e0128781. [Google Scholar] [CrossRef] [PubMed]
  62. R Core Team. R: A Language and Environment for Statistical Computing, Version 4.4.1; R Foundation for Statistical Computing: Vienna, Austria, 2024. [Google Scholar]
  63. Schuler, H.R.; Alarcon, G.G.; Joner, F.; dos Santos, K.L.; Siminski, A.; Siddique, I. Ecosystem Services from Ecological Agroforestry in Brazil: A Systematic Map of Scientific Evidence. Land 2022, 11, 83. [Google Scholar] [CrossRef]
  64. Tremblay, S.; Lucotte, M.; Revéret, J.P.; Davidson, R.; Mertens, F.; Passos, C.J.S.; Romana, C.A. Agroforestry systems as a profitable alternative to slash and burn practices in small-scale agriculture of the Brazilian Amazon. Agrofor. Syst. 2015, 89, 193–204. [Google Scholar] [CrossRef]
  65. Bresler, E.; Yasutomi, R. Drip irrigation technology in semi-arid regions and international cooperation. J. Irrig. Eng. Rural Plan. 1990, 1990, 48–62. [Google Scholar] [CrossRef]
  66. Cunha, F.N.; de Oliveira, R.C.; da Silva, N.F.; de Freitas Moura, L.M.; Teixeira, M.B.; Gomes Filho, R.R. Variabilidade temporal da uniformidade de distribuição em sistema de gotejamento. Rev. Bras. Agric. Irrig. 2013, 7, 248–257. [Google Scholar] [CrossRef]
  67. Abdul-Salam, Y.; Ovando, P.; Roberts, D. Understanding the economic barriers to the adoption of agroforestry: A Real Options analysis. J. Environ. Manag. 2022, 302, 113955. [Google Scholar] [CrossRef]
  68. Gori Maia, A.; Eusebio Gdos, S.; Fasiaben Mdo, C.R.; Moraes, A.S.; Assad, E.D.; Pugliero, V.S. The economic impacts of the diffusion of agroforestry in Brazil. Land Use Policy 2021, 108, 105489. [Google Scholar] [CrossRef]
  69. Gori Maia, A.; Burney, J.A.; Morales Martínez, J.D.; Cesano, D. Improving production and quality of life for smallholder farmers through a climate resilience program: An experience in the Brazilian Sertão. PLoS ONE 2021, 16, e0251531. [Google Scholar] [CrossRef] [PubMed]
  70. Dutra, I.; Martins, M.; Parré, J. A produção da agricultura familiar e os efeitos dos programas de incentivo. Rev. Política Agríc. 2021, 30, 94–106. [Google Scholar]
  71. Oliveira, G.C.; Torezan-Silingardi, H.M.; Anjos, D.V.; Abrahão, M.; Alves-de-Lima, L. Financial Analysis and Cost Implications of Implementing an Agroforestry System in Brazil. Agric. Rural Stud. 2024, 2, 0023. [Google Scholar] [CrossRef]
  72. Gonçalves, A.L.R. Sistemas Agroflorestais No Semiárido Brasileiro: Estratégias para Combate à Desertificação e Enfrentamento Às Mudanças Climáticas; Centro Sábia/Caatinga: Recife, Brazil, 2016. [Google Scholar]
  73. Tranchina, M.; Reubens, B.; Frey, M.; Mele, M.; Mantino, A. What challenges impede the adoption of agroforestry practices? A global perspective through a systematic literature review. Agrofor. Syst. 2024, 98, 1817–1837. [Google Scholar] [CrossRef]
  74. Martinelli Gdo, C.; Schlindwein, M.M.; Padovan, M.P.; Gimenes, R.M.T. Decreasing uncertainties and reversing paradigms on the economic performance of agroforestry systems in Brazil. Land Use Policy 2019, 80, 274–286. [Google Scholar] [CrossRef]
  75. Altieri, M.A.; Funes-Monzote, F.R.; Petersen, P. Agroecologically efficient agricultural systems for smallholder farmers: Contributions to food sovereignty. Agron. Sustain. Dev. 2012, 32, 1–13. [Google Scholar] [CrossRef]
  76. Manrique-Ascencio, A.; Prieto-Torres, D.A.; Villalobos, F.; Mercado Gómez, J.; Guevara, R. Limited drought tolerance in the neotropical seasonally dry forest plants impairs future species richness. Plant Biol. 2024. [Google Scholar] [CrossRef]
  77. Oliveira-Filho, A.T.; Cardoso, D.; Schrire, B.D.; Lewis, G.P.; Pennington, R.T.; Brummer, T.J.; Rotella, J.; Lavin, M. Stability structures tropical woody plant diversity more than seasonality: Insights into the ecology of high legume-succulent-plant biodiversity. S. Afr. J. Bot. 2013, 89, 42–57. [Google Scholar] [CrossRef]
  78. Miccolis, A.; Peneireiro, F.M.; Marques, H.R.; Vieira, D.L.; Arco-Verde, M.F.; Hoffmann, M.R.; Rehder, T.; Pereira, A.V. Agroforestry Systems for Ecological Restoration: How to Concile Conservation and Production—Options for Brazil’s Cerrado and Caatinga Biomes; Instituto Sociedade, População e Natureza—ISPN/World Agroforestry Centre—ICRAF: Brasília, Brazil, 2016. [Google Scholar]
  79. Herrera, A.M.; de Mello, A.C.L.; de Oliveira Apolinário, V.X.; Dubeux Júnior, J.C.B.; da Cunha, M.V.; dos Santos, M.V.F. Potential of Gliricidia sepium (jacq.) Kunth ex Walp. and Mimosa caesalpiniifolia Benth. in silvopastoral systems intercropped with signalgrass [Urochloa decumbens (Stapf) R.D. Webster]. Agrofor. Syst. 2021, 95, 1061–1072. [Google Scholar] [CrossRef]
  80. Pereira, A.C.H.; Endringer, D.C. Composição química, atividades biológicas e aplicabilidade da gliricídia em sistemas agroflorestais. In Café Sombreado: Uma Abordagem Multidisciplinar; Araújo, J.B.S., de Siqueira, H.M., da P. Padovan, M., Sales, E.F., Eds.; Incaper: Vitória, Brazil, 2024; pp. 173–205. [Google Scholar]
  81. Marin, A.M.P.; Menezes, R.S.C.; Silva, E.D.; Sampaio, E.V.D.S.B. Efeito da Gliricidia sepium sobre nutrientes do solo, microclima e produtividade do milho em sistema agroflorestal no Agreste Paraibano. Rev. Bras. Cienc. Solo 2006, 30, 555–564. [Google Scholar] [CrossRef]
  82. Udawatta, R.P.; Walter, D.; Jose, S. Carbon sequestration by forests and agroforests: A reality check for the United States. Carbon Footpr. 2022, 2, 2. [Google Scholar] [CrossRef]
  83. Nair, P.K.R.; Nair, V.D.; Mohan Kumar, B.; Showalter, J.M. Chapter Five—Carbon Sequestration in Agroforestry Systems. In Advances in Agronomy; Academic Press: Cambridge, MA, USA, 2010; Volume 108, pp. 237–307. [Google Scholar] [CrossRef]
  84. Lehmann, J.; Peter, I.; Steglich, C.; Gebauer, G.; Huwe, B.; Zech, W. Below-ground interactions in dryland agroforestry. Ecol. Manag. 1998, 111, 157–169. [Google Scholar] [CrossRef]
  85. Maia, S.M.F.; Xavier, F.A.S.; Oliveira, T.S.; Mendonça, E.S.; Araújo Filho, J.A. Organic carbon pools in a Luvisol under agroforestry and conventional farming systems in the semi-arid region of Ceará, Brazil. Agrofor. Syst. 2007, 71, 127–138. [Google Scholar] [CrossRef]
  86. Ramachandran Nair, P.K.; Mohan Kumar, B.; Nair, V.D. Agroforestry as a strategy for carbon sequestration. J. Plant Nutr. Soil Sci. 2009, 172, 10–23. [Google Scholar] [CrossRef]
  87. Shi, L.; Feng, W.; Xu, J.; Kuzyakov, Y. Agroforestry systems: Meta-analysis of soil carbon stocks, sequestration processes, and future potentials. Land. Degrad. Dev. 2018, 29, 3886–3897. [Google Scholar] [CrossRef]
  88. Ramos, H.M.N.; Vasconcelos, S.S.; Kato, O.R.; Castellani, D.C. Above- and belowground carbon stocks of two organic, agroforestry-based oil palm production systems in eastern Amazonia. Agrofor. Syst. 2018, 92, 221–237. [Google Scholar] [CrossRef]
  89. Cardinael, R.; Mao, Z.; Chenu, C.; Hinsinger, P. Belowground functioning of agroforestry systems: Recent advances and perspectives. Plant Soil 2020, 453, 1–13. [Google Scholar] [CrossRef]
  90. Henry, M.; Tittonell, P.; Manlay, R.J.; Bernoux, M.; Albrecht, A.; Vanlauwe, B. Biodiversity, carbon stocks and sequestration potential in aboveground biomass in smallholder farming systems of western Kenya. Agric. Ecosyst. Environ. 2009, 129, 238–252. [Google Scholar] [CrossRef]
  91. Feliciano, D.; Ledo, A.; Hillier, J.; Nayak, D.R. Which agroforestry options give the greatest soil and above ground carbon benefits in different world regions? Agric. Ecosyst. Environ. 2018, 254, 117–129. [Google Scholar] [CrossRef]
Figure 1. An agroforestry system (AS) established in the semi-arid region of Crateús, Ceará, Brazil. (A) Beginning of the harrowing process; (B) ploughed and harrowed area with marked planting rows and drip irrigation system installed in April of 2019; (C) seedling nursery and vegetable beds; (D) schematic representation of the experimental layout, illustrating the distribution of species within each biodiversity arrangement (I, II, and III).
Conservation 05 00020 g001
Figure 2. (A) Location of the municipality of Crateús within the semi-arid region of Brazil, and a detailed view highlighting the IFCE—Crateús campus, where the study area is located. (B) Aerial image of the IFCE—Crateús campus before the implementation of the agroforestry system. (C) After the establishment of the agroforestry system. (D) Overview of the AS after three years of development.
Conservation 05 00020 g002
Figure 3. Carbon stock and basal area distribution among species and biodiversity arrangements in the agroforestry system. (A) Accumulated carbon stock (Mg ha−1) per species; (B) carbon stock across biodiversity arrangements; (C) accumulated basal area (m2 ha−1) per species; (D) basal area across biodiversity arrangements. Triangles indicate means; boxes represent interquartile ranges (IQR), horizontal lines denote medians, and whiskers extend to 1.5 × IQR.
Conservation 05 00020 g003
Table 1. Biodiversity arrangements (I, II, and III) implemented in the agroforestry system, indicating the selected species with the absolute frequency planted in each arrangement (in brackets), their main functional uses (fruit production, timber, forage), and respective wood density values (g cm−3) obtained from literature references. Species uses highlight their multifunctional characteristics relevant to ecological restoration, forage availability, and potential socioeconomic benefits in semi-arid environments.
SpeciesOriginal Biodiversity
Arrangements
Post-Replacement Biodiversity ArrangementsUseWood Density
(g cm−3)
Reference
Tamarindus indicaI (12)I (15)Fruit0.98[47]
Anadenanthera colubrinaI (12)I (13)Timber/Forage0.93[48]
Moringa oleiferaI (12)I (11)Forage0.26[47]
Astronium urundeuvaI (12)-Timber1.19[49]
Malpighia emarginataI (12)I (9), II (1)Fruit0.70[47]
Ceiba glazioviiI (12)I (15)Timber0.59[48]
Hymenaea sp.II (12)-Timber0.95[50]
Mimosa caesalpiniaefolia-II (8), III (1)Timber/Forage1.10[51]
Amburana cearensisII (12)II (1)Timber/Forage0.60[49]
Gliricidia sepiumII (12)I (1), II (12)Forage0.58[47]
Citrus sp. II (12)II (5)Fruit0.74[47]
Annona squamosaII (12)II (8)Fruit/Forage0.49[47]
Cenostigma pyramidaleII (12)II (13)Timber/Forage0.95[49]
Talisia esculentaIII (12)III (2)Fruit1.10[49]
Libidibia ferreaIII (12)III (9)Forage/Timber1.22[49]
Aspidosperma pyrifoliumIII (12)III (5)Timber0.79[48]
Morus albaIII (12)III (4)Fruit0.55[47]
Anacardium occidentaleIII (12)III (2)Fruit0.42[49]
Handroanthus impetiginosusIII (12)III (6)Timber0.96[49]
Spondias purpurea-III (1)Fruit/Forage0.33[47]
Leucaena leucocephala-I (1), III (5)Forage0.69[47]
Table 2. Estimated costs for the implementation and maintenance of an agroforestry system in the semiarid region using a drip irrigation system.
MaterialCost TypeUnitQuantityUnit CostTotal Cost
Irrigation waterMaintenancem364.8 m3 month−1BRL 4.92 m−3 (USD 0.95 m−3)BRL 1912.8 * (USD 369.33)
3/4″ HosePreparationm100BRL 136.27 (USD 26.32)BRL 136.27 (USD 26.31)
Drip TapePreparationm270BRL 0.40 (USD 0.08)BRL 110.16 (USD 21.27)
90° Double Internal Elbow 3/4″Preparationunit4BRL 0.76 (USD 0.15)BRL 3.04 (USD 0.59)
3/4″ × 1/2″ Triple Reduction TeePreparationunit18BRL 3.50 (USD 0.68)BRL 63.00 (USD 12.16)
Drip Tape PlugPreparationunit18BRL 2.50 (USD 0.48)BRL 45.00 (USD 8.69)
3/4″ Ball ValvePreparationunit2BRL 38.90 (USD 7.51)BRL 77.80 (USD 15.02)
3/4″ Triple TeePreparationunit4BRL 5.60 (USD 1.08)BRL 22.40 (USD 4.33)
Fencing service (tractor-assisted)Preparationhour1BRL 360.00 (USD 69.51)BRL 360.00 (USD 69.51)
Seedlings (nursery production)Plantingunit246BRL 5.00 (USD 0.97)BRL 1230.00 (USD 237.49)
Labor for planting and preparationPreparation/Plantingday10BRL 80.00 (USD 15.45)BRL 800.00 (USD 154.47)
Brush clearingMaintenanceday3BRL 120.00 (USD 23.17)BRL 360.00 (USD 69.51)
TotalBRL 5120.47 (USD 988.68)
* Total value for 6 months of use of the irrigation system.
Table 3. Phytosociological parameters of the species used in the agroforestry system three years after implementation. Abundance (n), absolute density (AD), relative density (RD), absolute frequency (AF), relative frequency (RF), absolute dominance (DoA), relative dominance (DoR), importance value index (IVI), average carbon per individual (Carbon), and accumulated carbon stock per species (Carbon Stock).
FamilySpeciesCommon NamenAD (ind ha−1)RD (%)DoA (m2)DoR (%)AF (%)RF (%)IVI (%)Carbon (g ind−1)Carbon Stock (Mg ha−1)
MalvaceaeCeiba glaziovii (Kuntze) K.Schum.Paineira-branca15168.3510.141.5123.6738.897.8713.8927,734.05 ± 15,568.884.6690
FabaceaeGliricidia sepium (Jacq.) Kunth ex Walp.Gliricidia13145.908.781.4622.9038.897.8713.1830,162.24 ± 16,014.74.4008
MoringaceaeMoringa oleifera Lam.Moringa11123.467.431.4322.3438.897.8712.5541,852.69 ± 36,211.275.1670
FabaceaeAnadenanthera colubrina (Vell.) BrenanAngico13145.908.780.578.9738.897.878.549013.17 ± 8437.411.3151
FabaceaeTamarindus indica L.Tamarindo15168.3510.140.264.1438.897.877.382048.93 ± 1502.980.3449
FabaceaeMimosa caesalpiniifolia Benth.Sabiá9101.016.080.304.6638.897.876.205541.54 ± 6211.170.5598
FabaceaeCenostigma pyramidale (Tul.) Gagnon & G.P.LewisCatingueira13145.908.780.081.3233.336.745.62527.55 ± 420.970.0770
MalpighiaceaeMalpighia emarginata DC.Acerola10112.236.760.061.0133.336.744.84315.04 ± 292.340.0353
AnnonaceaeAnnona squamosa L.Ata889.795.410.030.4833.336.744.21177.75 ± 89.390.0160
FabaceaeLibidibia ferrea (Mart. ex Tul.) L.P.QueirozJucá9101.016.080.050.7827.785.624.16422.88 ± 631.470.0427
FabaceaeLeucaena leucocephala (Lam.) de WitLeuceana667.344.050.213.3222.224.493.966945.99 ± 5846.560.4677
BignoniaceaeHandroanthus impetiginosus (Mart. ex DC.) MattosIpê667.344.050.071.1122.224.493.221098.68 ± 738.30.074
MoraceaeMorus alba L.Amora444.892.700.264.0511.112.253.009789.3 ± 7258.180.4395
RutaceaeCitrus sp.Limão556.123.380.030.4322.224.492.77354.05 ± 382.480.0199
ApocynaceaeaAspidosperma pyrifolium Mart. & Zucc.Pereiro556.123.380.010.1322.224.492.6746.29 ± 59.850.0026
AnacardiaceaeAnacardium occidentale L.Caju222.451.350.030.5311.112.251.372386.44 ± 2906.560.0536
SapindaceaTalisia esculenta (Cambess.) Radlk.Pitomba222.451.350.000.0311.112.251.2127.94 ± 31.490.0006
AnacardiaceaeSpondias purpurea L.Seriguela111.220.680.010.115.561.120.64186.870.0021
FabaceaeAmburana cearensis (Allemão) A.C.Sm.Amburana111.220.680.000.025.561.120.6119.540.0002
Disclaimer/Publisher’s Note: The statements, opinions and data contained in all publications are solely those of the individual author(s) and contributor(s) and not of MDPI and/or the editor(s). MDPI and/or the editor(s) disclaim responsibility for any injury to people or property resulting from any ideas, methods, instructions or products referred to in the content.

