Increased Stress Levels in Caged Honeybee (Apis mellifera) (Hymenoptera: Apidae) Workers


Abstract
1. Introduction
2. Results
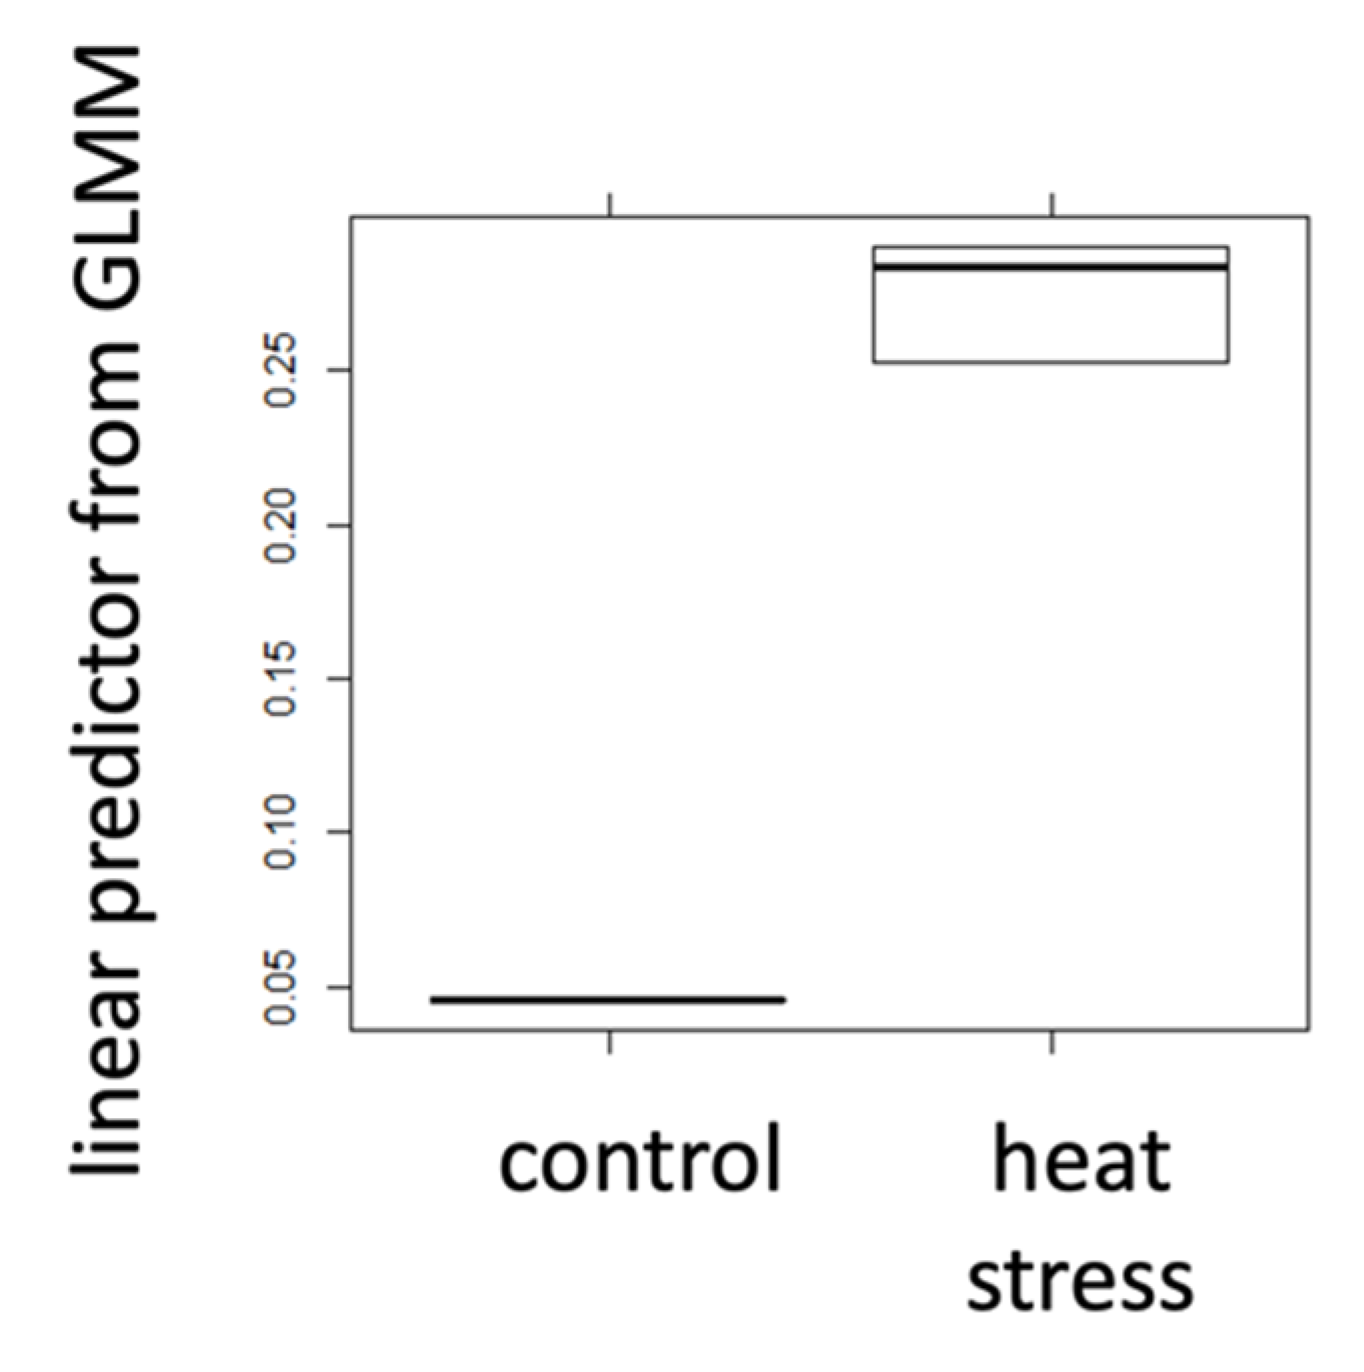
2.1. Positive Control Treatments
2.2. Caged Bees of Varying Group Sizes
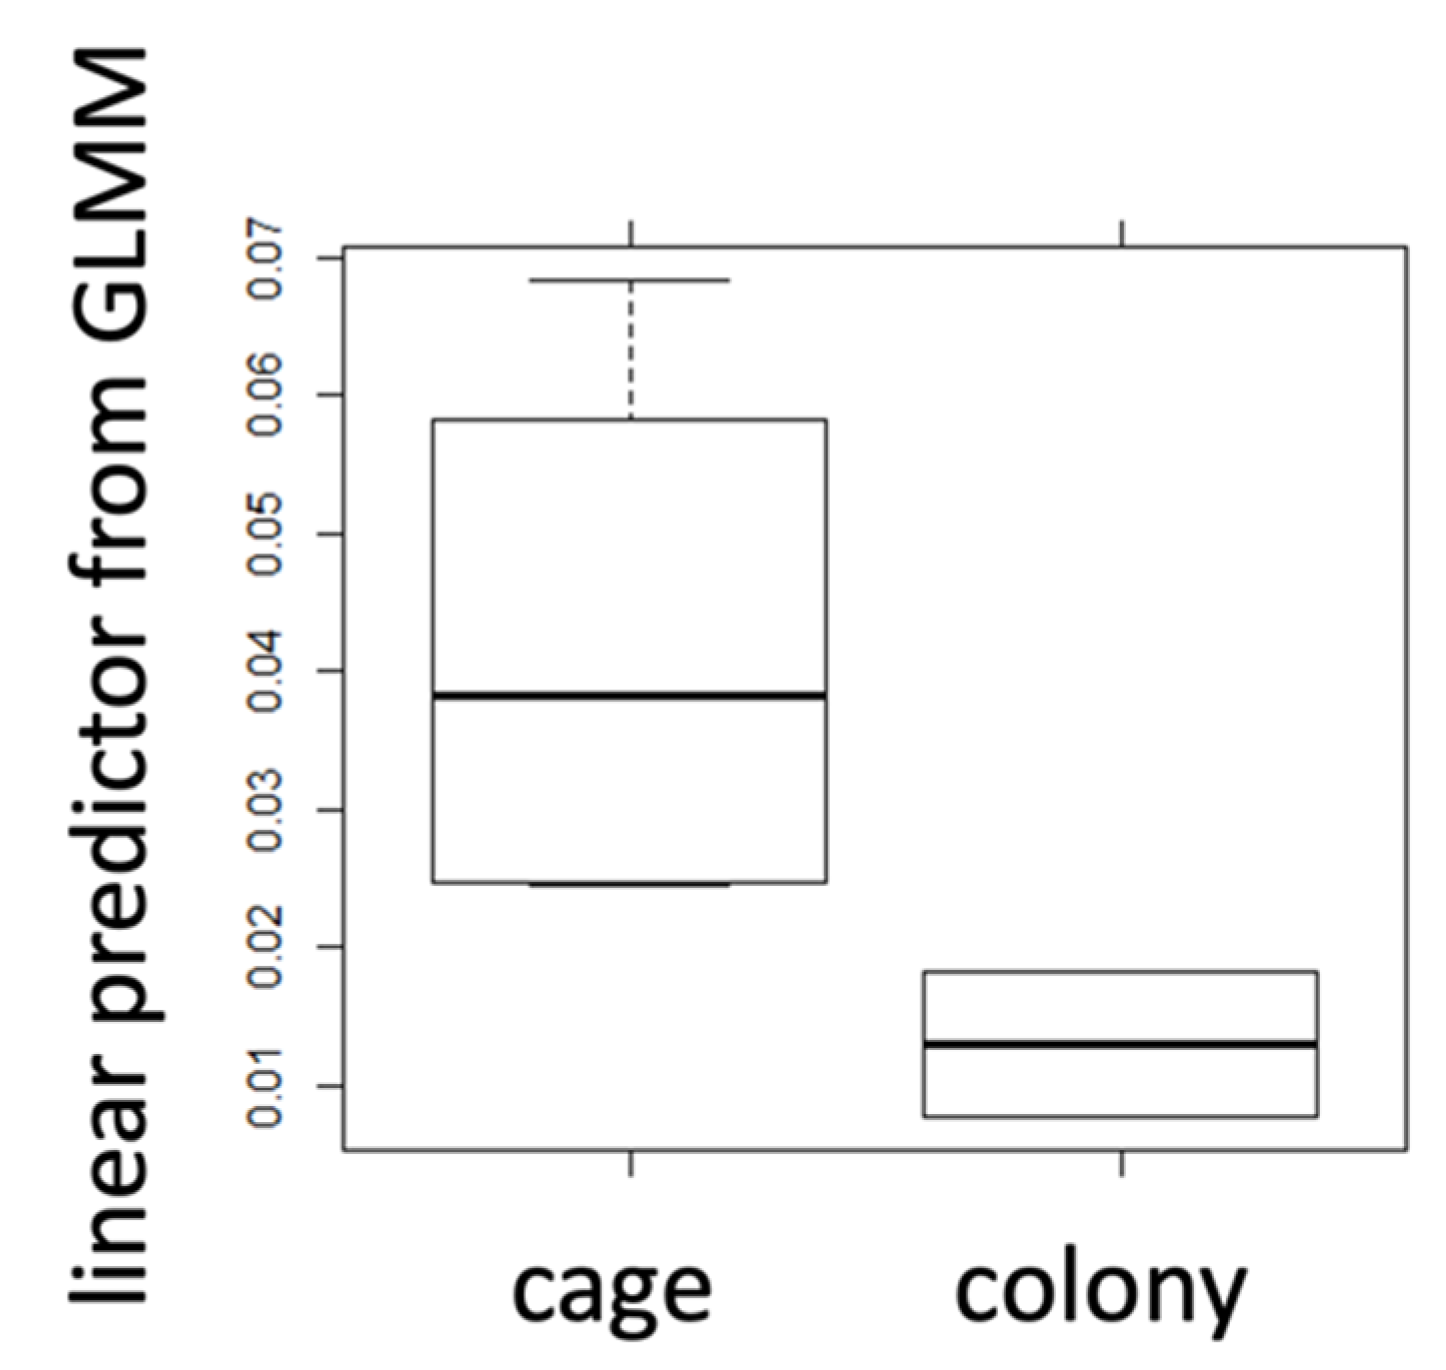
2.3. Caged Bees vs. Bees from Natural Colony
3. Discussion
4. Materials and Methods
4.1. Control and Treatment Groups
4.2. Positive Control Treatments
4.3. Hemolymph Collection
4.4. Glucose/Trehalose Assay
4.5. RNA Extraction, cDNA Synthesis and qRT-PCR
4.6. Normalization of Gene Expression
4.7. Statistical Data Analysis
Supplementary Materials
Funding
Data Availability Statement
Acknowledgments
Conflicts of Interest
References
- Williams, G.R.; Alaux, C.; Costa, C.; Csáki, T.; Doublet, V.; Eisenhardt, D.; Fries, I.; Kuhn, R.; McMahon, D.P.; Medrzycki, P.; et al. Standard methods for maintaining adult Apis mellifera in cages under in vitro laboratory conditions. J. Apic. Res. 2013, 52, 1–36. [Google Scholar] [CrossRef]
- Desneux, N.; Decourtye, A.; Delpuech, J.M. The Sublethal Effects of Pesticides on Beneficial Arthropods. Annu. Rev. Entomol. 2007, 52, 81–106. [Google Scholar] [CrossRef]
- Huang, S.K.; Csaki, T.; Doublet, V.; Dussaubat, C.; Evans, J.D.; Gajda, A.M.; Gregorc, A.; Hamilton, M.C.; Kamler, M.; Lecocq, A.; et al. Evaluation of cage designs and feeding regimes for honey bee (Hymenoptera: Apidae) laboratory experiments. J. Econ. Entomol. 2014, 107, 54–62. [Google Scholar] [CrossRef] [PubMed]
- Winston, M.L. The Biology of the Honey Bee; Harvard University Press: Cambridge, MA, USA, 1987. [Google Scholar]
- Lundin, O.; Rundlöf, M.; Smith, H.G.; Fries, I.; Bommarco, R. Neonicotinoid Insecticides and Their Impacts on Bees: A Systematic Review of Research Approaches and Identification of Knowledge Gaps. PLoS ONE 2015, 10, e0136928. [Google Scholar] [CrossRef] [PubMed]
- Sørensen, J.G.; Loeschcke, V. Larval crowding in Drosophila melanogaster induces Hsp70 expression, and leads to increased adult longevity and adult thermal stress resistance. J. Ins. Physiol. 2001, 47, 1301–1307. [Google Scholar] [CrossRef]
- Richter, J.; Helbing, S.; Erler, S.; Lattorff, H.M.G. Social context dependent immune gene expression in bumblebees (Bombus terrestris). Behav. Ecol. Sociobiol. 2012, 66, 791–796. [Google Scholar] [CrossRef]
- Ruiz-González, M.X.; Moret, Y.; Brown, M.J.F. Rapid induction of immune density-dependent prophylaxis in adult social insects. Biol. Lett. 2009, 5, 781–783. [Google Scholar] [CrossRef]
- Lattorff, H.M.G. Tissue specificity in social context-dependent lysozyme expression in bumblebees. Antibiotics 2020, 9, 130. [Google Scholar] [CrossRef] [PubMed]
- Koto, A.; Mersch, D.; Hollis, B.; Keller, L. Social isolation causes mortality by disrupting energy homeostasis in ants. Behav. Ecol. Sociobiol. 2015, 69, 583–591. [Google Scholar] [CrossRef]
- Even, N.; Devaud, J.M.; Barron, A.B. General Stress Responses in the Honey Bee. Insects 2012, 3, 1271–1298. [Google Scholar] [CrossRef] [PubMed]
- Davenport, A.P.; Evans, P.D. Stress-induced changes in the octopamine levels of insect haemolymph. Insect Biochem. 1984, 14, 135–143. [Google Scholar] [CrossRef]
- Suo, S.; Kimura, Y.; van Tol, H.H. Starvation induces cAMP response element-binding protein-dependent gene expression through octopamine-Gq signaling in Caenorhabditis elegans. J. Neurosci. 2006, 26, 10082–10090. [Google Scholar] [CrossRef] [PubMed]
- Elekonich, M.M. Extreme thermotolerance and behavioral induction of 70-kDa heat shock proteins and their encoding genes in honey bees. Cell Stress Chap. 2009, 14, 219–226. [Google Scholar] [CrossRef]
- Hranitz, J.M.; Abramson, C.I.; Carter, R.P. Ethanol increases HSP70 concentrations in honeybee (Apis mellifera L.) brain tissue. Alcohol 2010, 44, 275–282. [Google Scholar] [CrossRef]
- Crailsheim, K. Intestinal transport of sugars in the honeybee (Apis mellifera). J. Insect Physiol. 1988, 34, 839–846. [Google Scholar] [CrossRef]
- Woodring, J.; Boulden, M.; Das, S.; Gäde, G. Studies on Blood Sugar Homeostasis in the Honeybee (Apis mellifera, L.). J. Insect Physiol. 1993, 39, 89–97. [Google Scholar] [CrossRef]
- Thompson, S.N. Trehalose—The insect “blood” sugar. Adv. Insect Physiol. 2003, 31, 206–261. [Google Scholar] [CrossRef]
- Mayack, C.; Naug, D. Energetic stress in the honeybee Apis mellifera from Nosema ceranae infection. J. Invertebr. Pathol. 2009, 100, 185–188. [Google Scholar] [CrossRef]
- Mayack, C.; Naug, D. Parasitic infection leads to decline in hemolymph sugar levels in honeybee foragers. J. Insect Physiol. 2010, 56, 1572–1575. [Google Scholar] [CrossRef]
- Lattorff, H.M.G.; Moritz, R.F.A. Genetic underpinnings of division of labor in the honeybee. Trends Genet. 2013, 29, 641–648. [Google Scholar] [CrossRef]
- Lattorff, H.M.G.; Moritz, R.F.A. Context dependent bias in honeybee queen selection: Swarm versus emergency queens. Behav. Ecol. Sociobiol. 2016, 70, 1411–1417. [Google Scholar] [CrossRef]
- Leoncini, I.; Le Conte, Y.; Costagliola, G.; Plettner, E.; Toth, A.L.; Wang, M.; Huang, Z.; Bécard, J.M.; Crauser, D.; Slessor, K.N.; et al. Regulation of behavioral maturation by a primer pheromone produced by adult worker honey bees. Proc. Natl. Acad. Sci. USA 2004, 101, 17559–17564. [Google Scholar] [CrossRef] [PubMed]
- Blatt, J.; Roces, F. Haemolymph sugar levels in foraging honeybees (Apis mellifera carnica): Dependence on metabolic rate and in vivo measurement of maximal rates of trehalose synthesis. J. Exp. Biol. 2001, 204, 2709–2716. [Google Scholar] [CrossRef]
- Alburaki, M.; Karim, S.; Lamour, K.; Adamczyk, J.; Stewart, S.D. RNA-seq reveals disruption of gene regulation when honey bees are caged and deprived of hive conditions. J. Exp. Biol. 2019, 222, jeb207761. [Google Scholar] [CrossRef]
- Vidau, C.; Diogon, M.; Aufauvre, J.; Fontbonne, R.; Viguès, B.; Brunet, J.L.; Texier, C.; Biron, D.G.; Blot, N.; El Alaoui, H.; et al. Exposure to sublethal doses of fipronil and thiacloprid highly increases mortality of honeybees previously infected by Nosema ceranae. PLoS ONE 2011, 6, e21550. [Google Scholar] [CrossRef]
- Retschnig, G.; Williams, G.R.; Odemer, R.; Boltin, J.; Di Poto, C.; Mehmann, M.M.; Retschnig, P.; Winiger, P.; Rosenkranz, P.; Neumann, P. Effects, but no interactions, of ubiquitous pesticide and parasite stressors on honey bee (Apis mellifera) lifespan and behaviour in a colony environment. Environ. Microbiol. 2015, 17, 4322–4331. [Google Scholar] [CrossRef]
- Henry, M.; Cerrutti, N.; Aupinel, P.; Decourtye, A.; Gayrard, M.; Odoux, J.F.; Pissard, A.; Rüger, C.; Bretagnolle, V. Reconciling laboratory and field assessments of neonicotinoid toxicity to honeybees. Proc. R. Soc. B 2015, 282, 20152110. [Google Scholar] [CrossRef]
- Fischer, P.; Grozinger, C.M. Pheromonal regulation of starvation resistance in honey bee workers (Apis mellifera). Naturwissenschaften 2008, 95, 723–729. [Google Scholar] [CrossRef]
- Morgan, S.M.; Butz Huryn, V.M.; Downes, S.R.; Mercer, A.R. The effects of queenlessness on the maturation of the honey bee olfactory system. Behav. Brain Res. 1998, 91, 115–126. [Google Scholar] [CrossRef]
- Yang, K.C.; Peng, Z.W.; Lin, C.H.; Wu, M.C. A new design of bee cage for laboratory experiments: Nutritional assessment of supplemental diets in honey bees (Apis mellifera). Apidologie 2021, 52, 418–431. [Google Scholar] [CrossRef]
- Hartfelder, K.; Bitondi, M.M.G.; Brent, C.S.; Guidugli-Lazzarini, K.R.; Simões, Z.L.P.; Stabentheiner, A.; Tanaka, E.D.; Wang, Y. Standard methods for physiology and biochemistry research in Apis mellifera. J. Apic. Res. 2013, 52, 1–48. [Google Scholar] [CrossRef]
- Chomczynski, P.; Sacchi, N. Single-step method of RNA isolation by acid guanidinium thiocyanate-phenol-chloroform extraction. Anal. Biochem. 1987, 162, 156–159. [Google Scholar] [CrossRef]
- Lourenço, A.P.; Mackert, A.; Cristino, A.S.; Simões, Z.L.P. Validation of reference genes for gene expression studies in the honey bee, Apis mellifera, by quantitative real-time RT-PCR. Apidologie 2008, 39, 372–385. [Google Scholar] [CrossRef]
- Buttstedt, A.; Moritz, R.F.A.; Erler, S. More than royal food—Major royal jelly protein genes in sexuals and workers of the honeybee Apis mellifera. Front. Zool. 2013, 10, 72. [Google Scholar] [CrossRef]
- Andersen, C.L.; Ledet-Jensen, J.; Ørntoft, T. Normalization of real-time quantitative RT-PCR data: A model based variance estimation approach to identify genes suited for normalization—Applied to bladder- and colon-cancer data-sets. Canc. Res. 2004, 64, 5245–5250. [Google Scholar] [CrossRef]
- Pfaffl, M.W. A new mathematical model for relative quantification in real-time RT-PCR. Nucl. Acids Res. 2001, 29, e45. [Google Scholar] [CrossRef]
- Erler, S.; Popp, M.; Lattorff, H.M.G. Dynamics of Immune System Gene Expression upon Bacterial Challenge and Wounding in a Social Insect (Bombus terrestris). PLoS ONE 2011, 6, e18126. [Google Scholar] [CrossRef]
- Ramakers, C.; Ruijter, J.M.; Deprez, R.H.L.; Moorman, A.F.M. Assumption-free analysis of quantitative real-time polymerase chain reaction (PCR) data. Neurosci. Lett. 2003, 339, 62–66. [Google Scholar] [CrossRef]
- R Development Core Team. R: A Language and Environment for Statistical Computing; R Foundation for Statistical Computing: Vienna, Austria, 2008. [Google Scholar]
- Bates, D.; Maechler, M.; Bolker, B.; Walker, S. Fitting Linear Mixed-Effects Models Using lme4. J. Stat. Software 2015, 67, 1–48. [Google Scholar] [CrossRef]
- Venables, W.N.; Ripley, B.D. Modern Applied Statistics with S, 4th ed.; Springer: New York, NY, USA, 2002. [Google Scholar]
- Hothorn, T.; Bretz, F.; Westfall, P. Simultaneous Inference in General Parametric Models. Biomet. J. 2008, 50, 346–363. [Google Scholar] [CrossRef]
- Cohen, J. Statistical Power Analysis for the Behavioral Sciences, 2nd ed.; Lawrence Erlbaum Associates: Hillsdale, NJ, USA, 1988. [Google Scholar]


| hsp70AB | Glucose | Trehalose | ||||
|---|---|---|---|---|---|---|
| heat | control | starvation | control | starvation | control | |
| mean | 0.267 | 0.045 | 0.173 | 1.441 | 0.292 | 0.957 |
| s.d. | 0.07 | 0.04 | 0.18 | 0.36 | 0.11 | 0.20 |
| N | 30 | 10 | 30 | 8 | 30 | 8 |
| t-test | 8.8 × 10⁻⁶ | 2.2 × 10⁻¹⁶ | 1.3 × 10⁻¹² | |||
| Cohen’s d | 16.79 | 11.27 | 12.11 | |||
| r | 0.76 | 0.65 | 0.67 | |||
| sign. | *** | *** | *** | |||
| cage | colony | cage | colony | cage | colony | |
| mean | 0.042 | 0.017 | 0.446 | 0.491 | 0.319 | 0.460 |
| s.d. | 0.05 | 0.01 | 0.32 | 0.35 | 0.19 | 0.24 |
| N | 42 | 20 | 128 | 20 | 128 | 20 |
| t-test | 0.009 | 0.55 | 0.002 | |||
| Cohen’s d | 1.34 | 0.45 | 1.86 | |||
| r | 0.23 | 0.05 | 0.18 | |||
| sign. | * | n.s. | * | |||
Publisher’s Note: MDPI stays neutral with regard to jurisdictional claims in published maps and institutional affiliations. |
© 2022 by the author. Licensee MDPI, Basel, Switzerland. This article is an open access article distributed under the terms and conditions of the Creative Commons Attribution (CC BY) license (https://creativecommons.org/licenses/by/4.0/).
Share and Cite
Lattorff, H.M.G. Increased Stress Levels in Caged Honeybee (Apis mellifera) (Hymenoptera: Apidae) Workers. Stresses 2022, 2, 373-383. https://doi.org/10.3390/stresses2040026
Lattorff HMG. Increased Stress Levels in Caged Honeybee (Apis mellifera) (Hymenoptera: Apidae) Workers. Stresses. 2022; 2(4):373-383. https://doi.org/10.3390/stresses2040026
Chicago/Turabian StyleLattorff, H. Michael G. 2022. "Increased Stress Levels in Caged Honeybee (Apis mellifera) (Hymenoptera: Apidae) Workers" Stresses 2, no. 4: 373-383. https://doi.org/10.3390/stresses2040026
APA StyleLattorff, H. M. G. (2022). Increased Stress Levels in Caged Honeybee (Apis mellifera) (Hymenoptera: Apidae) Workers. Stresses, 2(4), 373-383. https://doi.org/10.3390/stresses2040026