Innovation Pattern Heterogeneity and Firm Strategic Agility: Push- and Pull-Effects of COVID-19 on Firms’ Innovation Strategies


Abstract
1. Introduction
2. Data Description and Construction of Indicators
2.1. Data Sources and Description of the Sample
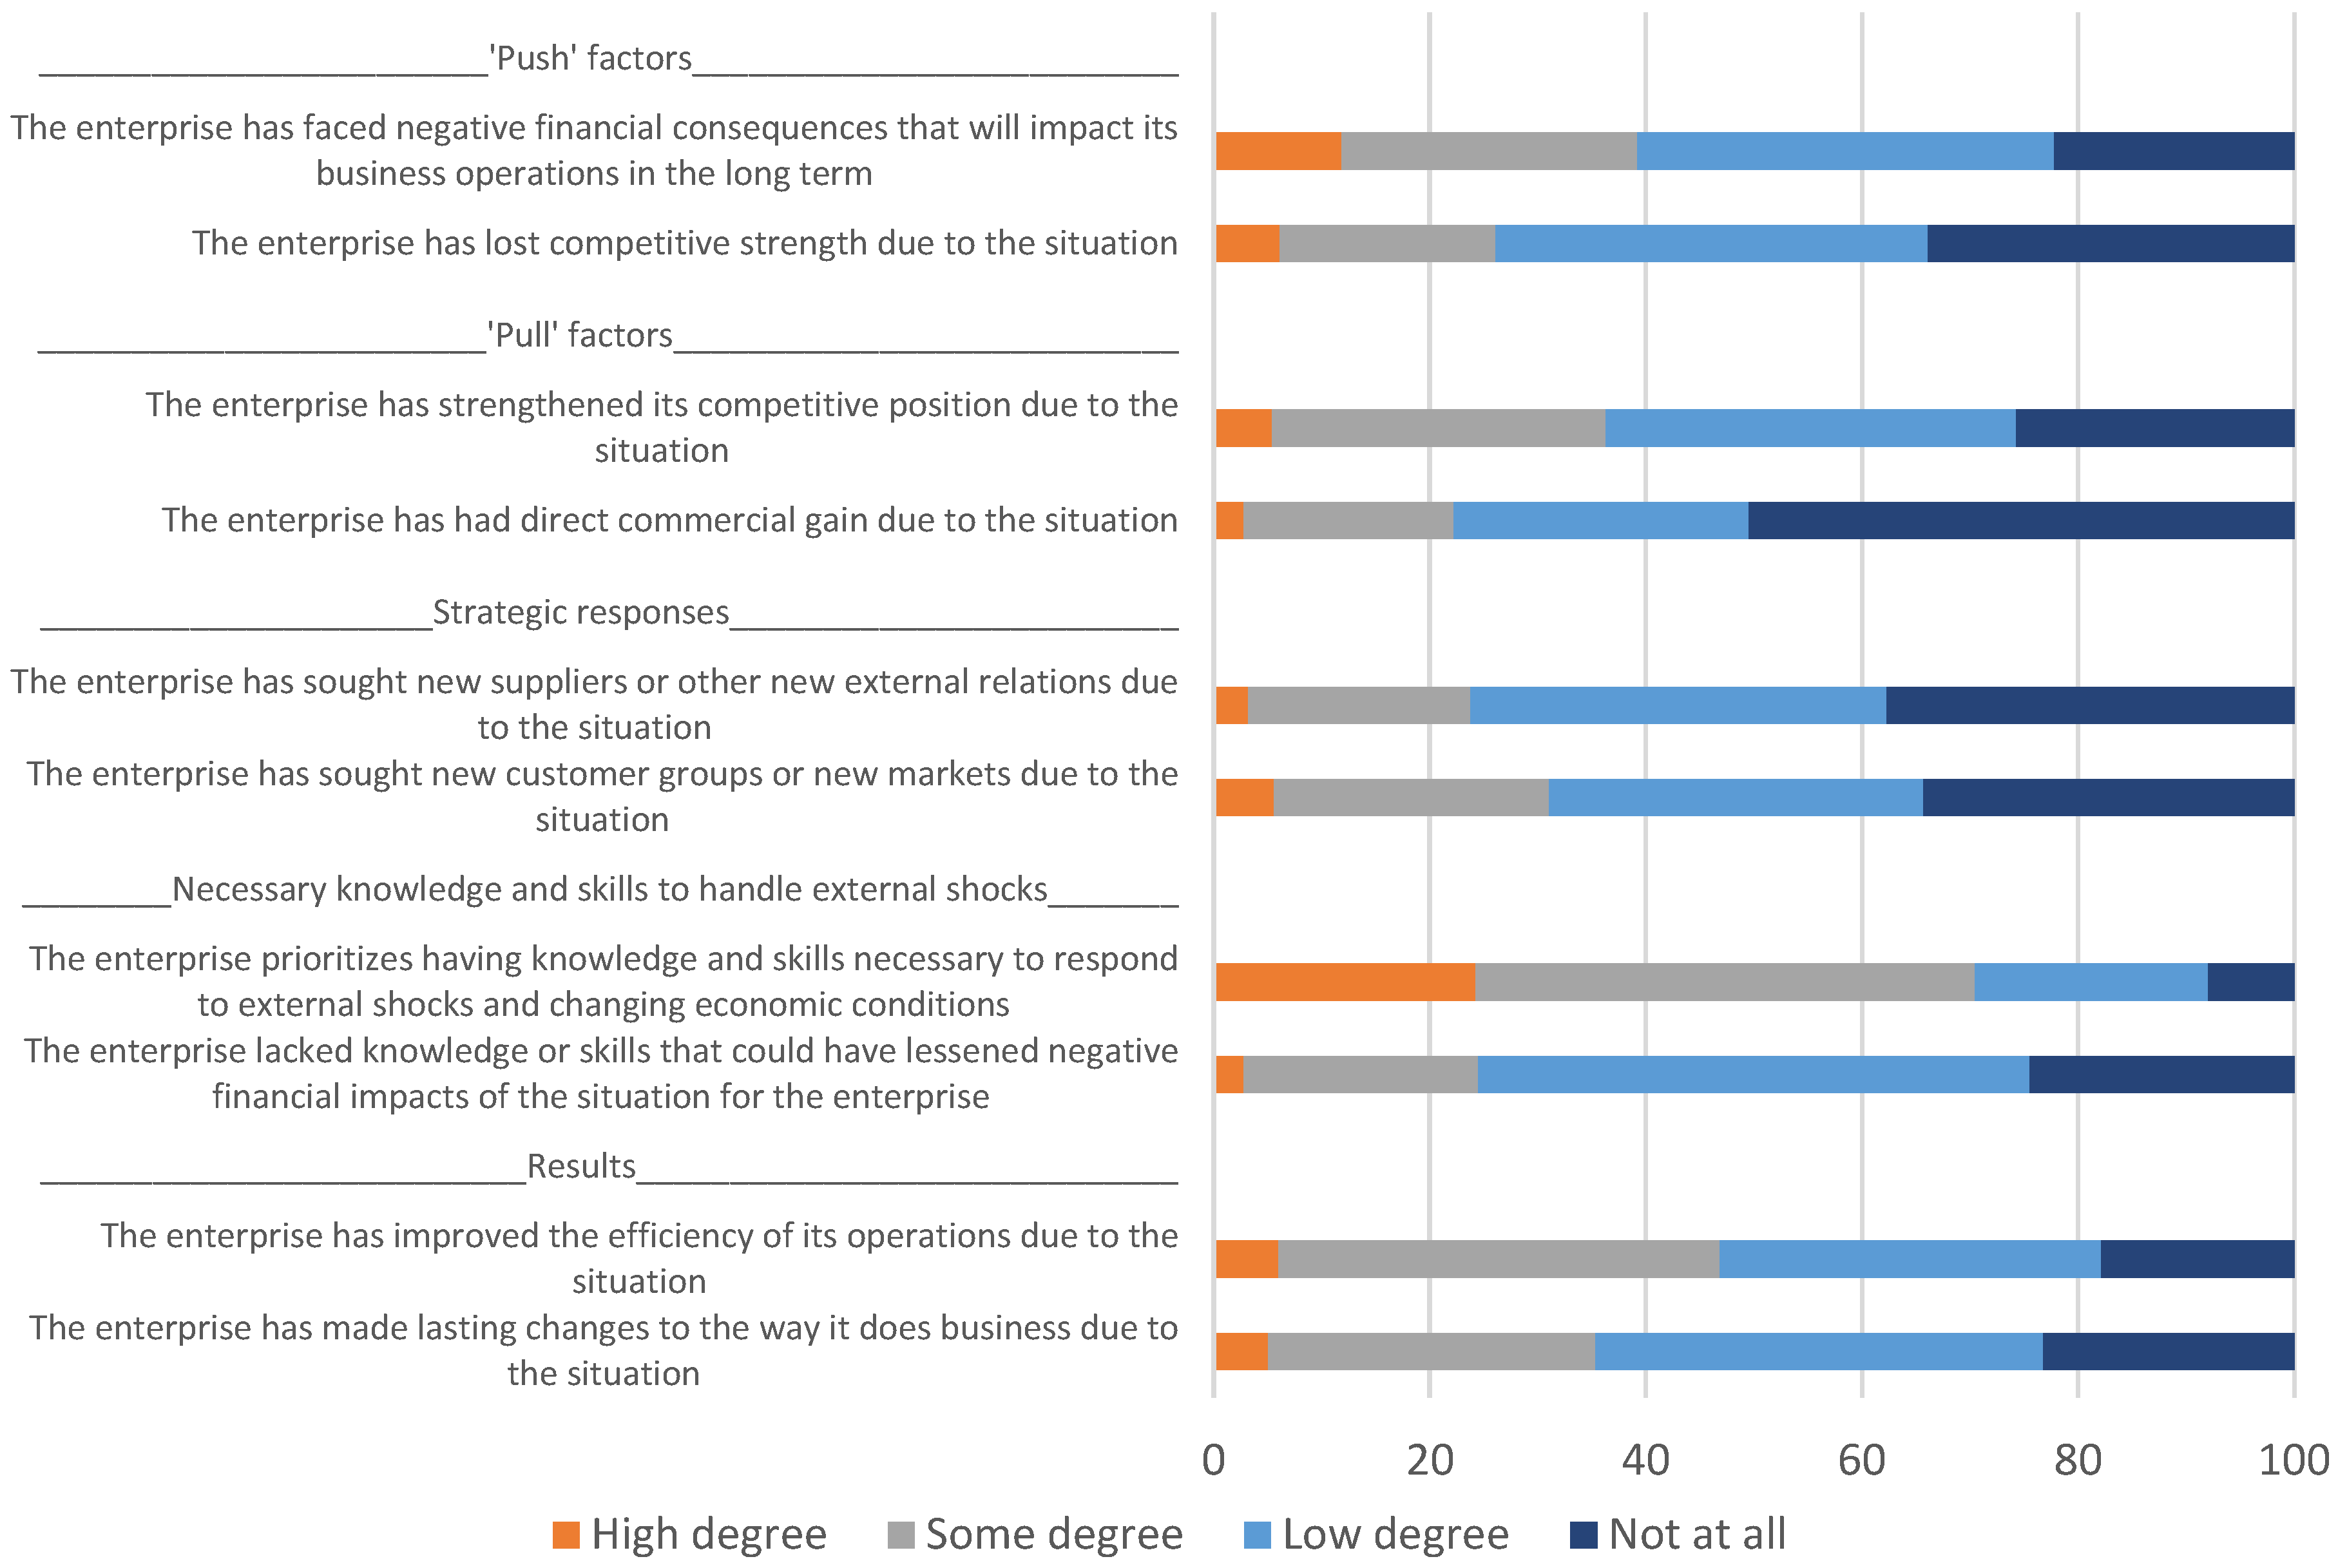
2.2. Construction of Indicators for Negative Shock, Positive Shock and Strategic Response
- Negative shock (NS) as a result of COVID-19 (‘push’ factors)
- ○
- NS1: Has the company experienced financial consequences, as a result of the situation surrounding COVID-19, that will affect the company negatively in the long term?
- ○
- NS2: Has the company lost competitiveness due to the situation around COVID-19?
- Positive shock (PS) as a result of COVID-19 (‘pull’ factors)
- ○
- PS1: Has the company made a commercial profit as a result of the situation surrounding COVID-19?
- ○
- PS2: Has the company strengthened its position in relation to its competitors due to the situation around COVID-19?
- Strategic response (SR)
- ○
- SR1: Has the company sought new markets or customer groups as a result of the situation around COVID-19?
- ○
- SR2: Has the company sought new suppliers or other external relationships due to the situation around COVID-19?
2.3. Greater Focus on Special Development of Goods and Services During the Pandemic
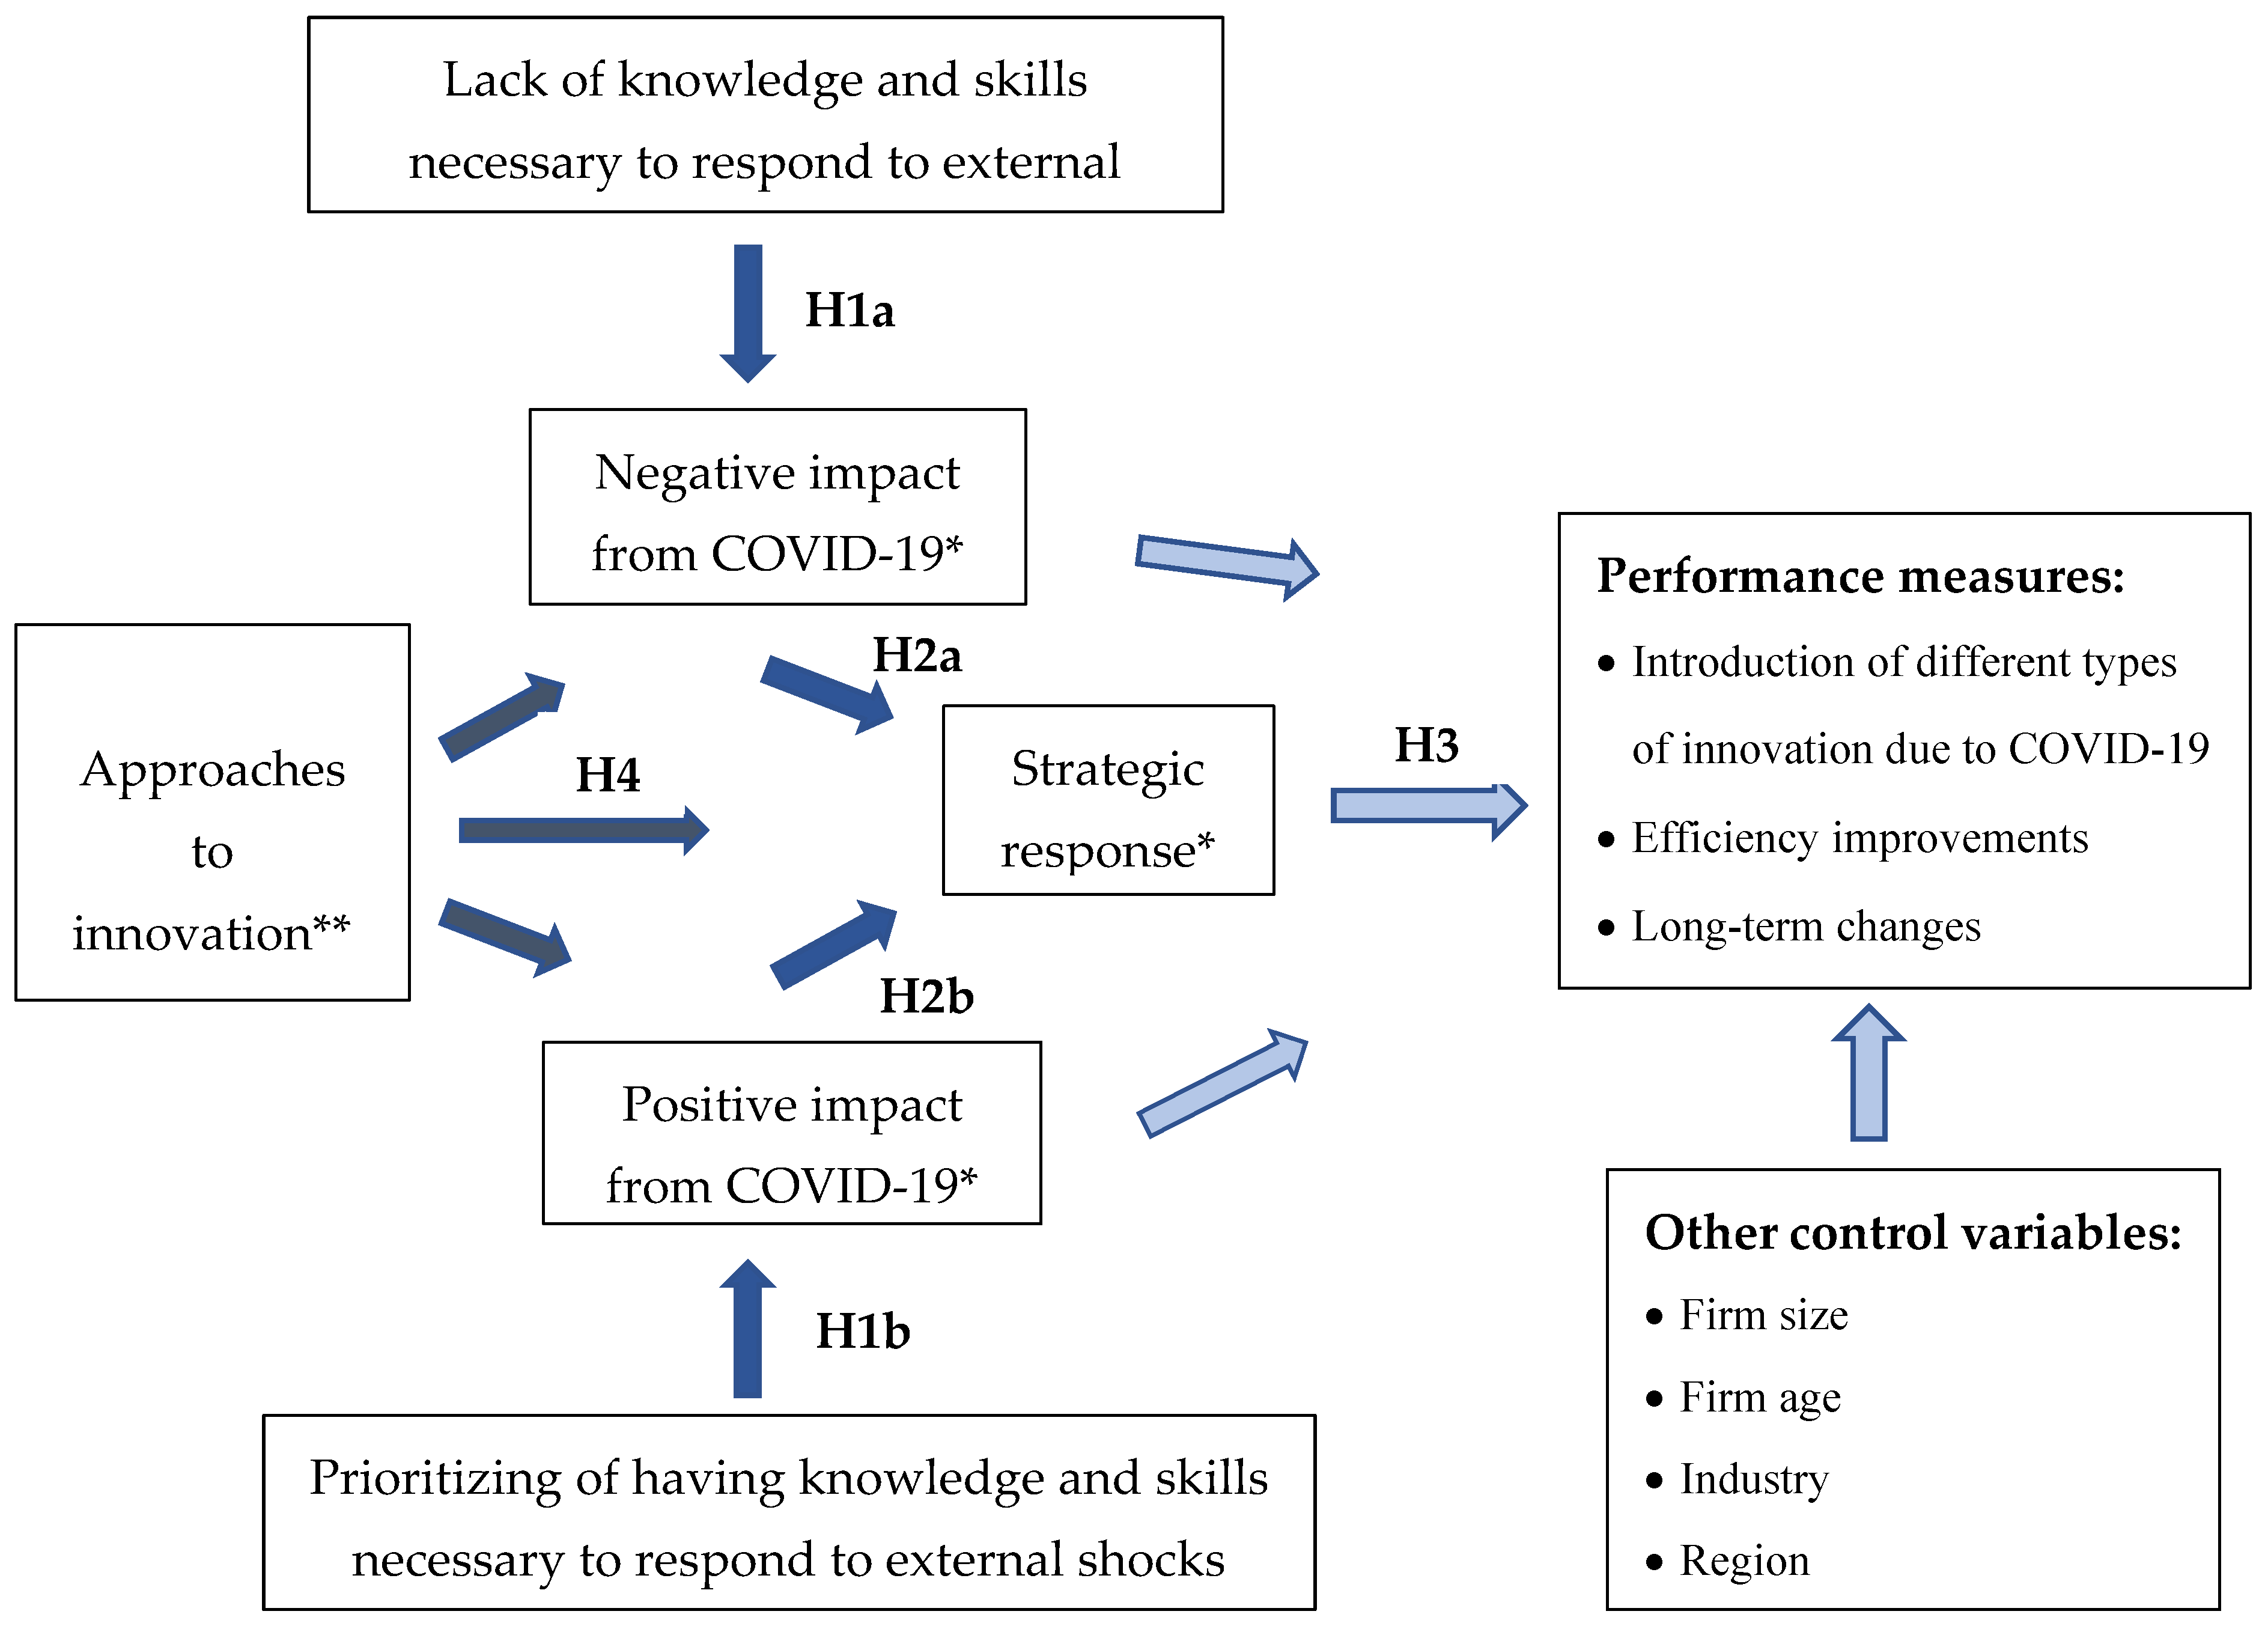
3. Empirical Model and Estimation Results
3.1. Description of Quantitative Model and Estimation Approach
3.2. Skills to Deal with External Shocks Were Important During the Pandemic
3.3. Those Who Tried to Find New Customer Groups and Markets Innovated Most During the Pandemic
3.4. Changes in Business Processes During the Pandemic
3.5. Increased Efficiency and Long-Lasting Changes in Business Operations
4. Concluding Remarks and Discussion
Funding
Institutional Review Board Statement
Informed Consent Statement
Data Availability Statement
Acknowledgments
Conflicts of Interest
Appendix A. Construction of the Indicators ‘Negative Shock’, ‘Positive Shock’ and ‘Strategic Response’ as a Result of the Situation Surrounding COVID-19

| Indicators (Latent Variables) | Standardized Factor Loading | AVE | CR | Alpha | RRC |
|---|---|---|---|---|---|
| Negative shock (NS) as a result of COVID-19 (‘push’ factors) | 0.617 | 0.763 | 0.732 | 0.764 | |
| NS1: The enterprise has faced negative financial consequences that will impact its business operations in the long term | 0.824 *** | ||||
| NS2: The enterprise has lost competitive strength due to the situation surrounding COVID-19 pandemic | 0.745 *** | ||||
| Positive shock (PS) as a result of COVID-19 (‘pull’ factors) | 0.562 | 0.719 | 0.672 | 0.719 | |
| PS1: The enterprise has had direct commercial gain due to the situation surrounding COVID-19 pandemic | 0.787 *** | ||||
| PS2: The enterprise has strengthened its competitive position due to the situation surrounding COVID-19 pandemic | 0.710 *** | ||||
| Strategic response (SR) | 0.575 | 0.730 | 0.721 | 0.732 | |
| SR1: The enterprise has sought new customer groups or new markets due to the situation surrounding COVID-19 pandemic | 0.794 *** | ||||
| SR2: The enterprise has sought new suppliers or other new external relations due to the situation surrounding COVID-19 pandemic | 0.721 *** |
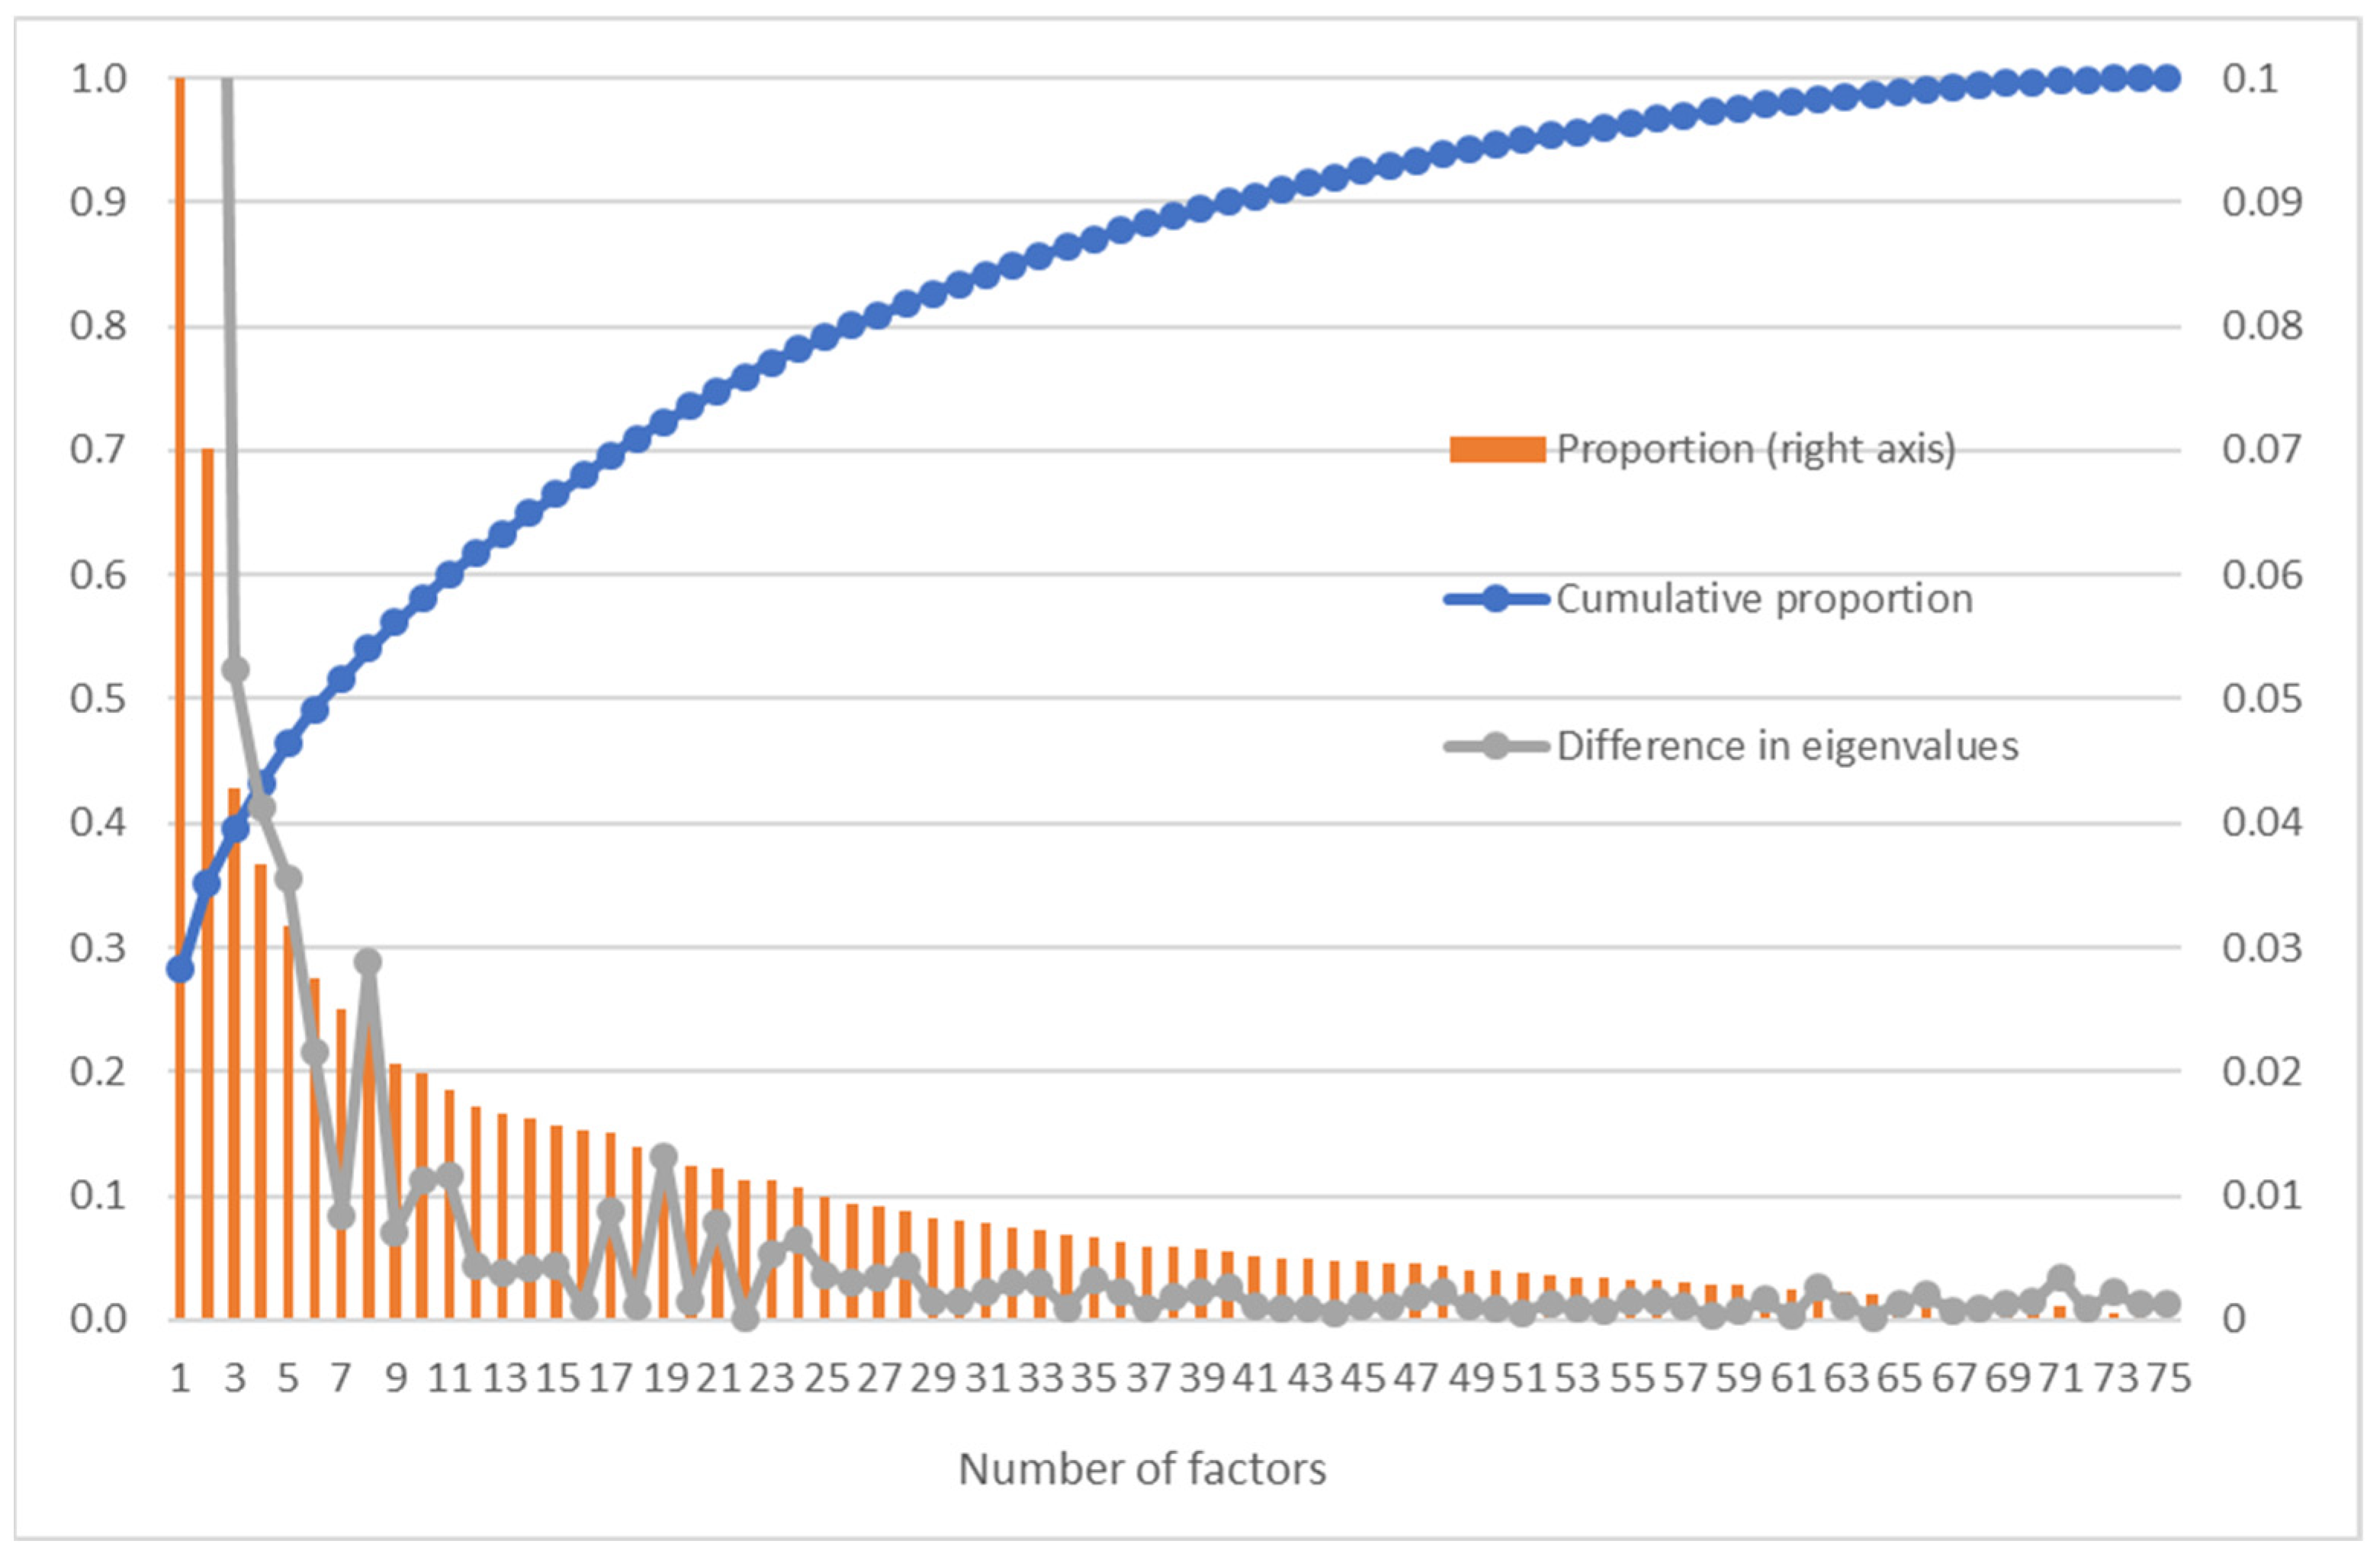
Appendix B. Mapping of Approaches to Innovation Based on CIS2020 for Norwegian Firms
| Active R&D Doers | Radical Innovators | Process Developers | Strategic Adaptors | Innovation Suppliers | Hard-Trying Innovators | Knowledge Absorbers | Individual Services Suppliers | ||
|---|---|---|---|---|---|---|---|---|---|
| Main topic | Variable | Faktor1 | Faktor2 | Faktor3 | Faktor4 | Faktor5 | Faktor6 | Faktor7 | Faktor8 |
| Market for the firm’s main product | d_sigmarloc | −0.285 | −0.354 | −0.265 | |||||
| d_sigmarnat | 0.233 | 0.375 | |||||||
| d_sigmareur | 0.274 | −0.261 | |||||||
| d_sigmaroth | 0.186 | 0.269 | −0.321 | ||||||
| Firm’s strategies | d_straimp | 0.691 | |||||||
| d_straint | 0.476 | 0.523 | 0.246 | ||||||
| d_stralow | 0.498 | ||||||||
| d_straqua | 0.203 | 0.860 | |||||||
| d_straran | 0.645 | 0.218 | |||||||
| d_strafoc | 0.287 | −0.399 | |||||||
| d_straest | 0.756 | ||||||||
| d_stranew | 0.208 | 0.655 | |||||||
| d_strasta | 0.536 | −0.242 | |||||||
| d_stracus | 0.626 | ||||||||
| Co-creation and customisation | d_specoc | 0.216 | 0.427 | 0.212 | 0.285 | 0.313 | |||
| d_specom | 0.286 | 0.552 | 0.263 | 0.275 | 0.220 | ||||
| d_specus | 0.389 | 0.346 | 0.341 | ||||||
| Use of IPRs | d_propat | 0.462 | 0.293 | 0.596 | −0.285 | ||||
| d_prodes | 0.245 | 0.674 | |||||||
| d_protm | 0.257 | 0.280 | 0.207 | 0.576 | |||||
| d_prosec | 0.394 | 0.380 | 0.502 | ||||||
| d_procp | 0.638 | ||||||||
| Sales and purchases of IPRs to/from other firms | d_intoth | 0.658 | |||||||
| d_intlic | 0.239 | 0.224 | 0.657 | ||||||
| d_intsha | 0.307 | 0.245 | 0.520 | 0.244 | |||||
| d_intbpr | 0.225 | 0.652 | |||||||
| d_intbpu | 0.282 | 0.558 | 0.268 | ||||||
| Acquisition of knowledge | d_kno_research | 0.455 | 0.230 | 0.302 | 0.514 | ||||
| d_kno_proforg | 0.310 | 0.222 | 0.230 | 0.540 | |||||
| d_kno_data | 0.419 | 0.334 | 0.370 | ||||||
| d_kno_network | 0.246 | 0.262 | 0.551 | ||||||
| d_kno_other | 0.215 | 0.247 | 0.444 | ||||||
| Skills management | d_worrot | 0.271 | 0.336 | ||||||
| d_worbra | 0.199 | 0.261 | 0.287 | 0.362 | 0.206 | 0.331 | |||
| d_worwor | 0.295 | 0.216 | 0.312 | 0.325 | 0.222 | 0.400 | |||
| d_worcom | 0.263 | 0.389 | 0.491 | ||||||
| Product innovation and the degree of its novelty | d_inpd_good | 0.333 | 0.595 | 0.223 | 0.262 | 0.302 | |||
| d_inpd_serv | 0.210 | 0.565 | 0.401 | 0.279 | |||||
| d_newmktloc | 0.224 | 0.686 | 0.226 | ||||||
| d_newmktnat | 0.299 | 0.802 | |||||||
| d_newmkteur | 0.336 | 0.778 | |||||||
| d_newmktoth | 0.302 | 0.746 | 0.251 | −0.211 | |||||
| d_newfrm | 0.240 | 0.303 | 0.256 | 0.274 | |||||
| Process innovation | d_inpcs_prod | 0.332 | 0.362 | 0.576 | |||||
| d_inpcs_log | 0.704 | ||||||||
| d_inpcs_ict | 0.785 | ||||||||
| d_inpcs_adm | 0.766 | ||||||||
| d_inpcs_nw | 0.783 | ||||||||
| d_inpcs_hr | 0.805 | ||||||||
| d_inpcs_mkt | 0.738 | ||||||||
| Formal R&D activities | d_rrd_int | 0.648 | 0.504 | 0.288 | 0.223 | ||||
| d_rrd_ext | 0.732 | 0.270 | 0.245 | ||||||
| d_rrd_cont | 0.563 | 0.507 | 0.324 | ||||||
| Other innovation activities | d_invinno_perc | 0.203 | 0.397 | 0.271 | 0.204 | ||||
| d_invinno_ext | 0.310 | 0.240 | 0.281 | −0.258 | |||||
| d_invinno_tech | 0.208 | 0.397 | 0.201 | −0.349 | |||||
| d_invinno_zero | −0.408 | −0.292 | −0.383 | −0.378 | −0.209 | ||||
| Expectations regarding innovation expenditures next period | d_exp_up | 0.249 | 0.258 | −0.226 | |||||
| d_exp_fixed | 0.242 | 0.190 | |||||||
| d_exp_down | 0.215 | 0.109 | |||||||
| d_exp_zero | −0.205 | −0.284 | −0.298 | ||||||
| d_exp_not | |||||||||
| Collaboration in innovation activities (including formal R&D) by type of collaborator | d_coop_group | 0.701 | |||||||
| d_coop_consult | 0.793 | ||||||||
| d_coop_suppl | 0.784 | 0.255 | |||||||
| d_coop_custom | 0.652 | 0.349 | |||||||
| d_coop_compet | 0.569 | 0.260 | |||||||
| d_coop_otherf | 0.478 | 0.248 | |||||||
| d_coop_high | 0.792 | 0.204 | |||||||
| d_coop_publ | 0.562 | 0.255 | 0.400 | ||||||
| d_coop_noinno | 0.580 | 0.231 | |||||||
| Collaboration in innovation activities (including formal R&D) by location of collaborator | d_coop_loc | 0.721 | 0.223 | ||||||
| d_coop_norw | 0.811 | 0.204 | |||||||
| d_coop_nordic | 0.709 | ||||||||
| d_coop_eur | 0.766 | 0.271 | |||||||
| d_coop_world | 0.679 | 0.282 | 0.256 | ||||||
| Hampering factors for innovation | d_hemp_fin | 0.254 | 0.241 | 0.742 | |||||
| d_hemp_cost | 0.789 | ||||||||
| d_hemp_skills | 0.718 | ||||||||
| d_hemp_mkt | 0.225 | 0.671 | |||||||
| Funding for innovation activities | d_fin_owni | 0.257 | 0.519 | 0.241 | 0.253 | −0.505 | |||
| d_fin_loan | 0.274 | 0.402 | 0.206 | 0.361 | −0.280 | ||||
| d_fin_publ | 0.583 | 0.426 | 0.284 | −0.159 | |||||
| Technology adoption | d_tech_pro | 0.208 | 0.300 | 0.258 | 0.203 | ||||
| d_tech_new | 0.284 | 0.237 | 0.403 |
References
- Thorgren, S.; Williams, T.A. Staying alive during an unfolding crisis: How SMEs ward off impending disaster. J. Bus. Ventur. Insights 2020, 14, e00187. [Google Scholar] [CrossRef]
- Solheim, M.C.W.; Aadland, T.; Eide, A.E.; Haneberg, D.H. Drivers for agility in times of crisis. Eur. Bus. Rev. 2023, 35, 57–73. [Google Scholar] [CrossRef]
- Bounfour, A.; Housel, T.; Silkey, T.; Nonnis, A. Digital transformation and strategic agility during the COVID_19 crisis: The role of the intangible capital conversion. Digit. Transform. Soc. 2023, 2, 257–275. [Google Scholar] [CrossRef]
- Roth, A. Achieving strategic agility through economies of knowledge. Plan. Rev. 1996, 24, 30–36. [Google Scholar] [CrossRef]
- Teece, D.J.; Pisano, G.; Shuen, A. Dynamic capabilities and strategic management. Strateg. Manag. J. 1997, 18, 509–533. [Google Scholar] [CrossRef]
- Pereira, V.; Mellahi, K.; Temouri, Y.; Patnaik, S.; Roohanifar, M. Investigating dynamic capabilities, agility and knowledge management within EMNEs-longitudinal evidence from Europe. J. Knowl. Manag. 2019, 23, 1708–1728. [Google Scholar] [CrossRef]
- Christofi, M.; Pereira, V.; Vrontis, D.; Tarba, S.; Thrassou, A. Agility and flexibility in international business research: A comprehensive review and future research directions. J. World Bus. 2021, 56, 101194. [Google Scholar] [CrossRef]
- Shams, R.; Vrontis, D.; Belyaeva, Z.; Ferraris, A.; Czinkota, M.R. Strategic agility in international business: A conceptual framework for “agile” multinationals. J. Int. Manag. 2021, 27, 100737. [Google Scholar] [CrossRef]
- Schilke, O. On the contingent value of dynamic capabilities for competitive advantage: The nonlinear moderating effect of environmental dynamism. Strateg. Manag. J. 2014, 35, 179–203. [Google Scholar] [CrossRef]
- Teece, D.J.; Peteraf, M.; Leih, S. Dynamic capabilities and organizational agility: Risk, uncertainty, and strategy in the innovation economy. Calif. Manag. Rev. 2016, 58, 13–35. [Google Scholar] [CrossRef]
- Sampath, G.; Krishnamoorthy, B. Is strategic agility the new Holy Grail? Exploring the strategic agility construct. Int. J. Bus. Excell. 2017, 13, 160–180. [Google Scholar] [CrossRef]
- Kale, E.; Aknar, A.; Başar, Ö. Absorptive capacity and firm performance: The mediating role of strategic agility. Int. J. Hosp. Manag. 2019, 78, 276–283. [Google Scholar] [CrossRef]
- Clauss, T.; Abebe, M.; Tangpong, C.; Hock, M. Strategic Agility, Business Model Innovation, and Firm Performance: An Empirical Investigation. IEEE Trans. Eng. Manag. 2021, 68, 767–784. [Google Scholar] [CrossRef]
- Clauss, T.; Kraus, S.; Kallinger, F.L.; Bican, P.M.; Brem, A.; Kailer, N. Organizational ambidexterity and competitive advantage: The role of strategic agility in the exploration-exploitation paradox. J. Innov. Knowl. 2020, 6, 203–213. [Google Scholar] [CrossRef]
- Pereira, V.; Budhwar, P.; Temouri, Y.; Malik, A.; Tarba, S. Investigating investments in agility strategies in overcoming the global financial crisis-The case of Indian IT/BPO offshoring firms. J. Int. Manag. 2021, 27, 100738. [Google Scholar] [CrossRef]
- Škare, M.; Soriano, D.R. A dynamic panel study on digitalization and firm’s agility: What drives agility in advanced economies 2009–2018. Technol. Forecast. Soc. Chang. 2021, 163, 120418. [Google Scholar] [CrossRef]
- Wilson, K.; Doz, Y.L. Agile innovation: A footprint balancing distance and immersion. Calif. Manag. Rev. 2011, 53, 6–26. [Google Scholar] [CrossRef]
- Cai, Z.; Liu, H.; Huang, Q.; Liang, L. Developing organizational agility in product innovation: The roles of IT capability, KM capability, and innovative climate. RD Manag. 2019, 49, 421–438. [Google Scholar] [CrossRef]
- Brand, M.; Tiberius, V.; Bican, P.M.; Brem, A. Agility as an innovation driver: Towards an agile front end of innovation framework. Rev. Manag. Sci. 2021, 15, 157–187. [Google Scholar] [CrossRef]
- Hermundsdottir, F.; Haneberg, D.; Aspelund, A. Anayzing the impact of COVID-19 on environmental innovations in manufacturing firms. Technol. Soc. 2022, 68, 101918. [Google Scholar] [CrossRef]
- Seyadi, A.E.; Elali, W. The Impact of strategic Agility on the SMEs competitive capabilities in the Kingdom of Bahrain. Int. J. Bus. Ethics Gov. 2021, 4, 31–53. [Google Scholar] [CrossRef]
- Akpan, I.J.; Udoh, E.A.; Adebisi, B. Small business awareness and adoption of state-of-the-art technologies in emerging and developing markets, and lessons from the COVID-19 pandemic. J. Small Bus. Entrep. 2020, 34, 123–140. [Google Scholar] [CrossRef]
- Di Stefano, G.; Gambardella, A.; Verona, G. Technology push and demand pull perspectives in innovation studies: Current findings and future research directions. Res. Policy 2012, 41, 421–438. [Google Scholar] [CrossRef]
- McGrath, G.R.; MacMillan, J. Entrepreneurial Mindset: Strategies for Continuously Creating Opportunity in an Age of Uncertainty; Harvard Business School Press Books: Brighton, MA, USA, 2000. [Google Scholar]
- Aas, T.H.; Breunig, K.J. Conceptualizing Innovation Capabilities: A Contingency Perspective. J. Entrep. Manag. Innov. 2017, 13, 7–24. [Google Scholar] [CrossRef]
- Maldonado-Guzmán, G.; Garza-Reyes, J.A.; Pinzón-Castro, S.Y.; Kumar, V. Innovation capabilities and performance: Are they truly linked in SMEs? Int. J. Innov. Sci. 2019, 11, 48–62. [Google Scholar] [CrossRef]
- Archibugi, D.; Filippetti, A. Innovation and Economic Crisis; Routledge: London, UK, 2012. [Google Scholar]
- Peters, B.; Dasch, B.; Hud, M.; Köhler, C. Employment and innovation in recessions: Firm-level evidence from European Countries. Ind. Corp. Chang. 2022, 31, 1460–1493. [Google Scholar] [CrossRef]
- Rybalka, M.; Mark, M.S. Innovation Pattern Heterogeneity and Crisis Resilience. Businesses 2023, 3, 323–346. [Google Scholar] [CrossRef]
- AlTaweel, I.R.; Al-Hawary, S.I. The Mediating Role of Innovation Capability on the Relationship between Strategic Agility and Organizational Performance. Sustainability 2021, 13, 7564. [Google Scholar] [CrossRef]
- OECD. Oslo Manual 2018; OECD: Paris, France, 2018. [Google Scholar]
- OECD. The New Economy-Beyond the Hype; OECD: Paris, France, 2001. [Google Scholar]
- OECD. Innovation and Growth: Rationale for an Innovation Strategy; OECD: Paris, France, 2007. [Google Scholar]
- OECD. The Future of Productivity; OECD: Paris, France, 2015. [Google Scholar]
- Capasso, M.; Rybalka, M. Innovation Pattern Heterogeneity: Data-Driven Retrieval of Firms’ Approaches to Innovation. Businesses 2022, 2, 54–81. [Google Scholar] [CrossRef]
- Fornell, C.; Larcker, D.F. Evaluating structural equation model with unobservable variables and measurement error. J. Mark. Res. 1981, 18, 39–50. [Google Scholar] [CrossRef]
- Kaplan, D. Structural Equation Modeling: Foundations and Extensions; SAGE Publications: Thousand Oaks, CA, USA, 2000. [Google Scholar]
- Mehmetoglu, M.; Jakobsen, T.G. Applied Statistics Using Stata: A Guide for the Social Sciences, 2nd ed.; SAGE Publications Ltd.: London, UK, 2022. [Google Scholar]
- Grensing-Pophal, L. The 3 A’s of Business Agility. HR Management & Compliance 2019, WEB-article from Aug 19, 2019. Available online: https://hrdailyadvisor.blr.com/2019/08/19/the-3-as-of-business-agility/ (accessed on 4 October 2024).
- Vinzi, V.E.; Trinchera, L.; Amato, S. PLS Path Modeling: From Foundations to Recent Developments and Open Issues for Model Assessment and Improvement. In Handbook of Partial Least Squares; Vinzi, V.E., Chin, W.W., Henseler, J., Wang, H., Eds.; Springer: Berlin/Heidelberg, Germany, 2010; Chapter 2. [Google Scholar]
- Cohen, W.M.; Levinthal, D.A. Absorptive capacity: A new perspective on learning and innovation. Adm. Sci. Q. 1990, 35, 128–152. [Google Scholar] [CrossRef]
- Tabachnick, B.G.; Fidell, L.S. Using Multivariate Statistics, 5th ed.; Allyn and Bacon: Boston, MA, USA, 2007. [Google Scholar]
- Bagozzi, R.P.; Yi, Y. On the evaluation of structural equation models. J. Acad. Mark. Sci. 1988, 16, 74–94. [Google Scholar] [CrossRef]
- Hu, L.-t.; Bentler, P.M. Fit indices in covariance structure modeling: Sensitivity to underparameterized model misspecification. Psychol. Methods 1998, 3, 424–453. [Google Scholar] [CrossRef]
| Firm Characteristic | Obs. | Mean | Std. Dev. | Min | Median | Max |
|---|---|---|---|---|---|---|
| Number of employees | 6437 | 95.7 | 344.8 | 5 | 32 | 18,415 |
| Firm age (in years) | 6437 | 20.9 | 16.9 | 0 | 18 | 177 |
| Turnover (mill. NOK) | 6437 | 399.3 | 2564.8 | 0 | 56 | 151,000 |
| Introduction of new good in 2018–2020 | 6437 | 0.35 | 0.48 | 0 | 0 | 1 |
| Introduction of new service in 2018–2020 | 6437 | 0.30 | 0.46 | 0 | 0 | 1 |
| Introduction of new business process in 2018–2020 | 6437 | 0.53 | 0.50 | 0 | 1 | 1 |
| Introduction of new good in 2020 due to COVID-19 | 6437 | 0.05 | 0.22 | 0 | 0 | 1 |
| Introduction of new service in 2020 due to COVID-19 | 6437 | 0.07 | 0.25 | 0 | 0 | 1 |
| Introduction of new business process in 2020 due to COVID-19 | 6437 | 0.15 | 0.36 | 0 | 0 | 1 |
| Type of Innovation Practice | Description Before the Pandemic * | Change During the Pandemic |
|---|---|---|
| “Active R&D doers” | Most important market: EU and the world R&D-work on a continuous basis Product and service innovation with a moderate degree of novelty High degree of collaboration at all levels Extensive use of public support for financing | The most important market became the EU (and not the world, as before) Purchase of services and equipment from others in connection with innovation activities on a larger scale than before |
| “Radical innovators” | Most important market: EU and the world R&D on a continuous basis Product and service innovation with a high degree of novelty Collaboration with clients in the private sector, typically outside Norway Active use of patents and secrecy and licensing out of their rights | Reorientation from the international to the national market when it comes to the sale of products even though the degree of novelty of innovation remains at world-class level Greater focus on new customers and special development of goods and services |
| “Process developers” | New or significantly improved processes at all levels Main strategy: Improvement of existing goods and services Collaboration with other companies in the same group at local/regional level Investment to a greater extent than others in machines, equipment and software | Greater focus on the application of new technology than before |
| “Strategic adaptors” | Main strategies: High quality of goods or services; improvement of existing goods and services; priority on catering to established customer groups Offer customization of standard goods or services Invest in technological equipment that is largely based on new technology | Even greater focus on specialization when adapting existing products |
| “Innovation suppliers” | Most important market: Mot local/regional Active use of all types of IPR and licensing out of their rights Buy R&D services from others to a large degree and carry out own R&D to some extent | Increased orientation towards the world market (applies to both sales and business partners) |
| “Hard-trying innovators” | Sporadic execution of R&D internally with main investment in own staff Scores high on all types of obstacles to innovation Product and service innovation with a low degree of novelty Collaboration to some degree with competitors in the same industry and locally | Receives external financing in the form of loans and subsidies to a much greater extent |
| “Knowledge absorbers” | Active use of all types of channels/methods to acquire knowledge Practicing special development of goods/services where the public sector is involved in the development Practicing further education, skills development, and training internally within the company; broadly composed of working groups across job functions and areas; regular brainstorming sessions Do not carry out any formal R&D and innovation activity Investment in technological equipment that is largely based on existing technology | Specialization towards the public sector as a customer and on goods or services where the customer/user had an active role in conceptualization, design and development. |
| “Individual (standard) services suppliers” | Main market: Norway Main strategy: Development and launch of new standards for goods and services Oriented towards households or individuals Relatively high investment in staff and expect the same level of investment in innovation going forward Collaboration to some degree with other companies Introduced new or significantly improved services with a low and in some cases moderate degree of novelty | Reorientation from offering standard services to focusing on a wide range of specially developed services. |
| Dependent Variables | ||||||
|---|---|---|---|---|---|---|
| Control Variables | Negative Impact | Positive Impact | Strategic Response | |||
| Approach to innovation: | ||||||
| “Active R&D doers” | −0.095 | *** | −0.031 | * | 0.033 | *** |
| “Radical innovators” | 0.002 | 0.188 | *** | 0.056 | *** | |
| “Process developers” | 0.002 | 0.191 | *** | 0.071 | *** | |
| “Strategic adaptors” | 0.160 | *** | 0.148 | *** | 0.040 | *** |
| “Innovation suppliers” | 0.114 | *** | 0.038 | * | 0.073 | *** |
| “Hard-trying innovators” | 0.301 | *** | −0.026 | ** | 0.028 | *** |
| “Knowledge absorbers” | −0.076 | *** | 0.059 | *** | 0.036 | *** |
| “Individual services suppliers” | −0.154 | *** | 0.039 | *** | 0.005 | |
| Other control variables: | ||||||
| Lack of necessary knowledge and skills | 0.246 | *** | ||||
| Prioritizing of having necessary knowledge and skills | 0.058 | *** | ||||
| Negative impact | 0.878 | *** | ||||
| Positive impact | 0.805 | *** | ||||
| Any Type of Innovation (d_inno = 1) | Innovation due to COVID-19 (Conditional on d_inno = 1 in CIS2020) | |||||
|---|---|---|---|---|---|---|
| Control Variables | CIS2020 | CIS2018 | Any Type of Innovation | New Good | New Service | New Process |
| Approach to innovation: | ||||||
| “Active R&D doers” | 12.800 *** | 10.440 *** | 0.682 *** | 0.606 * | 0.136 | 0.817 *** |
| “Radical innovators” | 12.397 *** | 8.664 *** | 0.607 *** | 1.612 *** | 1.751 *** | 0.371 ** |
| “Process developers” | 32.285 *** | 33.687 *** | 1.899 *** | 1.135 *** | 1.594 *** | 2.547 *** |
| “Strategic adaptors” | 6.155 *** | 7.424 *** | 0.306 * | 1.290 *** | 0.597 ** | 0.294 |
| “Innovation suppliers” | 4.291 *** | 4.651 *** | −0.463 * | 0.040 | −1.482 *** | −0.445 |
| “Hard-trying innovators” | 4.927 *** | 5.417 *** | 0.275 * | 0.356 | 0.673 *** | 0.253 |
| “Knowledge absorbers” | −0.922 *** | 2.667 *** | 0.033 | −0.580 ** | 0.346 | 0.161 |
| “Individual services suppliers” | 4.910 *** | 9.014 *** | 0.229 | 1.205 *** | 1.487 *** | −0.071 |
| Other control variables: | ||||||
| Negative impact of COVID-19 | −0.140 | −0.570 * | −0.183 | 0.120 | ||
| Positive impact of COVID-19 | 0.193 | −0.292 | 0.114 | 0.317 | ||
| Strategic response | 1.088 *** | 1.559 *** | 1.004 *** | 0.910 *** | ||
| Constant term | −4.722 *** | −5.497 *** | −2.679 *** | −4.979 *** | −4.975 *** | −3.130 *** |
| Number of observations | 6437 | 6360 | 4006 | 3946 | 3971 | 4006 |
| Process Innovation due to COVID-19 (Conditional on d_inno_pcs = 1) | |||||||
|---|---|---|---|---|---|---|---|
| Control Variables | Methods for Producing Goods or Providing Services | Logistics, Delivery or Distribution Methods | Methods for Information Processing or Communication | Methods for Accounting or Other Administrative Operations | Business Practices for Organising Procedures or External Relations | Methods of Organising Work Responsibility, Decision-Making or HR Management | Marketing Methods for Promotion 1. or After Sales Services |
| Approach to innovation: | |||||||
| “Active R&D doers” | 0.393 | −0.381 | 0.831 *** | 0.528 | 1.211 *** | 0.559 | 0.462 |
| “Radical innovators” | 1.155 *** | 0.264 | 0.035 | −0.728 * | 0.732 ** | 0.454 | 0.661 *** |
| “Process developers” | 1.473 *** | 2.244 *** | 2.077 *** | 1.925 *** | 3.827 *** | 3.459 *** | 2.412 *** |
| “Strategic adaptors” | 0.726 ** | 0.633 | 0.578 ** | −0.352 | 0.397 | −0.277 | 0.553 * |
| “Innovation suppliers” | −0.759 | −0.711 | −0.398 | −0.538 | −0.658 | −1.099 ** | 0.069 |
| “Hard-trying innovators” | 0.797 *** | −0.024 | 0.134 | −0.41 | 0.726 *** | −0.21 | 0.201 |
| “Knowledge absorbers” | −0.002 | −0.265 | 0.233 | 0.577 | 1.127 *** | 0.338 | −0.265 |
| “Individual services suppliers” | −0.042 | 0.777 ** | 0.430 ** | −0.582 | −0.533 * | −0.443 | −0.006 |
| Other control variables: | |||||||
| Negative impact of COVID-19 | −0.029 | −0.586 | −0.082 | 0.788 | 0.083 | 0.901 ** | −0.293 |
| Positive impact of COVID-19 | 0.457 | −0.200 | 0.160 | 0.914 * | 0.110 | 0.335 | 0.002 |
| Strategic response | 0.950 *** | 1.666 *** | 0.727 *** | 0.133 | 0.707 * | 0.201 | 1.307 *** |
| Constant term | −4.517 *** | −3.701 *** | −4.272 *** | −2.952 ** | −6.086 *** | −6.514 *** | −4.616 *** |
| Number of observations | 3327 | 3236 | 3344 | 3208 | 3246 | 3300 | 3307 |
| Control Variables | Efficiency Improvements | Long-Term Changes in Business Operations | ||
|---|---|---|---|---|
| Approach to innovation: | ||||
| “Active R&D doers” | 0.288 | *** | 0.296 | *** |
| “Radical innovators” | 0.030 | * | 0.251 | *** |
| “Process developers” | 0.351 | *** | 0.389 | *** |
| “Strategic adaptors” | 0.288 | *** | 0.195 | *** |
| “Innovation suppliers” | −0.011 | 0.150 | *** | |
| “Hard-trying innovators” | −0.080 | *** | 0.192 | *** |
| “Knowledge absorbers” | 0.257 | *** | 0.215 | *** |
| “Individual services suppliers” | −0.048 | * | −0.081 | *** |
| Other control variables: | ||||
| Negative impact of COVID-19 | 0.284 | *** | 0.609 | *** |
| Positive impact of COVID-19 | 0.707 | *** | 0.541 | *** |
| Strategic response | 0.391 | *** | 0.371 | *** |
| Cut1 | −0.266 | ** | −0.299 | * |
| Cut2 | 0.949 | *** | 1.067 | *** |
| Cut3 | 2.716 | *** | 2.615 | *** |
| Number of observations | 6385 | 6385 | ||
| Log likelihood | -51,821.853 | −51,726.519 | ||
| Approach to Innovation | Negative Shock | Positive Shock | Strategic Response | Product Innovation | Service Innovation | Process- Innovation | Efficiency Improvements | Long-Term Changes |
|---|---|---|---|---|---|---|---|---|
| “Active R&D doers” | − | + | (+) | + | + | + | ||
| “Radical innovators” | + | + | + | + | + | (+) | + | |
| “Process developers” | + | + | + | + | + | + | + | |
| “Strategic adaptors” | + | + | + | + | + | + | + | |
| “Innovation suppliers” | + | + | − | + | ||||
| “Hard-trying innovators” | + | − | + | + | − | + | ||
| “Knowledge absorbers” | − | + | + | − | + | + | ||
| “Individual services suppliers” | − | + | + | + | − |
Disclaimer/Publisher’s Note: The statements, opinions and data contained in all publications are solely those of the individual author(s) and contributor(s) and not of MDPI and/or the editor(s). MDPI and/or the editor(s) disclaim responsibility for any injury to people or property resulting from any ideas, methods, instructions or products referred to in the content. |
© 2024 by the author. Licensee MDPI, Basel, Switzerland. This article is an open access article distributed under the terms and conditions of the Creative Commons Attribution (CC BY) license (https://creativecommons.org/licenses/by/4.0/).
Share and Cite
Rybalka, M. Innovation Pattern Heterogeneity and Firm Strategic Agility: Push- and Pull-Effects of COVID-19 on Firms’ Innovation Strategies. Businesses 2024, 4, 596-619. https://doi.org/10.3390/businesses4040036
Rybalka M. Innovation Pattern Heterogeneity and Firm Strategic Agility: Push- and Pull-Effects of COVID-19 on Firms’ Innovation Strategies. Businesses. 2024; 4(4):596-619. https://doi.org/10.3390/businesses4040036
Chicago/Turabian StyleRybalka, Marina. 2024. "Innovation Pattern Heterogeneity and Firm Strategic Agility: Push- and Pull-Effects of COVID-19 on Firms’ Innovation Strategies" Businesses 4, no. 4: 596-619. https://doi.org/10.3390/businesses4040036
APA StyleRybalka, M. (2024). Innovation Pattern Heterogeneity and Firm Strategic Agility: Push- and Pull-Effects of COVID-19 on Firms’ Innovation Strategies. Businesses, 4(4), 596-619. https://doi.org/10.3390/businesses4040036