Article

Determining Performance, Economic, and Environmental Benefits of Pavement Preservation Treatments: Results from a Systematic Framework for PMS

by
Anthony Brenes-Calderon
*,
Adriana Vargas-Nordcbeck
,
Surendra Chowdari Gatiganti
and
Josué Garita-Jimenez
National Center for Asphalt Technology, Auburn University, Auburn, AL 36830, USA
*
Author to whom correspondence should be addressed.
Constr. Mater. 2025, 5(3), 66; https://doi.org/10.3390/constrmater5030066
Submission received: 16 August 2025 / Revised: 5 September 2025 / Accepted: 10 September 2025 / Published: 11 September 2025
(This article belongs to the Special Issue Advances in Sustainable Construction Materials for Asphalt Pavements)

Abstract

This study evaluated the benefits of pavement preservation treatments across two climatic zones using data from the National Center for Asphalt Technology (NCAT) Pavement Preservation Group Study. Longitudinal data analysis was conducted to quantify pavement performance over time. Results indicate that in the freeze zone, treatments significantly improved pavement smoothness, as evidenced by reductions in the progression of the International Roughness Index (IRI), whereas similar trends were not observed in the no-freeze region, highlighting the need for further research to quantify the benefits in these zones. Life cycle cost analysis (LCCA) showed that selected preservation treatments reduced user costs by 54–57% due to lower excess fuel consumption, particularly in high-traffic corridors. These treatments also contributed to reductions in greenhouse gas (GHG) emissions by decreasing fuel use. Despite these findings, comprehensive, high-quality data are needed to fully evaluate the economic and environmental benefits of preservation treatments at the project level and to improve decision-making in pavement management strategies.

1. Introduction

Continuous traffic conditions combined with environmental factors tend to deteriorate the surface properties of pavement structures. The degree of this deterioration also depends on factors such as the pavement structure, material properties, quality of construction, and its maintenance [1]. For this reason, it is key for state and local agencies to operate their pavement management systems by monitoring properties related to different types of distresses and keeping the pavement network in good condition. By measuring different parameters to quantify the condition of the pavement network, these agencies can make informed decisions related to maintenance prioritization, rehabilitation, and construction [2].
To track pavement performance over time and quantify benefits from preservation activities, multiple metrics have been implemented, such as pavement condition index (PCI), remaining service life, and in-house developed metrics. However, state agencies face a major challenge in accurately assessing the effectiveness of pavement preservation treatments because there are no unified, consistently applied performance metrics [3]. The types of pavement distresses measured, the methods used for data collection, and the specific performance indicators vary significantly from state to state. These inconsistencies make it difficult to effectively communicate the benefits of pavement preservation and to conduct fair comparisons between different treatment alternatives for economic and environmental analysis. As a result, agencies are hindered in their ability to make informed decisions and implement the most beneficial preservation strategies [4].
The international roughness index (IRI), which quantifies pavement roughness, is a widely used and studied primary pavement performance indicator [5]. Increased pavement roughness is related to reduced pavement performance and ride quality, compromising user comfort and safety and increasing user costs [6]. In addition to pavement performance and economic effects, increased roughness leads to greater vehicular energy consumption [7]. Higher energy or fuel consumption directly impacts tailpipe emissions. Therefore, pavement deterioration also has a negative environmental impact [8,9].
A network-level long-term strategy that enhances pavement performance using cost-effective practices could extend pavement service life, reduce user costs, improve user safety and comfort, and decrease the adverse effects on the environment [10,11,12]. Although some state agencies have implemented pavement preservation techniques such as chip seals, crack sealing, thin overlays, and other treatment types and combinations, some challenges hinder their prevalent adoption. These challenges include the need for more solid evidence on their cost-effectiveness, limited knowledge of how different factors impact their performance, and better guidelines on selecting adequate treatments for specific road and environmental conditions [13].
Even though there have been multiple disparities in condition assessment and benefits determination, some recent studies have recorded the benefits of preserving roads while in good condition. Two maintenance strategies (conventional mill and fill; preventative treatments; and a cold in-place recycling treatment) were evaluated through a 30-year analysis period. The evaluated strategies provided savings of approximately 500,000 GJ in energy and 35,000 tons in GHG emissions, which were mostly attributable to smoother roads [14]. Other treatments, such as thin asphalt overlays, are considered as cost-effective alternatives for pavement preservation, despite their higher construction emissions and costs compared to other treatments. In contrast, chip sealing is another effective choice, balancing cost-effectiveness with the lowest construction emissions and a proven ability to extend pavement service life [15].
While this study also aims to demonstrate the benefits of pavement preservation, several research gaps remain. First, few studies provide a fully integrated framework that jointly considers agency costs, user costs, and environmental externalities within a single life-cycle perspective [4]. Second, treatment-specific trade-offs are often overlooked, particularly the balance between emissions generated during treatment application and those avoided over the service life. Third, most deterioration models are region-specific and fail to adequately account for variability in climate, traffic levels, and construction quality, highlighting the need for more robust longitudinal modeling approaches. Finally, while preservation benefits are clear for high-volume roadways, the economic and environmental justification for low-volume networks remains less studied, especially given the longer payback periods associated with lower traffic demand [16].

2. Objective and Scope of Work

The objective of this study was to quantify the performance and economic and environmental benefits provided by different types of pavement preservation treatment. To accomplish this objective, long-term field performance data was used to develop performance models for preservation treatments based on surface characteristics and longitudinal data procedures. Specifically, IRI data was obtained from test sections included in a broader pavement preservation research study conducted by the National Center for Asphalt Technology (NCAT) and the Minnesota DOT’s Road Research Facility (MnROAD). Additionally, complementary structural and surface indicators were incorporated for treatment characterization.
Pavement–Vehicle Interaction (PVI) models that consider pavement surface characteristics were implemented to determine excess fuel consumption due to increased IRI over time. The excess fuel consumption was used to determine the economic and environmental benefits of various preservation treatments using LCCA frameworks and the quantification of “tailpipe emissions” in the user stage. Figure 1 illustrates the sequence followed to achieve the objective.

3. NCAT and MnROAD Pavement Preservation Group Study

The Pavement Preservation Group Study was started in 2012 by NCAT, aiming to evaluate the effectiveness of pavement preservation techniques. Initially, test sections were constructed on a low-traffic road in Auburn, Alabama (wet no-freeze region), and included a variety of treatments ranging from crack sealing to more robust treatments as thin overlays. Due to promising results and increasing interest from agencies and industry, NCAT partnered with MnROAD in 2015 to expand the study by introducing new variables, such as traffic levels and environmental conditions. This led to the construction of additional test sections on Highway US–280 (Opelika, AL, USA), in 2015, followed by sections on Highway US–169 and County State Aid Highway CSAH–8 near Pease, Minnesota, in 2016 (wet freeze region). Detailed information about these treatments and site description can be found in external sources [17].
In addition to the treatments described, each test site also included eight untreated sections that were used as controls. The surface characteristics of the test sections were assessed by measuring cracking, rut depths, roughness, and other relevant parameters. Pavement roughness data were collected both before the treatments were applied and on a regular basis afterward. This was performed using an inertial profiler, following the manufacturer’s guidelines to only collect data when the air temperature was above 4 °C. This requirement led to data gaps during the winter months, specifically for the wet freeze region.
For this analysis, two climatic zones were considered: wet freeze and wet no-freeze. As shown in Table 1, four different treatment types were selected for this study, grouping sections with similar treatment characteristics and conditions. This study also accounts for different traffic levels and typical pavement structures for these conditions. Low-traffic volume sections in the wet no-freeze region were excluded from the analysis due to significant differences in section length, which can result in non-standardized comparisons. These sections were shorter (30.5 m) compared to the other sections, which measured 160 m in length. Literature indicates the accuracy of high-speed profiling systems depends on the pavement section base length; shorter sections can be more sensitive to specific locations with excessive roughness [18].

4. Preliminary Assessment and Treatment Performance Models

4.1. Preliminary Assessment and Data Exploration

To ensure data consistency across different sources, to follow a systematic pavement management process, and to evaluate the performance of treated and untreated pavement sections over time, this study selected the IRI as the primary performance indicator. The selection of the IRI provides a consistent metric and aligns with the requirements of the Federal Highway Administration (FHWA) under the “Moving Ahead for Progress in the 21st Century” Act (MAP–21) [19]. In addition to being a federally mandated measure, the IRI is widely used in pavement management for monitoring deterioration [20,21]. Most importantly, the IRI plays a crucial role as the main input in pavement–vehicle interaction models to estimate excess fuel consumption due to pavement surface roughness.
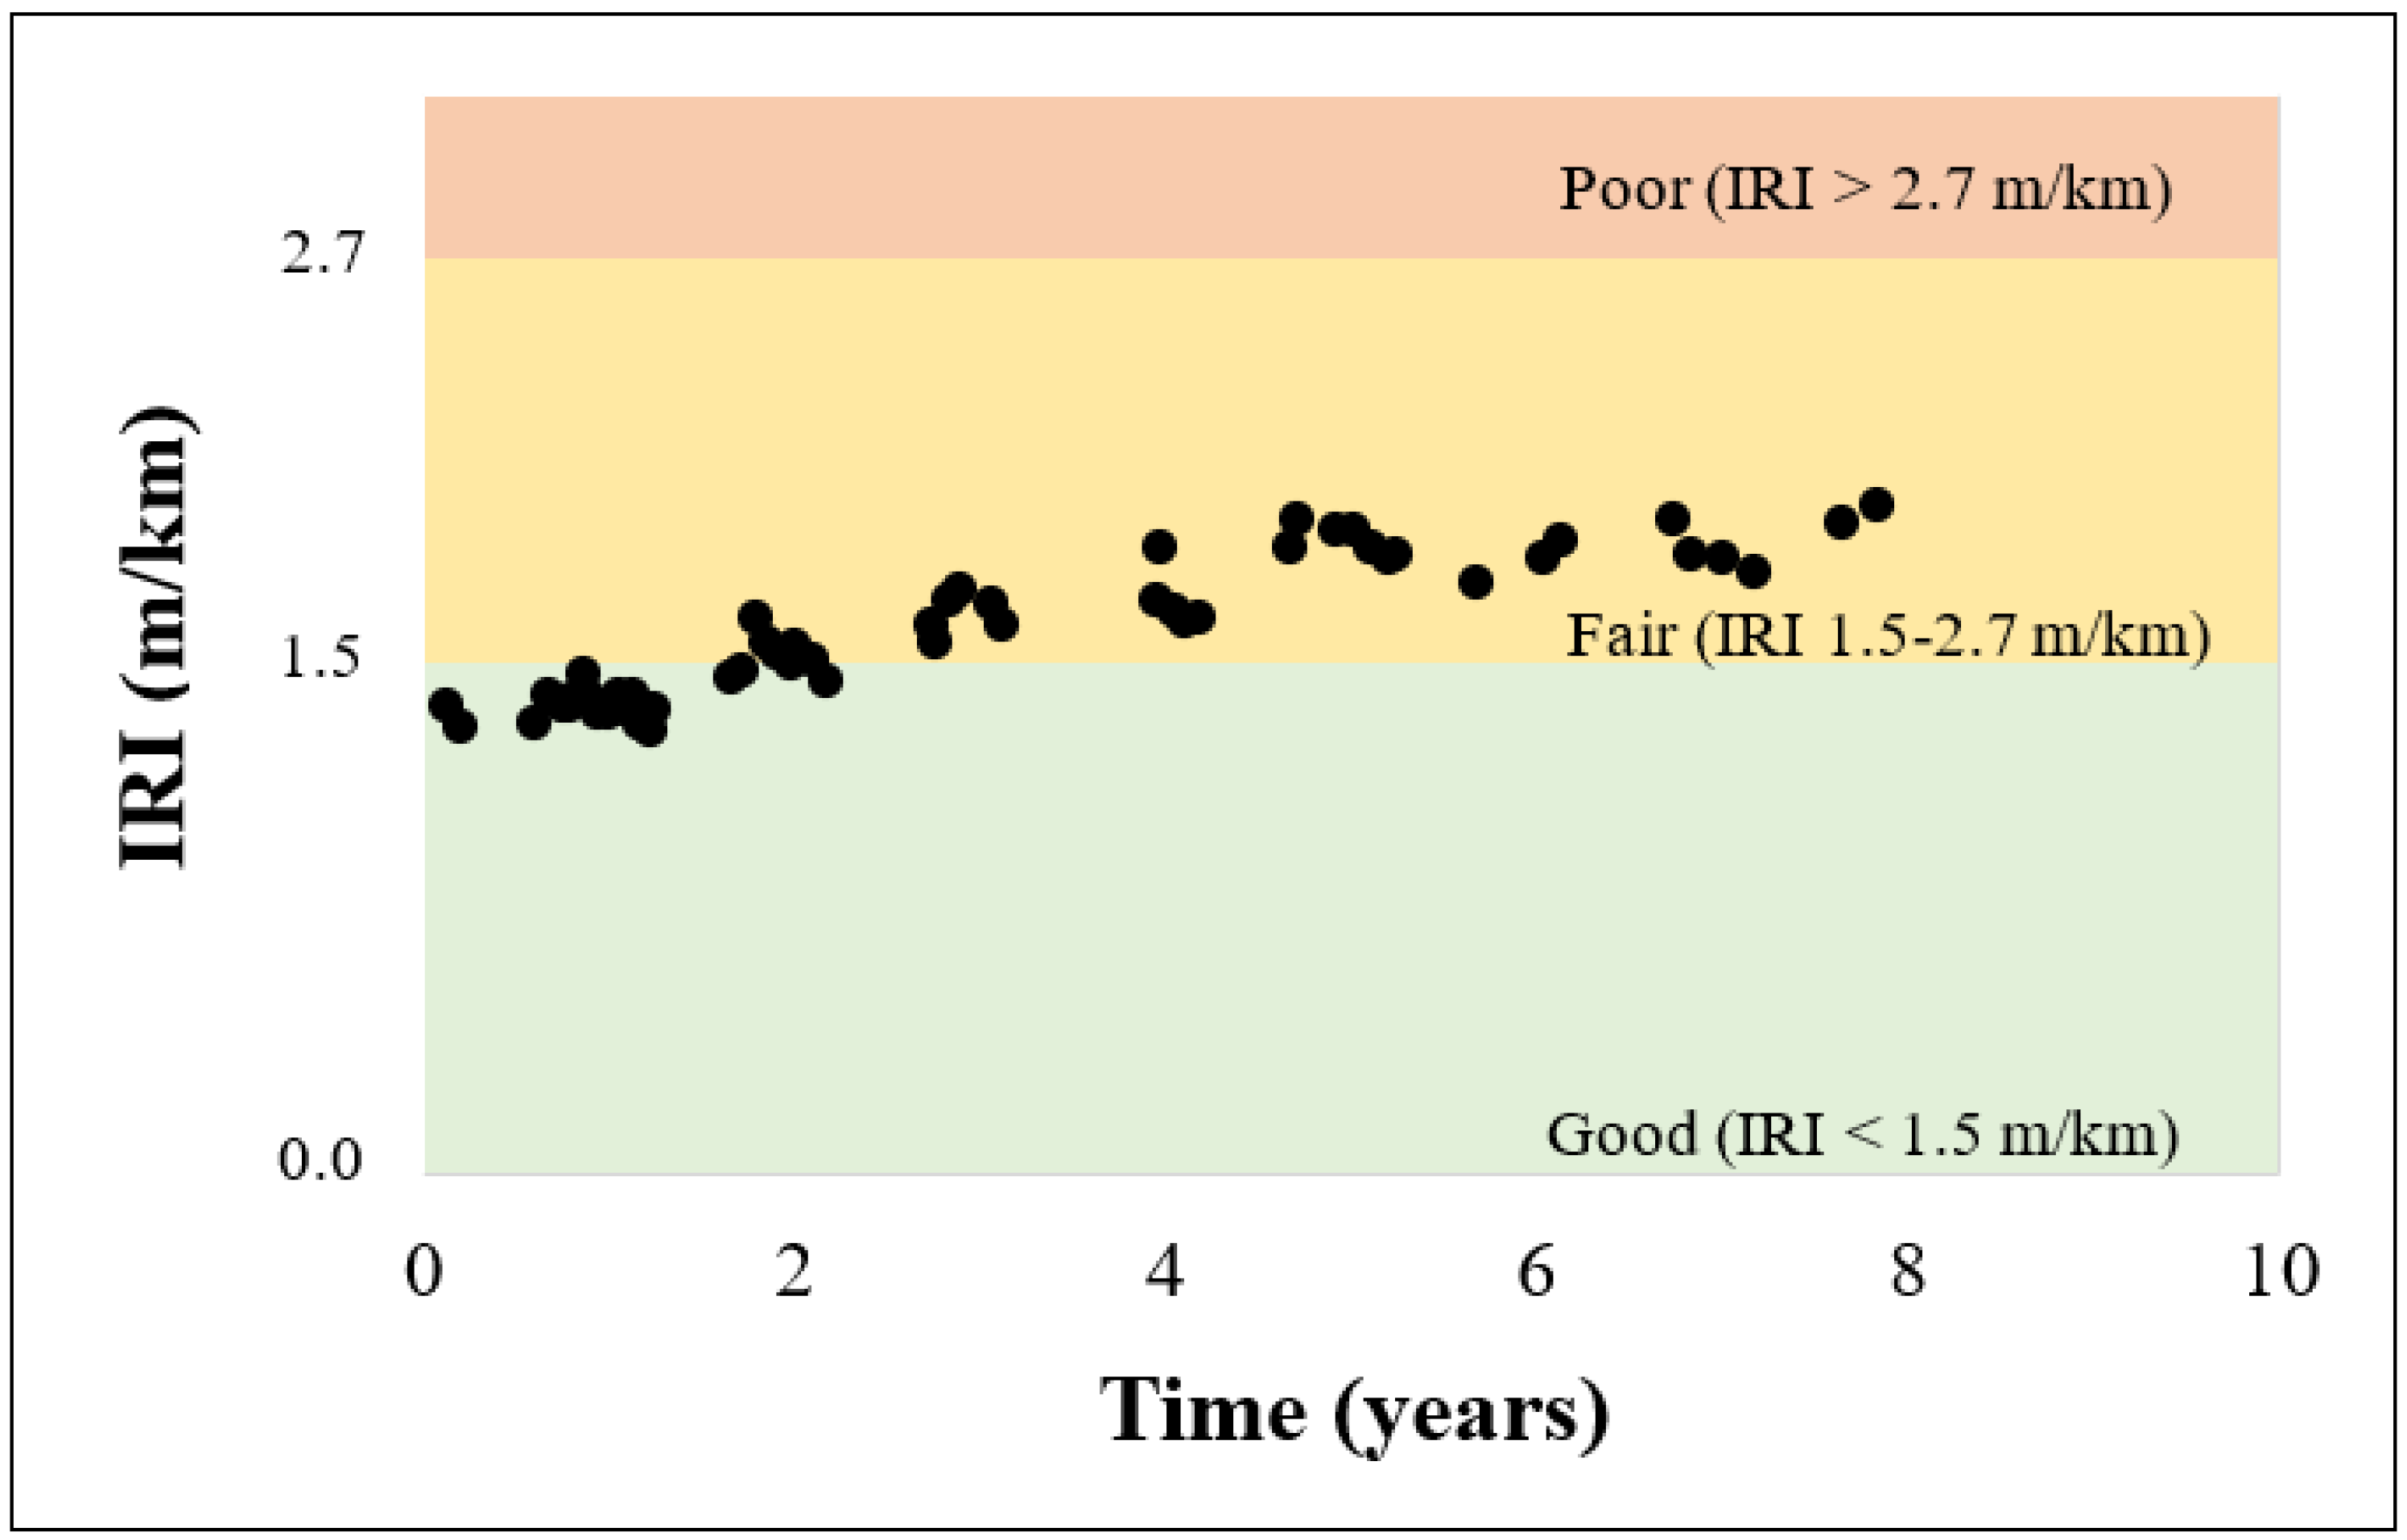
An initial exploratory analysis was conducted to determine both the initial conditions of the pavement preservation treatments and untreated sections, used as controls, as well as the IRI progression or alternative distress mechanisms from each climatic region. This analysis first revealed that no defined trend was observed in IRI measurements for no-freeze regions. To exemplify this behavior in the data, Figure 2 illustrates a consistently stable IRI trend over time for a single untreated section in the no-freeze region, while Figure 3 shows a notable upward trend in the IRI for a single untreated section in the freeze location. The rest of the sections exhibited similar patterns. Nevertheless, a Mann–Kendall test was performed to confirm the findings. This test provides a non-parametric procedure to detect monotonic trends in time series data. It assesses whether a series generally increases or decreases over time (Null hypothesis: there is no monotonic trend in the data) [22]. Table 2 summarizes the results obtained from the test. Additionally, the test provides the Kendall Tau correlation coefficient. This coefficient measures the strength and direction of the monotonic relationship between the IRI and time. Values range from −1 (strong decreasing trend) to 1 (strong increasing trend), with 0 indicating no trend [22].
Based on the table for no-freeze region sections, the analysis revealed no statistically significant trend in the IRI (p-value = 0.4633). This suggests that over the analysis period, there is no consistent increase or decrease in pavement roughness that can be deemed statistically reliable. On the other hand, freeze region sections exhibited a statistically significant increasing trend in the IRI (p-value = 0.0000). The Kendall Tau of 0.7121 shows a strong positive monotonic relationship, suggesting a progressive deterioration of the pavement condition over time in IRI terms.
These observations align with previous studies that highlight temperature conditions as a critical factor in determining maintenance activities related to surface smoothness [23]. Additionally, research conducted on Long Term Pavement Performance (LTPP) Specific Study 3 no-freeze zones found no significant differences in the IRI between treated and control sections [24], supporting the conclusion that climate influences the effectiveness of treatments. For this reason, only the freeze zones, which demonstrated a significant trend in the IRI, were included in subsequent subsections of the analysis. Nevertheless, further research is needed to assess the condition of pavement preservation treatments in no-freeze locations and link these findings to pavement-vehicle interaction models, which typically rely on IRI measurements as one of the main indicators of pavement condition.
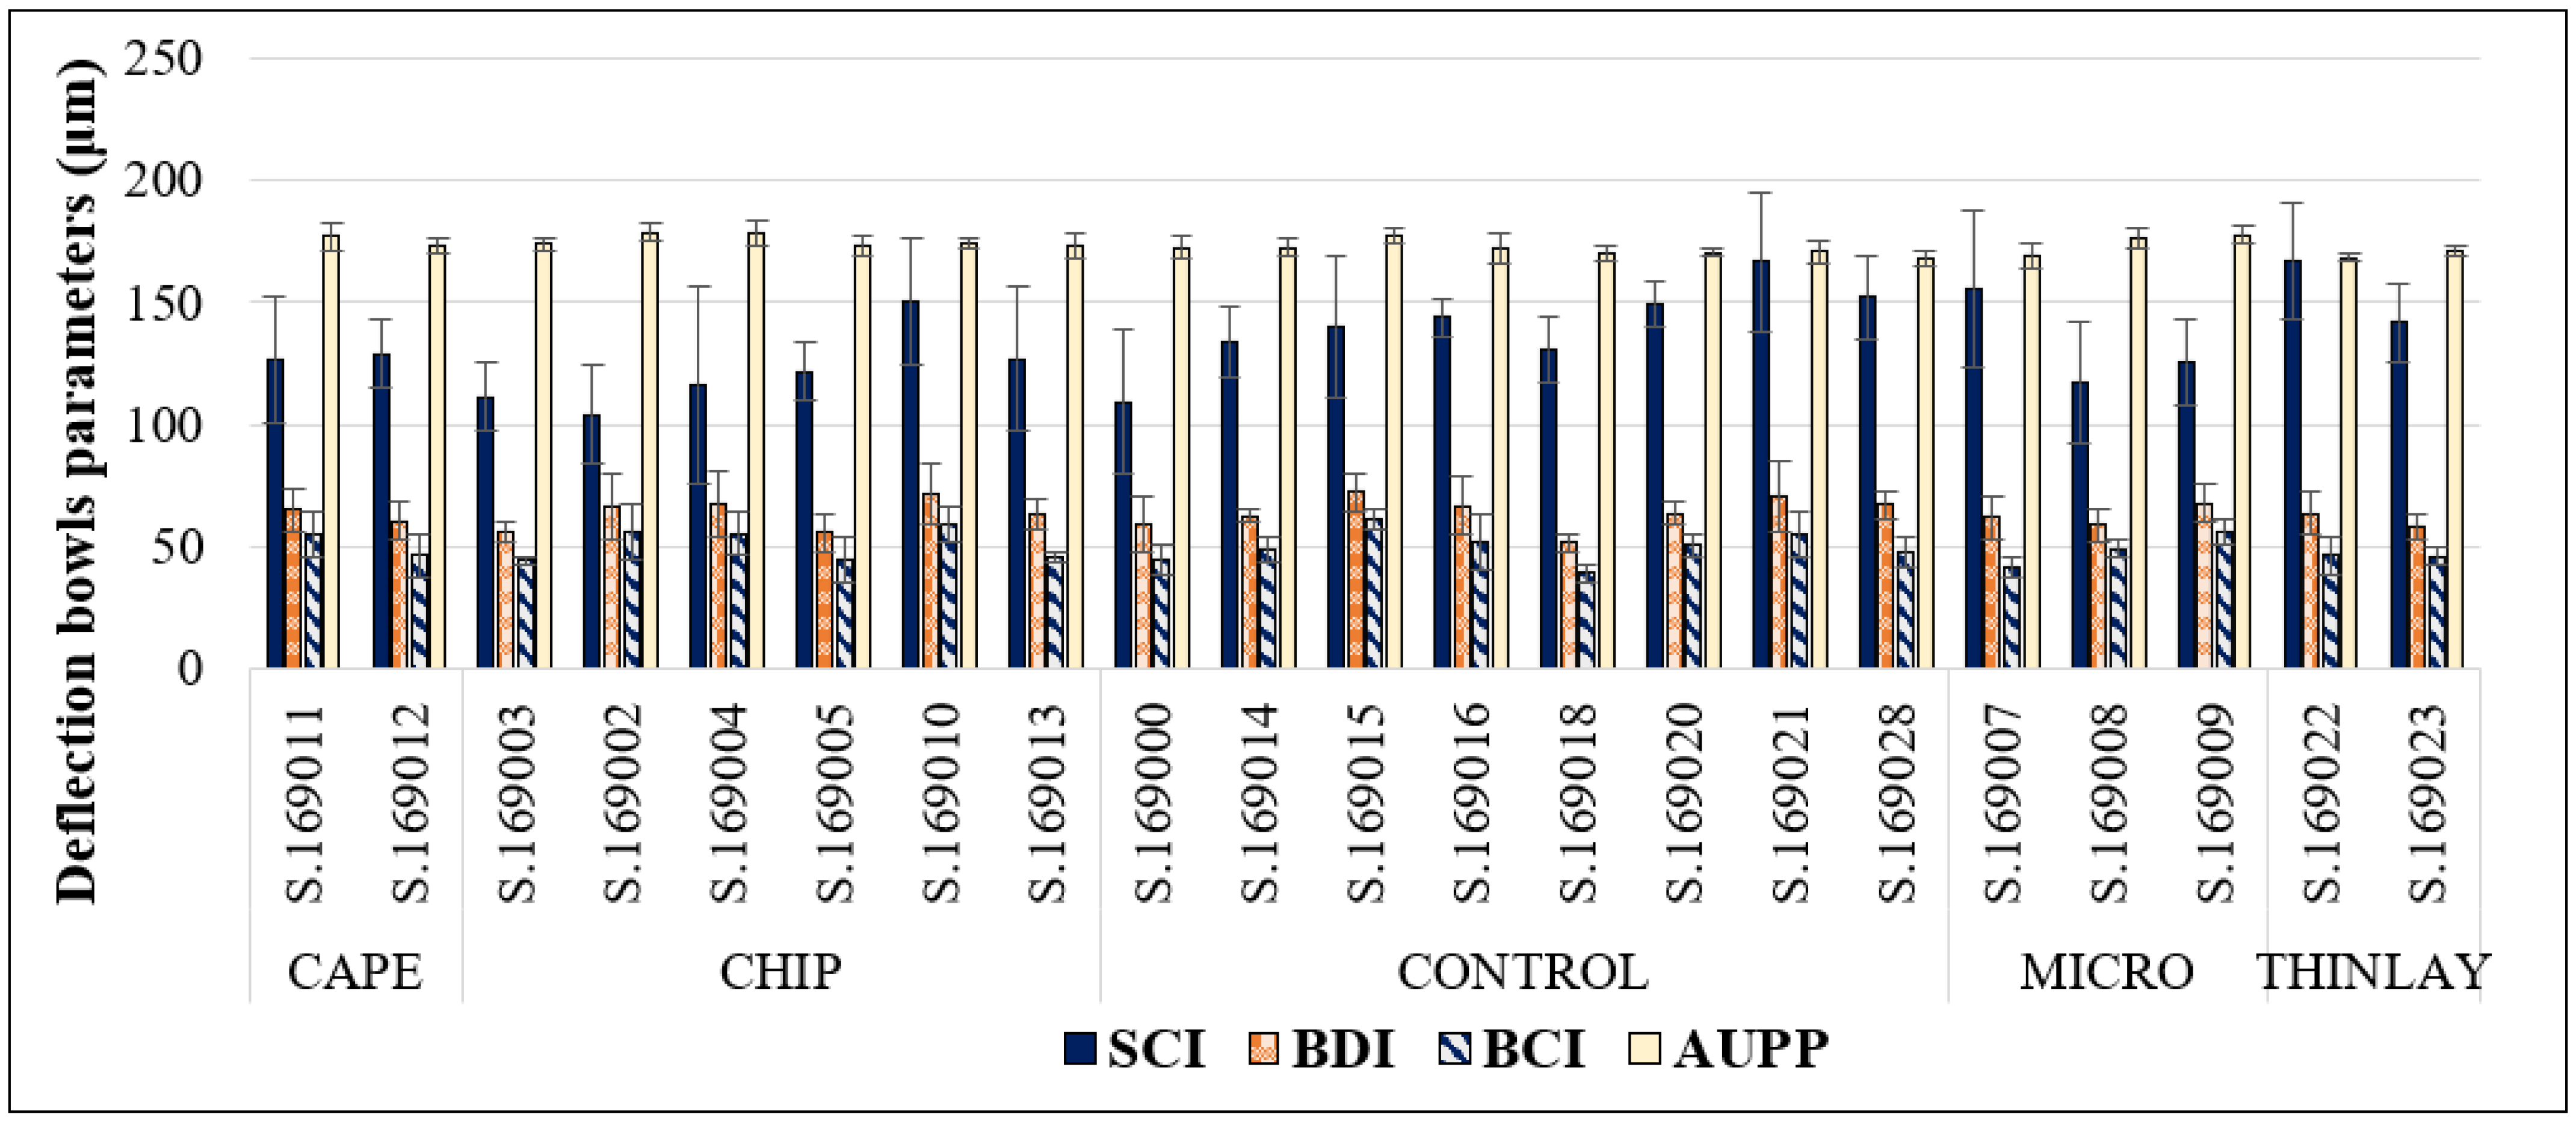
This study focused on freezing regions, evaluating the site characteristics, and the pretreatment surface and structural conditions of each section included. Figure 4 illustrates the pavement structure configurations for both high- and low-traffic-volume roads. The structural condition for both testing sites was evaluated through deflection testing using the Falling Weight Deflectometer (FWD). Pretreatment deflections, measured at multiple distances from the load plate, were normalized to 20 °C and 40 kN to calculate the Area Under the Pavement Profile (AUPP), the Surface Curvature Index (SCI), the Base Damage Index (BDI), and the Base Curvature Index (BCI). The SCI, BDI, and BCI represent the structural condition of the surface, base, and subgrade layers, respectively [25]. Higher values indicate greater damage in the corresponding layer. The same principle applies to the AUPP, which correlates with bottom-up fatigue cracking of the asphalt concrete (AC) layer, although no specific thresholds have been defined for this parameter [26].
The average indices obtained are presented in Figure 5 and Figure 6 for low- and high-traffic-volume roads, respectively, along with one standard deviation. These indices were compared to established benchmarking thresholds for asphalt pavements with granular bases (Table 3). The structural pretreatment condition for the low-traffic-volume road exhibited higher variability across the sections analyzed. For instance, some sections were in severe or warning condition based on the BCI, suggesting greater damage or moisture susceptibility in the pavement subgrade, which compromises structural integrity. In contrast, sections from the high-traffic-volume road presented an overall good and homogeneous structural condition, with most values falling within the sound category.
When evaluating the pretreatment surface conditions, three main indicators were considered: cracking (expressed as a percentage of the total section area), surface roughness measured by the IRI (m/km), and the average rut depth (mm) across both wheelpaths. These indicators were selected because they represent the primary surface distresses influencing ride quality, safety, and pavement longevity. Figure 7 summarizes the average pretreatment surface indicators for both traffic levels. The obtained values were compared and categorized according to the thresholds defined by the FHWA (Table 3). Similarly to the structural analysis, sections from the low-traffic-volume road exhibited greater variability across the sections and categories. In contrast, the high-volume road presented a good and homogeneous surface condition prior to treatment, as reflected by all three indicators.
Overall, the pretreatment evaluation of both structural and surface conditions revealed a consistent pattern: the low-volume road sections displayed greater variability and, in some cases, significant deterioration in both the upper and lower pavement layers. This suggests potential vulnerabilities such as moisture susceptibility in the subgrade and more pronounced surface distresses. If left untreated, these issues could accelerate performance loss, particularly evident on CSAH-8 (low volume), which has been directly affected by high-severity transverse cracking. Conversely, the high traffic-volume road sections maintained a generally sound structural foundation and uniform surface quality before treatment, providing a stronger baseline for predicting and quantifying treatment benefits in subsequent performance, environmental, and economic analyses.

4.2. Performance Modeling and Derived Benefits

Given the nature of the dataset, which consists of panel data with one pre-treatment IRI value and several post-treatment observations, a two-step modeling procedure was adopted to effectively isolate and evaluate treatment performance. In the first step, the deterioration rate (slope) of pavement performance after treatment was estimated with longitudinal models, such as linear mixed-effects (LME) models. These models account for both fixed effects (time) and random effects (variability across treatment families or section groups), making them well suited for capturing within-group and between-group variation in post-treatment IRI progression [27]. A logarithmic transformation of the IRI was applied to satisfy linear modeling assumptions, particularly linearity and homoscedasticity. In the second step, the performance jump (PJ), defined as the immediate reduction in the IRI resulting from the treatment, was calculated using the difference between the single pre-treatment IRI observation and the first available post-treatment value.
This two-step approach (Figure 8) enables the modeling of the IRI over time as a combination of an initial condition, an instantaneous treatment effect (PJ), and a post-treatment deterioration rate, providing a more interpretable and modular framework for evaluating preservation strategies. The PJ was modeled separately rather than within the LME model because only a single pre-treatment observation was available per section, preventing estimation of treatment-specific intercepts within the longitudinal framework.
As a first step, a linear mixed model with random intercepts and slopes by treatment group was fit to estimate treatment-type-level IRI deterioration rates using Python (3.11 version). Specific slopes were averaged by treatment to produce treatment-level deterioration rates; 95% confidence intervals for these means were obtained from fixed effects, Equation (1). In this model, the absence of a time × treatment interaction does not imply that all treatments share the same deterioration slope. Treatments were clustered into groups by treatment family (e.g., chip seals, micro surfacing, thin overlays), with each family modeled on its own random effect. Within each group, sections received the same type of treatment, allowing the model to account for correlation in deterioration behavior among treatments from the same family. An overall untreated control group (baseline) was also included as a separate mixed effect to provide a consistent reference point. This specification prevents inflating the model by replicating untreated data for each treatment type while enabling estimation of both the initial post-treatment performance level and the family-specific deterioration rates.
l n ( I R I i ) = β 0 + β 1 T i m e + β 2 T r e a t m e n t + μ 0 i + μ i T i m e + l n ( k )
where IRIi = estimated IRI for a treatment type (family) “i” (m/km), not including PJ.
  • Treatment = treatment indication (0 = control (untreated), and 1 = treatment).
  • Time = section service time (years).
  • β 0 = overall intercept (average ln (IRI) for the control group and immediately after treatment application measurements).
  • β 1 = average rate of change in ln(IRI) per unit of time for the reference group (control).
  • β 2 = difference in baseline ln(IRI) between the reference (untreated) and the treatments in question, at time = 0 post-treatment.
  • μ 0 i = treatment group-specific deviation in baseline ln(IRI) from the overall β 0 .
  • μ i = treatment group-specific deviation in rate of deterioration β 1 .
  • k = 0.0157828, calibration factor for converting the IRI from in/mi to m/km (model calibrated in imperial units).
Two independent models (one for each road) were trained and cross-validated using the full dataset. Table 4 and Table 5 summarize the estimated fixed parameters, model performance, and the obtained random effects for both models, respectively.
Even though the models will be used to determine a specific treatment slope (a combination of fixed and random effects), a general and statistically significant upward trend of the IRI over time was confirmed (positive β 1 ). Both models yielded a conditional coefficient (R2) greater than the marginal, indicating that most of the explained variance stems from differences between treatment groups rather than from the fixed predictors alone. This highlights the strong influence of group-level effects (such as treatment family) on post-treatment IRI performance and supports the use of a mixed effects framework.
The initial step in the modeling process was to determine the deterioration over time. The slope (deterioration rate) for the different treatment and control groups can be derived from the previous model (Equation (1)). This involves combining the overall rate of change ( β 1 ) with the specific deviation in the rate of deterioration   μ 1 . Mathematically, this can be expressed as the derivative of Equation (1) with respect to time, as shown in Equation (2).
S l o p e β = δ l n ( I R I i ) δ T i m e = β 1 + μ i
where β = slope for each specific treatment type (family). β 1 = average rate of change in ln(IRI) per unit of time (from Table 4). μ i = treatment groups specific deviation in rate of deterioration β 1 (from Table 5). i = treatment groups.
Table 6 summarizes the estimated slopes (β) from Equation (2), representing the post-treatment deterioration rates in the IRI (m/km per year) for each combination of traffic level, treatment group, and pretreatment condition category. Positive slopes indicate increasing roughness over time, with higher values reflecting faster deterioration. Results are presented separately for low traffic (CSAH-8) and high traffic (US-169) sites to account for differences in traffic loading and initial pavement condition distribution. To reduce heterogeneity within categories and better discriminate the pretreatment condition, especially for the low-volume sections, narrower IRI thresholds than those defined in MAP-21 (Table 3) were adopted. Sections were classified using the following IRI bands (m/km) [28]: “Very Good” (<0.95), “Good” (]0.95–1.5]), “Fair” (]1.5–1.9]), “Mediocre” (]1.9–2.7]), and “Poor” (>2.7). These narrower ranges mostly disseminated the fair range from MAP-21 and enabled clearer comparisons of deterioration rates across treatments with similar starting roughness, particularly those that do not fall into the “Good” category.
For the high-traffic road, deterioration rates were modest across all treatment types, ranging from 0.0297 m/km/year for CAPE in “Good” to 0.0556 m/km/year for the control group, also in “Good” condition. This reflects the narrow range of initial conditions, with all being classified as “Good”, and the presence of stronger underlying structures. In contrast, low-traffic sites exhibited greater variability in slopes, influenced by their pretreatment conditions. Treatments applied to “Good” category pavements, such as CAPE (0.0064 m/km/year), performed better than those applied to “Fair” or “Mediocre” pavements, such as THINLAY (0.1451 m/km/year, classified as “Mediocre”), which deteriorated more than twice as fast. Among the “Fair” low-traffic sections, CHIP, MICRO, and CAPE displayed comparable performance, each with rates around 0.060 m/km/year. In general, the control sections exhibited higher slopes, although the differences were sometimes modest. These results indicate that while traffic level influences deterioration, pretreatment conditions could be a dominant factor in long-term performance, mostly for low-volume roads.
From the previous results it is important to highlight the performance of thinlays over time, particularly in low-volume conditions. Although thin overlays are typically known as a robust pavement preservation option, the slopes observed for the THINLAY group in both “Good” and “Mediocre” pretreatment conditions were among the highest for all treatments studied. This trend is consistent with earlier findings from the LTPP SPS-3 study [29], which reported that thin overlays did not substantially improve performance in terms of alligator, longitudinal, and transverse cracking (typically captured by IRI measurements), due to the high rate of reflective cracking. While cracks may be initially hidden by the overlay, they often reappear within a few years, resulting in accelerated deterioration and a shorter remaining service life [29]. The increased slopes observed in this study are likely reflecting the same mechanism; on low-volume roads, thinner structures and different pretreatment conditions make thin overlays more prone to reflective cracking, while more robust structures with higher-quality construction on high-volume roads may help delay its manifestation.
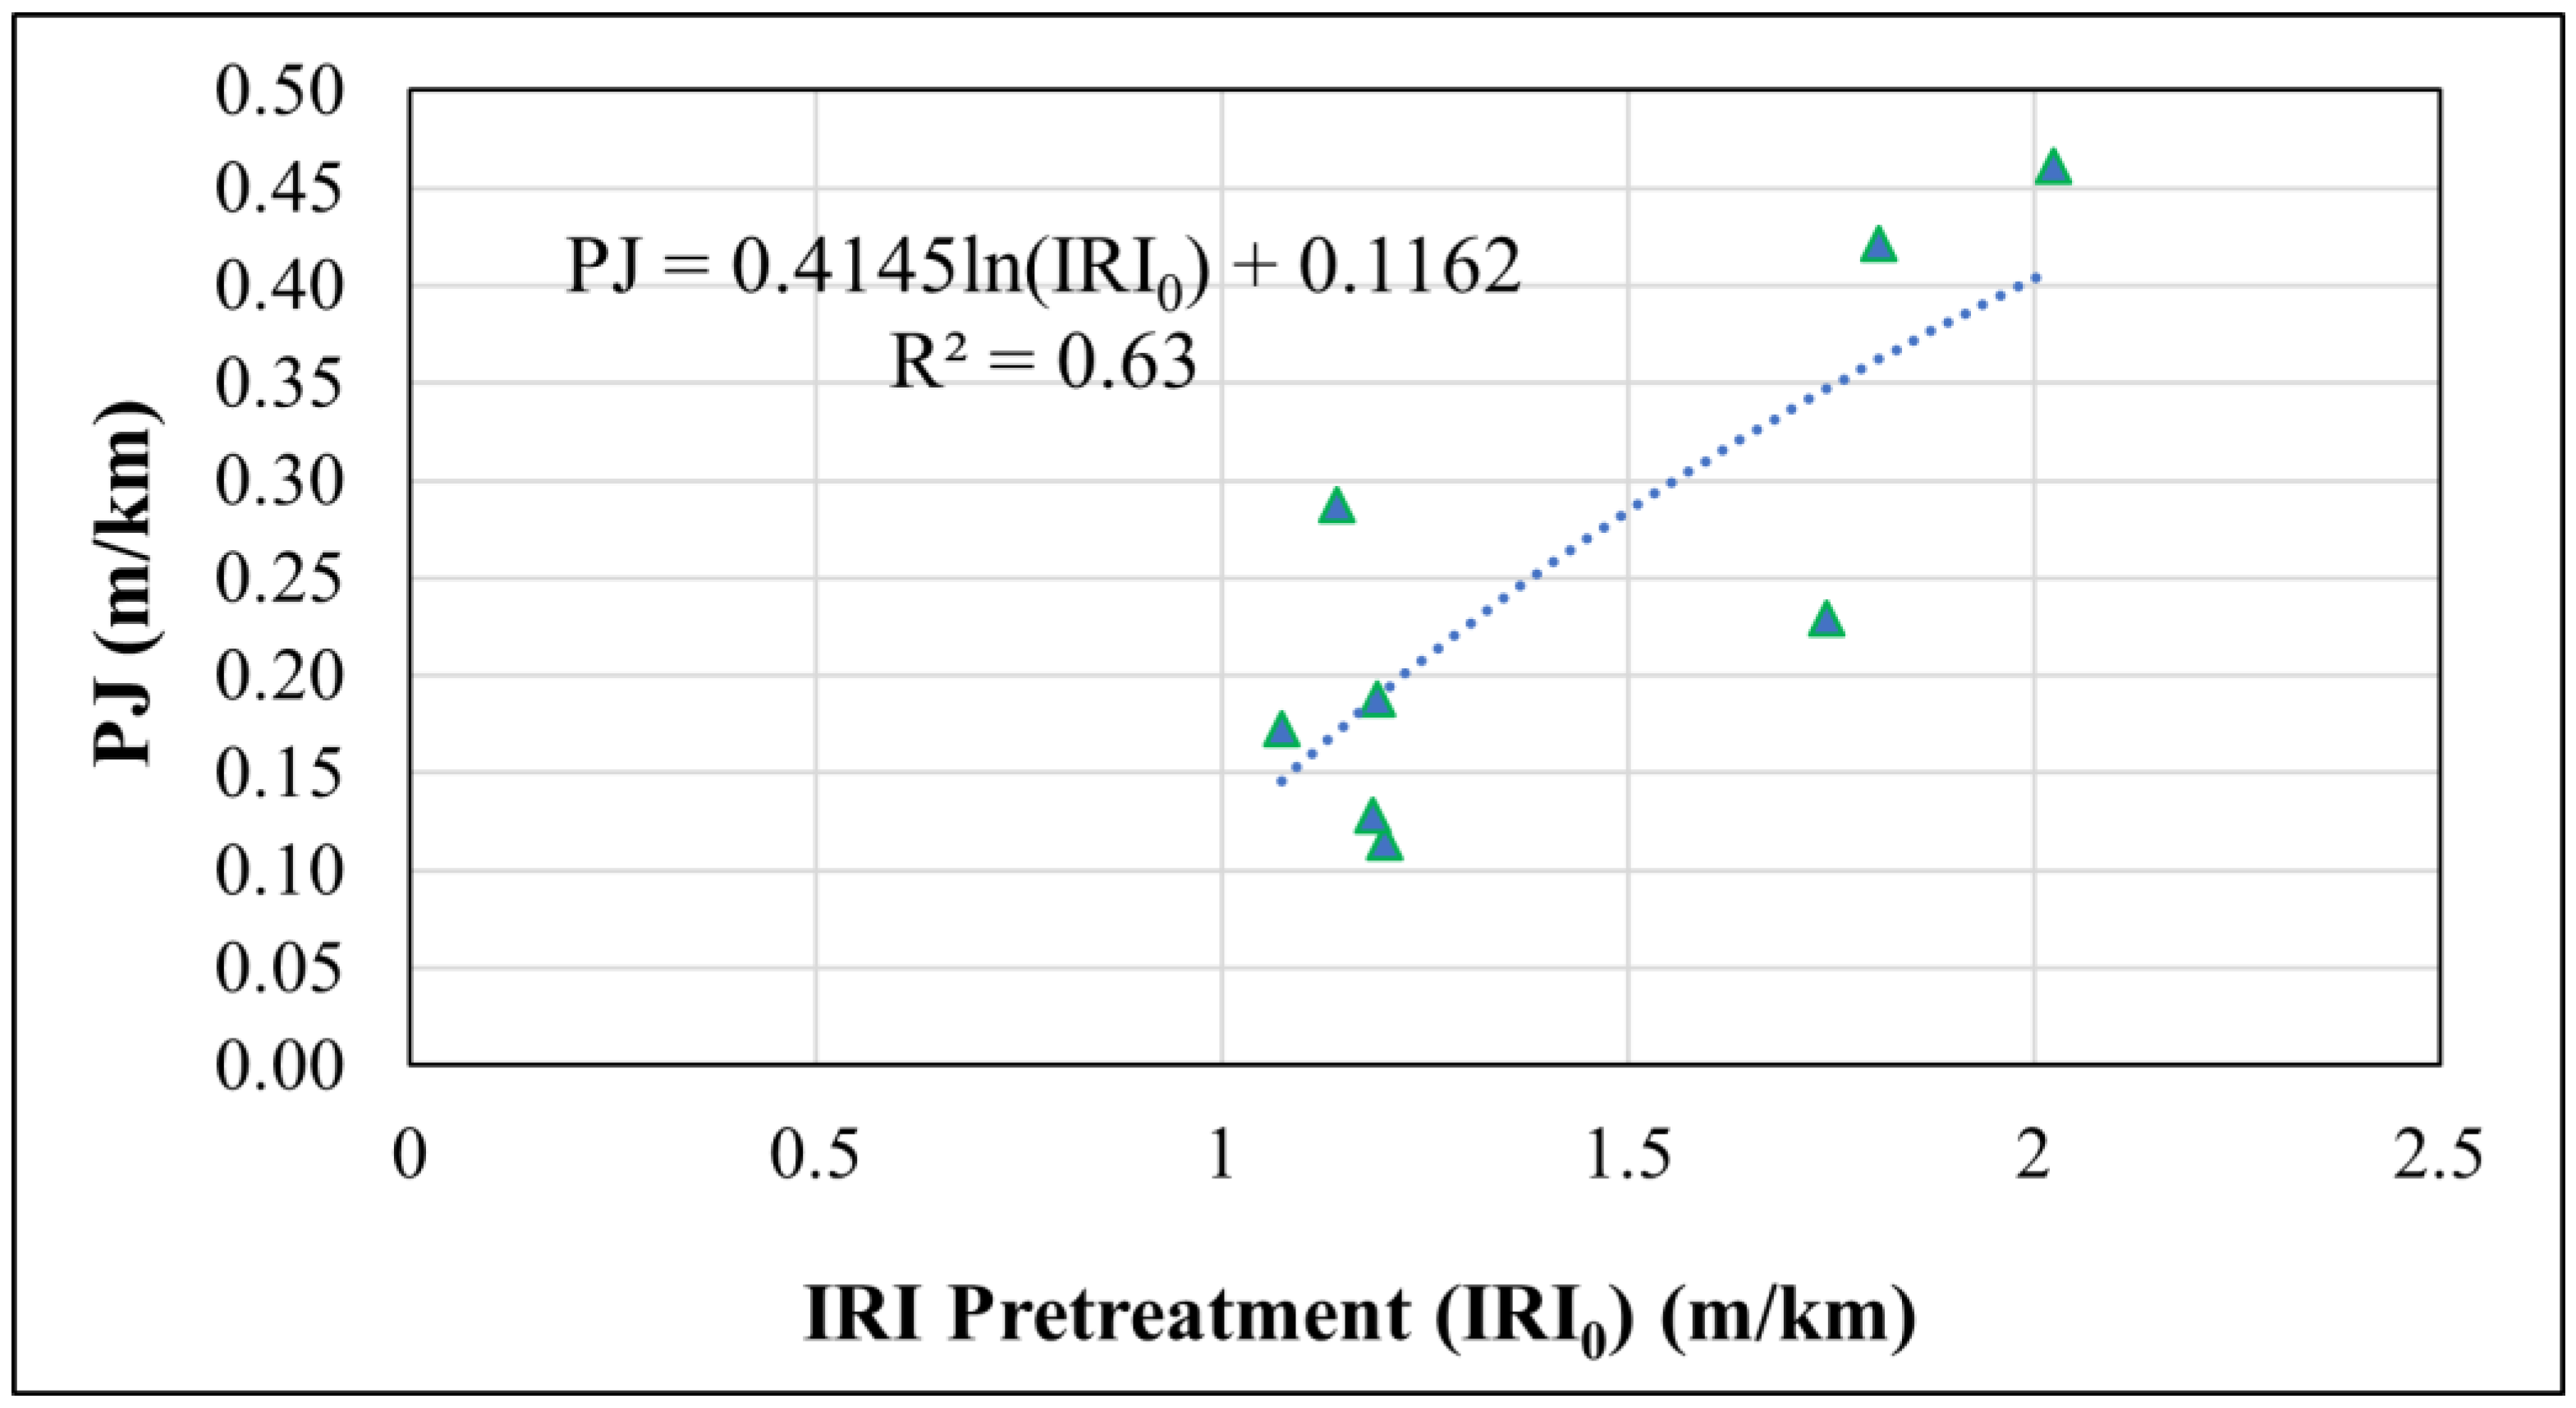
As the second step, the PJ was quantified by calculating the difference between the IRI before treatment and the IRI immediately after treatment application, while excluding time and traffic effects, as shown in Figure 8. This PJ was related to pretreatment conditions, which account for both structural characteristics and surface conditions. Previous studies have found a correlation between pretreatment condition and PJ, often modeled as a logarithmic function [20,30]. For instance, research conducted on the present sections already defined a PJ function for thinlays, accounting for the specific milling process used [21]. Additionally, due to data availability, micro surfacing and cape seals were combined, since cape seals include a micro surfacing layer over a chip seal and have shown similar performance in terms of PJ. Figure 9 presents the PJ values for micro surface and cape seal treatments as an example. It was noted that chip seals showed no significant immediate benefits after treatment application in terms of the IRI [31]. Table 7 summarizes the derived PJ equations and the corresponding data ranges.
The results from the models were combined in a two-step process to create an equation that represents both the immediate change in roughness and the change overtime for a given pretreatment condition Equation (3). These results provide treatment- and condition-specific deterioration rates and performance jumps. This information can be directly integrated into user cost models, allowing for more accurate estimates of treatment benefits, optimal timing, and cost-effectiveness.
I R I t = e ln ( I R I 0 P J ) + β T i m e
where I R I = estimated IRI for treatment type (m/km)
  • I R I 0 = pretreatment IRI for section being treated (m/km)
  • β = slope for each specific treatment type (from Table 6).
  • P J = performance jump (m/km) for each treatment type (from Table 7)
  • Time = specific point in time for calculating the IRI (years).

5. Economic Benefits and User Costs

5.1. Pavement–Vehicle Interaction Models (PVI) and Input Limitations

As the literature indicates, when selecting PVI models for analysis, it is important to consider their limitations, such as pavement structure, surface types, vehicle types, and pavement characteristics included (since surface characteristics-based models may already account for some structural response effects) [32]. Additionally, pavement preservation treatments are intended to improve pavement surface conditions [33]. For this specific case, the National Cooperative Highway Research Program (NCHRP) I–45 model was used. More information about this model can be found in external sources [34].
Predicted data and specific input assumptions, detailed in the following lines, were utilized as the main inputs for these models. First, the initial IRI measurements and their progression over time were obtained from the models developed in previous sections Equation (3). Due to the differences in testing periods for the IRI and texture, the initial texture, given by the Mean Profile Depth (MPD), was set as 0.8 mm (0.031 in) [35]. Previous studies incorporating macrotexture into pavement preservation efforts defined a pavement section as rough if the initial MPD is 1.2 mm or higher [36]. Additionally, the rates of change in MPD can vary significantly depending on localized distresses such as raveling and bleeding, which have a negative effect on macrotexture. Rates lower than 0 mm/year for thinlays or −0.15 mm/year for chip seals are considered indicators of bleeding and aggregate loss, while change rates greater than 0.11 mm/year for thinlays and 0 mm/year for chip seals are indicators of raveling [36].
For consistency, the analysis was limited to changes in the IRI. Previous studies have indicated that, despite pavement surface characteristics, the total excess fuel consumption from PVI models is highly sensitive to future traffic growth projections [37]. Sensitivity analyses show that MPD effects on fuel consumption are modest compared to roughness, but this simplification remains a limitation in long-term analyses [38]. In addition, other assumptions related to vehicle weights, speeds, and traffic growth rates were based on typical project-specific values rather than sensitivity-tested ranges, which may also influence the absolute results.
In terms of traffic, several vehicle characteristics are important attributes for these models, particularly aerodynamic coefficients. However, these attributes have already been incorporated into the models for defined vehicle types. To simplify the analysis, two specific vehicle types were considered: passenger cars (considered classes 1 to 3 of the HDM-4 model) and heavy trucks (considered classes 8 and above from the HDM-4 model). The gross vehicle weights (GRVW) of both types were assumed to be 1450 kg (3200 lb) for passenger cars and 36,287 kg (80,000 lb) for heavy trucks, which is the maximum legal GRVW for semi-trucks [39].
Two different scenarios were analyzed based on the traffic volume obtained from traffic counts. For high traffic volumes, an AADT of 16,000 vehicles/day with a truck percentage of 20% and traffic growth of 3% was considered. For low-traffic conditions, an AADT of 510 vehicles/day with a truck percentage of 7% and traffic growth of 2% was considered. Equation (4) was used to account for traffic growth. Vehicle speed also varied within low and high-volume traffic scenarios for a more realistic process. Typical speeds of 55 km/h and 96 km/h (35 and 60 mph), respectively, were considered.
A A D T f = A A D T 0 ( 1 + g ) n
where AADTf = future Average Annual Daily Traffic (veh/day). AADT0 = Average Annual Daily Traffic on year 0 (veh/day). g = growth rate. n = period of analysis (years).
A baseline was established to quantify the excess fuel consumption (EFC) due to pavement performance effects. To calculate the EFC at any given moment, the instant fuel consumption (IFC) from the baseline was subtracted from the IFC of a determined treatment measured at the same point in time, as shown in Equation (5).
E F C = I F C T I F C 0
where EFC = excess fuel consumption (L/km). IFCT = instant fuel consumption due to treatment (L/km). IFC0 = instant fuel consumption due to baseline 1 m/km (L/km).
Baselines are meant to simulate the fuel consumption of vehicles on as-constructed pavement conditions and enable consistent comparisons within different pavement structures or characteristics. In this case, a baseline with a fixed IRI of 1 m/km and a texture of 0.8 mm was considered. The influence of temperature in the NCHRP I-45 model was removed by using the actual ambient temperature as a reference point for each measurement. Additionally, the same traffic conditions were applied, as previously described. The specific effects of roadway characteristics (curves, cross slopes, superelevation) were not considered, nor were the effects of changes in speed from specific events or a traffic attraction factor due to surface roadway improvement.
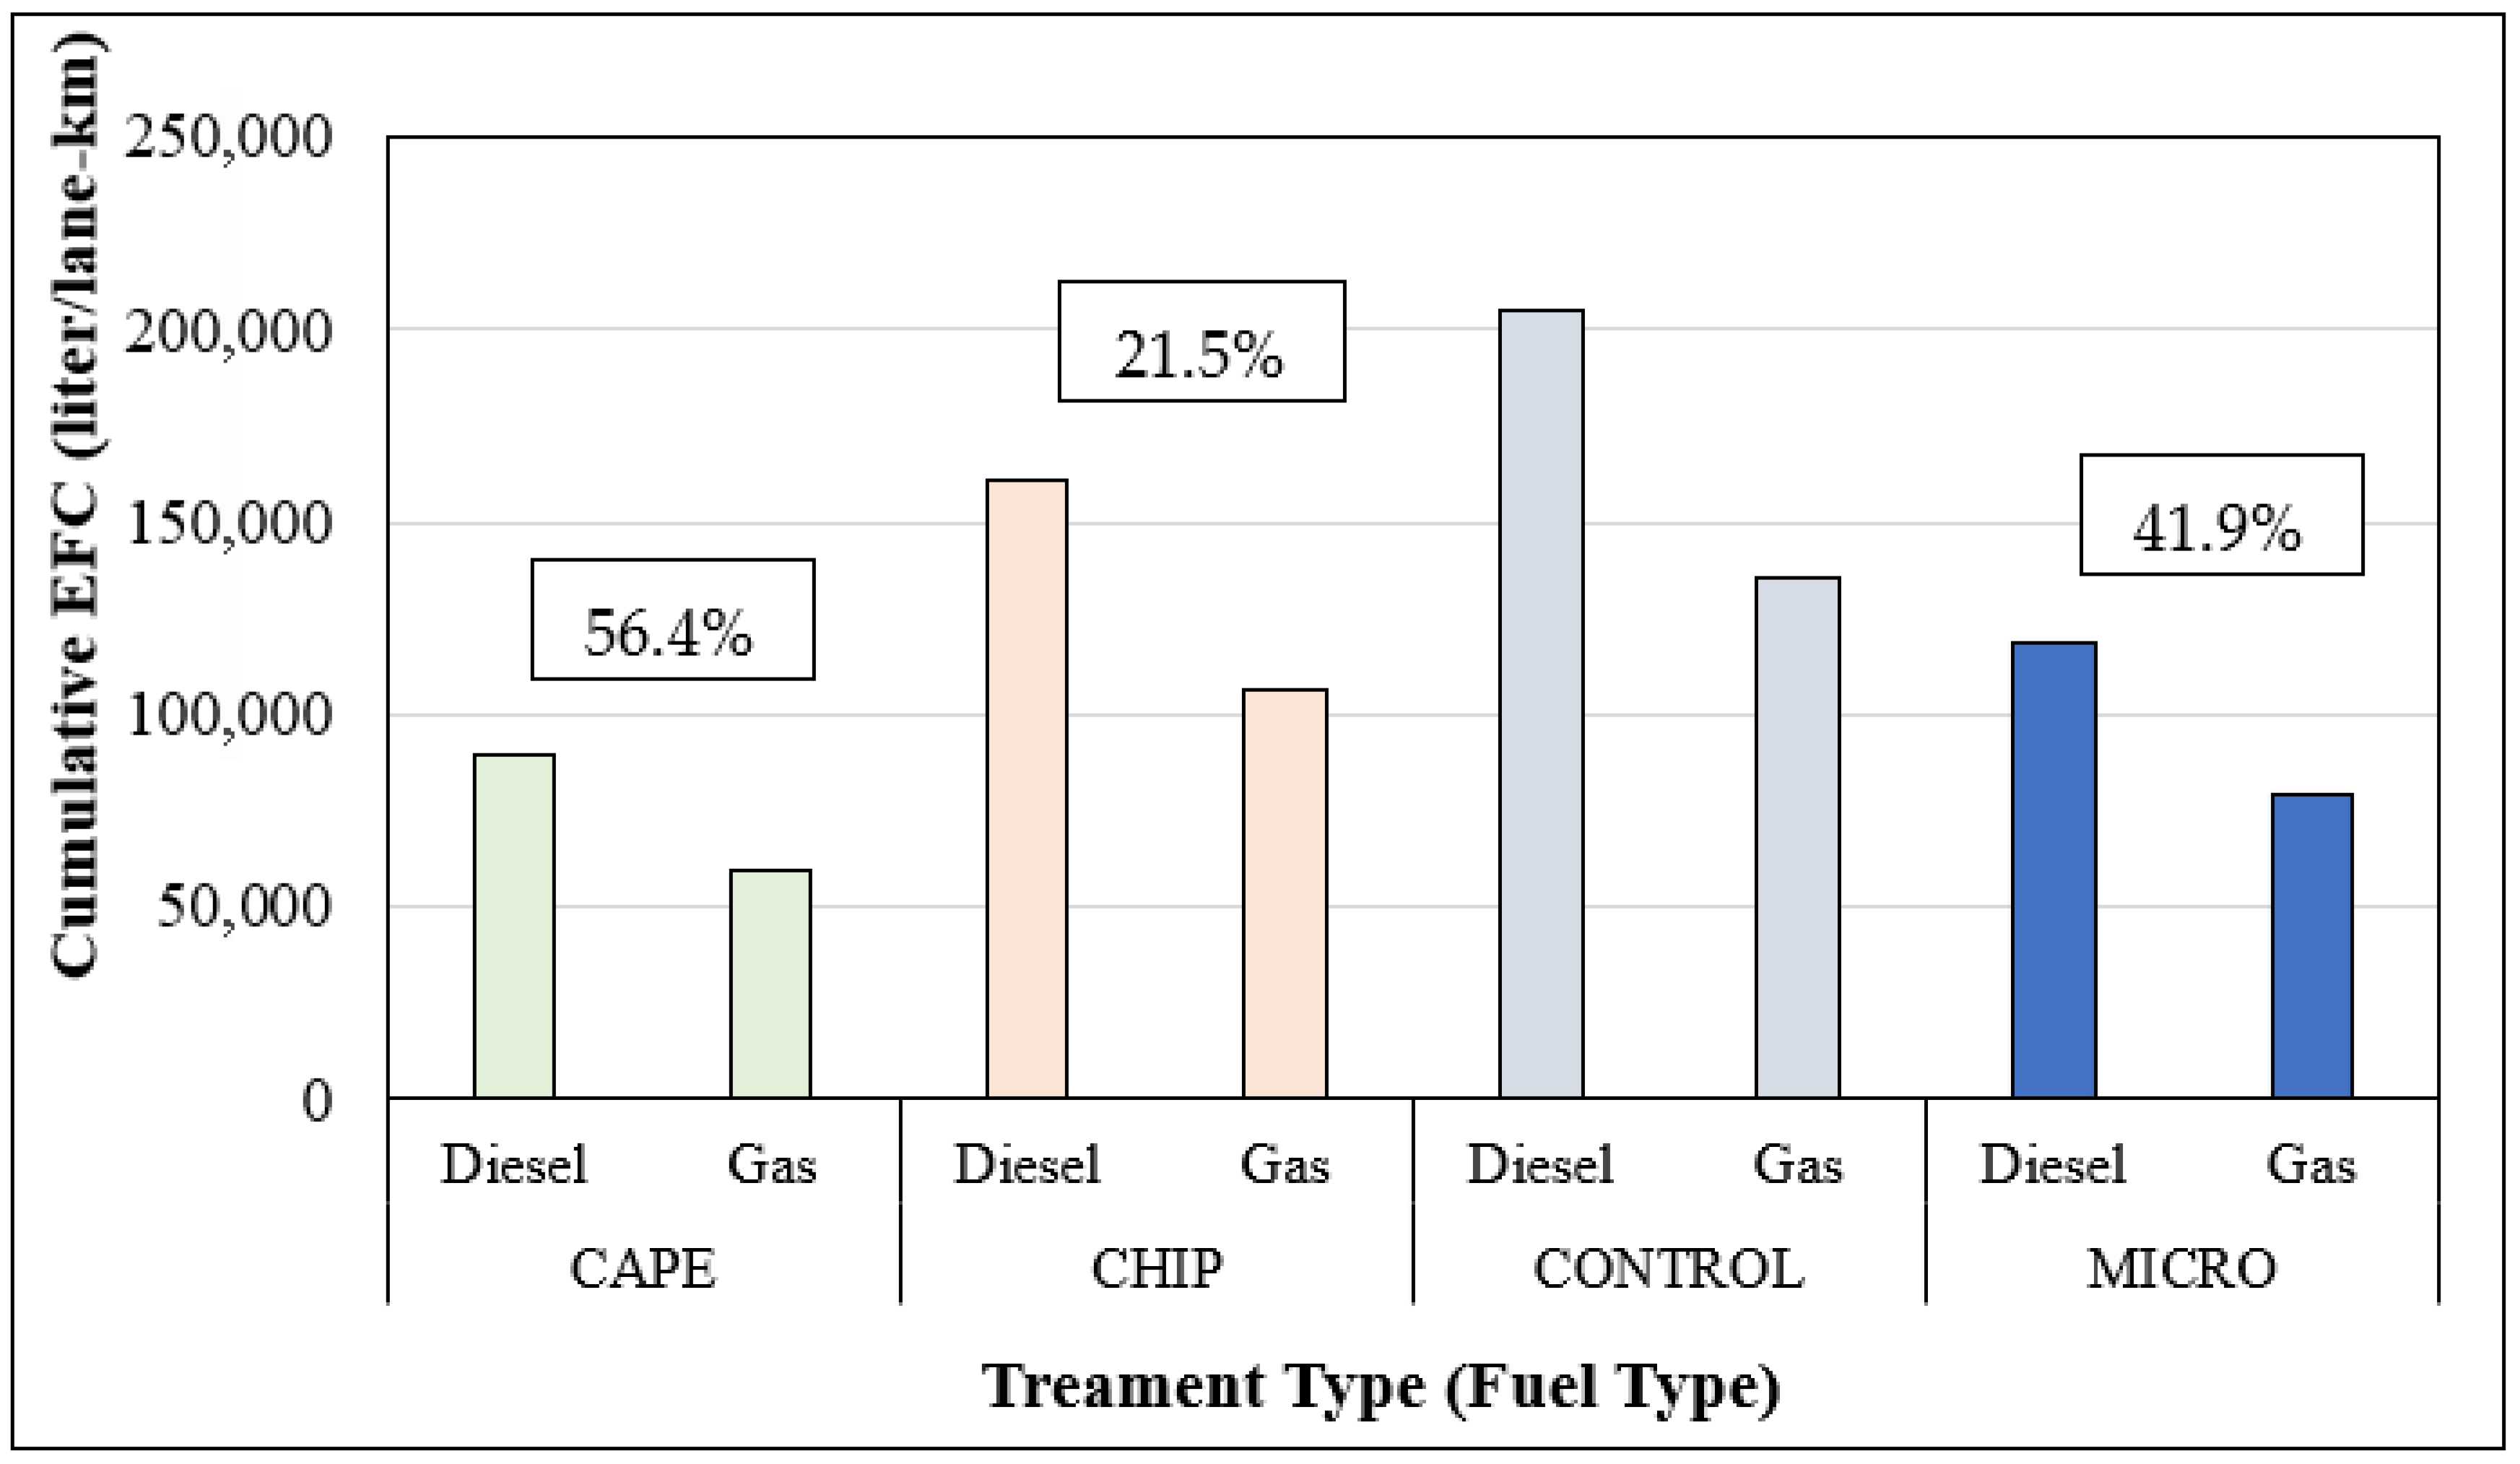
Figure 10 presents the estimated EFC over a 10-year period for the high-volume road per lane–km, standardized to a pretreatment condition of 1.57 m/km to ensure consistency in the starting point. Higher EFC values for untreated sections (control) indicate that all treatments outperform the control throughout the analysis period. The percentage reduction in EFC was calculated using the control as the reference benchmark. For example, cape seals achieved a 56.4% reduction in EFC by the end of the analysis period compared to the untreated section. Due to their substantial performance jump (PJ) and slower deterioration rate, thinlays outperformed all other treatments and even the baseline condition; consequently, no EFC was assigned to them. These findings confirm the capacity of robust pavement preservation treatments to significantly reduce user costs, as expressed through EFC.
Figure 11 illustrates the costs associated with EFC over the entire analysis period, alongside average initial treatment costs obtained from external sources. Fuel prices were assumed at USD 0.65/liter for gasoline and USD 0.83/liter for diesel. Higher EFC values correspond to higher user costs resulting from fuel consumption. Monetary savings from EFC reductions can be estimated as the difference between treatment and control curves for a given period; the greater the separation, the greater the savings. For example, using the control as the reference, the initial investment in a micro surfacing treatment can be offset by user cost savings (considering only excess fuel consumption) within approximately 3 to 3.5 years for this scenario.
A similar process was applied to the low-volume road sections (CSAH-8), where greater variability in initial conditions was noted in the performance chapter. Figure 12 presents the EFC over a 10-year period for this scenario (1 lane-km), standardized to a pretreatment condition of 1.57 m/km. Higher EFC values for untreated sections (control) indicate that all treatments outperformed their respective control throughout the analysis period when starting from the same initial condition. However, the absolute EFC values were significantly lower than those observed for high-volume roads. This finding aligns with previous studies on pavement maintenance and preservation, which show that net savings in fuel and energy consumption are largely driven by traffic volume. For low-volume segments, the potential benefits accumulate more slowly, and the payback period may extend beyond the service life of the treatment [16].

5.2. Life Cycle Cost Analysis: A Case Study

A theoretical case study was performed for demonstration purposes only to exemplify the derived findings. A deterministic LCCA with a sensitivity analysis for discount rate was performed. Two pavement scenarios on a lane-kilometer of a wet freeze region highway were evaluated for a 10–year analysis period. An initial 1.55 m/km was assumed for this study. Since the objective of the analysis is to illustrate the economic benefits of preserving pavement structures instead of optimizing preservation activities, the first alternative is an untreated pavement scenario. In contrast, the second alternative considers a pavement with micro surfacing applied at years 0 and 5 of the analysis period. The traffic conditions described previously for a high-volume scenario were utilized, as well as the defined baseline. Agency costs were represented by the preservation treatment investment and were gathered from external sources [40]. User costs were quantified based on the EFC derived from the deterioration of each pavement condition over time, as given by PVI models. Specifically, the NCHRP I-45 model results were used in this example. The IRI was reset according to the specific treatment PJ after the second application was performed in Scenario 2. An inflation rate of 3.0% and the same detailed price of USD 0.65/liter for gasoline and USD 0.83/liter for diesel fuel were used as inputs. The Equivalent Uniform Annual Cost (EUAC) was determined for each alternative using Equation (6).
E U A C = N P V i ( 1 + i ) n ( 1 + i ) n 1
where NPV = net present value (USD), i = discount rate (%), and n = analysis period (years).
Table 8 summarizes the EUAC for each scenario. The results suggest that for the analysis period it is more cost-effective to treat a pavement than to leave it untreated (lower EUAC). Specifically, treating the pavement (scenario 2) would represent an average yearly saving of USD 11,067 (average difference in EUACs) per lane-km in EFC, which directly benefits road users. In other words, treatment cost (micro surfacing) is offset by the reduction in user costs (EFC due to immediate and progressive reduction in the IRI), making the treated option more economically viable. Even though users’ costs are mainly based on changes in pavement conditions given by the IRI, structure salvage value and additional user costs (tire wear, excess of oil consumption) have also contributed to justifying the investments [34]. Nevertheless, this case demonstrates the potential of pavement preservation treatments. When optimizing preservation alternatives, it is recommended to account for the specific agency “treatment toolbox,” additional user costs, and stochastic LCCA procedures that can incorporate the risk of volatility in key inputs such as price, service life, and traffic, providing a probability distribution instead of a single value for stakeholder decisions [41].

6. Emissions Reductions from User Stage

From an environmental standpoint, excess fuel consumption from pavement-vehicle interactions during the use phase can be directly linked to excess emissions. Vehicle operation on United States roadways uses over 688 billion liters of fuel, and pavement condition influences the energy consumption of vehicles [42]. The combustion of fossil fuels generates carbon dioxide (CO2), a primary driver of climate change. It also releases other pollutants, including methane (CH4) and nitrous oxide (N2O), which have immediate negative effects on humans. These emissions, collectively known as GHG, are a major concern for both environmental and public health [43].
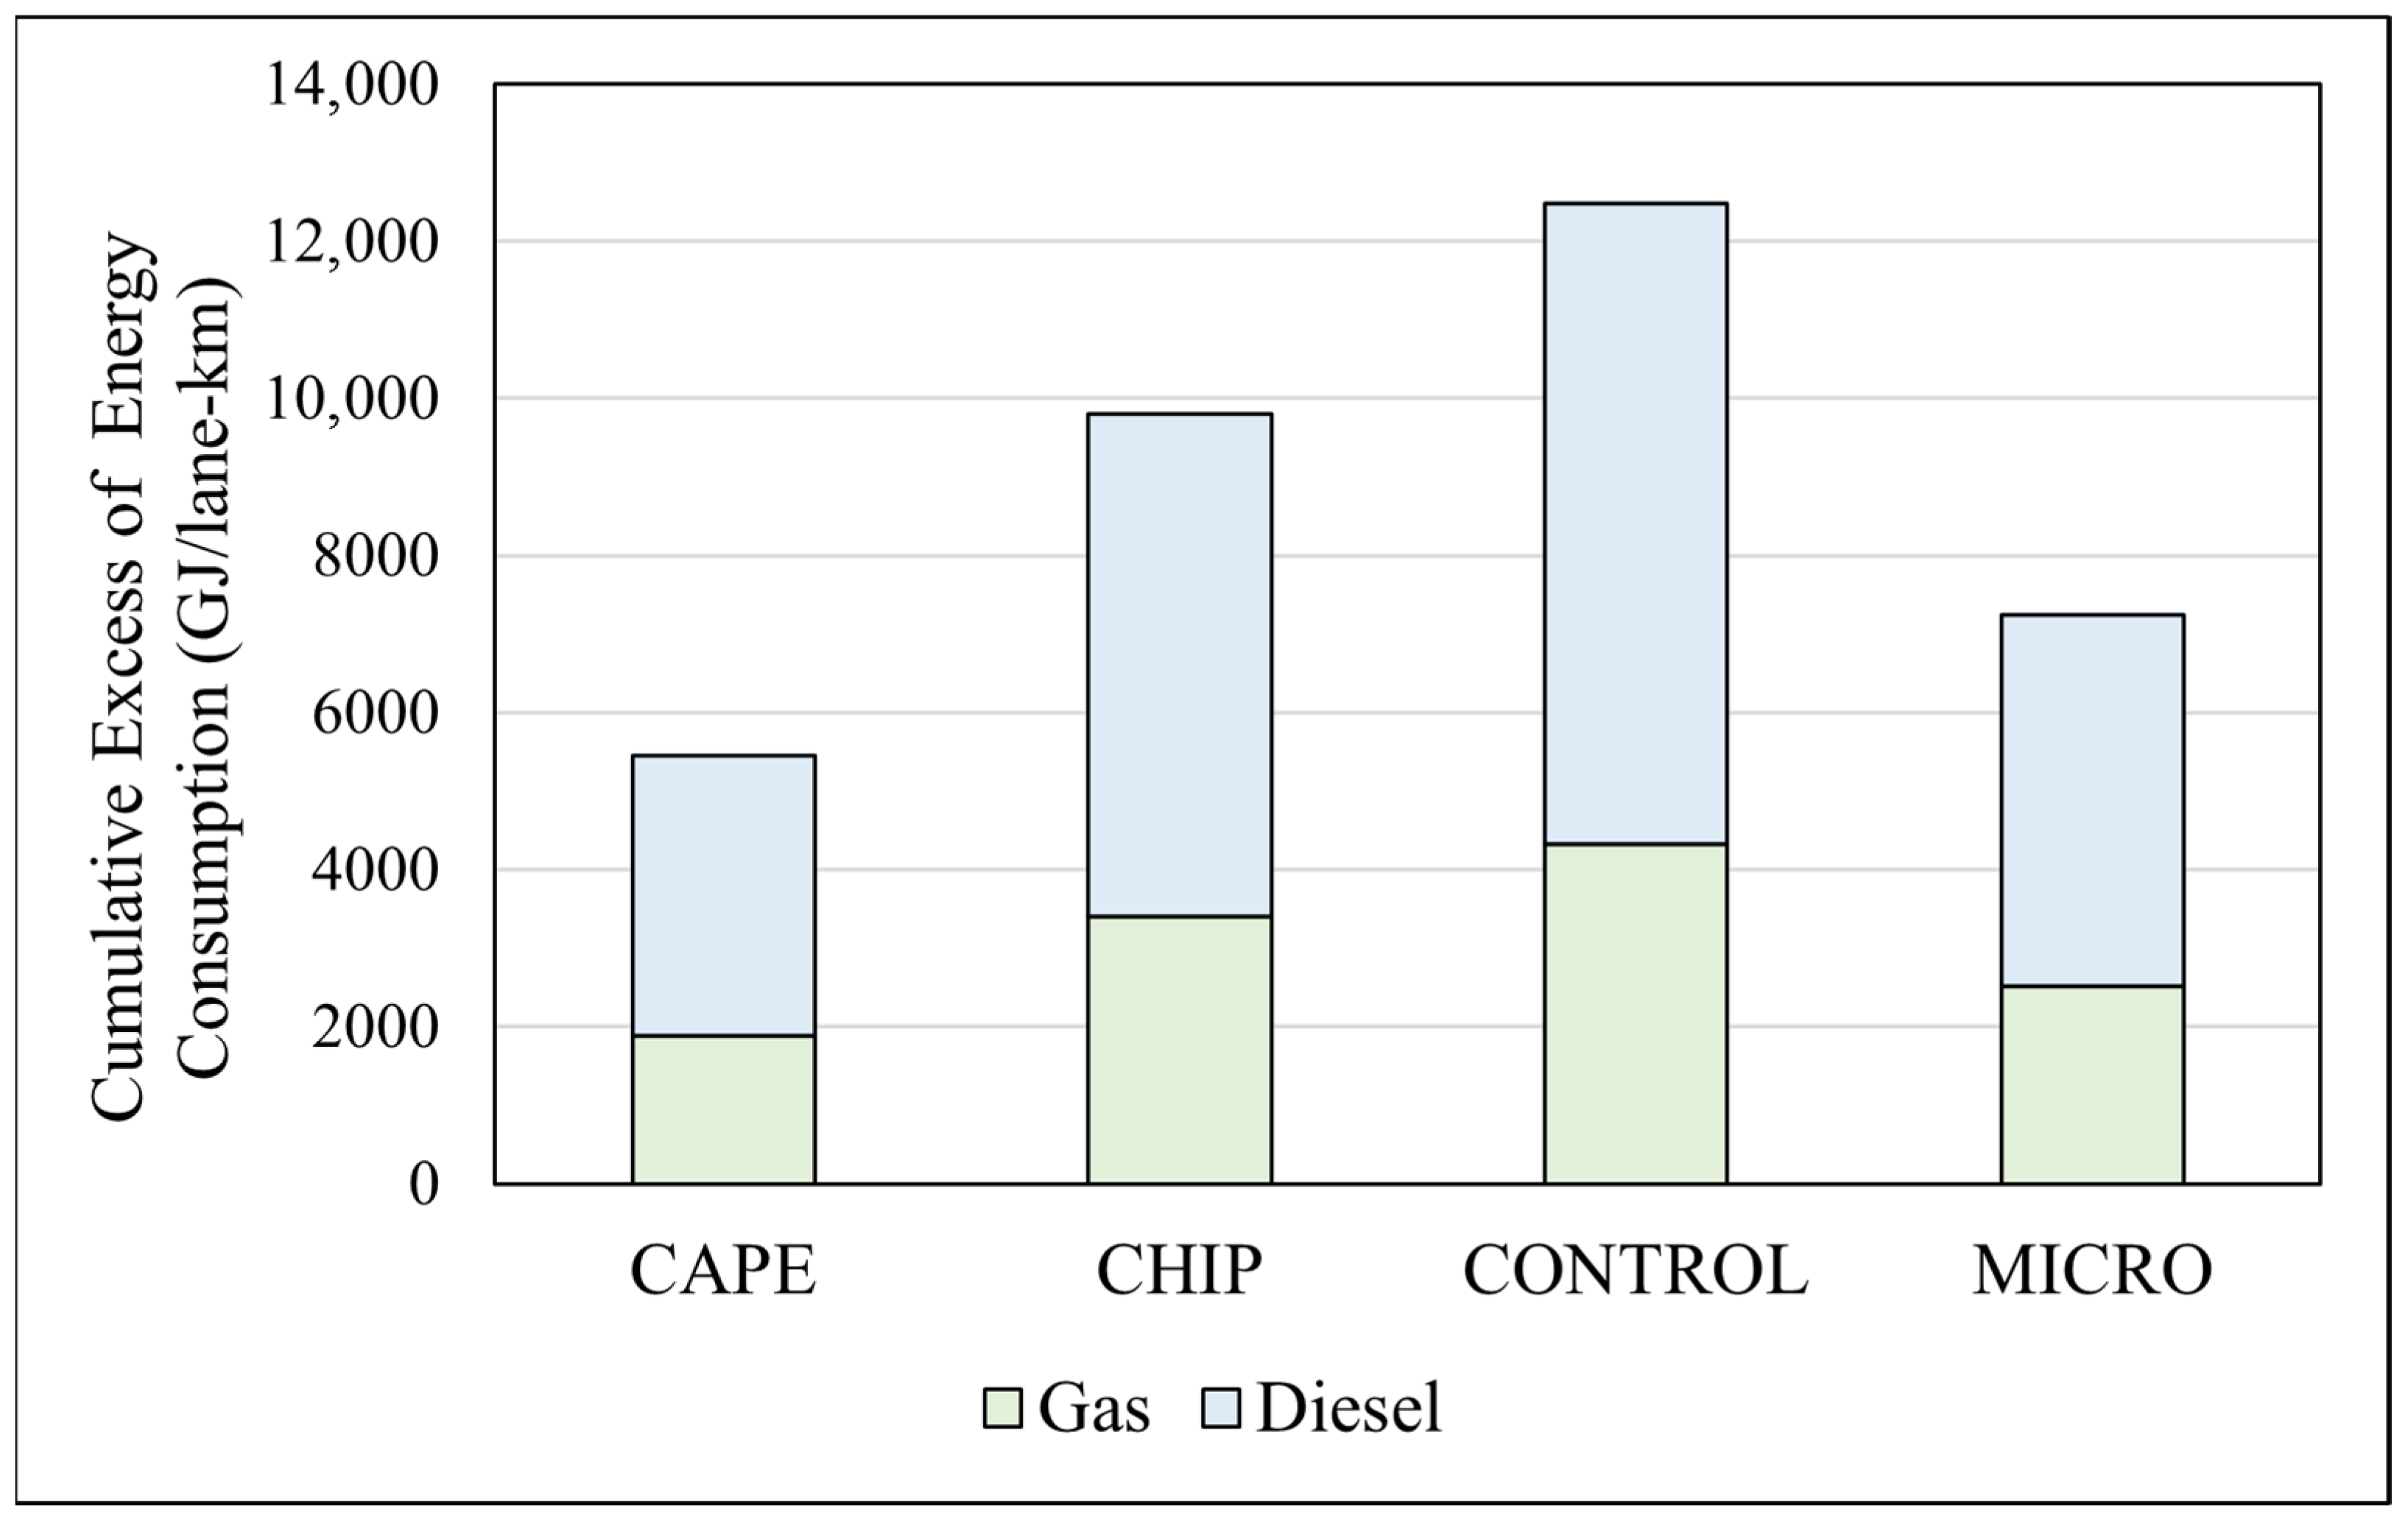
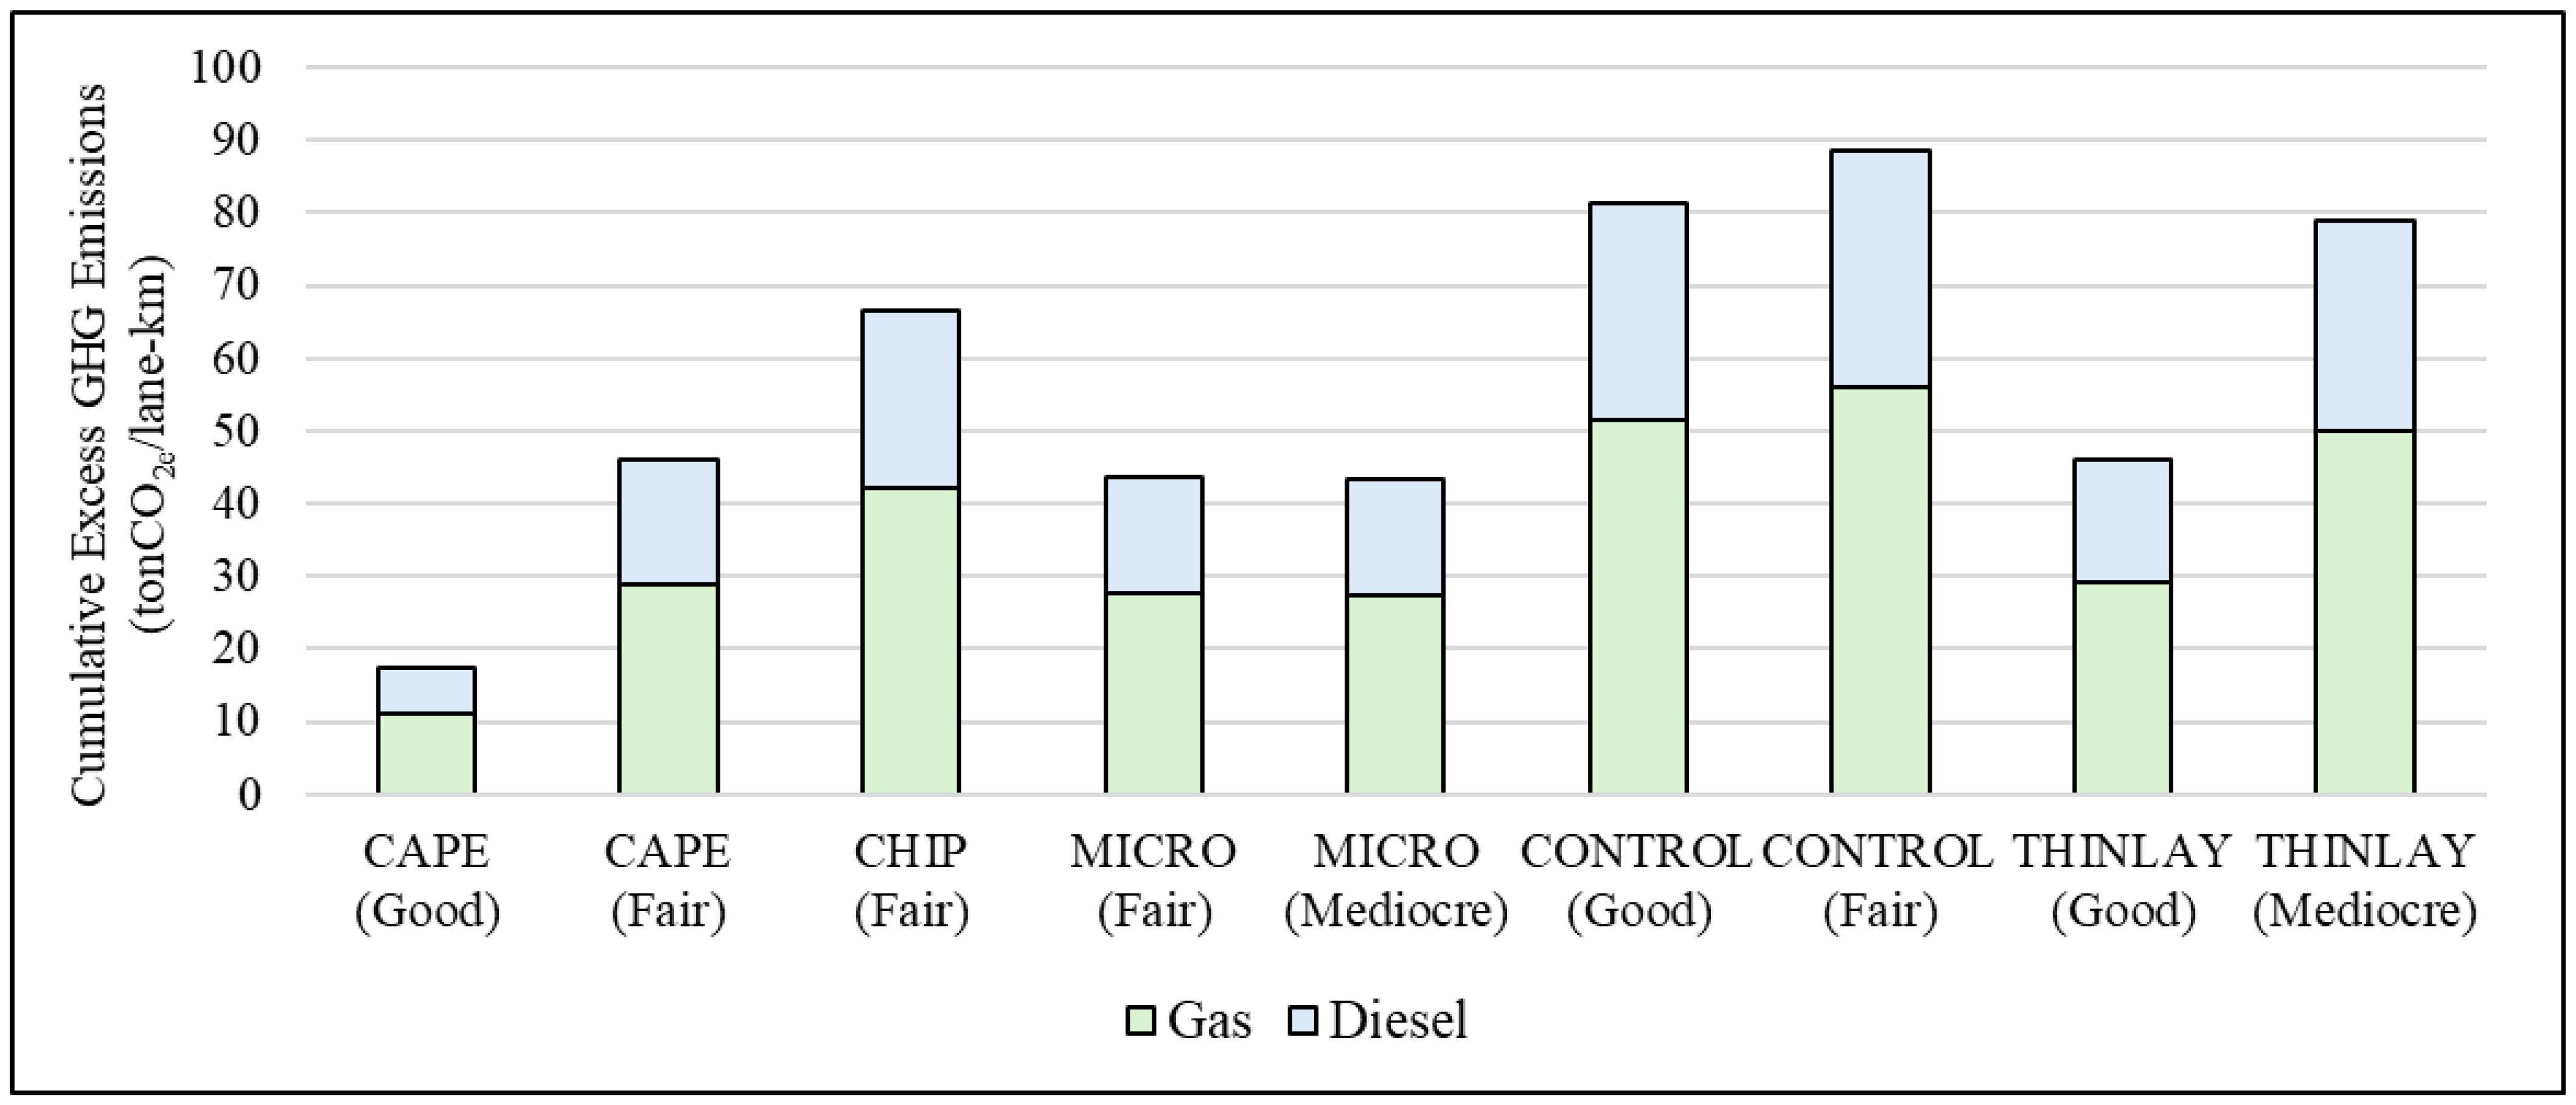
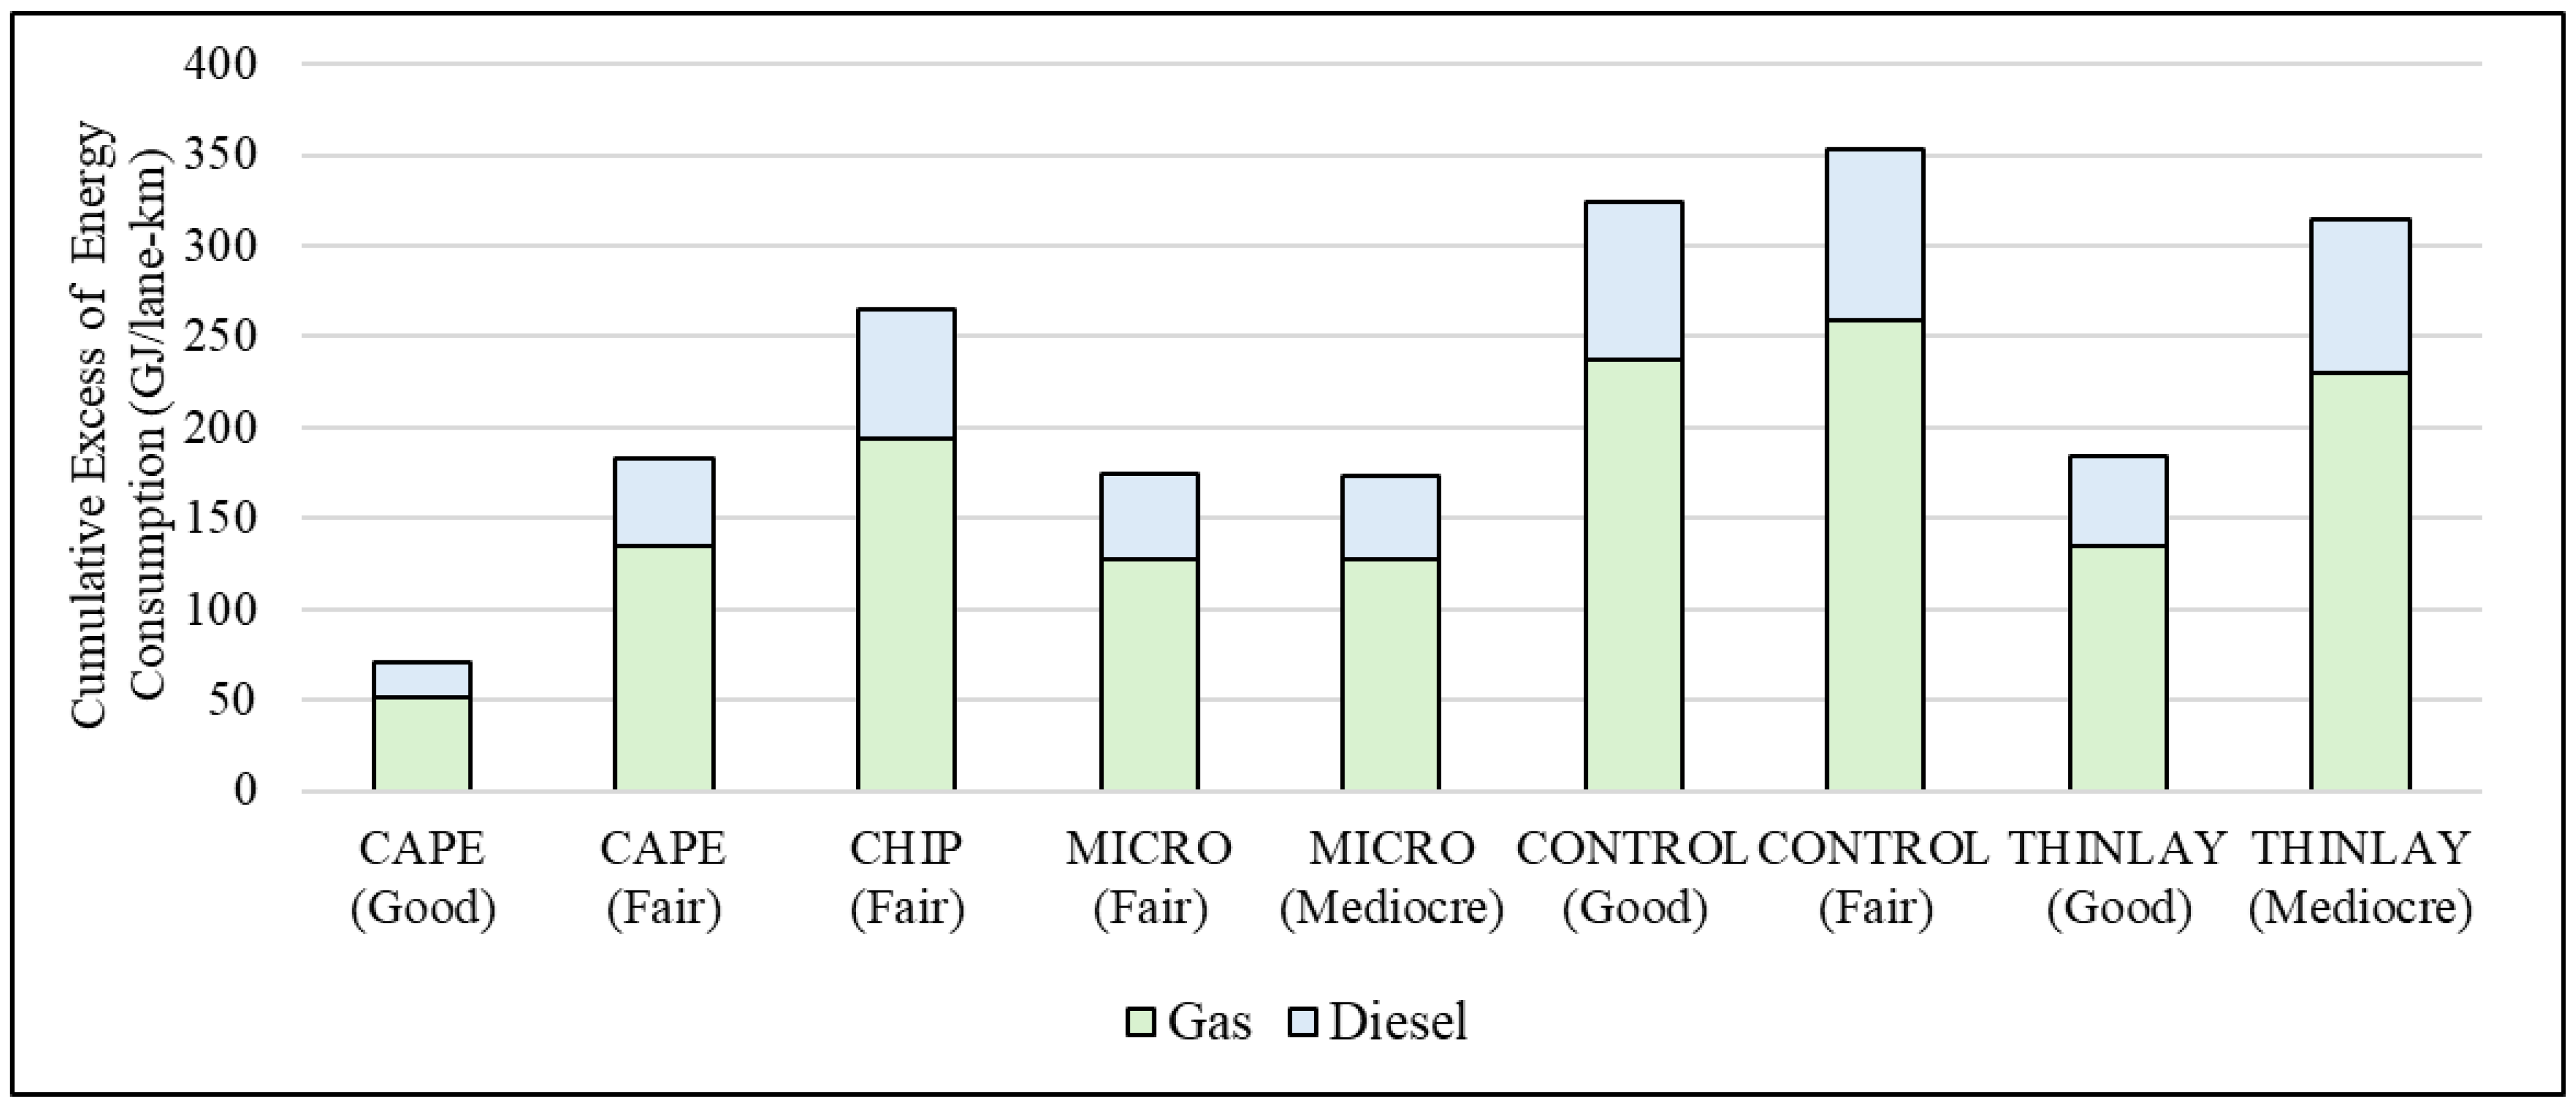
Maintaining pavements in a sound condition has revealed the capacity to reduce these GHGs in the user stage. An excess of consumed energy was quantified based on the EFC obtained from the NCHRP I–45 model. CO2 emissions were calculated as emissions from total energy consumption as detailed in the Motor Vehicle Emission Simulator [9]. Emissions from additional GHGs such as CH4 and N2O were quantified based on equivalent factors for both passenger gasoline cars and heavy-duty diesel trucks [44]. These values were deemed suitable for a conceptual-level analysis; however, it is recommended to use MOVES as the modeling framework for on-road emissions to obtain more refined results based on the specific conditions experienced. To quantify the overall effect of GHGs, a combined measure of GHG emissions, weighed according to the global warming potential of each gas relative to CO2 and known as Carbon Dioxide Equivalent (CO2e), was employed [9]. Meanwhile, to quantify the energy consumption, equivalences from the Environmental Protection Agency were used to convert from excess fuel to excess energy consumption (1 L of gasoline = 31.9 MJ for passenger vehicles and 1 L of diesel = 39.8 MJ for trucks) [45]. Figure 13 and Figure 14 illustrate the excess GHGs expressed as CO2e and the consumed energy (GJ) for the high-volume road, respectively. Meanwhile, Figure 15 and Figure 16 illustrate the excess GHGs (tons CO2e) and the consumed energy (GJ) for the low-volume road, respectively.
As shown in Figure 13, Figure 14, Figure 15 and Figure 16, the treated sections outperformed untreated sections from each region, as expected. This confirms that the benefits derived from preserving pavement structures involve performance enhancements and potentially lower user and environmental costs from the emissions derived from the EFC. In other words, a smooth pavement surface led to a reduction in the emissions and energy consumption from traffic.
Although this study only considers two traffic classes, it is crucial to emphasize the significant contribution of trucks to emissions in high-volume traffic scenarios. According to the U.S. Environmental Protection Agency, light- and heavy-duty trucks account for approximately 80% of the GHG emissions from the U.S. transportation sector [46]. This highlights the potential benefits of treating highway pavements and warrants further research into the feasibility of implementing these treatments. Nonetheless, a life cycle analysis (LCA) is necessary to compare the environmental costs of these treatments to the emissions from their production and application. Such an analysis would require high-quality, project-specific data to grant fair comparisons. Since specific data for emissions, energy consumption, construction operations, and hauling distances were unavailable, standard theoretical values were used to estimate these factors for the construction stage and for a lane-kilometer (lane width: 3.65 m), Table 9. These published values encompass the entire process, including raw materials, transport, processing, mixing, and construction [47]. However, it is important to highlight that the use stage of a pavement accounts for 95–98% of its total emissions, dwarfing the emissions generated during construction, maintenance, and preservation, which make up only 2–5%.
A theoretical case study was performed for demonstration purposes only, to illustrate the main findings from the emission reductions. The same alternatives and traffic conditions from the LCCA were evaluated under the same conditions. The GHG emissions and total energy consumption for the micro surface were gathered from the values expressed by Table 9. Table 10 summarizes the excess of energy consumption and emissions for both alternatives.
As previously presented in Table 10, the excess emissions from trucks and cars represent the larger portion of the total emissions, which aligns with previous studies [14]. This highlights the impact that traffic has on this kind of analysis; emissions from traffic diminish the emissions from treatment construction. Moreover, by preserving the pavement structure, reductions in excess emissions and energy were obtained, amounting to 894.5 CO2e ton/km and 384.1 GJ/km for the analysis period, respectively. Nevertheless, the use of high-quality project-specific data is suggested for fairer comparisons, as more effective pavement preservation strategies could incur greater environmental costs from plant production and hauling.
Overall, asphalt pavement preservation treatments, a subset of pavement maintenance, have demonstrated the ability to reduce pavement deterioration, as indicated by decreased IRI progression. This reduction can lead to decreased fuel consumption and energy use resulting from pavement-vehicle interactions.

7. Conclusions

This study analyzed the benefits obtained from applying pavement preservation treatments in asphalt pavements. The results obtained from the analysis of data collected from full-scale pavement test sections led to the following conclusions:
  • In terms of performance and for wet freeze zones, treated sections maintained smoother surfaces longer than untreated sections (lower deterioration rates compared to control), confirming the effectiveness of preservation strategies in maintaining pavement smoothness over time. Further research is needed to explore treatments in no-freeze regions and integrate these findings with pavement-vehicle interaction models.
  • Initial conditions and site-specific factors are critical in determining treatment impact. Variations in pretreatment IRI, traffic composition, and structure condition significantly influence the magnitude of benefits, reinforcing the need for context-specific performance expectations and the fundament of treating pavements while in “Good” condition.
  • Improved smoothness resulted in reduced EFC on treated sections compared to untreated controls. This effect is especially pronounced on high-volume roads, where smoother surfaces reduced rolling resistance, translating into meaningful fuel savings for the road users. This supports the idea of also targeting preservation on high-volume roads, which can maximize the return on investment by the rapid accumulation of savings over the treatment life cycle. On low-volume networks, benefits accumulate at a slower pace when just considering EFC.
  • In conclusion, a theoretical case study demonstrated that applying preservation treatments, such as micro surfacing, provides a cost-effective procedure when compared to untreated scenarios. LCCA showed that selected preservation treatments reduced user costs by 54–57% due to lower excess fuel consumption, particularly in high-traffic corridors. Accounting for factors such as agency treatment options and alternative user costs would enhance decision-making and refine the selection of pavement preservation strategies.
  • Environmental benefits are a direct outcome of maintaining smoother pavements, with lower excess of GHG emissions during the user stage resulting from improved fuel efficiency. The disproportionate share of emissions from truck traffic emphasizes the potential for substantial CO2e reductions (over 60% relative reductions for the case study) in high-volume roads when preservation is applied proactively.
This study provides a systematic evaluation framework that integrates performance, cost, and environmental benefits of pavement preservation treatments. It provides a more holistic method for demonstrating the overall benefits of preservation strategies than performance measures alone. This approach aims to support data-driven and agency-specific decision-making for the implementation of pavement preservation treatments in the road life cycle. It should be noted that this study assumed fixed prices (with inflation adjustments) to ensure consistent baseline comparisons. While this approach is appropriate for illustrating the methodology, future applications are encouraged to incorporate parameter variability and site-specific sensitivity analyses to strengthen decision-making relevance.

Author Contributions

The authors confirm contribution to the paper as follows: study conception and design: A.V.-N. and A.B.-C.; data collection: A.B.-C. and J.G.-J., analysis and interpretation of results: A.B.-C., A.V.-N. and S.C.G.; draft manuscript preparation: A.B.-C. All authors have read and agreed to the published version of the manuscript.

Funding

The research presented in this study was funded through TPF-5(375) National Partnership to Determine the Life Extending Benefit Curves of Pavement Preservation Techniques (MnROAD/NCAT Joint Study—Phase II).

Data Availability Statement

The original contributions presented in this study are included in the article material. Further inquiries can be directed to the corresponding authors.

Conflicts of Interest

The authors declare that they have no conflict of interest.

References

  1. Adlinge, S.S.; Gupta, A.K. Pavement Deterioration and Its Causes. IOSR J. Mech. Civ. Eng. 2018, 2, 9–15. Available online: https://www.iosrjournals.org/iosr-jmce/papers/sicete(civil)-volume6/60.pdf (accessed on 25 July 2025).
  2. Bektas, F.; Smadi, O.; Nlenanya, I. Pavement Condition: New Approach for Iowa Department of Transportation. Transp. Res. Rec. 2015, 2523, 40–46. [Google Scholar] [CrossRef]
  3. Papagiannakis, A.; Gharaibeh, N.; Weissmann, J.; Wimsatt, A. Pavement Scores Synthesis; Report: FHWA/TX-09/0-6386-1; Texas Transportation Institute, The Texas A&M University System: College Station, TX, USA, 2009. [Google Scholar]
  4. Peskhin, D.; Ram, P.; Zimmerman, K.; Pai, S. Pavement Preservation Program Benchmarking; Report: FHWA-HIF-24-024; Applied Pavement Technology, Inc.: Champaign, IL, USA, 2024. [Google Scholar]
  5. Zhou, Q.; Okte, E.; Al-Qadi, I.L. Predicting Pavement Roughness Using Deep Learning Algorithms. Transp. Res. Rec. 2021, 2675, 1062–1072. [Google Scholar] [CrossRef]
  6. Haddadi, S.; Coleri, E.; Wruck, B. A Network-Level Decision Making Tool for Pavement Maintenance and User Safety. 2017. Available online: https://rosap.ntl.bts.gov/view/dot/63421 (accessed on 25 July 2025).
  7. Ghosh, L.; Abdelmohsen, A.; El-Rayes, K.; Ouyang, Y. Temporary Traffic Control Strategy Optimization for Urban Freeways. Transp. Res. Rec. 2018, 2672, 68–78. [Google Scholar] [CrossRef]
  8. Grant, M.; Anne, C.; Pederson, L. Assesment of Greenhouse Gas Analysis Techniques for Transportation Projects. Transp. Res. Record. 2008. Available online: https://trid.trb.org/View/848709 (accessed on 1 September 2025).
  9. Environmental Protection Agency (EPA). Greenhouse Gas and Energy Consumption Rates for Onroad Vehicles in MOVES4; EPA-420-R-23-026; Environmental Protection Agency: Washington, DC, USA, 2023. Available online: https://nepis.epa.gov/Exe/ZyPDF.cgi?Dockey=P10186RQ.pdf (accessed on 25 July 2025).
  10. Hajj, E.; Loria, L.; Sebaaly, P. Performance evaluation of asphalt pavement preservation activities. Transp. Res. Rec. 2010, 2150, 36–46. [Google Scholar] [CrossRef]
  11. Bryce, J.; Rada, G.; Hicks, G. Effect of preservation treatments on pavement performance. In Pavement and Asset Management; CRC Press: Boca Raton, FL, USA, 2019; pp. 619–626. [Google Scholar]
  12. Wang, H.; Al-Saadi, I.; Lu, P.; Jasim, A. Quantifying greenhouse gas emission of asphalt pavement preservation at construction and use stages using life-cycle assessment. Int. J. Sustain. Transp. 2020, 14, 25–34. [Google Scholar] [CrossRef]
  13. Jia, Y.; Dai, X.; Wang, S.; Gao, Y.; Wang, J.; Zhou, W. Evaluation of long-term effectiveness of preventive maintenance treatments using LTPP SPS-3 experiment data. Constr. Build. Mater. 2020, 247, 118585. [Google Scholar] [CrossRef]
  14. Poor, N.; Braham, A. Road Use Contributions to Energy Consumption and Greenhouse Gas Emissions for Two Flexible Pavement Maintenance Strategies. J. Test. Evaluation 2023, 51, 2210–2229. [Google Scholar] [CrossRef]
  15. Okwuenu, C.; Elbagalati, O.; Dylla, H.; El-Hakim, M.; Souliman, M.; Elwardany, M. Assessment of the role of pavement preservation in extending service life using the LTPP database. Can. J. Civ. Eng. 2025, 52, 946–957. [Google Scholar] [CrossRef]
  16. Wang, T.; Lee, I.S.; Harvey, J.; Kendall, A.; Lee, E.B.; Kim, C. UCPRC Life Cycle Assessment Methodology and Initial Case Studies for Energy Consumption and GHG Emissions for Pavement Preservation Treatments with Different Rolling Resistance; UC Davis; University of California Pavement Research Center: Davis, CA, USA, 2012. [Google Scholar]
  17. Vargas-Nordbeck, A.; Geib, J.; Worel, B.; Powell, B.; Ulring, J. Findings From the Pavement Preservation Group (PG) Study. 2024. Available online: https://eng.auburn.edu/research/centers/ncat/files/technical-reports/rep24-02.pdf (accessed on 24 July 2025).
  18. Sayers, M. Profiles of Roughness, Transportation Research Record 1260; Transportation Research Board, National Research Council: Washington, DC, USA, 1990. [Google Scholar]
  19. Federal Highway Administration (FHWA). National Performance Management Measures. In Assessing Pavement Condition for the National Highway Performance Program and Bridge Condition for the National Highway Performance Program; Federal Register: Washington, DC, USA, 2017; Volume 82, pp. 5886–5970. [Google Scholar]
  20. Qian, J.; Jin, C.; Zhang, J.; Ling, J.; Sun, C. International Roughness Index Prediction Model for Thin Hot Mix Overlay Treatment of Flexible Pavements. Transp. Res. Rec. J. Transp. Res. Board 2018, 2672, 7–13. [Google Scholar] [CrossRef]
  21. Vargas-Nordcbeck, A.; Brenes-Calderón, A. Effect of Mill and Thin Overlays on Roughness for Pavements in Cold Climate Locations. Transp. Res. Rec. 2022, 2676, 202–215. [Google Scholar] [CrossRef]
  22. Smeeton, N.; Spencer, N.H.; Sprent, P. Applied Nonparametric Statistical Methods; CRC Press: Boca Raton, FL, USA, 2025. [Google Scholar]
  23. Chen, C.; Deng, Y.; Li, M.; Shi, X. Investigation of key climatic factors affecting asphalt pavement roughness in different climate regions. Transp. Res. Part D Transp. Environ. 2023, 122, 103877. [Google Scholar] [CrossRef]
  24. Carvalho, R.; Ayres, M.; Shirazi, H.; Selezneva, O.; Darter, M. Impact of Design Features on Pavement Response and Performance in Rehabilitated Flexible and Rigid Pavements. 2011; Publication No. FHWA-HRT-10-066. Available online: https://rosap.ntl.bts.gov/view/dot/23591 (accessed on 25 July 2025).
  25. Horak, E. Benchmarking the structural condition of flexible pavements with deflection bowl parameters. J. S. Afr. Inst. Civ. Eng. 2008, 50, 2–9. [Google Scholar]
  26. Jalali, F. Quantifying Pavement Preservation Performance Using Probabilistic Deterioration Modeling. Ph.D. Thesis, Auburn University, Auburn, AL, USA, 2020. [Google Scholar]
  27. Fitzmaurice, G.; Laird, N.; Ware, J. Applied Longitudinal Analysis, 2nd ed.; Wiley: Hoboken, NJ, USA, 2011. [Google Scholar]
  28. Federal Highway Administration (FHWA). Status of the Nation’s Highways, Bridges, and Transit: Conditions and Performance, Report to Congress; Report FHWA-PL-08-017; Federal Highway Administration: Washington, DC, USA, 2001. [Google Scholar]
  29. Baladi, G.Y.; Prohaska, M.; Thomas, K.; Dawson, T.; Musunuru, G. Pavement Performance Measures and Forecasting and the Effects of Maintenance and Rehabilitation Strategy on Treatment Effectiveness (No. FHWA-HRT-17-095; HRDI-30/09-17 (400) E); Federal Highway Administration: Washington, DC, USA, 2017. [Google Scholar]
  30. Irfan, M.A. Framework for Developing Optimal Pavement Life-Cycle Activity Profiles. Ph.D. Thesis, Purdue University, West Lafayette, IN, USA, 2010. [Google Scholar]
  31. Brenes-Calderón, A.; Vargas-Nordcbeck, A. Use of chip seal treatments to mitigate pavement roughness progression in cold regions. Int. J. Pavement Eng. 2023, 24, 2241963. [Google Scholar] [CrossRef]
  32. Mohanraj, K.; Merritt, D. Use of Pavement–Vehicle Interaction-Related Models to Estimate Excess Fuel Consumption of Pavement Alternatives During the Design Stage. Transp. Res. Rec. 2023, 2677, 104–112. [Google Scholar] [CrossRef]
  33. Vistine, B.; Hicks, G.; Cheng, D.; Elkins, G. Factors Affecting the Performance of Pavement Preservation Treatments. In Proceedings of the 9th International Conference on Managing Pavement Assets (ICMPA9), Washington, DC, USA, 18–21 May 2015. [Google Scholar] [CrossRef][Green Version]
  34. Chatti, K.; Zaabar, I. Estimating the Effects of Pavement Condition on Vehicle Operating Costs; NCHRP Report 720; National Academies Press: Washington, DC, USA, 2012. [Google Scholar][Green Version]
  35. Rosta, S.; Gáspár, L. Skid Resistance of Asphalt Pavements. Eng 2023, 4, 1597–1615. [Google Scholar] [CrossRef]
  36. N-Sang, S.; Medina, J.; Kaloush, K. Integrating Flexible Pavement Surface Macrotexture to Pavement Management System to Optimize Pavement Preservation Treatment Recommendation Strategy. In Advances in Road Infrastructure and Mobility, Proceedings of the 18th International Road Federation World Meeting and Exhibition, Dubai, United Arab Emirates, 7–10 November 2021; Sustainable Civil Infrastructures; Springer Science and Business Media B.V.: Berlin/Heidelberg, Germany, 2022; pp. 735–752. [Google Scholar] [CrossRef]
  37. Bryce, J.; Santos, J.; Flintsch, G.; Katicha, S.; Mcghee, K.; Ferreira, A. Analysis of rolling resistance models to analyze vehicle fuel consumption as a function of pavement properties. In Asphalt Pavements, Proceedings of the International Conference on Asphalt Pavements, ISAP, Raleigh, NC, USA, 1–5 June 2014; CRC Press: Boca Raton, FL, USA, 2014; p. 1. [Google Scholar] [CrossRef]
  38. Mohanraj, K.; Merritt, D.; Sivaneswaran, N.; Dylla, H. Parametric and sensitivity analysis of PVI-related surface characteristics models for fuel consumption. In Advances in Materials and Pavement Performance Prediction II; Taylor & Francis Group: London, UK, 2020; ISBN 978-0-367-46169-0. [Google Scholar]
  39. Federal Highway Administration (FHWA). Federal Size Regulations for Commercial Motor Vehicles; Federal Highway Administration: Washington, DC, USA, 2004. [Google Scholar]
  40. RoadResource.org. Pavement Life Cycle Cost Analysis Calculator. Retrieved. 2025. Available online: https://roadresource.org/network/lc_calc (accessed on 10 August 2025).
  41. Pittenger, D.; Gransberg, D.; Zaman, M.; Riemer, C. Stochastic Life-Cycle Cost Analysis for Pavement Preservation Treatments. Transp. Res. Rec. 2012, 2292, 45–51. [Google Scholar] [CrossRef]
  42. Harvey, J.; Butt, A.; Lozano, M.; Kendall, A.; Saboori, A.; Lea, J.; Kim, C.; Basheer, I. Life Cycle Assessment for Transportation Infrastructure Policy Evaluation and Procurement for State and Local Governments. Sustainability 2019, 11, 6377. [Google Scholar] [CrossRef]
  43. Colvile, R.; Hutchinson, E.; Mindell, J.; Warren, R. The transport sector as a source of air pollution. Atmos. Environ. 2001, 35, 1537–1565. [Google Scholar] [CrossRef]
  44. Environmental Protection Agency (EPA). GHG Emission Factors Hub. 2024. Available online: https://www.epa.gov/climateleadership/ghg-emission-factors-hub (accessed on 25 July 2025).
  45. Environmental Protection Agency (EPA). New Fuel Economy and Environment Labels for a New Generation of Vehicles; EPA: Washington, DC, USA, 2011. [Google Scholar]
  46. Environmental Protection Agency (EPA). Fast Facts: U.S. Transportation Sector GHG Emissions 1990–2022; Environmental Protection Agency: Washington, DC, USA, 2024. [Google Scholar]
  47. Chehovits, J.; Galehouse, L. Energy Usage and Greenhouse Gas Emissions of Pavement Preservation Processes for Asphalt Concrete Pavements. In Proceedings of the First International Conference on Pavement Preservation, Newport Beach, CA, USA, 13–15 April 2010; Federal Highway Administration: Washington, DC, USA, 2010; pp. 27–42. Available online: https://www.pavementpreservation.org/icpp/paper/65_2010.pdf (accessed on 25 July 2025).
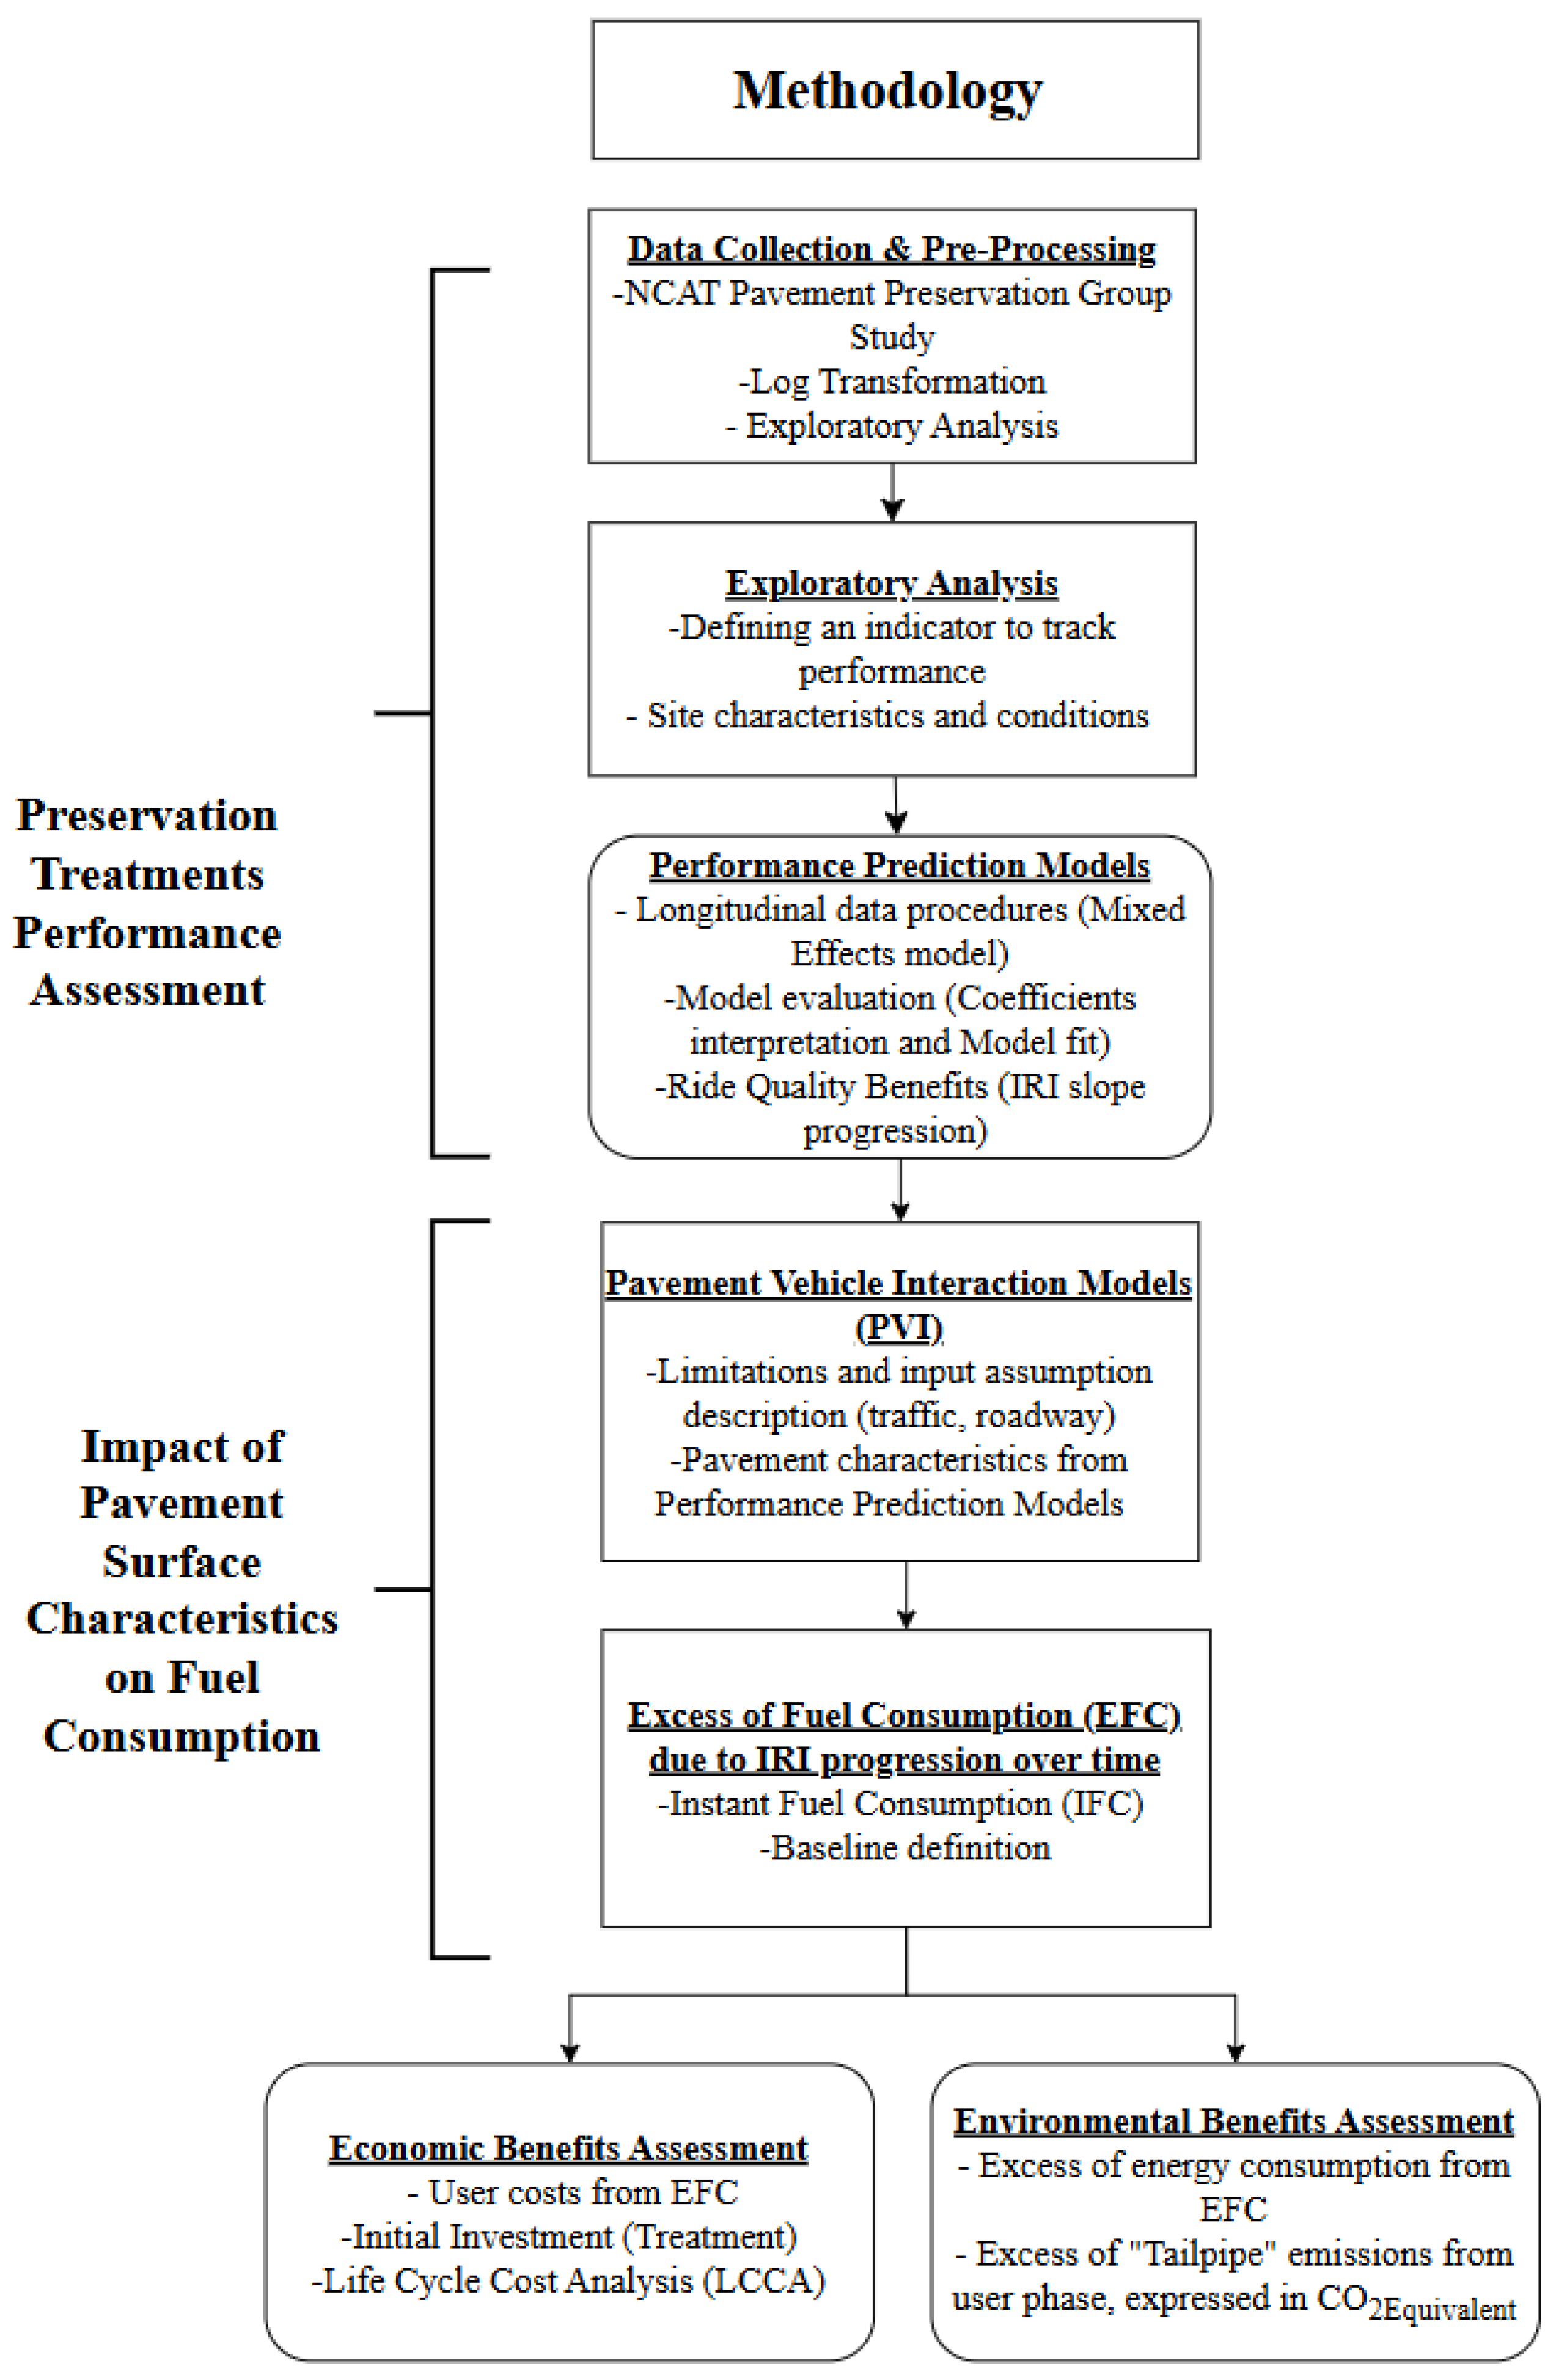
Figure 1. Methodology flowchart.
Constrmater 05 00066 g001
Figure 2. IRI progression in no-freeze regions (High traffic volume, US-280).
Constrmater 05 00066 g002
Figure 3. IRI progression in freeze regions (high traffic volume, US-169).
Constrmater 05 00066 g003
Figure 4. Pavement structures for freeze regions (CSAH-8 and US-169).
Constrmater 05 00066 g004
Figure 5. Pretreatment structural characterization for low-traffic-volume road (CSAH-8).
Constrmater 05 00066 g005
Figure 6. Pretreatment structural characterization for high-traffic-volume road (US-169).
Constrmater 05 00066 g006
Figure 7. Pretreatment surface characterization for high- and low-traffic-volume roads.
Constrmater 05 00066 g007
Figure 8. Two-step modeling procedure.
Constrmater 05 00066 g008
Figure 9. PJ and pretreatment IRI relation (micro surface and cape seals).
Constrmater 05 00066 g009
Figure 10. Cumulative excess fuel consumption after a 10-year period, high-volume road (baseline = 1 m/km).
Constrmater 05 00066 g010
Figure 11. Cumulative excess fuel consumption costs after a 10–year period, high-volume road (baseline = 1 m/km). * [40].
Constrmater 05 00066 g011
Figure 12. Cumulative excess fuel consumption after a 10–year period, low-volume road (baseline = 1 m/km).
Constrmater 05 00066 g012
Figure 13. Cumulative excess GHG emissions after a 10–year period from pavement-vehicle interactions for high-traffic-volume road (US-169).
Constrmater 05 00066 g013
Figure 14. Cumulative excess energy consumption after a 10–year period from pavement-vehicle interactions for high-traffic-volume road (US-169).
Constrmater 05 00066 g014
Figure 15. Cumulative excess GHG emissions after a 10–year period from pavement-vehicle interactions for low-traffic-volume road (CSAH-8).
Constrmater 05 00066 g015
Figure 16. Cumulative excess energy consumption after a 10–year period from pavement-vehicle interactions for low-traffic-volume road (CSAH-8).
Constrmater 05 00066 g016
Table 1. Treatment description for each testing site.
Section
Category
Treatment DescriptionWet FreezeWet No-Freeze
Low Traffic
(CSAH-8)
AADT = 510
High Traffic (US-169)
AADT = 16,000
High Traffic (US-280)
AADT = 17,000
2 cm mill + Thinlay
(THINLAY)
Mill and asphalt binder replacement (ABR) thinlay
Mill and ABR thinlay with delta S modifier
Mill and conventional thinlay
Chip Seal
(CHIP)
Single-layer chip seal
Single-layer chip seal over crack seal
Double-layer chip seal
Triple-layer chip seal
Scrub seal
Single-layer chip seal over fiber membrane
Micro
Surfacing
(MICRO)
Single-layer micro over crack seal
Single-layer micro over
Double-layer micro
Cape Seal
(CAPE)
Cape Seal (Single-layer micro over chip seal)
Fibermat cape seal (Single-layer micro over chip seal over fiber membrane)
Scrub cape seal (Single-layer micro over scrub seal)
Note: Detailed information about these treatments and site description can be found in external sources [12]. ABR: asphalt binder replacement. AADT (veh/day): annual average daily traffic.
Table 2. Mann–Kendall test results.
Test ParameterUS-280 (No-Freeze)US-169 (Freeze)
p-value (95% confidence level)0.46330.0000
Z-statistic0.73347.5947
Kendall Tau Coefficient0.00490.7121
Table 3. Structural and surface condition thresholds.
ComponentParametersCondition Thresholds
SoundWarningSevere
Structural Component
[25]
SCI (μm)<200200–400>400
BDI (μm)<100100–200>200
BCI (μm)<5050–100>100
Surface Component
[19]
ParametersGoodFairPoor
IRI (m/km)<1.51.5–2.7>2.7
Cracking (% area)<5.05.0–20.0>20
Rut Depth (mm)<5.05.0–10.0>10.0
Note: Area Under the Pavement Profile (AUPP), Surface Curvature Index (SCI), and Base Damage Index (BDI).
Table 4. Linear mixed effects model estimated coefficients.
Fixed EffectsLow Traffic VolumeHigh Traffic Volume
β 0 (SE)4.688 (0.082) ***4.257 (0.089) ***
β 1 (SE)7.836 × 10⁻² (0.008) ***3.895 × 10⁻² (0.004) ***
β 2 (SE)−2.820 × 10⁻¹ (0.019) ***−1.691 × 10⁻¹ (0.020) ***
Random Effects (RE)Standard Deviation of REStandard Deviation of RE
μ 0 0.3140.303
μ i 0.0310.013
Model Performance
Conditional R20.930.94
Marginal R20.150.10
Note: SE: Standard Error, *** Statistically significant at a 95% confidence level (p-value < 0.05).
Table 5. Linear mixed effects model estimated random effects.
Traffic LevelTreatment Group
(IRI Pretreatment Condition)
Random Effects Estimate Parameters
μ 0 j μ j
Low Traffic Volume
(CSAH–8)
CAPE (Fair)0.072−0.0720
CAPE (Good)0.131−0.014
CHIP (Fair)0.125−0.018
MICRO (Fair)0.119−0.017
MICRO (Mediocre)0.227−0.018
THINLAY (Good)−0.8300.023
THINLAY (Mediocre)−0.4660.067
CONTROL (Good)0.0190.010
CONTROL (Fair)0.2410.010
High Traffic Volume
(US–169)
CAPE (Good)0.117−0.009
CHIP (Good)0.239−0.004
MICRO (Good)−0.0620.009
THINLAY (Good)−0.566−0.004
CONTROL (Good)0.0780.017
Table 6. Estimated slopes from linear mixed effects model.
Traffic LevelTreatment Group
(IRI Pretreatment Condition)
Treatments’ Slopes
Slope ( β )
Low Traffic Volume
(CSAH–8)
CAPE (Fair)0.0646
CAPE (Good)0.0064
CHIP (Fair)0.0603
MICRO (Fair)0.0609
MICRO (Mediocre)0.0604
THINLAY (Good)0.1010
THINLAY (Mediocre)0.1451
CONTROL (Good)0.0797
CONTROL (Fair)0.0882
High Traffic Volume
(US–169)
CAPE (Good)0.0297
CHIP (Good)0.0345
MICRO (Good)0.0480
THINLAY (Good)0.0347
CONTROL (Good)0.0556
Table 7. Performance jump determination.
Treatments (Milling Description)PJ (m/km) EquationR2
Thinlay (full width pass) *PJ = k(61.207ln(IRI0/k) − 221.84)0.96
Thinlay (8 ft width pass) *PJ = k(72.307ln(IRI0/k) − 297.96)0.89
Micro surfacing and cape sealsPJ = 0.4145ln(IRI0) + 0.11620.63
Note: IRI0/km: Pretreatment IRI (m/km), k = 0.0157828, calibration factor for converting the IRI from in/mi to m/km (model calibrated in imperial units) Reference: * [21].
Table 8. EUAC for pavement scenarios at different discount rates.
Pavement ScenarioEUAC (USD/lane-km)
Discount Rate
3%4%5%
Alternative 1: (Untreated Pavement Structure)USD 20,975USD 19,718USD 18,589
Alternative 2: (Micro surfacing at beginning of analysis period and at year 5)USD 9441USD 8670USD 7970
Table 9. Total energy use and GHG emissions for pavement preservation treatments.
TreatmentDescriptionGHG Emissions
(CO2e ton/lane-km)
Energy Use
(GJ/lane-km)
Thinlay (mill + fill)Data calculated based on an 86 kg/m2 in-place density10.9146.0
Micro surfacingType II gradation, 14% emulsion, rate: 13 kg/m20.817.9
Chip SealEmulsion (2.0 L/m2) and aggregate (8.7 kg/m2)1.832.5
Cape SealChip seal + micro surfacing2.955.9
Note: Data adjusted from [47].
Table 10. Excess of GHG emissions and energy due to PVI.
UnitActivityAlternative 1Alternative 2
GHG Emissions
(CO2e ton/lane-km)
Excess GHG (Trucks)954.4363.1
Excess GHG (Cars)492.2187.4
Road PreservationNA1.6
Energy (GJ/lane-km)Excess Energy (Trucks)696.1421.9
Excess Energy (Cars)370.3224.6
Road PreservationNA35.8
Disclaimer/Publisher’s Note: The statements, opinions and data contained in all publications are solely those of the individual author(s) and contributor(s) and not of MDPI and/or the editor(s). MDPI and/or the editor(s) disclaim responsibility for any injury to people or property resulting from any ideas, methods, instructions or products referred to in the content.