Abstract
Coal is still China’s primary energy source, and the production process of coal produces industrial byproduct coal gangue. This study explores the possibility of using industrial byproducts of thermal power generation, fly ash (FA) and calcined coal gangue (CCG), as a partial (10% and 20%) substitute for cement in construction materials. Methodical research was conducted to determine how these two substances affect the microstructure and macroscopic characteristics of cement-based materials. Macroscopic performance test findings indicate that replacing 20% of cement with CCG had no discernible effect on the specimens’ performance. At the same time, adding FA required 28 days to be comparable to the control group. Mercury intrusion porosimetry (MIP) test results show that using CCG can refine microscopic pores. Additional hydration products could be produced by these materials, according to analyses using Fourier transform infrared spectroscopy (FTIR) and X-ray diffraction (XRD). The production of hydration products by CCG to fill the microscopic pores was further demonstrated by scanning electron microscopy (SEM) pictures. After 28 days of hydration, a layer of hydration products developed on the surface of FA. When supplementary cementitious materials (SCMs) were added, calcium hydroxide (CH) was consumed by interacting with FA and CCG to form additional hydration products, according to thermogravimetric analysis (TG) data after 28 days. Furthermore, an evaluation of FA and CCG’s effects on the environment revealed that their use performed well in terms of sustainable development.
1. Introduction
Since the late 19th century, global warming has persisted, and temperatures are now rising by 0.17 °C every decade, exceeding the threshold of 0.1 °C each decade [1]. Because of human activity, the atmosphere now contains significantly more greenhouse gases [1,2]. A total of 7% of the world’s artificial carbon dioxide emissions come from the cement sector [3]. Researchers employ supplemental cementitious materials (SCMs) with volcanic ash qualities in mortar and concrete to lower the cement concentration, which lowers energy consumption and carbon dioxide emissions from the cement industry [4,5].
The key benefits of incorporating fly ash (FA), an industrial by-product, into cement and concrete lie in its fine particle size, phase composition, chemical properties, and pozzolanic activity [6]. FA has the ability to react with calcium hydroxide (CH) that is formed during the hydration of cement, thereby promoting the formation of more C-S-H and additional hydrated compounds through its pozzolanic reaction [7,8]. The supplementary C-S-H generated from this reaction helps to fill the voids within the concrete mixture, enhancing the material’s density and longevity by contributing to the refinement of pores and the strengthening of the cementitious matrix [9]. Research shows that concrete that meets the engineering requirements can be produced when the FA content is controlled at 45% [10].
China accounts for about 50 percent of the global coal production [11]. Coal gangue (CG), constituting between 10% and 20% of the total coal output, represents one of the primary solid waste byproducts in coal mining operations [12,13]. China generated over 6 billion tons of CG between 2010 and 2020 [14]. Moreover, it occupies a considerable amount of land, and the heavy metal components in CG pose a risk of leaching into groundwater, thereby endangering both human health and the ecosystem [15]. In China, the overall amount of CG continues to rise annually. China’s CG usage rate (about 60%) is far lower than Western nations’ (over 90%) [16]. The utilization rate of CG still needs improvement, as seen by the fact that its annual output is significantly greater than its utilization [17]. Although calcined coal gangue (CCG), which is produced by fine grinding and heat treatment, is active, CG itself reacts complexly with cement ingredients. Kaolin increases the reaction activity by removing hydroxyl groups to create metakaolin during the calcination heat treatment procedure [16,18]. This process is conducive to applying CG in cementitious materials and provides a new way to utilize CG resources, reduce environmental pollution, and improve resource utilization.
The majority of earlier research has been on using CG to replace aggregates in concrete. Zhu et al. [19] studied concrete with CG calcined at 750 °C replacing coarse aggregate. According to their research, calcination is a useful technique for boosting CG aggregate strength, and employing calcined CG as an aggregate can enhance concrete’s mechanical qualities. Gao et al. [20] examined how CG aggregate affects the structural characteristics of coal gangue concrete-filled steel tubular (CGCFST) and reinforced coal gangue concrete (RCGC) stubs. Their findings demonstrated that the gangue replacement ratio had virtually little effect on the shear failure mode of RCGC and CGCFST stubs. Wang et al. [21] discussed the variations in the drying shrinkage behavior and elastic modulus of spontaneous-combustion coal gangue aggregate and rock coal gangue aggregate when used as coarse aggregate and proposed a theoretical model to predict their elastic modulus and drying shrinkage rate.
Researchers have found that CG or CCG may be able to take the place of cement. Wu et al. [22] used CG and CCG powders to replace cement in producing ultra-high performance concrete (UHPC). According to their findings, the UHPC sample still achieved the minimum cubic strength of UHPC (150 MPa) after 28 days even after 60% CG powder was added. Yang et al. [23] mainly discussed the pore structure evolution of CCG and FA cement composites. Their results showed a correlation between pore structure and compressive strength. Kong et al. [24] studied the impact of adding gypsum and CH on the pore structure and mechanical characteristics of cementitious systems that contain a lot of CCG. Their findings indicated that the incorporation of CH markedly enhanced the compressive strength of the CCG-based cementitious system. Concurrently, the addition of gypsum effectively ameliorated the pore structure within the CCG cementitious system.
This paper’s innovativeness can be summed up as follows. First off, prior research has mostly concentrated on using CG as an aggregate substitute; however, more has to be done to study CG as a cement substitute following activation treatment. Secondly, given that the majority of current research focuses on macroscopic physical aspects, further investigation is necessary to explore the microscopic properties of CCG and its influence on the durability of cementitious materials. This study also examined the impact of combining FA and CCG and examined any potential interactions or effects of this cementitious mixture. Lastly, the contribution of quantitative analysis of carbon emissions utilizing FA and CCG to sustainable development was covered in this work.
This research examines the influences of FA and CCG proportions. The experiments conducted on both mortar and paste samples assessed various properties including compressive strength, ultrasonic pulse velocity (UPV), electrical resistivity (ER), mercury intrusion porosimetry (MIP), X-ray diffraction (XRD), Fourier transform infrared spectroscopy (FTIR), thermogravimetric analysis (TG), and scanning electron microscopy (SEM) [25]. In light of these findings, the samples’ macroscopic properties and microstructure are investigated, along with the correlation between the experimental outcomes.
2. Materials and Methods
2.1. Materials
Ordinary Portland cement (OPC), FA, and CG were utilized as basic ingredients in this investigation to create paste samples and mortar specimens. Jiangsu Helin Cement Co., Ltd., Zhengjiang, China, was the supplier of OPC. The cement’s specific surface area was 3868 cm2/g. The ASTM C618 standard [26] classifies the fly ash utilized in this work as F fly ash, with a specific surface area of 4264 cm2/g. The Yang cheng Yong qing Coal Gangue Processing Plant in Yang cheng, China, provided the CG. Laboratory tap water and Xiamen Aceo’s experimental standard sand were utilized. The cumulative residue on a square mesh sieve with a pore size of 2.00 mm is 0%; on a sieve with a pore size of 1.60 mm, it is 7 ± 5%; on a sieve with a pore size of 1.00 mm, it is 33 ± 5%; on a sieve with a pore size of 0.50 mm, it is 67 ± 5%; on a sieve with a pore size of 0.16 mm, it is 87 ± 5%; and on a sieve with a pore size of 0.08 mm, it is 99 ± 1%.
First, some CG samples were taken for thermogravimetric testing to establish the proper calcination temperature. The experimental results are shown in Figure 1. It can be observed from the figure that the sample completed most of its weight loss at 750 °C, therefore, 750 °C was selected as the calcination temperature, a value previously demonstrated to be suitable in the literature [27]. CG was heated at 10 °C/min during calcination in a muffle furnace and kept at 750 °C for two hours. After that, calcined coal gangue (CCG) was obtained by letting it naturally cool to ambient temperature.
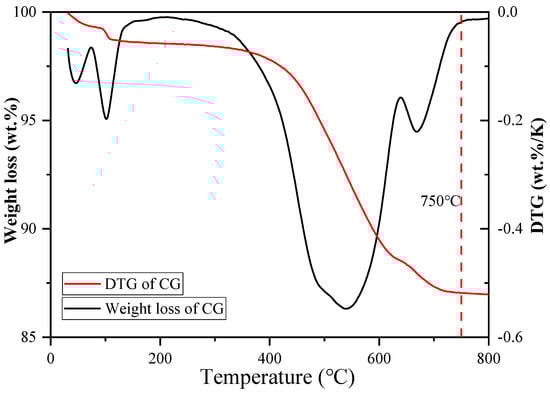
Figure 1.
Thermal analysis data from TG (left) and DTG (right) show weight loss (%) [27].
The oxide concentrations of OPC, CG, and FA, as determined by X-ray fluorescence analysis, are presented in Table 1. Figure 2 illustrates the particle size distribution curves for OPC, CCG, and FA. The densities of FA, CG, and OPC are 2.42, 2.56, and 3.14 g/cm3, respectively, which are in accordance with the ASTM C188 standards [28].

Table 1.
Weight percentage of the materials’ chemical composition (wt. %).
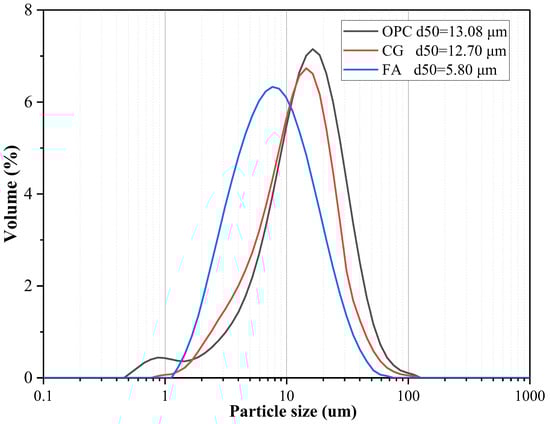
Figure 2.
OPC, CG, and FA particle size distributions.
Figure 3 displays the OPC, CCG, CG, and FA XRD test results. The figure shows that kaolin and quartz are the primary mineral components of CG. The distinctive peak (K) of kaolin diminishes or even vanishes after calcination. This suggests that the kaolin in CG is changed into metakaolin upon calcination, resulting in a greater activity [22,29].
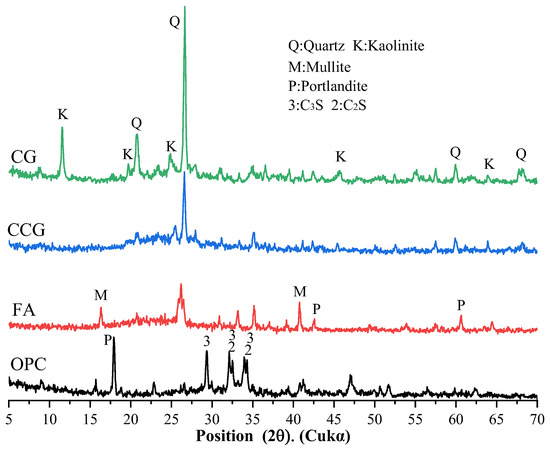
Figure 3.
The X-ray diffraction patterns for CG, CCG, FA, and OPC.
2.2. Ratio of Mixing and Sample Preparation
FA and CCG replaced part of the cement with a single addition, double addition, and no addition. In order to maximize the efficiency of cementitious products, the substitution level of cement with recyclable SCMs should not exceed 40 percent [30]. The mixing ratio for each group of slurries is displayed in Table 2. Mortar specimens measuring 40 mm × 40 mm × 160 mm and tidy paste samples measuring 40 mm × 40 mm × 40 mm were made in accordance with the proportions. After production, it is first cured under standard conditions for 24 h. Once the molding is complete, the forms are taken off and the specimens are then placed in a standard curing chamber for additional curing.
Table 2.
Mixes of samples.
2.3. Experimental Methodology
2.3.1. Compressive Strength Test Method
A fully automated pressure testing machine (model DY-208JC, manufactured by Wuxi Orient Instrument Making Technology Co., Ltd., located in Wuxi, China) was utilized for the assessment. With specimens measuring 40 mm × 40 mm × 160 mm, the flexural strength of the mortar samples was determined, while the rate of load application for compressive strength testing was set at 2400 N/s. Following failure, the broken samples underwent compressive strength evaluations. Within a conventional curing chamber, the specimens were cured for durations of one, three, seven, and twenty-eight days, respectively. For the detailed procedure, please refer to ASTM C349 [31].
2.3.2. Electrical Resistivity
An electrical resistivity test was performed using a non-destructive tester. For each mortar mix ratio, three specimens measuring 40 mm × 40 mm × 160 mm were prepared, and their resistivity was assessed at 1, 3, 7, and 28 days after casting. Prior to testing, the surface moisture of the specimens was wiped off with a cloth.
2.3.3. Ultrasonic Pulse Velocity (UPV)
UPV tests were conducted using a ZT805 non-metallic ultrasonic tester (manufactured by Nanjing Zhongtuo Technology Co., Ltd., Nanjing, China) equipped with 54 kHz transducers operating at a pulse-repetition frequency of 1 kHz and in the “direct transmission” mode. Mortar prisms measuring 40 mm × 40 mm × 160 mm, cured under standard conditions for 1, 3, 7 and 28 days, were tested. A uniform layer of petroleum-jelly couplant was applied between the transducers and the specimen faces, and a constant contact pressure of 0.05 MPa was maintained to eliminate interfacial voids. Prior to testing, the instrument was calibrated with a standard aluminum reference bar (v = 6420 m/s), yielding a systematic error of <1%. The detailed procedure followed ASTM C597 [32].
For the macroscopic tests (compressive strength, UPV, and ER), quantitative data were provided by three independent samples per group. The results are reported as means with error bars indicating the standard deviations, confirming the high reproducibility of the experiments.
2.3.4. Pore Structure
The analysis of the pore structure was performed utilizing a Poremaster-60 mercury porosimeter. After a curing period of 28 days, samples were extracted from the interior paste, soaked in isopropanol for a minimum of seven days to halt hydration, and subsequently dried using a vacuum desiccator. The pore structure within the sample is characterized indirectly by measuring the volume of liquid mercury that is forced into the paste block under pressure. The accumulation curve and distribution curve of pores can be obtained by analyzing pores of different diameters. The pore measurement range is 3–10,000 μm.
2.3.5. Microscale Tests
XRD, FTIR, and TGA analyses were conducted on the paste specimens on the initial and 28 days post-curing. To prevent further hydration, portions were extracted from within the paste samples, immersed in isopropyl alcohol for a minimum of seven days, and subsequently dried for twenty-four hours in a vacuum desiccator. Once ground into a fine powder, the samples were sifted through a 45 μm mesh screen.
The crystalline phase composition of the hydrated paste samples was determined using an X-ray diffractometer (model XRD6100, manufactured by Shimadzu Corporation, Kyoto, Japan). The measurement was conducted over a 2θ range of 5.0 to 70.0°, with a scan speed of 5.0°/min, an applied voltage of 40,000 V, and a Cu Kα radiation current set at 40 mA.
The samples’ alterations in chemical bonding were examined using a Fourier transform infrared spectrometer (Nicolet iS50 Thermo Fisher Scientific, Waltham, MA, USA). The ZnSe diamond crystal was subjected to a background scan before to each measurement. At a resolution of 0.4 cm−1, each sample was scanned 16 times in the 400–4000 cm−1 range.
A thermogravimetric analyzer from NETZSCH, located in Selb, Germany, was employed to ramp the temperature from ambient to 800 °C at a heating rate of 15 °C per minute within a nitrogen (N2) atmosphere. Through thermogravimetric analysis (TGA) and its derivative, derivative thermogravimetric (DTG), the content of CH and the hydration products for each chemical constituent were ascertained.
2.3.6. Scanning Electron Microscopy
The microstructure of the paste samples was scrutinized with a field emission scanning electron microscope (TESCAN, Brno, Czech Republic). To cease hydration, portions of the 28 day cured paste samples were soaked in isopropanol for a period of seven days. Following the cessation of hydration, the specimens were placed in an oven and dried for 24 h at a temperature of 80 °C. To enhance the electrical conductivity of the samples, a platinum coating was applied to their surface.
3. Results
3.1. Compressive Strength
The mortar specimens’ compressive strength test results at 1, 3, 7, and 28 days are displayed in Figure 4. With the increase in curing duration, the test outcomes demonstrate a consistent enhancement in compressive strength. This improvement is due to the gradual densification of the cement’s interior, the ongoing hydration process, and the accumulation of more hydration products.
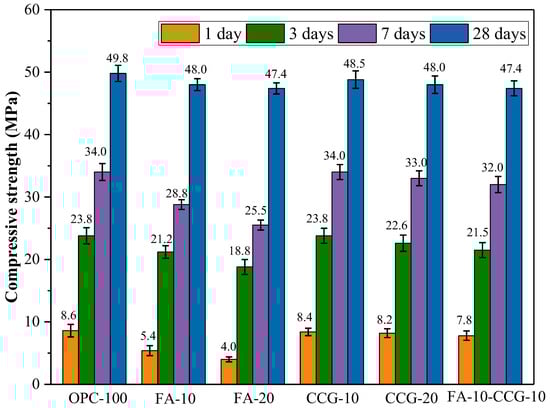
Figure 4.
Compressive strength results.
According to the comparative analysis of the data across all groups, there was no significant reduction in the compressive strength of the mortar samples with the increased substitution of CCG at any of the observed time intervals. The primary cause of this behavior is the strong reactivity of metakaolinite (AS2), the amorphous phase of CCG [33]. Early in the cement’s hydration process, AS2 and CH might react. The reaction equations are shown in Equations (1) and (2) [33]:
In the amorphous phase of metakaolinite, water is present along with portlandite. The process also generates additional hydration products such as C-S-H and C-S-A-H, which contribute to the strengthening of the material.
It can be inferred by looking at and analyzing Figure 4 that using FA in place of cement has the effect of decreasing the initial strength and regaining it after 28 days. The literature [34] pointed out that FA had almost no reaction in the first 7 days of hydration. After 28 days, the FA-10 and FA-20 groups’ compressive strengths were on par with the control group’s. This is mostly because the effects of the volcanic ash reaction of FA build up and eventually manifest when the reaction continues for 28 days. Because the gel created by the volcanic ash reaction may fill the concrete’s tiny pores, FA can successfully encourage the late-stage development of strength [34,35].
3.2. UPV
The UPV test findings for every mortar specimen group are displayed in Figure 5a. At 1, 3, 7, and 28 days, the OPC-100 (control group) had UPV test scores of 3.05, 3.64, 3.92, and 4.17 km/s, respectively. The sharp rise in UPV observed at the one-day mark is attributed to the swift hydration reaction of C3S and C2S in the cement, leading to the formation of CH and C-S-H. With the increase in curing age, cement hydration continues. However, the rate of cement hydration and the subsequent rise in UPV test results significantly decelerated after the initial three days of curing [36].
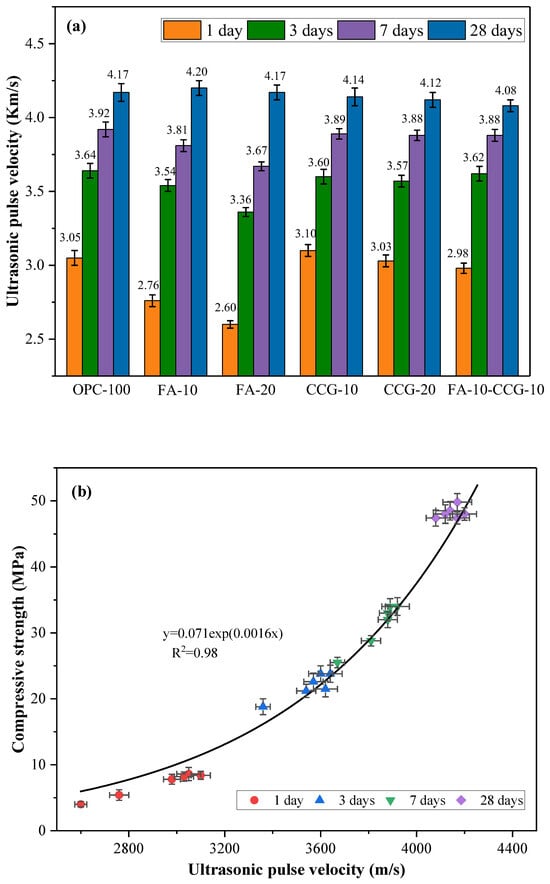
Figure 5.
(a) Results of the UPV testing; (b) correlation between compressive strength and UPV.
A comparison of the UPV data for each group shows that there is no discernible drop in the UPV results for the CCG-doped categories in comparison to the control group. The reason for this is because CCG’s strong reactivity promotes cement pore-filling in the initial phases of hydration [37,38,39]. Furthermore, the study referenced [29] observed that the process of calcination would significantly reduce the crystalline structure of CG. In general, a higher crystallinity may result in a more regular molecular chain arrangement, which could complicate the reaction. But, after calcination, CG’s crystallinity decreases, allowing for increased reaction activity.
The test results indicate that the early UPV values of the FA-10 and FA-20 mortar specimens are lower than those of the OPC-100 mortar specimens. For instance, at one day, the UPV value of the FA-20 group was 14.75 percent lower than that of the control group. However, after 28 days, the UPV values of the FA-mixed group became similar to those of the control group. This is due to FA’s lack of an early response effect [34]. As the curing age rises, the reaction products progressively accumulate and the secondary hydration effect becomes noticeable. At 28 days, the UPV value rises as the cementitious matrix thickens and the mortar’s internal structure gets denser.
The compressive strength is significantly influenced by factors such as the amount of hydration products, pore size, and other elements that also impact the UPV value [40]. In practical engineering applications, UPV can serve as a tool to evaluate and predict the compressive strength of concrete. Previous studies have identified an exponential relationship between compressive strength and UPV [40,41]. In this study, Figure 5b illustrates the correlation analysis between the compressive strength and UPV of the mixed mortar, with an R2 value of 0.98.
3.3. ER
When assessing the durability of cement-based mixes, ER is crucial. The pace at which steel bars corrode is negatively correlated with the ER value of mortar. Figure 6 illustrates the ER of mortar mixes at various percentages. As mortar specimens age, their ER values rise at 1, 3, 7, and 28 days. This is because the mortar’s pores fill up and its inside gets denser as the hydration reaction continues. Moreover, monocarboaluminate (M) can be created via the reaction of aluminate and calcium carbonate. It can increase the density of the mortar by filling its interior pores [42].
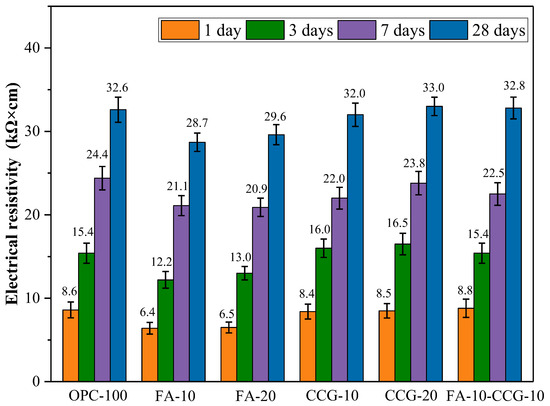
Figure 6.
Mixed pastes’ ER at 1, 3, 7, and 28 days.
The ER values of the mortar containing CCG were comparable to those of the control mortar at all the tested time points. This suggests that substituting cement with CCG does not lead to a noticeable reduction in the ER value. This is mostly due to the fact that as the amount of CCG substituted grows, the reaction of CCG can generate more C-S-H and C-S-A-H, which increases the porosity of the mortar and raises the ER value. However, at one, three, and seven days, the ER values of the FA-10 and FA-20 groups were significantly lower than those of the control group. This is primarily due to the fact that FA’s secondary hydration impact only becomes noticeable in the latter stages. After the 28-day reaction period, the volcanic ash impact on FA was visible, and the reaction’s hydration products filled the pores, resulting in a sharp rise in the ER value.
The relationship between chloride ion corrosion resistance and the ER value of concrete has been extensively studied [43]. The findings show that the ER test can be used to assess how resistant a material is to chloride penetration and that there is a relationship between the material’s ER value and its ability to resist chloride-induced dissolution. According to certain articles, there is less chance of corrosion when the tested ER value is more than 20,000 Ω∙cm [44]. It is clear from the test findings in Figure 6 that there is very little chance of corrosion in any of the test groups following seven days of curing.
3.4. MIP
The MIP test outcomes for the control and CCG experimental groups are presented in Table 3. The findings reveal that the average and median pore sizes decrease with an increase in CCG content at substitution levels of 10% and 20%. The reduction in total porosity also indicates that the incorporation of CCG enhances the pore structure of the neat paste sample. For example, the control OPC-100 exhibited a total porosity of 24.15%, which was reduced by approximately 10.23% to 21.68% upon replacing 20% of the cement with CCG. The positive effect of CCG on pore size optimization obtained from the MIP test results is consistent with the conclusions of the literature [22,24,45].
Table 3.
Calcium hydroxide content and bound water content.
The correlation between mercury pressure and cumulative mercury volume intruded per unit mass is depicted in Figure 7a. Figure 7b shows the cumulative mercury volume intrusion at different pore sizes per unit mass. Mercury fills pores of various sizes as the pore pressure rises, increasing the volume of mercury squeezed into a unit mass. It is evident from these two data that the volume of mercury squeezed lowers as the CCG content rises, suggesting that the addition of CCG improves pore filling and refining.
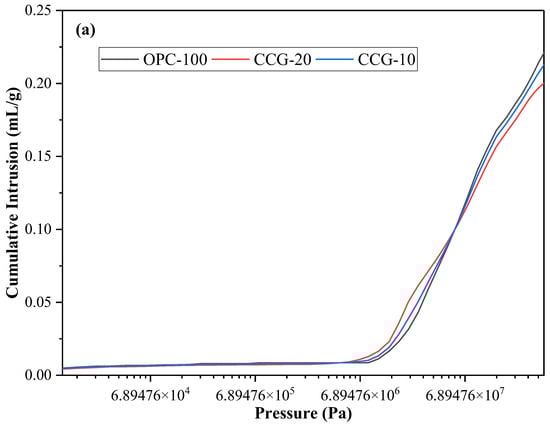
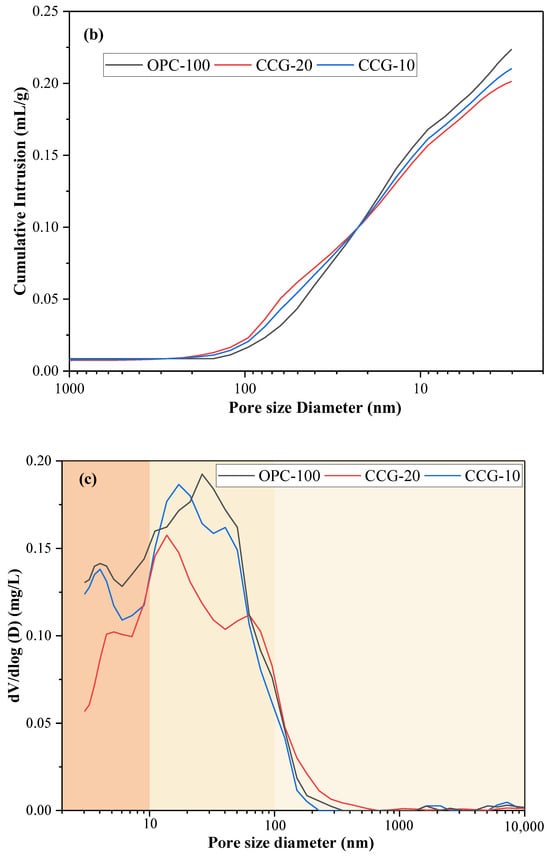
Figure 7.
(a) The amount of mercury infiltrated per unit mass as a function of the applied mercury pressure; (b) the total mercury volume intrusion at various pore sizes per unit mass; (c) the distribution of pore sizes at 28 days, differentiated by size.
Figure 7c shows the different characteristics of the corresponding pore sizes. The critical pore size is indicated by the peak value on the differential pore volume curve. By observing Figure 7c, it is not difficult to find that the critical pore size gradually refines with the addition of CCG, and the volcanic ash reaction of CCG plays an important role in pore size refinement. In addition, it is discovered that in contrast to the control group, when CCG was used to replace cement partially, the capillary pores of the medium with a diameter of 10~60 nm became finer as the replacement amount increased. This shows that the microstructure of the 28 days sample becomes denser after incorporating CCG. This is mainly because CCG fills the small pores by generating additional hydration products through a reaction with CH. This phenomenon can also be observed from SEM images.
3.5. XRD
Each sample’s XRD test results for a single day are displayed in Figure 8a. The figure shows that the main hydration products remained largely unchanged with the incorporation of the two cementitious materials. Additionally, a calcium carbonate peak was discovered in the cement system due to the limestone that was used in the cement. As the initial hydration process is not yet complete and there is still unreacted C3S and C2S present, Figure 8a shows that the peak values of C3S and C2S are greater.
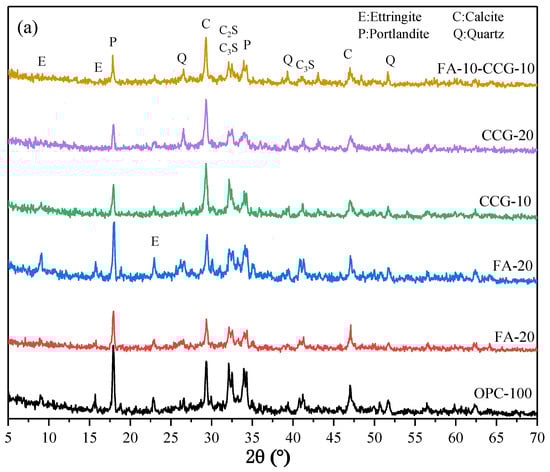
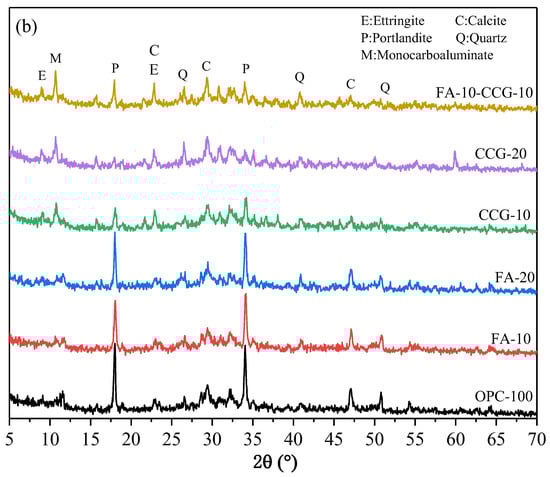
Figure 8.
XRD patterns of the mixed pastes at (a) 1 day and (b) 28 days.
Figure 8b presents the outcomes from the XRD test conducted over a 28 day period. A comparison of Figure 8a,b reveals a significant decrease in the peak values of C3S and C2S from day 1 to day 28. This is because the solid’s C3S and C2S react to produce additional hydration products after 28 days of hydration.
The M peak at 11.7° for the CCG-doped component becomes increasingly prominent from day 1 to day 28 when compared to other groups, as observed in Figure 8a,b. Conversely, the calcium carbonate peak shows a more pronounced decline. This occurs as a result of the mixture’s calcium carbonate and aluminate reacting to produce M. Equation (3) displays the reaction equation for the production of M [36].
where is the cement’s aluminum phase, is calcium carbonate, is portlandite, and is water.
This is due to the fact that CCG has more Al components. which can act as an aluminum supply for the reaction and promote the creation of M, according to an examination of the equations and the laws of chemical reactions. Furthermore, the intensity of the CH peak at 18° notably diminished in the CCG-treated group, as illustrated in Figure 8b. This suggests that CH produced during cement hydration readily interacts with CCG, a chemically active raw material.
3.6. FTIR
Figure 9a,b illustrate the FTIR spectra for each cement paste sample at one day and twenty-eight days old, respectively. The absorption peaks in the high wavenumber region around 3470 cm−1 and 1600 cm−1 are due to the stretching and vibration of H-O-H and O-H bonds present in chemically bound water and hydration products [46]. The C-O bond (CO32−) in carbonates causes antisymmetric stretching and C-O angular deformation, which are detected at approximately 1420 cm−1 and 873 cm−1, respectively [36,47]. The asymmetric stretching of SO42− is the cause of the shift in the peak at about 1127 cm−1 [48]. The absorption peak at around 1000 cm−1 corresponds to the stretching vibration of Si-O (C-S-H) [49]. The bending vibration of the Al-OH bond is indicated by the absorption peak at approximately 770 cm−1 [50]. Lastly, the absorption peak at about 620 cm−1 represents the asymmetric stretching vibration of the quartz Si-O bond [49].
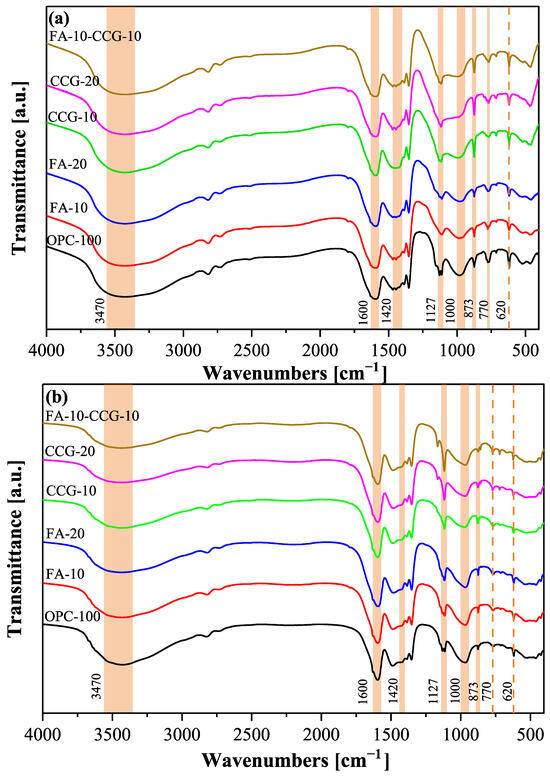
Figure 9.
FTIR spectra: (a) 1 day and (b) 28 days.
When the hydration reaction continues for 28 days, the absorption peaks in the high wavenumber region at about 3470 cm−1 and 1650 cm−1 become weaker, according to a comparison of the FTIR spectra of 1 day and 28 days. This is because FA and CCG can undergo secondary hydration reactions to consume CH. This phenomenon is more significant in the group incorporating CCG, which is caused by the reaction between CH in the hydration product and metakaolin in CCG. The peak intensity of Si-O in the test group increased concurrently with the absorption peak of C-S-H near 1000 cm−1, suggesting that the progression of secondary hydration leads to the generation of additional hydration products, including C-S-H and C-S-A-H.
There is a significant decrease in the intensity of the C-O bond absorption peaks around 1420 cm−1 and 873 cm−1 as the curing period extends from 1 day to 28 days. This reduction is attributed to the reaction between the calcium carbonate and aluminate in the cement, which results in the consumption of calcium carbonate. The trend observed in the XRD data mirrors this pattern.
3.7. TG
Figure 10 illustrates the TG and DTG graphs for the OPC-100, FA-20, CCG-20, and FA-10-CCG-10 specimens. Each specimen exhibited three distinct peaks, with each peak corresponding to a unique material degradation stage. (1) The low-temperature peak (105–300 °C) is due to the dehydration of AFt, M, C-S-H, and C-S-A-H [51,52]. (2) The medium-temperature peak (400–500 °C) corresponds to the decomposition of CH. (3) The high-temperature peak (500–800 °C) is attributed to the decomposition of calcium carbonate [53]. Table 4 presents the mass loss percentages during these four stages. Combining the results in the table with the DTG curve, it can be seen that the component doped with CCG has a more significant weight loss at 105–300 °C and a wider endothermic decomposition temperature range. The primary cause of this is the breakdown of the CH and CCG reaction products. The reaction products include not only C-S-H but also a minor quantity of M and C-S-A-H. Combined with the XRD images, it can be seen that there is more M in the CCG-20 and FA-10-CCG-10 groups, and the decomposition temperature of M is around 190 °C [54]. Both XRD and DTG patterns can prove that more hydration products are produced.
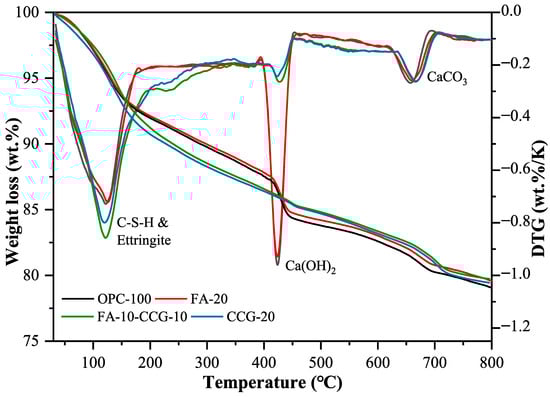
Figure 10.
Thermal analysis data records weight loss (%): TG is depicted on the left and DTG on the right for the pastes examined at 28 days of age.
Table 4.
TG mass loss expressed as a percentage (% weight loss).
Equation (4) is the calculation formula for the CH content in the paste:
where , and represent the mass measured by TGA at 400, 500, and 550 °C. Table 5 displays the results of the computation. The results show that the amount of CH is decreased when CCG powder is added. The shift in the CH peak intensity seen in the XRD patterns is in line with this outcome. There are two main reasons for this: (1) First, the amount of active clinker will reduce proportionately as cement CCG replaces it, and clinker hydration will also result in a drop in CH. (2) On the other hand, CCG interacts with CH, and the Si4+ and Al3+ ions produced from the decomposition of CCG react with CH to create C-S-H and C-A-S-H. Subsequently, this leads to an increase in compressive strength [33].
Table 5.
Calcium hydroxide content.
3.8. SEM
On day 28, Figure 11 presents the microstructural features of the cement pastes for OPC-100, CCG-10, CCG-20, and FA-10-CCG-10. The pictures display typical hydration products, including needle-shaped C-S-H [55] and portlandite. The development of cement hardening strength is caused by the byproducts of hydration, which fill the cement’s internal pores [56]. Besides this, amorphous calcium carbonate was also observed.
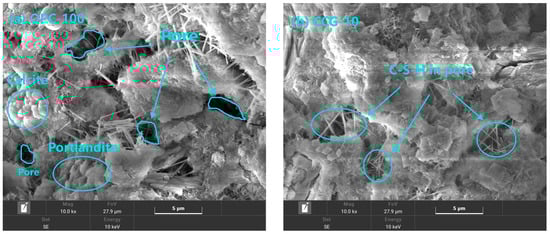
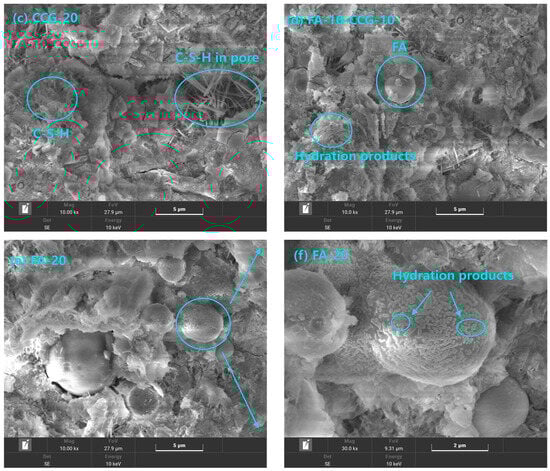
Figure 11.
SEM images at 28 days of OPC-100, CCG-10, CCG-20, FA-10-CCG-10, and FA-20.
Typical representative visuals of the OPC-100, CCG-10, and CCG-20 samples are shown in Figure 11a–c, respectively. It is evident from comparing these three images that the sample’s pores progressively become finer as the CCG content rises. Moreover, in the samples that incorporated CCG, needle-shaped C-S-H is evident, filling the pores within the material. The findings mentioned earlier corroborate the outcomes of the MIP test.
A typical example graph of the FA-10-CCG-10 group of samples is displayed in Figure 11d. The figure shows that hydration products have collected on the outermost layer that has integrated FA and that the materials’ pores have been refined. This demonstrates that when combined, FA and CCG can function well.
Figure 11e,f show typical representative graphics of FA-20 group samples. Figure 11f is a partial enlargement of Figure 11e. Upon extending the curing period to 28 days, the FA experienced additional hydration, leading to the buildup of hydration products on the FA particle surfaces. This increase in hydration products not only textured the FA surface but also improved the interfacial bonding between the FA and the cement matrix.
3.9. Carbon Emissions Analysis
Emissions of carbon dioxide from cement production are substantial, but they can be reduced by using industrial waste in place of cement. Consequently, this study calculates the carbon dioxide emissions associated with the production of one cubic meter of mortar. Emissions resulting from the mixing and transportation processes were excluded from the calculations; the focus was solely on the carbon dioxide emissions based on the experimental mix proportions. Table 6 lists the quantities of materials required to produce one cubic meter of the experimental mortar, Table 7 details the carbon dioxide emission factors (CO2 kg/kg) for each raw material utilized in the experiment, and Table 8 displays the outcomes of the carbon emissions calculations. The total volume of each component in the mortar (OPC, FA, CCG, sand, and water) is constrained to 1 cubic meter per Equation (5):
Here denotes the density of the raw material; signifies the unit volume mass of the raw material (kg/m3), with n set at 5; and i indicates each individual component within the raw material blend (OPC, FA, CCG, sand, and water).
Table 6.
The grade of each constituent material per cubic meter.
Table 6.
The grade of each constituent material per cubic meter.
| Group | OPC (kg) | FA (kg) | CCG (kg) | Sand (kg) | Water (kg) | |
|---|---|---|---|---|---|---|
| mortar | OPC-100 | 630.24 | 0 | 0 | 1260.48 | 315.12 |
| FA-10 | 563.82 | 62.65 | 0 | 1252.92 | 313.23 | |
| FA-20 | 498.18 | 124.55 | 0 | 1245.45 | 311.36 | |
| CCG-10 | 564.61 | 0 | 62.73 | 1254.70 | 313.67 | |
| CCG-20 | 499.59 | 0 | 124.90 | 1248.97 | 312.24 | |
| FA-10-CCG-10 | 498.88 | 62.36 | 62.36 | 1247.21 | 311.80 |
Table 7.
Carbon footprint and energy emission of raw materials used in this investigation [57,58,59,60,61].
Table 7.
Carbon footprint and energy emission of raw materials used in this investigation [57,58,59,60,61].
| Raw Materials | OPC | FA | CCG | Sand | Water |
|---|---|---|---|---|---|
| GWP (CO2 kg/kg) | 0.86 | 0 | 0.079 | 0.0026 | 0.000196 |
Table 8.
Carbon consumption and energy consumption of raw materials used in this investigation results.
Table 8.
Carbon consumption and energy consumption of raw materials used in this investigation results.
| Group | OPC-100 | FA-10 | FA-20 | CCG-10 | CCG-20 | FA-10-CCG-10 |
|---|---|---|---|---|---|---|
| CO2 (kg) | 545.35 | 488.21 | 431.73 | 493.84 | 442.82 | 437.27 |
According to Equation (6),
the CO2 emissions per unit volume can be determined, with representing the emissions per cubic meter of mortar and mi denoting the mass of each raw material per unit of mortar. CO2 signifies the emission factor for the raw material (CO2 kg/kg).
The computation outcomes in Table 8 indicate that the emissions of carbon dioxide per unit volume of mortar significantly decrease as the proportion of cement replaced by these two components increases. Among them, the FA-20 group experiences the most substantial reduction in carbon emissions, which is 20.83%.
In practical engineering applications, when considering adjustments to cement mix proportions, the impact on strength should be considered alongside the reduction in carbon emissions. Each sample mortar group’s 28-day compressive strength is adjusted to carbon dioxide emissions using Equation (7) [57]:
Here, represents the carbon dioxide emissions per unit compressive strength of 28 days (kg·CO2/MPa), is the compressive strength of the mortar sample after 28 days of curing, and is the calculated carbon dioxide emission per unit volume. Figure 12 shows that as the amount of replacement increases, the experimental group’s 28 day carbon dioxide output per unit compressive strength falls. This is primarily due to the fact that the 28 day compressive strength remains constant despite the inclusion of FA and CCG, and these two materials produce lower carbon emissions. It should be highlighted that the CCG group experiences greater advantages from the early strength increase resulting from the substitution of cement, as it exhibits higher initial strength compared to the group which includes FA.
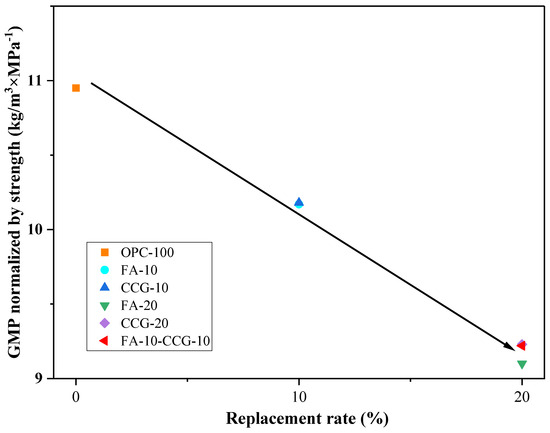
Figure 12.
Strength-normalized carbon dioxide emissions versus the SCM replacement rate.
4. Conclusions
The purpose of this research is to examine how CCG and FA can be used as cementitious auxiliary materials to increase the sustainability of building methods. With an emphasis on the samples’ strength, UPV, ER, pore structure, XRD, FTIR, TGA, SEM, and carbon emissions, this study specifically substituted CCG or FA for cement in part for testing. The following are the primary findings from the experiment:
- The findings from tests on compressive strength, UPV, and ER indicated that replacing 20% of the cement with FA led to reductions of 53.5%, 14.8%, and 24.4% in the 1-day compressive strength, UPV, and ER of the mortar specimens, respectively. In contrast, utilizing CCG as a substitute for a portion of the cement did not lead to significant declines in the compressive strength, UPV, and ER of the mortar specimens. The primary reasons for this difference are the slow secondary hydration reaction of FA and the high reactivity of CCG.
- The MIP test outcomes indicate that the addition of CCG effectively enhances the pore structure of the paste sample. Incorporating CCG tends to shift the pore size distribution towards finer sizes, thereby improving the material’s density and solidity. This is primarily due to the fact that the pores are occupied by additional hydration products resulting from the interaction between CCG and CH.
- The findings from XRD and FTIR studies indicate that the presence of CH in the sample reacts with CCG and FA, leading to the formation of additional hydration products that can be assimilated when cement is significantly substituted by these materials. Moreover, the XRD and FTIR assessments show that calcium carbonate in the sample interacts with aluminate to produce M.
- The TG analysis reveals that the content of CH in the sample decreases by 20.9% and there is an increase in the quantity of supplementary hydration products when 20% of the cement is replaced by CCG. This is primarily due to the fact that CH in the sample reacts and gets consumed when CCG is utilized as a cement substitute. Furthermore, the reaction generates more M, which results in an increased weight loss in the lower temperature range (105–300 °C) when CCG is added.
- The SEM images indicate that the application of CCG leads to the formation of hydration products that fill the pores. By day 28, an increased amount of hydration products will have accumulated on the particle surfaces in samples with added FA. Owing to the volcanic ash effect of FA and the active nature of CCG, this additional formation of hydration products can strengthen the interaction between FA and the cement matrix.
- The carbon emission analysis results showed that using 20% FA and CCG could significantly reduce carbon dioxide emissions by 20.8% and 18.8%, respectively.
The use of FA and CCG was investigated for viability in this study. It offers a useful solution to deal with CG, a by-product of coal production, and FA produced from coal power generation, while lowering the environmental impact of cement products without compromising their performance, thus promising fixes.
Author Contributions
Conceptualization, Z.Z., E.Z. and Z.Y.; methodology, Z.Z., E.Z., Z.Y., Y.L. and G.Z.; software, Z.Z. and Y.M.; validation, G.Z. and Z.Z.; formal analysis, G.Z.; investigation, Y.M.; resources, Y.L.; data curation, Z.Z.; writing—original draft preparation, Z.Z.; writing—review and editing, Y.L. and Y.M. All authors have read and agreed to the published version of the manuscript.
Funding
This work was supported by the Senior Talent Foundation of Jiangsu University [grant no. JDKQ20240404].
Data Availability Statement
The original contributions presented in this study are included in the article. Further inquiries can be directed to the corresponding author.
Conflicts of Interest
The authors declare that they have no known competing financial interest or personal relationships that could have appeared to influence the work reported in this paper.
References
- Nazir, M.J.; Li, G.; Nazir, M.M.; Zulfiqar, F.; Siddique, K.H.M.; Iqbal, B.; Du, D. Harnessing soil carbon sequestration to address climate change challenges in agriculture. Soil Tillage Res. 2024, 237, 105959. [Google Scholar] [CrossRef]
- Li, G.; Xu, S.; Tang, Y.; Wang, Y.; Lou, J.; Zhang, Q.; Zheng, X.; Li, J.; Iqbal, B.; Cheng, P.; et al. Spartina alterniflora invasion altered soil greenhouse gas emissions via affecting labile organic carbon in a coastal wetland. Appl. Soil Ecol. 2024, 203, 105615. [Google Scholar] [CrossRef]
- Supriya; Chaudhury, R.; Sharma, U.; Thapliyal, P.C.; Singh, L.P. Low-CO2 emission strategies to achieve net zero target in cement sector. J. Clean. Prod. 2023, 417, 137466. [Google Scholar] [CrossRef]
- Mo, L.; Zhang, F.; Panesar, D.K.; Deng, M. Development of low-carbon cementitious materials via carbonating Portland cement–fly ash–magnesia blends under various curing scenarios: A comparative study. J. Clean. Prod. 2017, 163, 252–261. [Google Scholar] [CrossRef]
- Memduh, K.; Turhan, B.; Murat, Ç.; Onuralp, Ö.Y.; Sabri, S.M.M. Use of recycled coal bottom ash in reinforced concrete beams as replacement for aggregate. Front. Mater. 2022, 9, 1064604. [Google Scholar] [CrossRef]
- Giergiczny, Z. Fly ash and slag. Cem. Concr. Res. 2019, 124, 105826. [Google Scholar] [CrossRef]
- Juenger, M.C.G.; Siddique, R. Recent advances in understanding the role of supplementary cementitious materials in concrete. Cem. Concr. Res. 2015, 78, 71–80. [Google Scholar] [CrossRef]
- Jamil, M.; Kaish, A.B.M.A.; Raman, S.N.; Zain, M.F.M. Pozzolanic contribution of rice husk ash in cementitious system. Constr. Build. Mater. 2013, 47, 588–593. [Google Scholar] [CrossRef]
- Yang, H.; Monasterio, M.; Zheng, D.; Cui, H.; Tang, W.; Bao, X.; Chen, X. Effects of nano silica on the properties of cement-based materials: A comprehensive review. Constr. Build. Mater. 2021, 282, 122715. [Google Scholar] [CrossRef]
- McCarthy, M.; Dhir, R. Development of high volume fly ash cements for use in concrete construction. Fuel 2005, 84, 1423–1432. [Google Scholar] [CrossRef]
- Li, J.; Wang, J. Comprehensive utilization and environmental risks of coal gangue: A review. J. Clean. Prod. 2019, 239, 117946. [Google Scholar] [CrossRef]
- Wang, C.-Q.; Duan, D.-Y.; Huang, D.-M.; Chen, Q.; Tu, M.-J.; Wu, K.; Wang, D. Lightweight ceramsite made of recycled waste coal gangue & municipal sludge: Particular heavy metals, physical performance and human health. J. Clean. Prod. 2022, 376, 134309. [Google Scholar] [CrossRef]
- Li, D.; Song, X.; Gong, C.; Pan, Z. Research on cementitious behavior and mechanism of pozzolanic cement with coal gangue. Cem. Concr. Res. 2006, 36, 1752–1759. [Google Scholar] [CrossRef]
- Zhu, B.; Dong, X.; Fan, Y.; Ma, X.; Fu, Y.; Chang, M.; Xue, H. Investigation on pyrolysis mechanism and emission characteristics of CO2, NOx and SO2 during co-pyrolysis of coal gangue and sodium alginate/sodium carboxymethylcellulose/chitosan/guar gum. Fuel 2024, 356, 129600. [Google Scholar] [CrossRef]
- Zhang, Y.; Zhang, Y.; Shi, X.; Liu, S.; Shu, P.; Xia, S. Investigation of thermal behavior and hazards quantification in spontaneous combustion fires of coal and coal gangue. Sci Total Environ. 2022, 843, 157072. [Google Scholar] [CrossRef] [PubMed]
- Zhang, Y.; Ling, T.-C. Reactivity activation of waste coal gangue and its impact on the properties of cement-based materials—A review. Constr. Build. Mater. 2020, 234, 117424. [Google Scholar] [CrossRef]
- Li, X.; Qiao, Y.; Shao, J.; Bai, C.; Li, H.; Lu, S.; Zhang, X.; Yang, K.; Colombo, P. Sodium-based alkali-activated foams from self-ignition coal gangue by facile microwave foaming route. Ceram. Int. 2022, 48, 33914–33925. [Google Scholar] [CrossRef]
- Zhang, Y.; Zhang, Z.; Zhu, M.; Cheng, F.; Zhang, D. Decomposition of key minerals in coal gangues during combustion in O2/N2 and O2/CO2 atmospheres. Appl. Therm. Eng. 2019, 148, 977–983. [Google Scholar] [CrossRef]
- Zhu, Y.; Zhu, Y.; Wang, A.; Sun, D.; Liu, K.; Liu, P.; Chu, Y. Valorization of calcined coal gangue as coarse aggregate in concrete. Cem. Concr. Compos. 2021, 121, 104057. [Google Scholar] [CrossRef]
- Gao, S.; Zhao, G.; Guo, L.; Zhou, L.; Yuan, K. Utilization of coal gangue as coarse aggregates in structural concrete. Constr. Build. Mater. 2021, 268, 121212. [Google Scholar] [CrossRef]
- Wang, Q.; Li, Z.; Zhang, Y.; Zhang, H.; Zhou, M.; Fang, Y. Influence of coarse coal gangue aggregates on elastic modulus and drying shrinkage behaviour of concrete. J. Build. Eng. 2020, 32, 101748. [Google Scholar] [CrossRef]
- Wu, D.; Chen, T.; Hou, D.; Zhang, X.; Wang, M.; Wang, X. Utilization of coal gangue powder to improve the sustainability of ultra-high performance concrete. Constr. Build. Mater. 2023, 385, 131482. [Google Scholar] [CrossRef]
- Yang, J.; Su, Y.; He, X.; Tan, H.; Jiang, Y.; Zeng, L.; Strnadel, B. Pore structure evaluation of cementing composites blended with coal by-products: Calcined coal gangue and coal fly ash. Fuel Process. Technol. 2018, 181, 75–90. [Google Scholar] [CrossRef]
- Kong, D.; Wang, T.; Zhang, J.; Li, T.; Liu, T. Improvement of strength and microstructure of low-carbon cementitious materials with high volume of calcined coal gangue. Constr. Build. Mater. 2024, 444, 137916. [Google Scholar] [CrossRef]
- Wang, Z.; Wang, J.; Wu, H.-N.; Zhang, R.; Zhang, G.-y.; Zhang, F.; Mariani, S. Investigation of the microstructure, mechanical properties and thermal degradation kinetics of EPDM under thermo-stress conditions used for joint sealing of floating prefabricated concrete platform of offshore wind power. Constr. Build. Mater. 2025, 485, 141897. [Google Scholar] [CrossRef]
- ASTM C618; Standard Specification for Coal Fly Ash and Raw or Calcined Natural Pozzolan for Use in Concrete. ASTM International: West Conshohocken, PA, USA, 2003.
- Luo, Y.; Miao, Y.; Wang, P.; Gai, P.; Yang, J.; Zhang, G. Effects of Calcined Coal Gangue and Carbide Slag on the Properties of Cement Paste and Mortar. Materials 2025, 18, 2242. [Google Scholar] [CrossRef]
- ASTM C188-17; Standard Test Method for Density of Hydraulic Cement. ASTM International: West Conshohocken, PA, USA, 2017.
- E, F.; Zhang, X.; Su, L.; Liu, B.; Li, B.; Li, W. Analysis of calcination activation modified coal gangue and its acid activation mechanism. J. Build. Eng. 2024, 95, 109916. [Google Scholar] [CrossRef]
- Nukah, P.D.; Abbey, S.J.; Booth, C.A.; Nounu, G. Mapping and synthesizing the viability of cement replacement materials via a systematic review and meta-analysis. Constr. Build. Mater. 2023, 405, 133290. [Google Scholar] [CrossRef]
- ASTM C349-18; Standard Test Method for Compressive Strength of Hydraulic-Cement Mortars (Using Portions of Prisms Broken in Flexure). ASTM International: West Conshohocken, PA, USA, 2018.
- ASTM C597-22; Standard Test Method for Pulse Velocity Through Concrete. ASTM International: West Conshohocken, PA, USA, 2022.
- Liu, Y.; Lei, S.; Lin, M.; Xia, Z.; Pei, Z.; Li, B. Influence of calcined coal-series kaolin fineness on properties of cement paste and mortar. Constr. Build. Mater. 2018, 171, 558–565. [Google Scholar] [CrossRef]
- Deschner, F.; Winnefeld, F.; Lothenbach, B.; Seufert, S.; Schwesig, P.; Dittrich, S.; Goetz-Neunhoeffer, F.; Neubauer, J. Hydration of Portland cement with high replacement by siliceous fly ash. Cem. Concr. Res. 2012, 42, 1389–1400. [Google Scholar] [CrossRef]
- Uysal, M. The influence of coarse aggregate type on mechanical properties of fly ash additive self-compacting concrete. Constr. Build. Mater. 2012, 37, 533–540. [Google Scholar] [CrossRef]
- Zhang, G.-Y.; Wang, J.; Zheng, Y.; Wang, Z.; Wang, X.-Y. Perforated cenospheres used to enhance the engineering performance of high-performance cement-slag-limestone ternary binder. Constr. Build. Mater. 2024, 455, 139084. [Google Scholar] [CrossRef]
- Berodier, E.; Scrivener, K.; Scherer, G. Understanding the Filler Effect on the Nucleation and Growth of C-S-H. J. Am. Ceram. Soc. 2014, 97, 3764–3773. [Google Scholar] [CrossRef]
- Xuan, M.-Y.; Guo, R.; Lin, R.-S.; Wang, X.; Wang, X.-Y. Mechanism of fineness and content of quartz powder on the improvement of carbonation curing efficiency. Cem. Concr. Compos. 2024, 150, 105570. [Google Scholar] [CrossRef]
- Yang, B.; Liu, Y.; Wang, X.Y. A Hydration Model to Evaluate the Properties of Cement-Quartz Powder Hybrid Concrete. Materials 2024, 17, 2769. [Google Scholar] [CrossRef] [PubMed]
- Bogas, J.A.; Gomes, M.G.; Gomes, A. Compressive strength evaluation of structural lightweight concrete by non-destructive ultrasonic pulse velocity method. Ultrasonics 2013, 53, 962–972. [Google Scholar] [CrossRef]
- Demirboğa, R.; Türkmen, İ.; Karakoç, M.B. Relationship between ultrasonic velocity and compressive strength for high-volume mineral-admixtured concrete. Cem. Concr. Res. 2004, 34, 2329–2336. [Google Scholar] [CrossRef]
- Zhang, H.; Xu, Y.; Gan, Y.; Chang, Z.; Schlangen, E.; Šavija, B. Combined experimental and numerical study of uniaxial compression failure of hardened cement paste at micrometre length scale. Cem. Concr. Res. 2019, 126, 105925. [Google Scholar] [CrossRef]
- Ramezanianpour, A.A.; Pilvar, A.; Mahdikhani, M.; Moodi, F. Practical evaluation of relationship between concrete resistivity, water penetration, rapid chloride penetration and compressive strength. Constr. Build. Mater. 2011, 25, 2472–2479. [Google Scholar] [CrossRef]
- Manjunath, B.; Ouellet-Plamondon, C.M.; Das, B.B.; Bhojaraju, C. Potential utilization of regional cashew nutshell ash wastes as a cementitious replacement on the performance and environmental impact of eco-friendly mortar. J. Build. Eng. 2023, 66, 105941. [Google Scholar] [CrossRef]
- Guan, X.; Chen, J.; Zhu, M.; Gao, J. Performance of microwave-activated coal gangue powder as auxiliary cementitious material. J. Mater. Res. Technol. 2021, 14, 2799–2811. [Google Scholar] [CrossRef]
- Nguyen, H.-A.; Chang, T.-P.; Shih, J.-Y.; Chen, C.-T. Influence of low calcium fly ash on compressive strength and hydration product of low energy super sulfated cement paste. Cem. Concr. Compos. 2019, 99, 40–48. [Google Scholar] [CrossRef]
- Lin, R.-S.; Lee, H.-S.; Han, Y.; Wang, X.-Y. Experimental studies on hydration–strength–durability of limestone-cement-calcined Hwangtoh clay ternary composite. Constr. Build. Mater. 2021, 269, 121290. [Google Scholar] [CrossRef]
- Ylmén, R.; Jäglid, U.; Steenari, B.-M.; Panas, I. Early hydration and setting of Portland cement monitored by IR, SEM and Vicat techniques. Cem. Concr. Res. 2009, 39, 433–439. [Google Scholar] [CrossRef]
- de Oliveira, A.M.; Oliveira, A.P.; Vieira, J.D.; Junior, A.N.; Cascudo, O. Study of the development of hydration of ternary cement pastes using X-ray computed microtomography, XRD-Rietveld method, TG/DTG, DSC, calorimetry and FTIR techniques. J. Build. Eng. 2023, 64, 105616. [Google Scholar] [CrossRef]
- Fernández-Carrasco, L.; Vázquez, E. Reactions of fly ash with calcium aluminate cement and calcium sulphate. Fuel 2009, 88, 1533–1538. [Google Scholar] [CrossRef]
- Lin, R.-S.; Han, Y.; Wang, X.-Y. Macro–meso–micro experimental studies of calcined clay limestone cement (LC3) paste subjected to elevated temperature. Cem. Concr. Compos. 2021, 116, 103871. [Google Scholar] [CrossRef]
- Ren, M.; Wen, X.; Gao, X.; Liu, Y. Thermal and mechanical properties of ultra-high performance concrete incorporated with microencapsulated phase change material. Constr. Build. Mater. 2021, 273, 121714. [Google Scholar] [CrossRef]
- Mo, Z.; Gao, X.; Su, A. Mechanical performances and microstructures of metakaolin contained UHPC matrix under steam curing conditions. Constr. Build. Mater. 2021, 268, 121112. [Google Scholar] [CrossRef]
- Naqi, A.; Siddique, S.; Kim, H.-K.; Jang, J.G. Examining the potential of calcined oyster shell waste as additive in high volume slag cement. Constr. Build. Mater. 2020, 230, 116973. [Google Scholar] [CrossRef]
- Chen, Z.-w.; Wang, H.-l.; Zhang, J.; Sun, X.-y. Simulation analysis of microstructure development of tricalcium silicate using the needle model of calcium silicate hydrate. Cem. Concr. Res. 2024, 183, 107589. [Google Scholar] [CrossRef]
- Wang, Z.; Lyu, H.-M.; Zhang, R. Water-swelling behavior and self-reinforcing mechanical properties of joint sealing material in underground prefabricated structure. Constr. Build. Mater. 2025, 490, 142451. [Google Scholar] [CrossRef]
- Yang, B.; Han, Y.; Kong, Z.; Wang, X.-Y. Effect of waste oyster shell powder on the micro- and macroproperties and sustainable performance of cement-based materials. J. Build. Eng. 2024, 92, 109800. [Google Scholar] [CrossRef]
- Liu, Y.; Jing, R.; Yan, P. Improving environmental efficiency of ultra-high-performance concrete (UHPC) through appropriate application of ultrafine quartz powder. J. Sustain. Cem.-Based Mater. 2022, 12, 941–950. [Google Scholar] [CrossRef]
- Chiaia, B.; Fantilli, A.P.; Guerini, A.; Volpatti, G.; Zampini, D. Eco-mechanical index for structural concrete. Constr. Build. Mater. 2014, 67, 386–392. [Google Scholar] [CrossRef]
- Zhao, J.; Wang, A.; Zhu, Y.; Dai, J.-G.; Xu, Q.; Liu, K.; Hao, F.; Sun, D. Manufacturing ultra-high performance geopolymer concrete (UHPGC) with activated coal gangue for both binder and aggregate. Compos. Part B Eng. 2024, 284, 111723. [Google Scholar] [CrossRef]
- Chen, P.; Zhang, L.; Wang, Y.; Fang, Y.; Zhang, F.; Xu, Y. Environmentally friendly utilization of coal gangue as aggregates for shotcrete used in the construction of coal mine tunnel. Case Stud. Constr. Mater. 2021, 15, e00751. [Google Scholar] [CrossRef]
Disclaimer/Publisher’s Note: The statements, opinions and data contained in all publications are solely those of the individual author(s) and contributor(s) and not of MDPI and/or the editor(s). MDPI and/or the editor(s) disclaim responsibility for any injury to people or property resulting from any ideas, methods, instructions or products referred to in the content. |
© 2025 by the authors. Licensee MDPI, Basel, Switzerland. This article is an open access article distributed under the terms and conditions of the Creative Commons Attribution (CC BY) license (https://creativecommons.org/licenses/by/4.0/).