Article

Development of Thermally Insulating Gypsum Boards Blended with Quartzite and Fiberglass Waste

by
Rosana M. R. Mol
,
Marialaura H. Rosas
*,
Keoma D. C. e Silva
and
Ricardo A. F. Peixoto
Department of Civil Engineering, Federal University of Ouro Preto (UFOP), Ouro Preto 35400-000, MG, Brazil
*
Author to whom correspondence should be addressed.
Constr. Mater. 2025, 5(2), 30; https://doi.org/10.3390/constrmater5020030
Submission received: 6 March 2025 / Revised: 4 April 2025 / Accepted: 14 April 2025 / Published: 29 April 2025

Abstract

:
The construction industry generates approximately 45% of the world’s total waste, highlighting the need for sustainable solutions. This study investigates the incorporation of quartzite waste (QW) and fiberglass waste (FW) into the production of gypsum plasterboard to reduce its environmental impact while maintaining its structural performance. The optimum formulation (MQ-20) was determined by replacing 20% of the gypsum with QW, based on the observed free water loss and crystallization water. The physical, mechanical, and thermal properties of the reference and modified boards were evaluated. The results showed that the MQ-20 samples exhibited a 30% reduction in flexural strength compared to the reference, while still exceeding regulatory standards. In addition, the MQ-20 samples had a lower thermal conductivity (0.54 W/(m∙K)) than the reference (0.58 W/(m∙K)). Fire-resistance tests showed that the inclusion of QW and FW reduced the size and number of cracks, improving the structural stability of the plasterboard at high temperatures. This research demonstrates that the incorporation of industrial waste into plasterboard is a viable and environmentally friendly approach, providing both mechanical and thermal performance benefits. These findings provide a basis for future studies aimed at developing sustainable building materials with improved functional properties.

1. Introduction

In the current context of increasing concern for sustainability and efficient resource management, the construction industry faces the challenge of designing materials that are not only functional and economical but also eco-friendly. This is particularly relevant as this industry is responsible for approximately 45% of the world’s total waste [1]. The use of different types of waste as raw materials to produce new building materials is a solid strategy to reduce the use of non-renewable materials and minimize environmental impacts. This approach provides a sustainable pathway for the construction industry and landfill management [2,3].
Gypsum is widely used in the construction industry to produce fire-resistant materials; however, the temperature of gypsum boards can increase rapidly, leading to cracking [4]. To improve the performance of these boards at high temperatures, various organic additives (e.g., rice husk, hemp fibers, etc.) and inorganic additives (e.g., construction and demolition waste, fiberglass, etc.) have been tested [5,6,7,8]. For instance, Desmond et al. [9] demonstrated that incorporating coconut fibers into gypsum-based boards increased their flexural strength, flame resistance, and thermal stability. The incorporation of various industrial residues has also shown promising results in enhancing the mechanical properties of cementitious composites. Recent studies indicate that using recycled concrete and paste powder as green precursors in engineered geopolymer composites (EGCs) improves their mechanical behavior while promoting sustainability [10]. Moreover, the size and content of the recycled aggregates used directly influence the ductility and fracture behavior of the resulting composites, as observed in EGCs made with recycled concrete aggregates [11].
The role of aggregates and fibers in modifying the physical and mechanical properties of gypsum-based materials is crucial. While aggregates affect the density, thermal conductivity, and mechanical behavior of the material, fibers enhance its fracture toughness, tensile strength, and ductility [2]. Specifically, fiberglass waste (FW), as well as other types of fibers, is known to improve the structural integrity of composites by bridging microcracks and delaying crack propagation, which enhances the composite’s post-cracking behavior and overall durability [12,13]. Despite these advantages, the challenge lies in optimizing the incorporation of FW and other types of industrial waste to achieve a balance between mechanical performance and environmental sustainability.
Ornamental stone exploitation represents a significant global industry, and the extraction and processing of these materials generates a significant amount of waste, including quartzite waste (QW) [10,11]. Despite its environmental classification as a non-hazardous and inert waste, the inappropriate disposal of QW can lead to serious environmental problems, including river siltation, water contamination, and public health concerns [12]. The use of ornamental rock wastes in the production of Portland cement-based composites has been investigated by numerous researchers [13,14,15].
Similarly, fiberglass waste (FW), commonly generated by several types of industries (e.g., automotive sector, shipping industry, mining industry, construction industry, etc.), presents a significant challenge due to its environmental impact and the fact that it is hard to recycle [16,17]. However, when properly incorporated into new products, this waste can significantly improve the mechanical strength and durability of the resulting materials [2,18,19,20,21].
Previous studies have demonstrated the technical possibility of using quartzite waste as a supplementary cementitious material [18] and fiberglass waste as reinforcement for cement composites [12,13]. Thus, the present work extends the previous research by using both QW and FW in combination as filler and reinforcement, respectively, to produce gypsum boards. This study aims to characterize the chemical, physical, morphological, and microstructural properties of QW and FW and evaluate the physical, mechanical, thermal, and microstructural properties of gypsum boards produced with these wastes. Furthermore, an experimental procedure was carried out to determine the optimum dosage of these materials in manufacturing eco-friendly gypsum boards based on QW, providing new insights into sustainable material development and the potential of industrial waste for construction applications.

2. Materials and Methods

2.1. Materials

The following materials were used in the production of the gypsum boards: (i) commercial standard gypsum as a binder component (calcium sulfate semi-hydrated, CaSO4 × 0.5H2O, impurities < 2 wt%); (ii) QW as filler; (iii) FW as fiber reinforcement, and (iv) expanded clay (EC) as a lightweight aggregate. The QW and FW were collected from a mine in the metropolitan area of Belo Horizonte and an industrial complex in Vitória, Brazil, respectively [22].
Initially, the QW was oven-dried at 105 °C for 24 h, classified by a sieving process, and then passed through a 75.0 µm sieve. The FW was first milled in a crusher machine (Shredder Equipment, HNSUNY, Zhengzhou, China), followed by further milling in a knife mill until a particle size distribution between 75 µm and 0.3 mm was obtained. Furthermore, the EC was gravimetrically classified, and milled until a particle size distribution between 1.18 and 2.36 mm was achieved. According to the literature, the dry weight density of EC is approximately 5.9 kN/m3, and its porosity contributes to improving water drainage and internal aeration [23].
Subsequently, the wastes were physically characterized by laser granulometry using a Bettersize 2000 (Dandong Bettersize Instruments Ltd., Dandong, China) device, using alcohol isopropyl as the vehicle, and the bulk specific gravity was determined based on ASTM C127-24 [24]. The chemical characteristics were determined through X-ray fluorescence spectroscopy (XRF) in a Panalytical Epsilon 3x spectrometer (Malvern Panalytical, Almelo, The Netherlands), while the morphology was observed through optical microscopy, using a Coleman e Kontrol 26600 stereoscope (Coleman Equipamentos para Laboratório, Santo André, Brazil) with a magnification of up to 45 times.

2.2. Optimal Dosage Definition

We conducted an experimental procedure to establish the optimal dosage design. In order to define the optimal mixture, four mixture designs were characterized regarding the free and crystallization water, and morphology, that were used. The QW substitution ratio was used as the primary parameter to guide this definition. Analyses were carried out using a Shimadzu thermogravimetric analyzer (TG/DTA) and a microscopic test was conducted after heat treatment using the Coleman e Kontrol 266000 stereoscope (Coleman Equipamentos para Laboratório, Santo André, Brazil). TG/DTA analyses were conducted to verify the total mass loss of the studied mixtures. As the QW content increases, the W/G ratio changes due to the dilution of the active gypsum binder and the water absorption by the quartzite particles, which affects the mixture’s consistency and hydration kinetics. Table 1 shows the mixture designs, wherein the gypsum mixtures are designated according to their QW substitution ratio (0.0 wt%, 0.5 wt%, 5.0 wt%, and 50.0 wt%). Furthermore, the water/gypsum (W/G) ratio was determined based on ASTM C472 [25] (see Section 2.4).

2.3. Sample Preparation

The gypsum mixtures were manually homogenized following the guidelines of ASTM C1396 [26]. First, the dry materials (i.e., gypsum, expanded clay, fiberglass) were homogenized and then distilled water was gradually added during mixing. Once the mixture had been fully homogenized, it was molded in 40 × 40 × 160 mm3 prismatic molds and 30 × 30 × 2 cm3 plate molds. All specimens were cured for 24 h at room temperature (23 °C) and then stored for subsequent analysis.

2.4. Fresh State Properties

The optimal W/G ratio was determined based on the criteria of normal consistency, which was determined using a penetration test (modified Vicat equipment) following the ASTM C472 [25]. The penetration test was conducted in mixtures of gypsum and solution (10 mL of sodium citrate at 20 g∙L−1 was mixed with distilled water until it reached 150 g). The normal consistency was set as a penetration height of 30 ± 2 mm.
Furthermore, the setting time and temperature evolution (thermometry) were also observed. The setting time tests were carried out using the same penetration procedure but without the addition of the sodium citrate solution. The thermometry of the mixtures was determined using HD thermocouple cables coupled to a data logger (HOBO, Onset Computer Corporation, Bourne, MA, USA), and the data were processed using HOBOware software (version 3.6). Temperature readings in each connected cable were taken at 10 s intervals for 3 h. A semi-hermetic system set was designed using a controlled-temperature room (constant temperature fixed at 22 °C) and polystyrene boxes. The thermocouples were inserted immediately after the mixture of dry materials and water.

2.5. Hardened-State Testing Properties

The hardened-state properties were determined for the specimens manufactured using the optimal dosage (i.e., MQ-20) and the reference dosage. Their mechanical, physical, chemical, thermal, and fire-resistance properties were evaluated as follows. Compressive strength was determined at 28 days according to ASTM C473 [27], using six specimens with dimensions of 40 × 40 × 160 mm3. The specimens were loaded at a rate of 550 N∙s−1. Flexural strength was evaluated using two specimens (300 × 300 × 20 mm3) by applying a load of 250 ± 50 N∙min−1. These tests were performed using a servo-hydraulic press EMIC DL 20000 (EMIC Co., Ltd., Saitama, Japan). For all tests involving the gypsum boards, the thickness of the plates was standardized at 20 mm to ensure consistency across the samples. Subsequently, surface hardness was measured according to the ASTM C1629 [28], using a 430.2 g sphere dropped from a precise height of 50 ± 1 cm, starting from total inertia, to conduct impacts on three random points on the front face of each sample. The surface hardness was determined as the diameter of the resultant fracture hole on the plate after impact. Additionally, carbon paper was placed above the gypsum plate to facilitate the reading, and the results are presented as the mean value of two samples of each specimen. The area density was determined in accordance with ASTM C1396 using Equation (1).
d = m x · y 10 3
where d is the surface density in kg·m−2, m is the mass in grams (g), and x and y are the length and width of the test specimen in millimeters (mm). The factor 10 3 is used to convert the mass from grams (g) to kilograms (kg) to ensure consistency with the SI units (kg·m−2) required by ASTM C1396 [26].
The water absorption was calculated as the percentage increase in the mass of the test specimen relative to its initial mass, in accordance with the ASTM C473 [27] (Equation (2)), and two specimens were used for each mixture. The pH of the samples was measured on two specimens using a Hanna HI2550 (Hanna Instruments, Woonsocket, RI, USA).
a = m f m i m i
where a represents water absorption in %, m f is the final mass of the specimen after immersion in water in grams (g), and m i is the initial mass of the dry specimen in grams (g).
Several tests were conducted to determine the thermal properties and fire resistance of the gypsum boards. Thermal conductivity was evaluated according to the ASTM C518 [29] using a NETZSCH HFM 436 Lambda (NETZSCH-Gerätebau GmbH, Selb, Germany). A mean temperature of 20 °C was adopted, with a difference of 10 °C between the cold and hot plates. Additionally, TG/DTA techniques were employed using a Shimadzu DTG-60H (Shimadzu Corporation, Kyoto, Japan) thermal analyzer, wherein the samples were heated from 20 °C to 1100 °C at a heating rate of 20 °C∙min−1 in a nitrogen atmosphere, and an alumina crucible. To evaluate the fire resistance of the specimens, an SP Labor SP 1200 (Super Machinery, Zhengzhou, China) muffle furnace was used, following the procedures established by ASTM E119 [30]. The surface temperature of the specimens was measured using TMC50-HD (Onset Computer Corporation, Bourne, MA, USA) thermocouples coupled to a multimeter, and an infrared thermal imaging camera. Subsequently, to assess the matrix microstructure after the fire-resistance test, scanning electron microscopy (SEM) was used to observe the morphology of the specimens. The collected samples were gold-coated, and a HITACHI TN3000 (Hitachi High-Tech Corporation, Tokyo, Japan) electron microscope was used for analysis.

3. Results and Discussion

3.1. Materials Characterization

The observed particle size distributions of the QW for the D90, D50, and D10 specimens were 73.1 mm, 29.0 mm, and 6.5 mm, respectively. These results are close to the 28.8 µm obtained by Gou et al. [31] for gypsum. The particle size analysis of this material classifies it as powdery, a relevant physical characteristic for replacing gypsum in the production of gypsum boards, considering its properties in both fresh and hardened states. In addition, the bulk specific gravity of the gypsum, QW, FW, and EC was 0.60 g∙cm−3, 0.97 g∙cm−3, 0.17 g∙cm−3, and 0.63 g∙cm−3, respectively.
Table 2 shows the chemical compositions of gypsum, QW, and FW. Gypsum is primarily composed of sulfur and calcium oxides and has less than 2.0% impurities. In contrast, QW is dominated by silica and alumina oxides. The FW used in this study shows a typical composition of fiberglass (55% by mass of SiO2), calcium, and alumina oxides, which are commonly used for reinforcement applications [13].
Figure 1 shows the morphological aspects of the materials. The morphological analysis of the gypsum (Figure 1a,b) shows a high specific surface area, which appears as powdery, light-colored, and opaque, possibly due to calcium oxides. Figure 1c,d shows the surface of the QW, which is a fine, light-colored material with intense luster, characteristics that could be related to the presence of silica oxides; each grain can be identified. Regarding the EC, Figure 1e,f highlights the high quality of its grains. The EC’s grains, which are granular materials of varied coloration (possibly due to calcination processes), have different sizes and clearly defined surfaces. The areas exposed to the calcination process can be distinguished from the fractured areas that show the interior of the grains; in the intact grains, a smoother and vitrified outer layer can be observed, while magnified images reveal a microporous interior, a notable characteristic of expanded clays that results from their expansion during heating. Finally, Figure 1g,h shows the FW, which has a very thin thickness and a high length/diameter ratio. The fibers appear as a fibrous material that is light-colored and intensely lustrous, possibly due to the presence of silica oxides, and each fiber can be identified.

3.2. Optimal Dosage for the Composite

The TG/DTA analysis of the samples is presented in Figure 2. Since the presence of free water is a crucial factor for fire resistance, along with the ability to remain intact, the formulations used to produce the composites (i.e., optimal dosage) were based on the results obtained from the TG/DTA analysis and the determination of the water percentage in the proposed mixtures.
Table 3 shows the values of the free water and crystallization water in the samples. The reference showed values of 1.4% and 12.5% for its free and crystallization water, respectively, while the blended specimens showed values between 1.8 and 2.8% and 11.5 and 6.0% for their free and crystallization water, respectively. As the amount of QW increased, the amount of free water also increased, and the amount of crystallization water decreased—as expected due to the dilution effect.
The values found for the free water and crystallization water were low (Table 3) in comparison to those obtained in previous research [32], which may have been influenced by the differences in the W/G ratio and porosity of the samples. The success of gypsum boards as a fire barrier is based on the evaporation of free and crystallization water. This process delays the temperature rise in the floor and wall components of buildings in a fire situation, thus increasing the time for safe evacuation [4].
The correlation between the concentration of QW and both the total mass loss and crystallization water content is shown in Figure 3. It can be observed that, at around 20% QW, there is a balance point in the variation in the crystallization water content. QW concentrations above 20% show significant variation in the resulting mass loss, which could affect the performance of the resulting boards. Aiming to maximize the addition of QW while achieving minimal mass loss and higher water availability, and noting that commercial gypsum boards usually contain between 70% and 90% gypsum, the optimal dosage of QW addition was determined to be 20%. Thus, the optimal dosage used to produce the composites is represented by the MQ-20 sample (Table 1).
Figure 4 shows the microscopic images of the four mixture specimens used in the thermal analysis. As the concentration of QW increases, the samples exhibit increased homogeneity and less porosity. This phenomenon positively suggests the feasibility of replacing gypsum with quartzite waste in the composite material formulation of gypsum boards.

3.3. Properties in the Fresh State

To achieve a normal consistency of the reference specimen, a W/G mass ratio equal to 0.43 was required. In contrast, for the MQ-2O specimen, the normal consistency was achieved by a water/composite mass ratio of 0.38. To achieve a normal consistency for the MQ-20 specimen, it was necessary to decrease the amount of water relative to the dry materials, due to the lower concentration of gypsum (high hygroscopicity) in the composite’s formulation [33]. Additionally, silica in the QW could act as a nucleation site for the formation of hydrates in the matrix formulation, resulting in slightly fewer plastic mixes but a better mechanical performance and durability due to enabling an improved compactness of the mix [34].
The results obtained for the initial and final setting times show differences between the reference specimen and MQ-20. In terms of the initial setting time, the reference specimen had an average time of 5 min and 2 s, while MQ-20 had a significantly longer time of 6 min and 2 s, which represents an increase of 19.9%. This increase suggests that MQ-20 has a longer workability period. Similarly, the final setting time also showed a difference. The reference specimen reached its final setting at 8 min and 12 s, while that for MQ-20 was 9 min and 47 s, an increase of 19.7%. This phenomenon may be related to the presence of FW, EC, and QW; however, a slight increase in the initial and final setting times ensures an adequate workability of the mix for a longer period, allowing the material to be used for extended periods.
The thermometry curves of the reference specimen and MQ-20 specimen are shown in Figure 5. During the first 30 min after preparing the mix, the heat released by the hydration of the reference specimen and that released by the MQ-20 specimen follow a similar rate, reaching approximately 37.0 °C. After 47 min, the reference specimen reaches a maximum temperature of 47.2 °C, while the MQ-20 reaches 43.2 °C at 53 min and 20 s. This behavior could be explained by the reduced amount of gypsum available to react with water, which lowers the final maximum temperature and slightly delays the setting process. Although there is a difference in the heat of hydration between the two compositions, the time versus temperature curve behaves similarly in both cases.

3.4. Hardened-State Properties

3.4.1. Mechanical Properties

The compressive and flexural strength results are shown in Figure 6. The reference specimens showed a compressive strength value that was ~5% higher than that of the MQ-20 specimens (from 19.3 to 18.3 MPa). This difference can be attributed to the presence of AE grains, whose porous and less-cohesive structure reduces the composite’s mechanical integrity compared to pure hardened gypsum. According to ASTM C473 [27], the compressive strength should be equal to or greater than 8.4 MPa at 28 days, which was achieved by all specimens. Furthermore, the 20% reduction in gypsum consumption decreased the compressive strength by only 5%, thus increasing the binder efficiency (i.e., binder consumption over mechanical strength).
The MQ-20 specimens showed lower flexural strength values compared to the reference (from 5.8 to 4.1 MPa). This could be related to the type of cracking, as mechanical stresses tend to be larger and more intense than thermal stresses. Roces et al. [23] noted that the presence of EC grains made their test specimens more porous and less cohesive, creating weak areas at the interfacial transition zone (ITZ). While the compressive strength showed a ~5% reduction, the flexural strength showed a ~30% reduction, which is due to the porosity—as it is well-known that the porosity has a larger effect on the flexural strength than on the compressive strength. On the other hand, in the high-stress zones of the matrix, cracks are generated that reach the FW and then propagate along the interface between the matrix and the fiber, and that failure energy is dissipated along the interface, causing fiber detachment and separation [35]. These results suggest that the addition of FW not only contributes to sustainability due to using industrial waste but also modifies the resulting fracture behavior, leading to a more ductile and durable composite.
The specimens after the flexural strength test are shown in Figure 7. As shown in Figure 7a, the reference specimens fractured at the load application point, while the MQ-20 specimen shows a crack in the direction of the load application but remain in one piece (see Figure 7b). The wholeness of the fractured bord could be explained by the FW reinforcement, as fiber reinforcement enhances the overall mechanical performance and changes the fracture behavior of materials [2]. FW works as a crack-bridging material, changing the post-peak and fracture behaviors of the tested board, transforming a brittle rupture, with a single crack, into a ductile rupture, with multiple randomly distributed cracks [36].
The surface hardness of the MQ-20 specimen, considering the diameters of the indentations, was slightly lower than that of the reference plates (from 10.9 to 9.5 mm). The incorporation of FW, EC, and QW distributed the internal energy of the system more efficiently due to the reinforcement system formed by the FW and the nucleation points and the potentiation of hydrate formation through the addition of QW, allowing the composite to withstand greater loads and decreasing the brittleness of the plates. This enabled the plates to absorb the load without undergoing mechanical degradation due to rupture. Improved mechanical performance can translate into greater durability for composite plates, especially against hygroscopic movements that generate internal stresses in these materials.

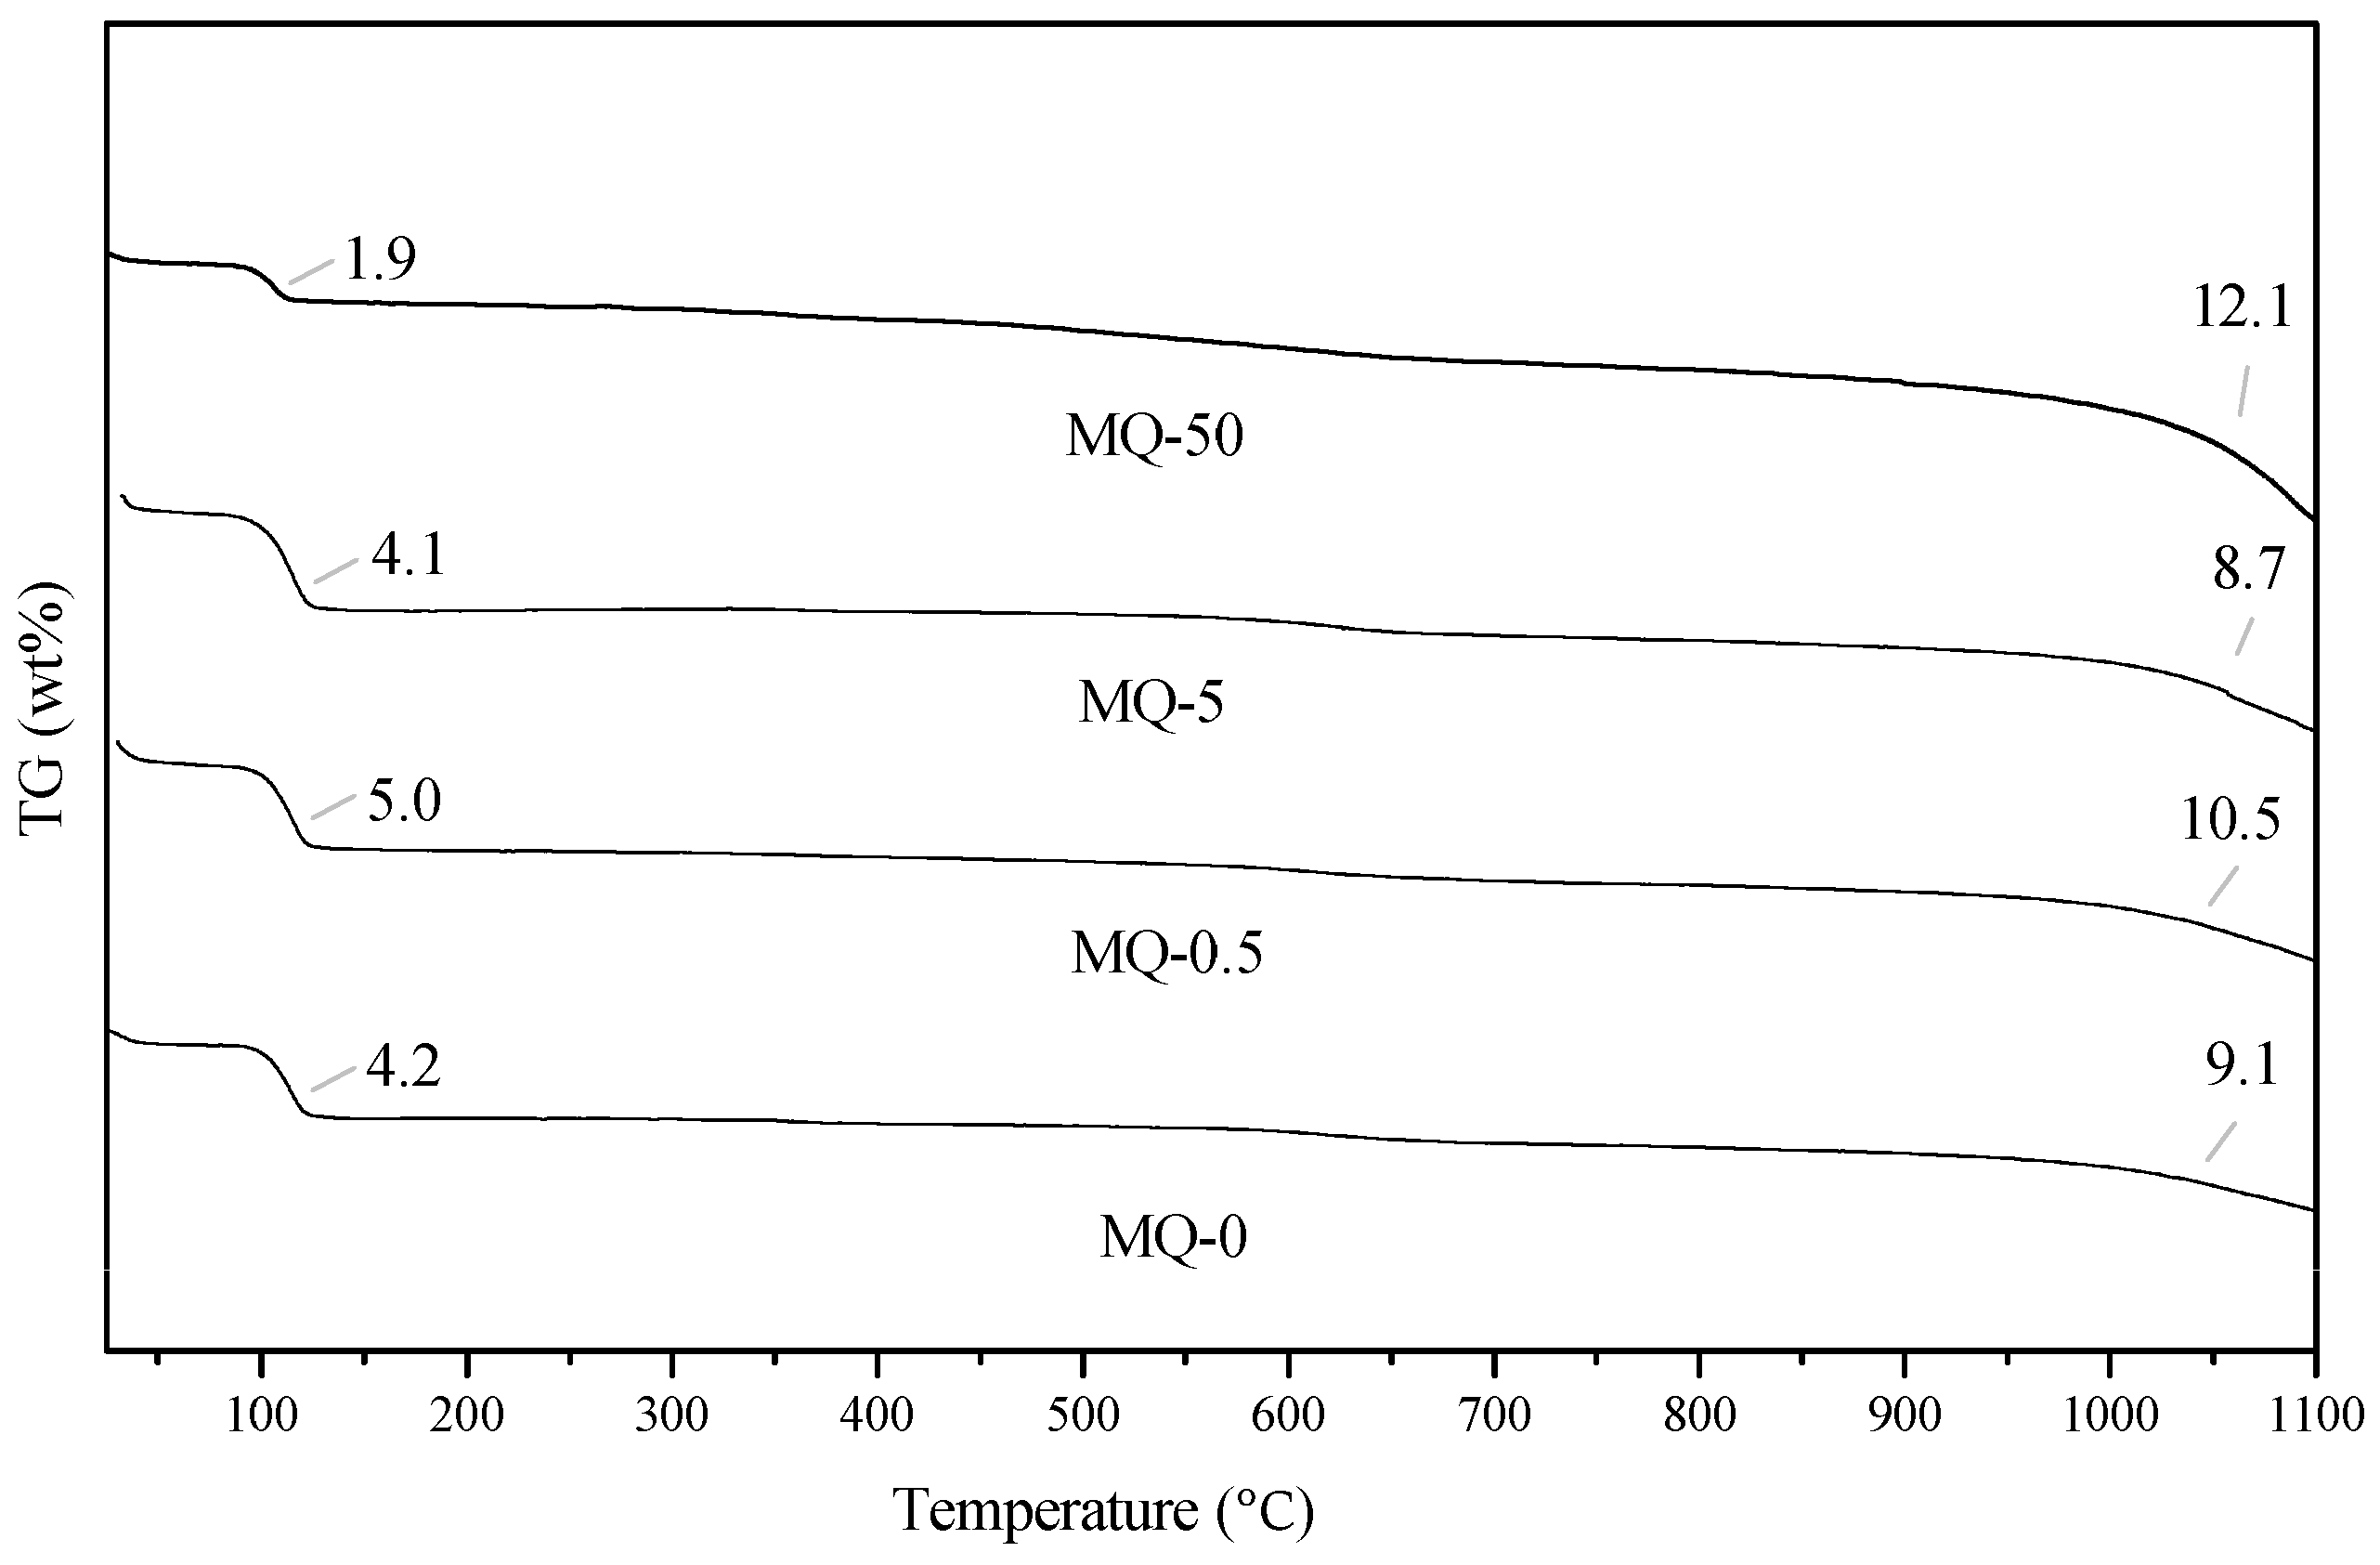
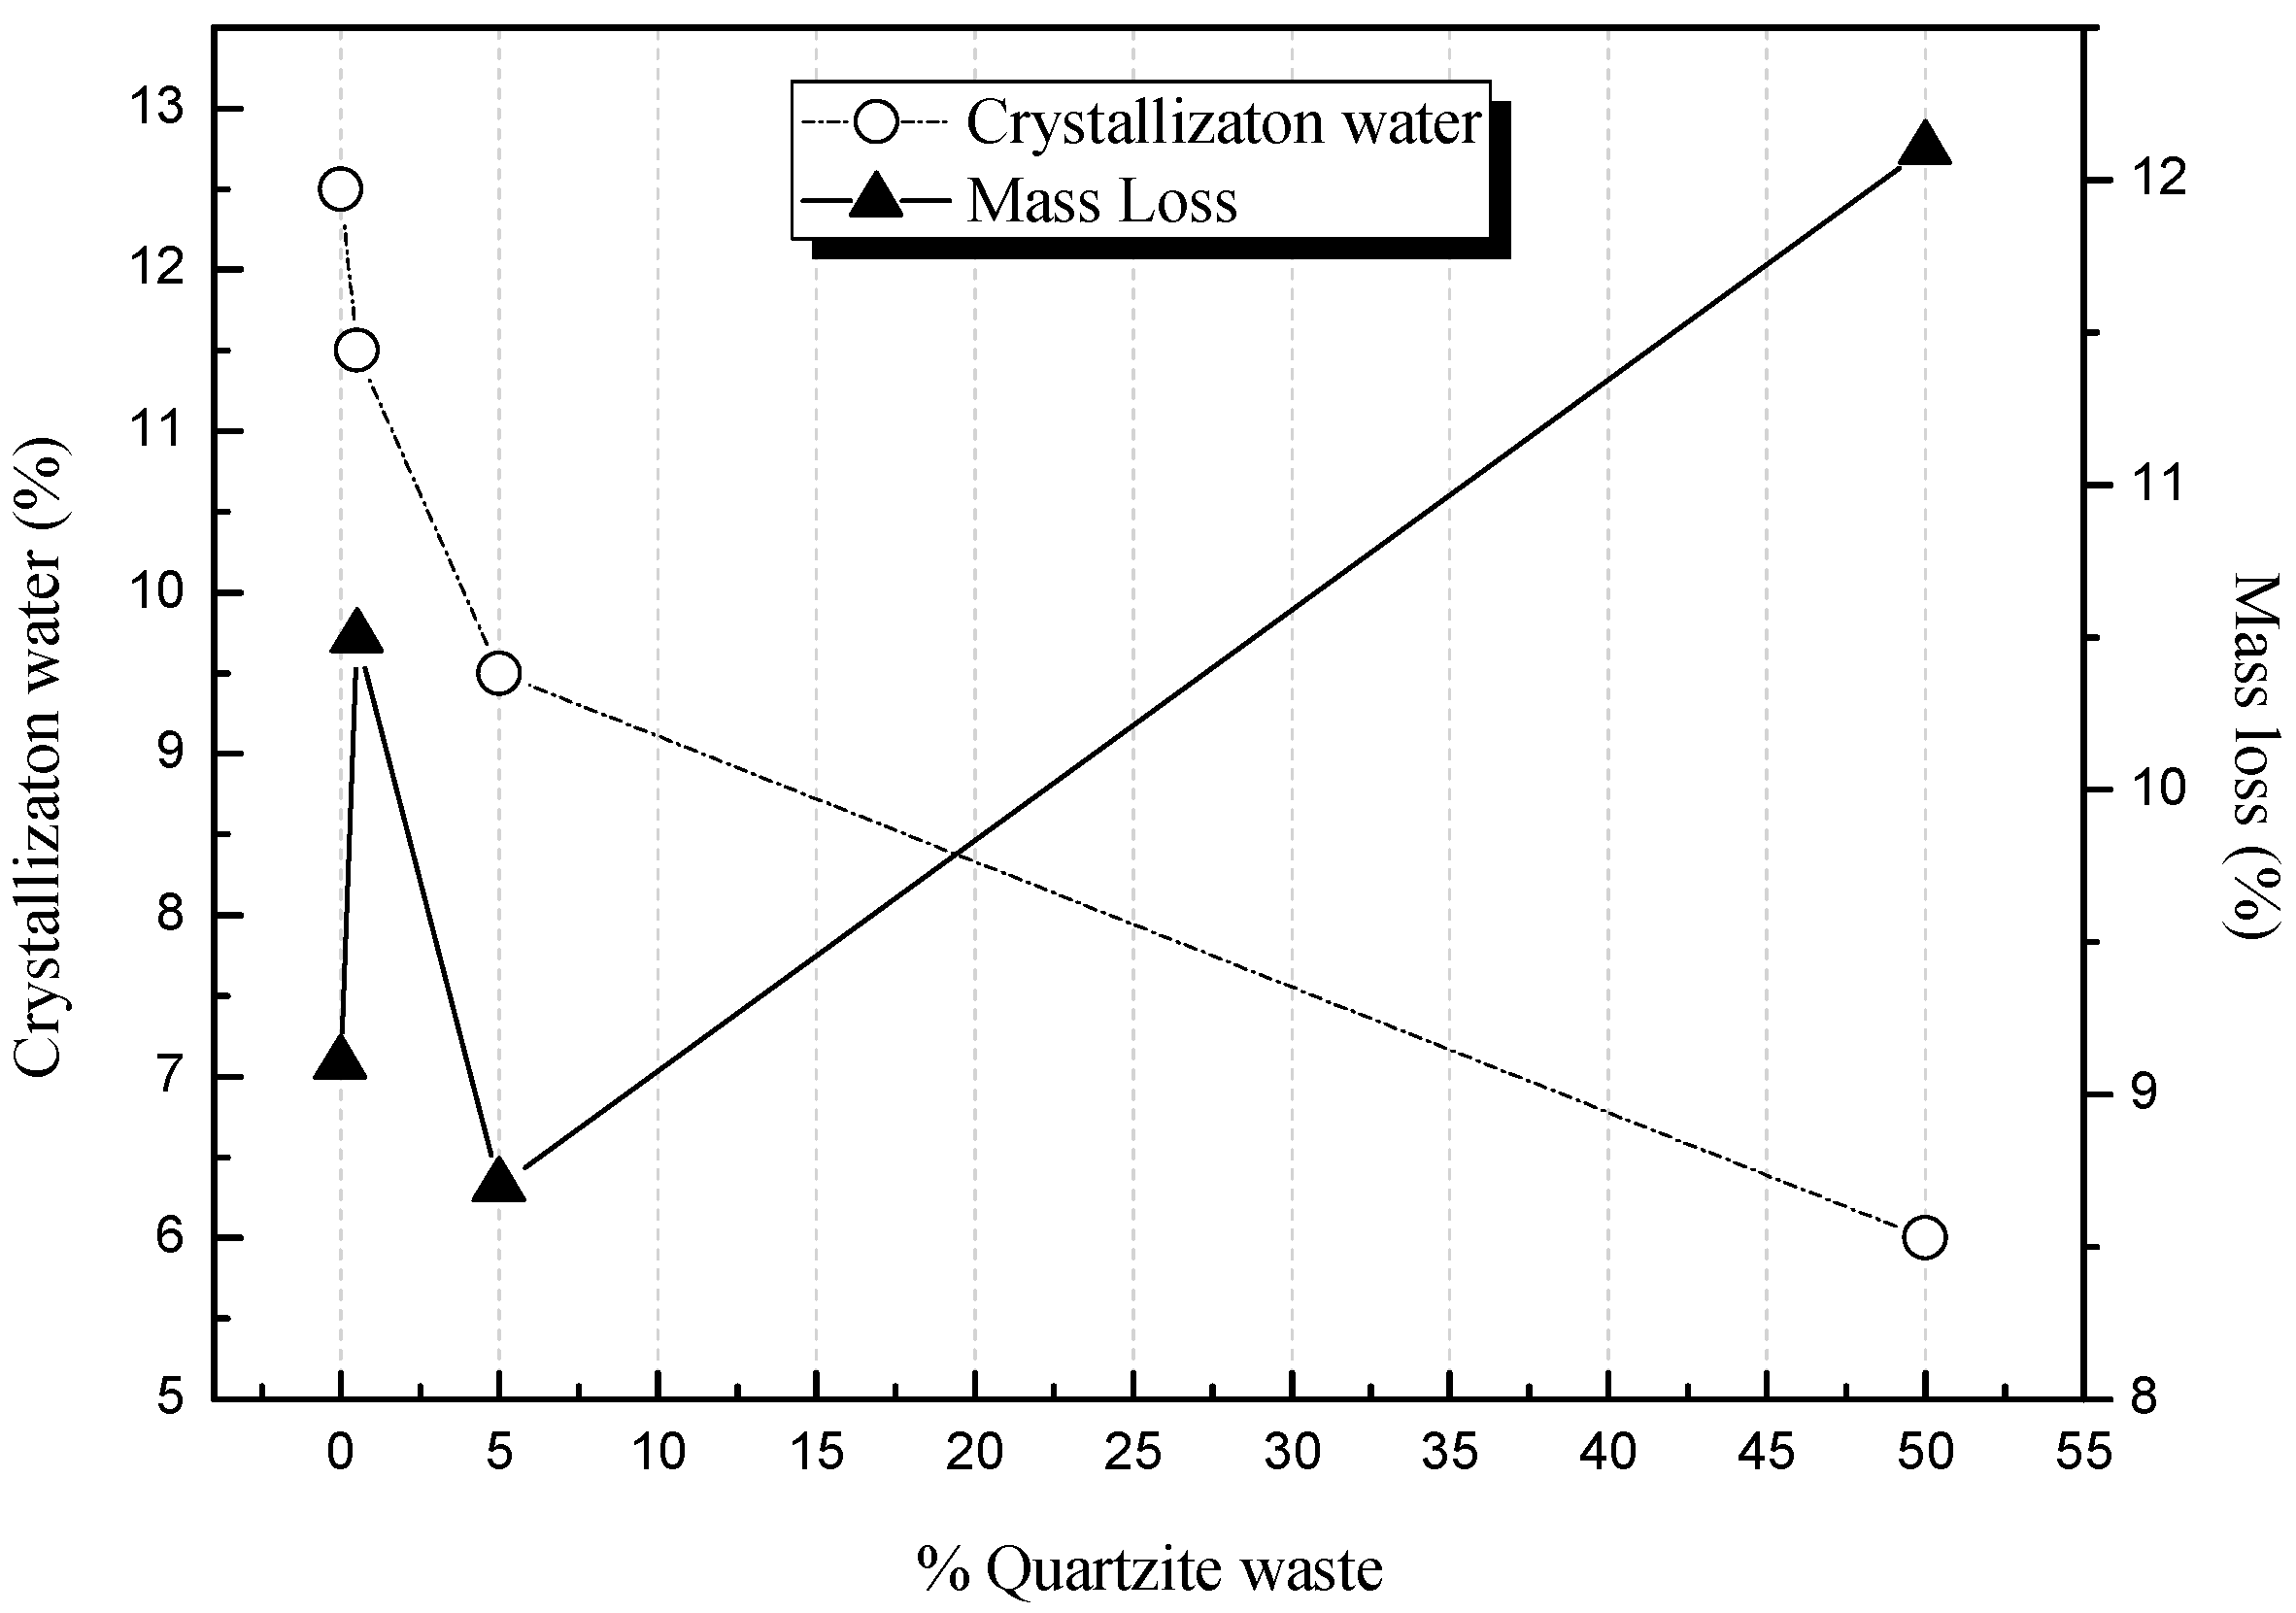
3.4.2. Physical and Chemical Properties

The surface density results were 28.6 kg∙m−2 and 27.5 kg∙m−2 for the reference and MQ-20 specimens, respectively. It was observed that the reference plates had higher surface density values compared to the MQ-20 specimen (~4% higher than MQ-20 specimen). This could be due to the inclusion of EC grains and FW in the matrix; lighter plates are more efficient and lighter coatings reduce the dead weight of the resulting structures [37]. Although EC is a lightweight aggregate, its contribution to density reduction can be limited by its particle size distribution and its interaction with other denser components, such as FW. Additionally, the compaction process during the manufacturing of the plates may decrease the porosity of the EC grains, further minimizing their effect of reducing the overall density.
The average values obtained for the water absorption of the materials are shown in Figure 8. The results indicate a higher water absorption in the MQ-20 plates compared to the reference plates (from 13.5% to 14.7%). This phenomenon could be related to the porous structure of the MQ-20 boards [37]. The results showed no free water loss in the reference plates, while the MQ-20 plates exhibited approximately 1% loss. Therefore, upon recontact with water, due to their hydrophilic nature and high absorption capacity, they became saturated again. These results reinforce the porosity aspect of the MQ-20 specimen that was observed indirectly from its mechanical properties.
The pH values obtained in the test were 8.3 and 8.4 for the reference and MQ-20 specimens, respectively, suggesting that the incorporation of the QW did not affect this property. According to ASTM C1396 [26], these results classify the plates as normal plates (i.e., inside a range between 6.5 and 10.5 pH).

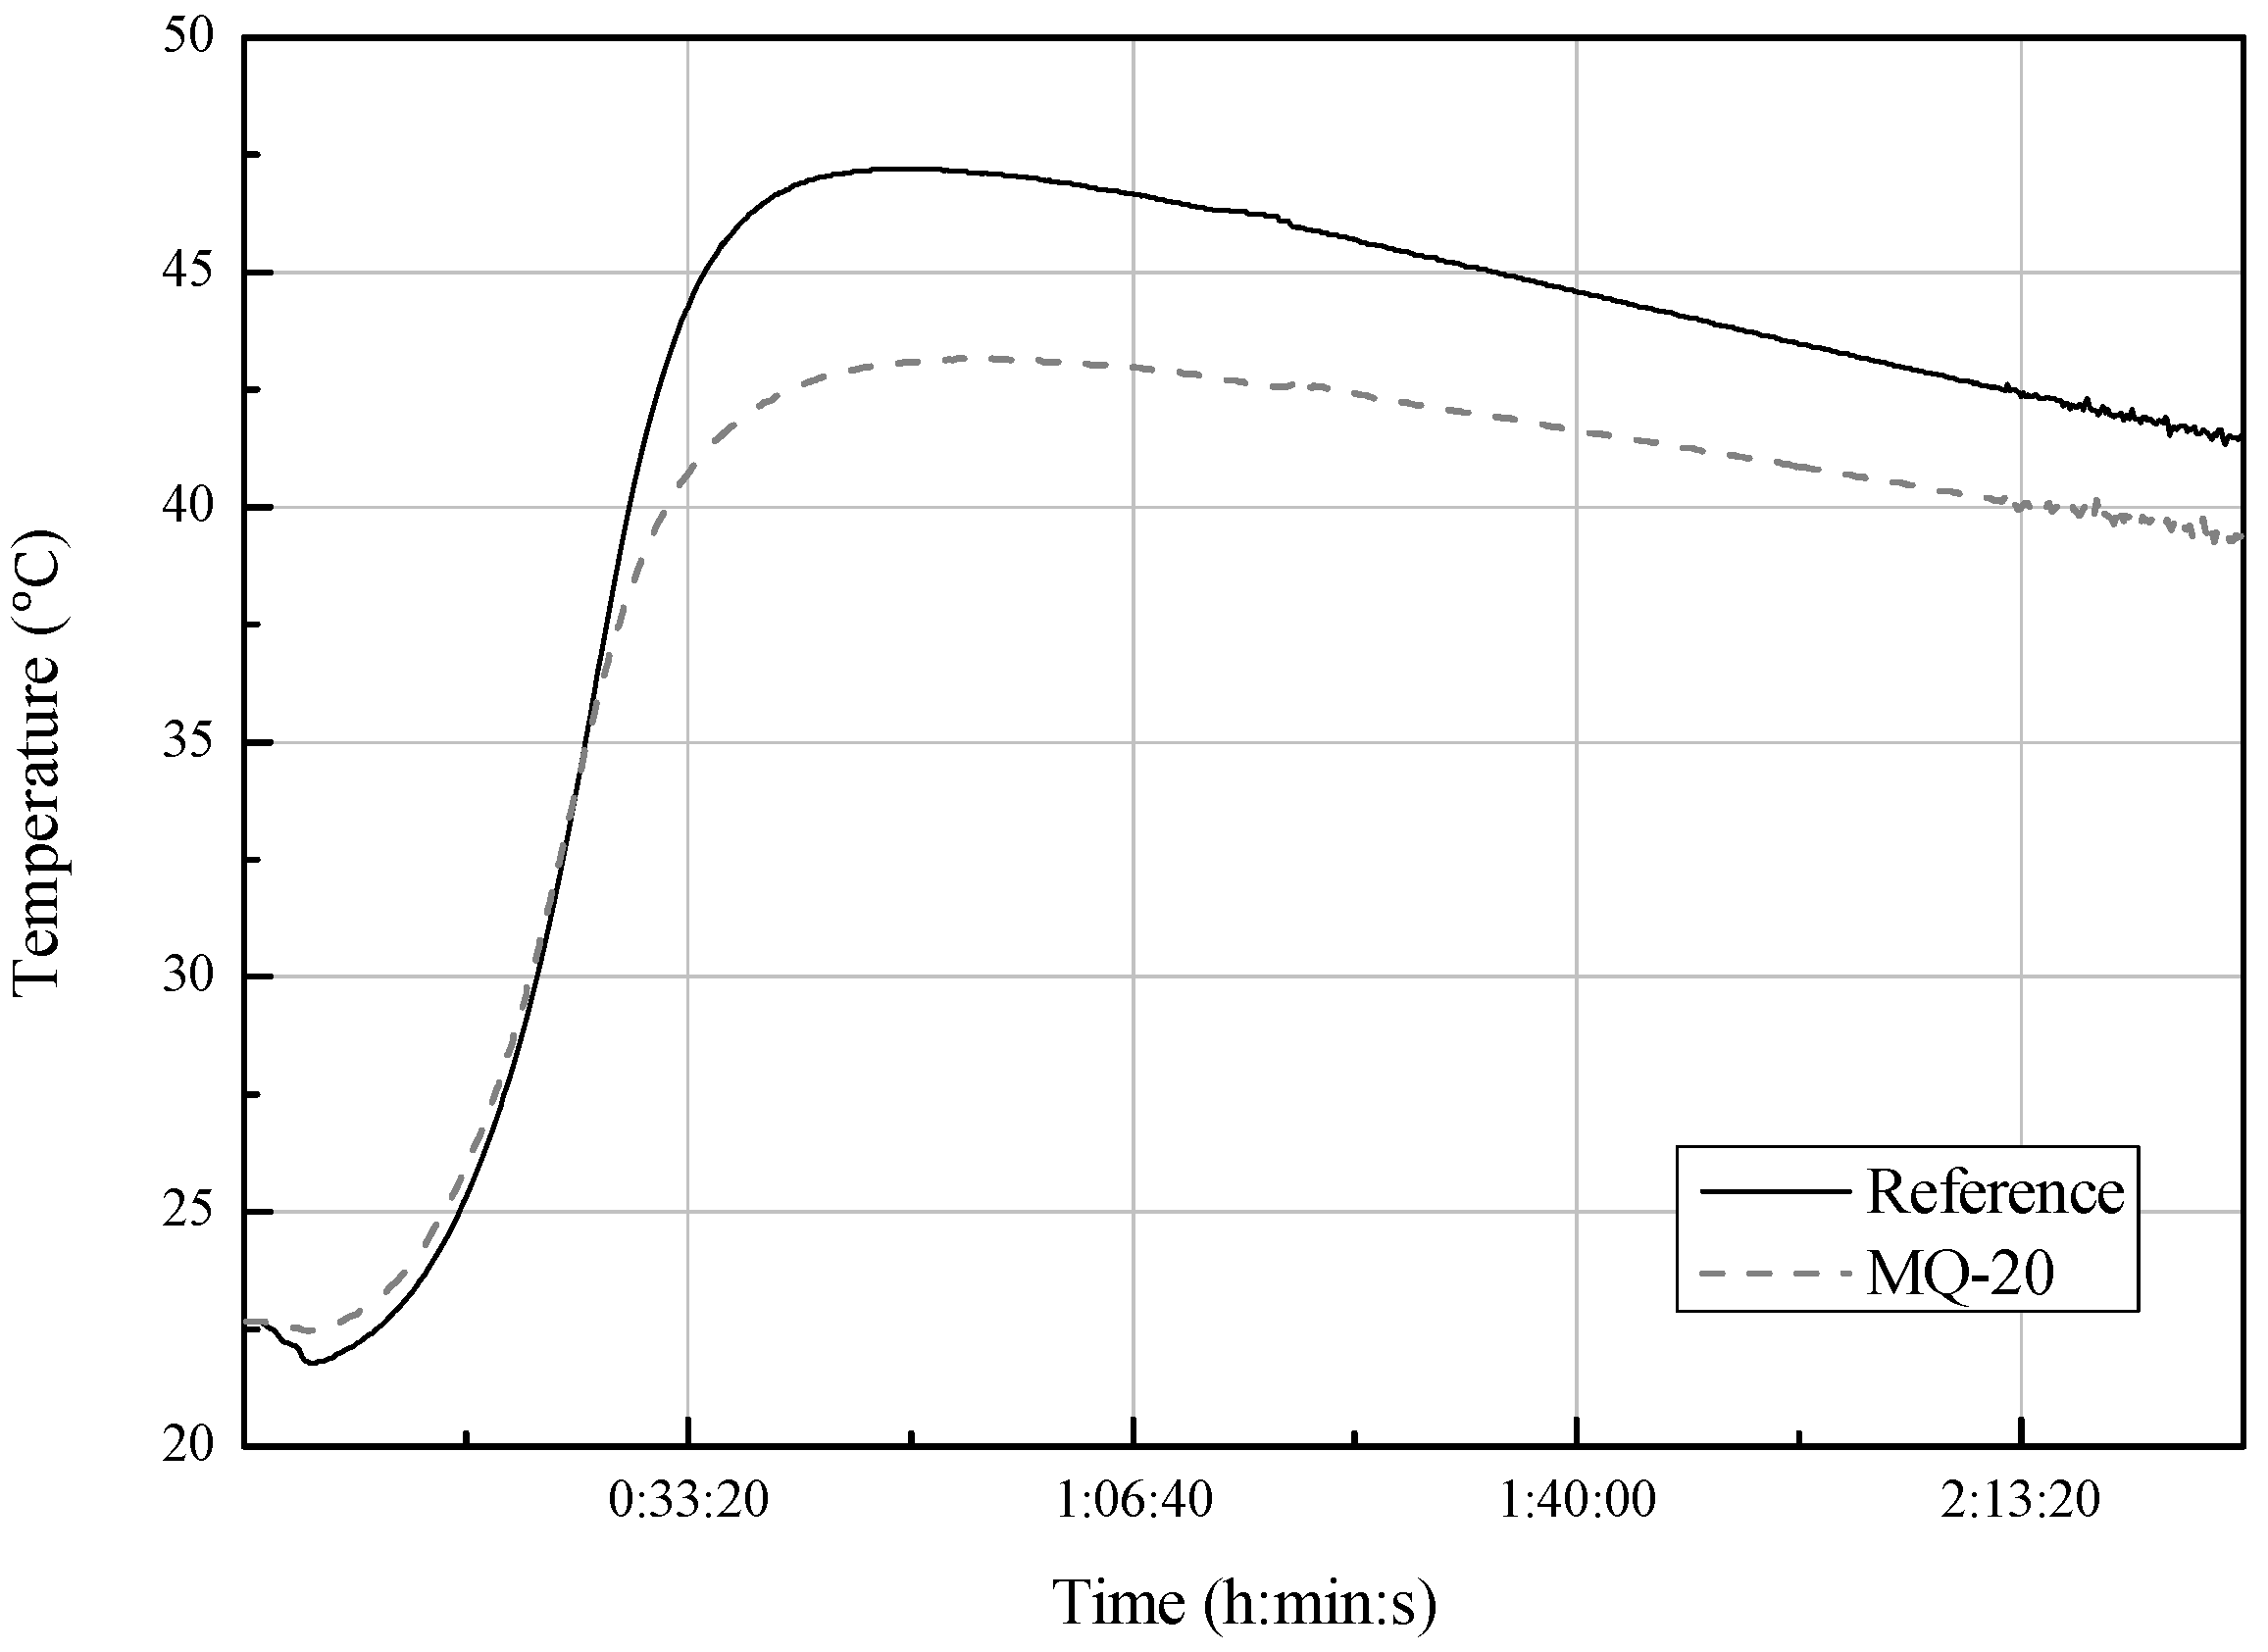
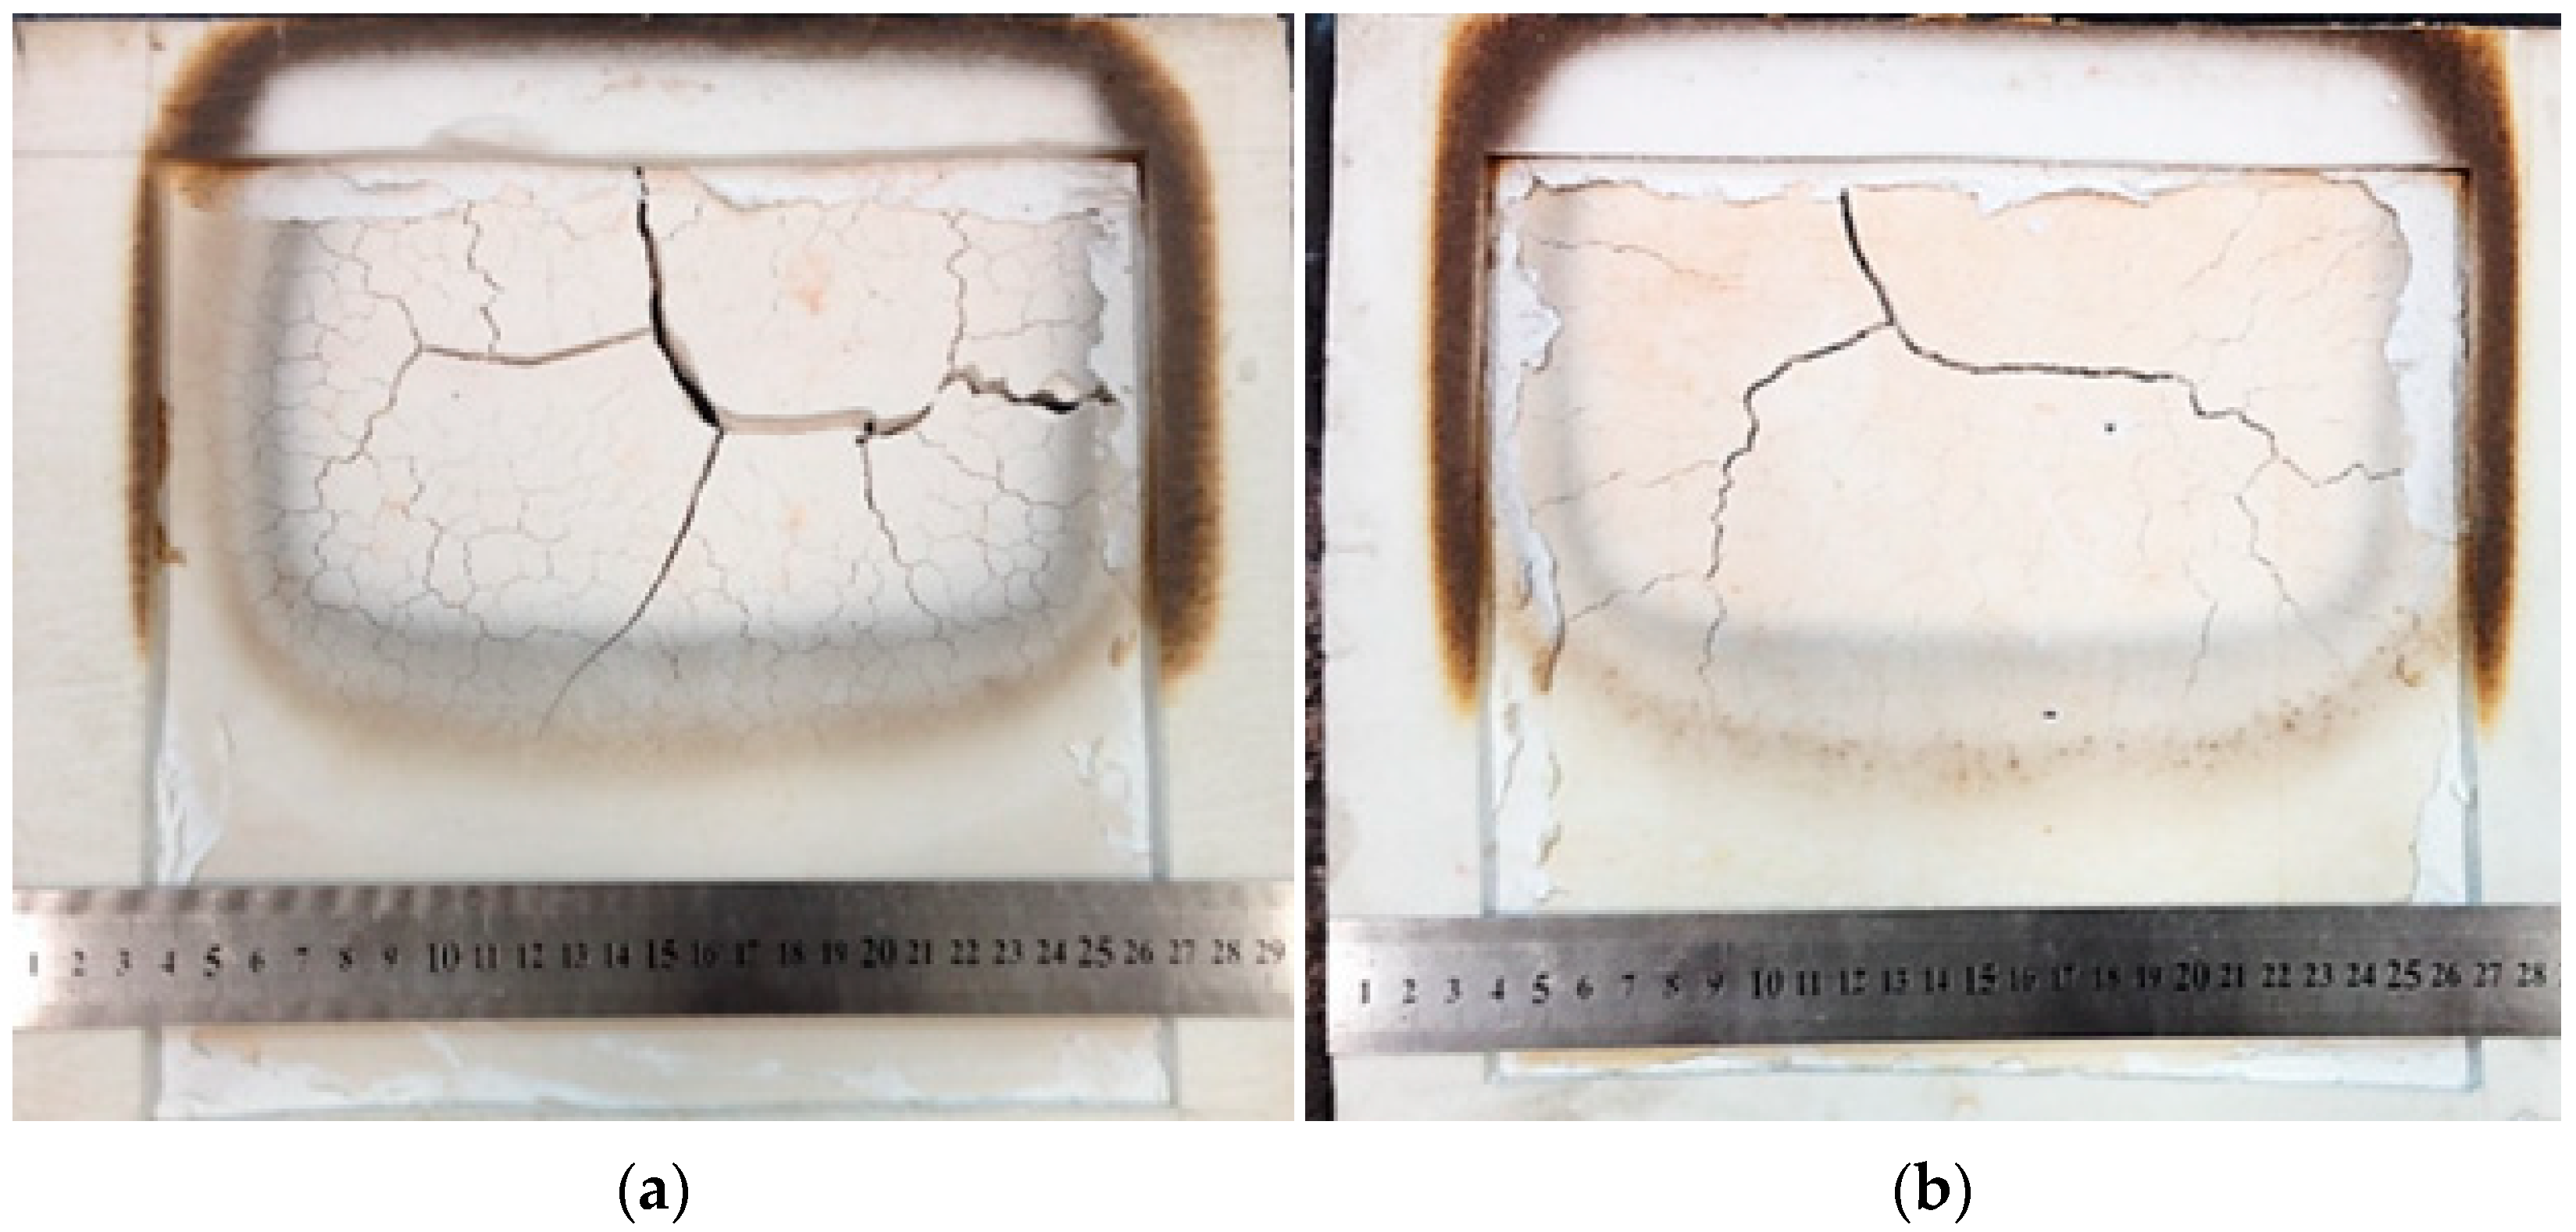
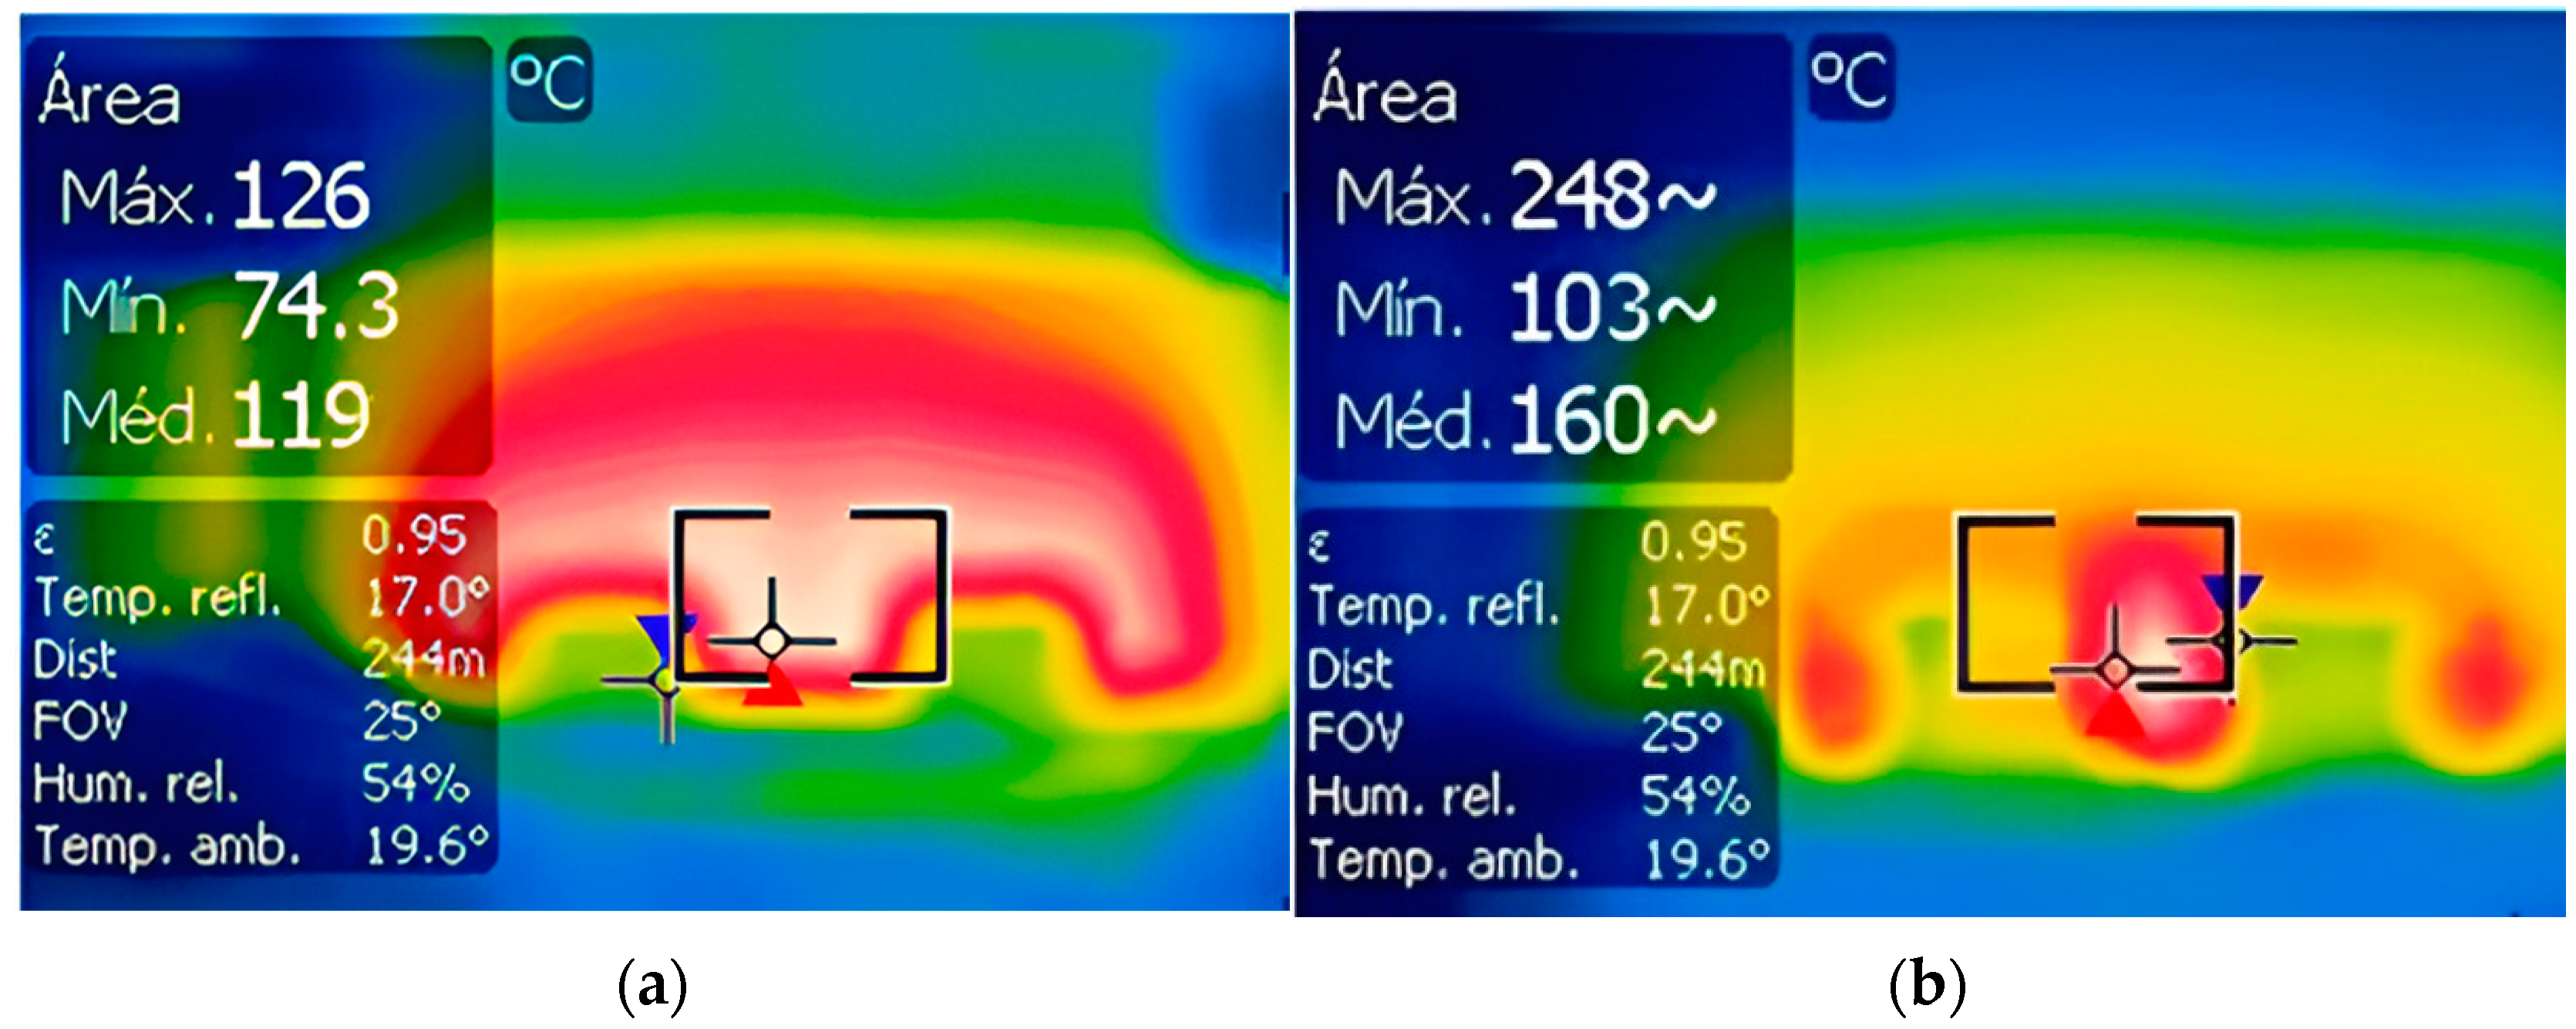
3.4.3. Thermal Properties and Fire Resistance

The thermal properties observed by the TG/DTA are shown in Figure 9. Figure 9a shows the behavior of the reference plate and the mass changes with increasing temperature, which follow the thermal gradient. No free water was detected in the reference sample, and no mass loss occurred around 40 °C. Between 100 and 230 °C, a mass loss associated with the loss of crystallization water in the gypsum was observed, followed by an endothermic peak, leading to the anhydrous III phase [38]. At 375 °C, a characteristic exothermic peak of the hemihydrate was observed due to a modification on the microstructure [39]. A slight shift in the TG curve at 650 °C was associated with the loss of volatile products. Mélinge et al. [40] observed a similar behavior and attributed the event to the mass loss associated with the release of CO2 from CaCO3, which was initially present in gypsum as an impurity. According to Engbrecht et al., [41] between 700 °C and 900 °C, the dissociation of calcium sulfate occurs, forming free CaO.
The behavior of the curves obtained for the MQ-20 specimen are shown in Figure 9b and can be seen to be similar to the reference specimen. A mass loss of approximately 1% was detected at 40 °C, indicating the release of free water. The curve peaks at 100 °C and 300 °C were associated with the loss of free water and a phase transition from the anhydrous III to the anhydrous II phase, respectively [40]. According to Kappert et al. [42], silica undergoes small mass losses without detectable steps up to 1000 °C. Jafari et al. [43] point out that mullite, a ceramic structure composed of alumina and silica, can be formed by thermal decomposition at temperatures close to 1000 °C. In the present study, the DTA curve shows a significant endothermic event in this temperature range, suggesting the formation of mullite. However, confirmation of these crystalline phases requires further analysis, such as X-ray diffraction (XRD), for precise structural identification.
The results obtained for the thermal conductivity were 0.58 W/(m∙K) and 0.54 W/(m∙K) for the reference and MQ-20 plates, respectively. The thermal conductivity of materials is influenced by the moisture content that moves through them [44]. Furthermore, the low bulk-specific gravity of EC tends to reduce the thermal conductivity of the samples, while the high bulk-specific gravity of QW tends to increase the thermal conductivity of the samples. On the other hand, the porosity of the boards also directly affects the thermal conductivity, as suggested by the water absorption—an indirect way to observe the porosity of a material. The fact that the MQ-20 plates have lower values supports the idea that the FW and EC provide an insulating effect. In addition, the obtained conductivity values are in good agreement with those observed for gypsum plates in the literature (from 0.15 W/(m∙K) to 0.51 W/(m∙K)) [45].
The curves representing the behavior of the reference and MQ-20 plates during simulated fire heating are shown in Figure 10. It was observed that the ambient temperature in both tests was practically overlapping, with an average of 25.6 °C during the reference plate test and 27.6 °C during the MQ-20 plate test. The internal temperature of the furnace follows the trend of the curve regulated by ISO 834-1 [46] and ASTM E119 [30] in both cases. In the MQ-20 test, it was observed that, from the start until approximately 240.0 °C, the heating is slightly slower; subsequently, the trend reverses, reaching 926.0 °C in 57 min, while the reference test took 62 min. When analyzing the curves for the temperatures of the faces of the plates oriented towards the inside of the furnace (red line), it was seen that, in both tests, the heating curve trend behaves similarly to that of the furnace. Regarding the external faces of the plates, oriented towards the environment and represented by the green line, the reference plate remained at approximately 100 °C due to the evaporation plateau. The MQ-20 plate followed the same pattern until 45 min, which marks its fire resistance, withstanding an exposure temperature of approximately 817.0 °C.
The reference and MQ-20 specimens after the fire-resistance test are shown in Figure 11. Both exhibited cracks in the primary and secondary directions; however, the MQ-20 specimen displayed fewer cracks and less darkening in the regions around the furnace opening, resulting in a much less degraded appearance. This is attributed to the reduced gypsum content in the matrix (generating water loss from the hemihydrate), as the increased levels of silica and alumina oxides change the behavior of the matrix (nucleation) and thus improve the fire resistance of the plates. These results confirm that the addition of QW positively improved the matrix stability while the FW reinforcement bridged the cracks.
The incorporation of FW contributed to the fire resistance of the composite panels. As a silica-based material, FW withstands high temperatures and helps delay crack propagation by bridging microcracks during thermal exposure [47] Additionally, FW improves the thermal insulation of the material by increasing its porosity and reducing its thermal conductivity [48]. The lower surface degradation and reduced cracking observed in the MQ-20 specimen (Figure 11) show that FW enhances the composite’s stability under fire conditions.
The heat distribution in the plates at the end of the tests is shown in Figure 12. The temperatures reached in the MQ-20 specimen were higher than those of the reference plate, with the MQ-20 specimen reaching a maximum temperature of 248 °C and the reference reaching 126 °C. The heat distribution across the area of the plates is also visible, being represented by more reddish tones. Although the reference specimen exhibits lower temperatures compared to the composite, the area where heat is distributed is larger; this could be due to the higher thermal conductivity of gypsum (reference) allowing the heat to dissipate more quickly over a large surface area [49].

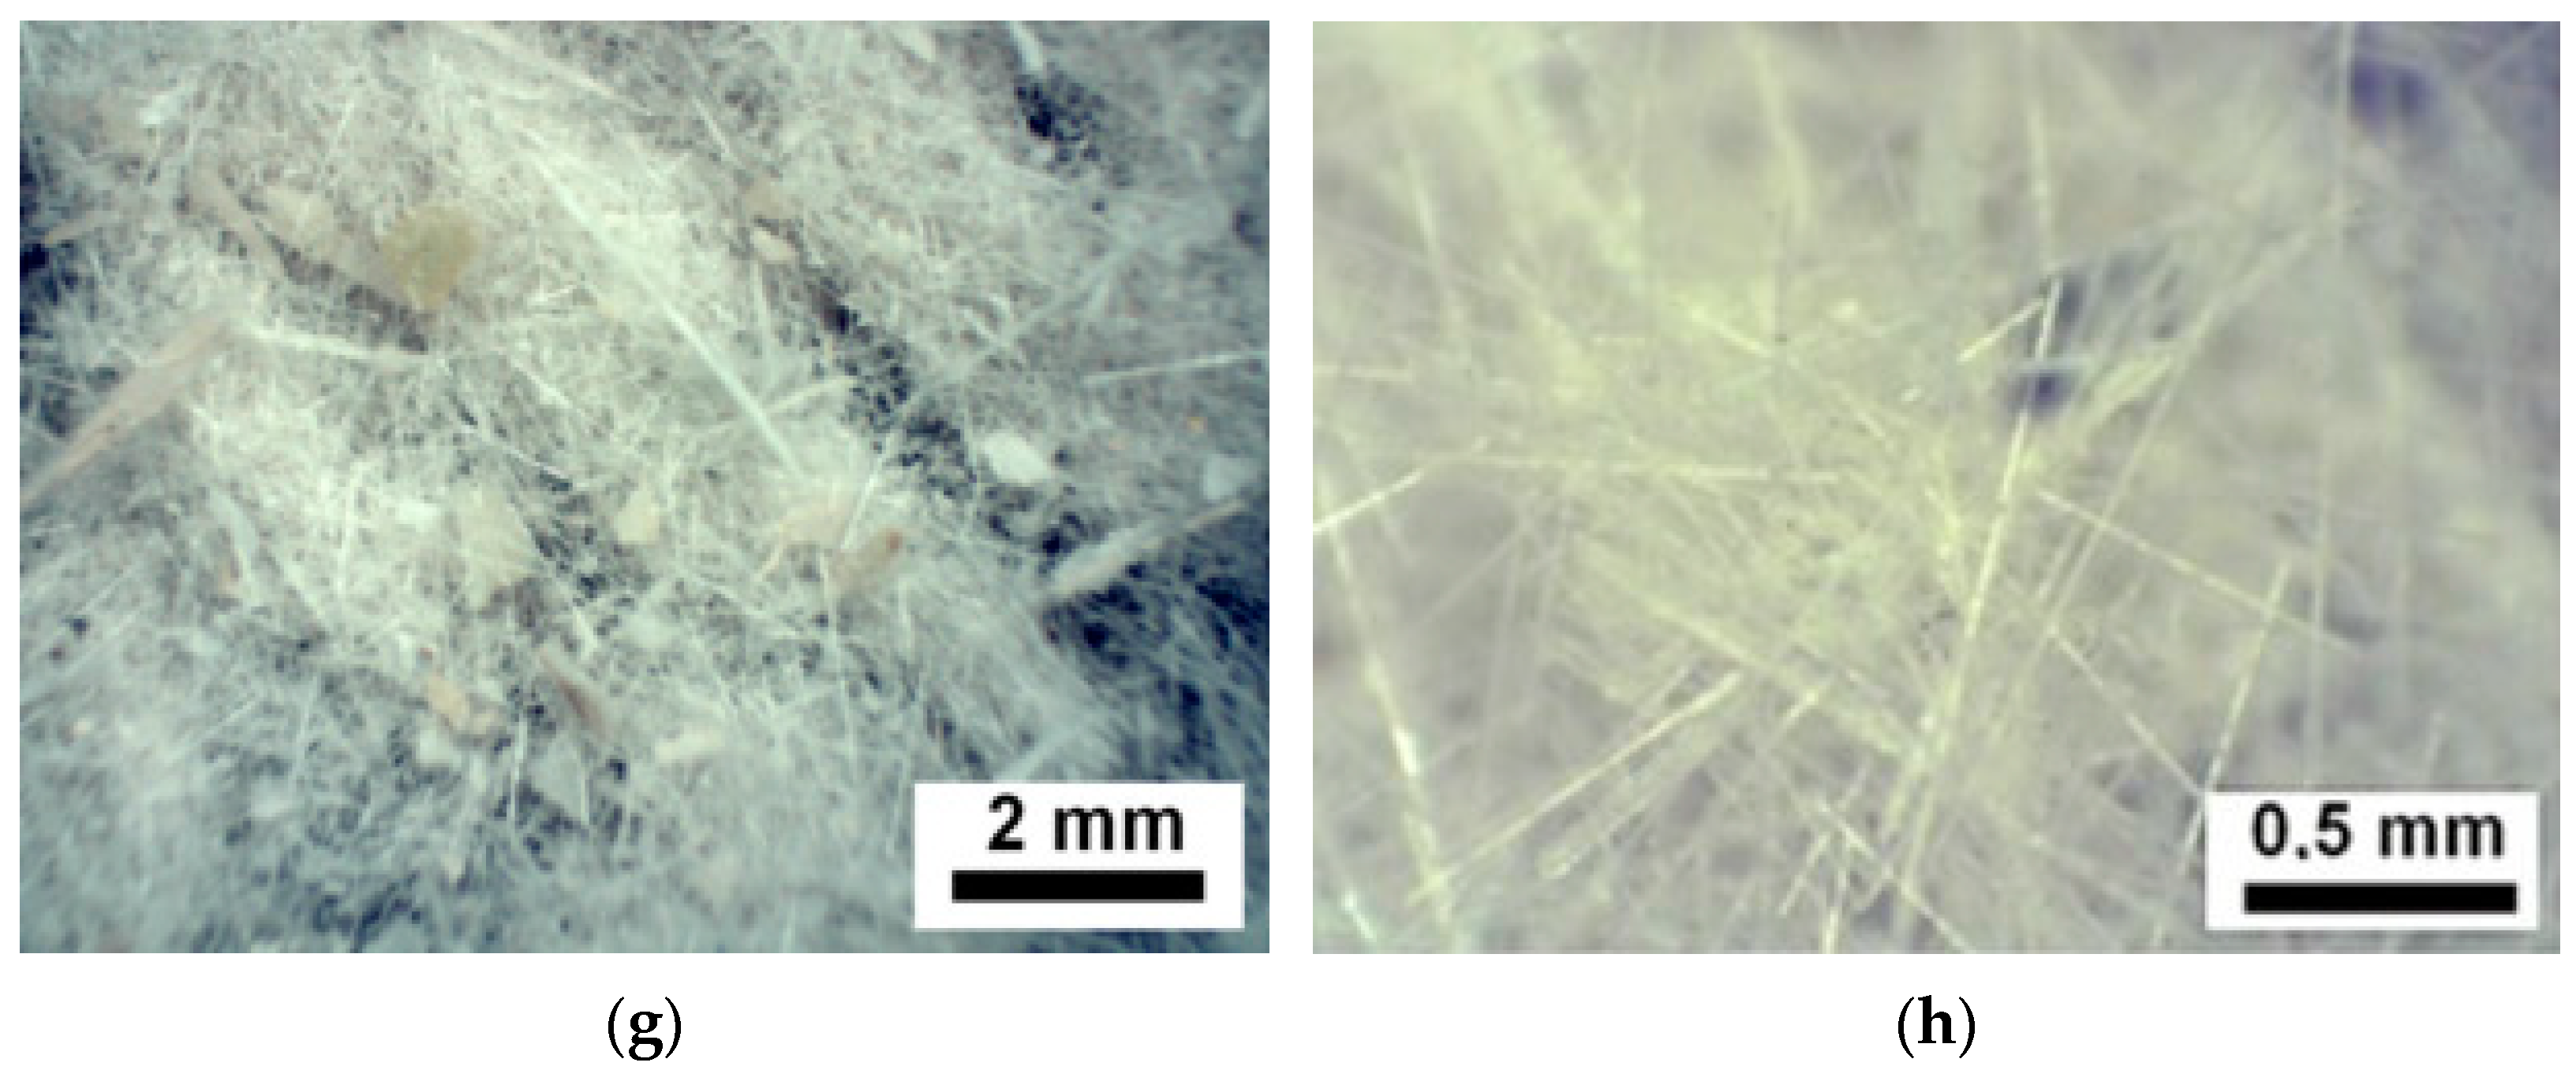
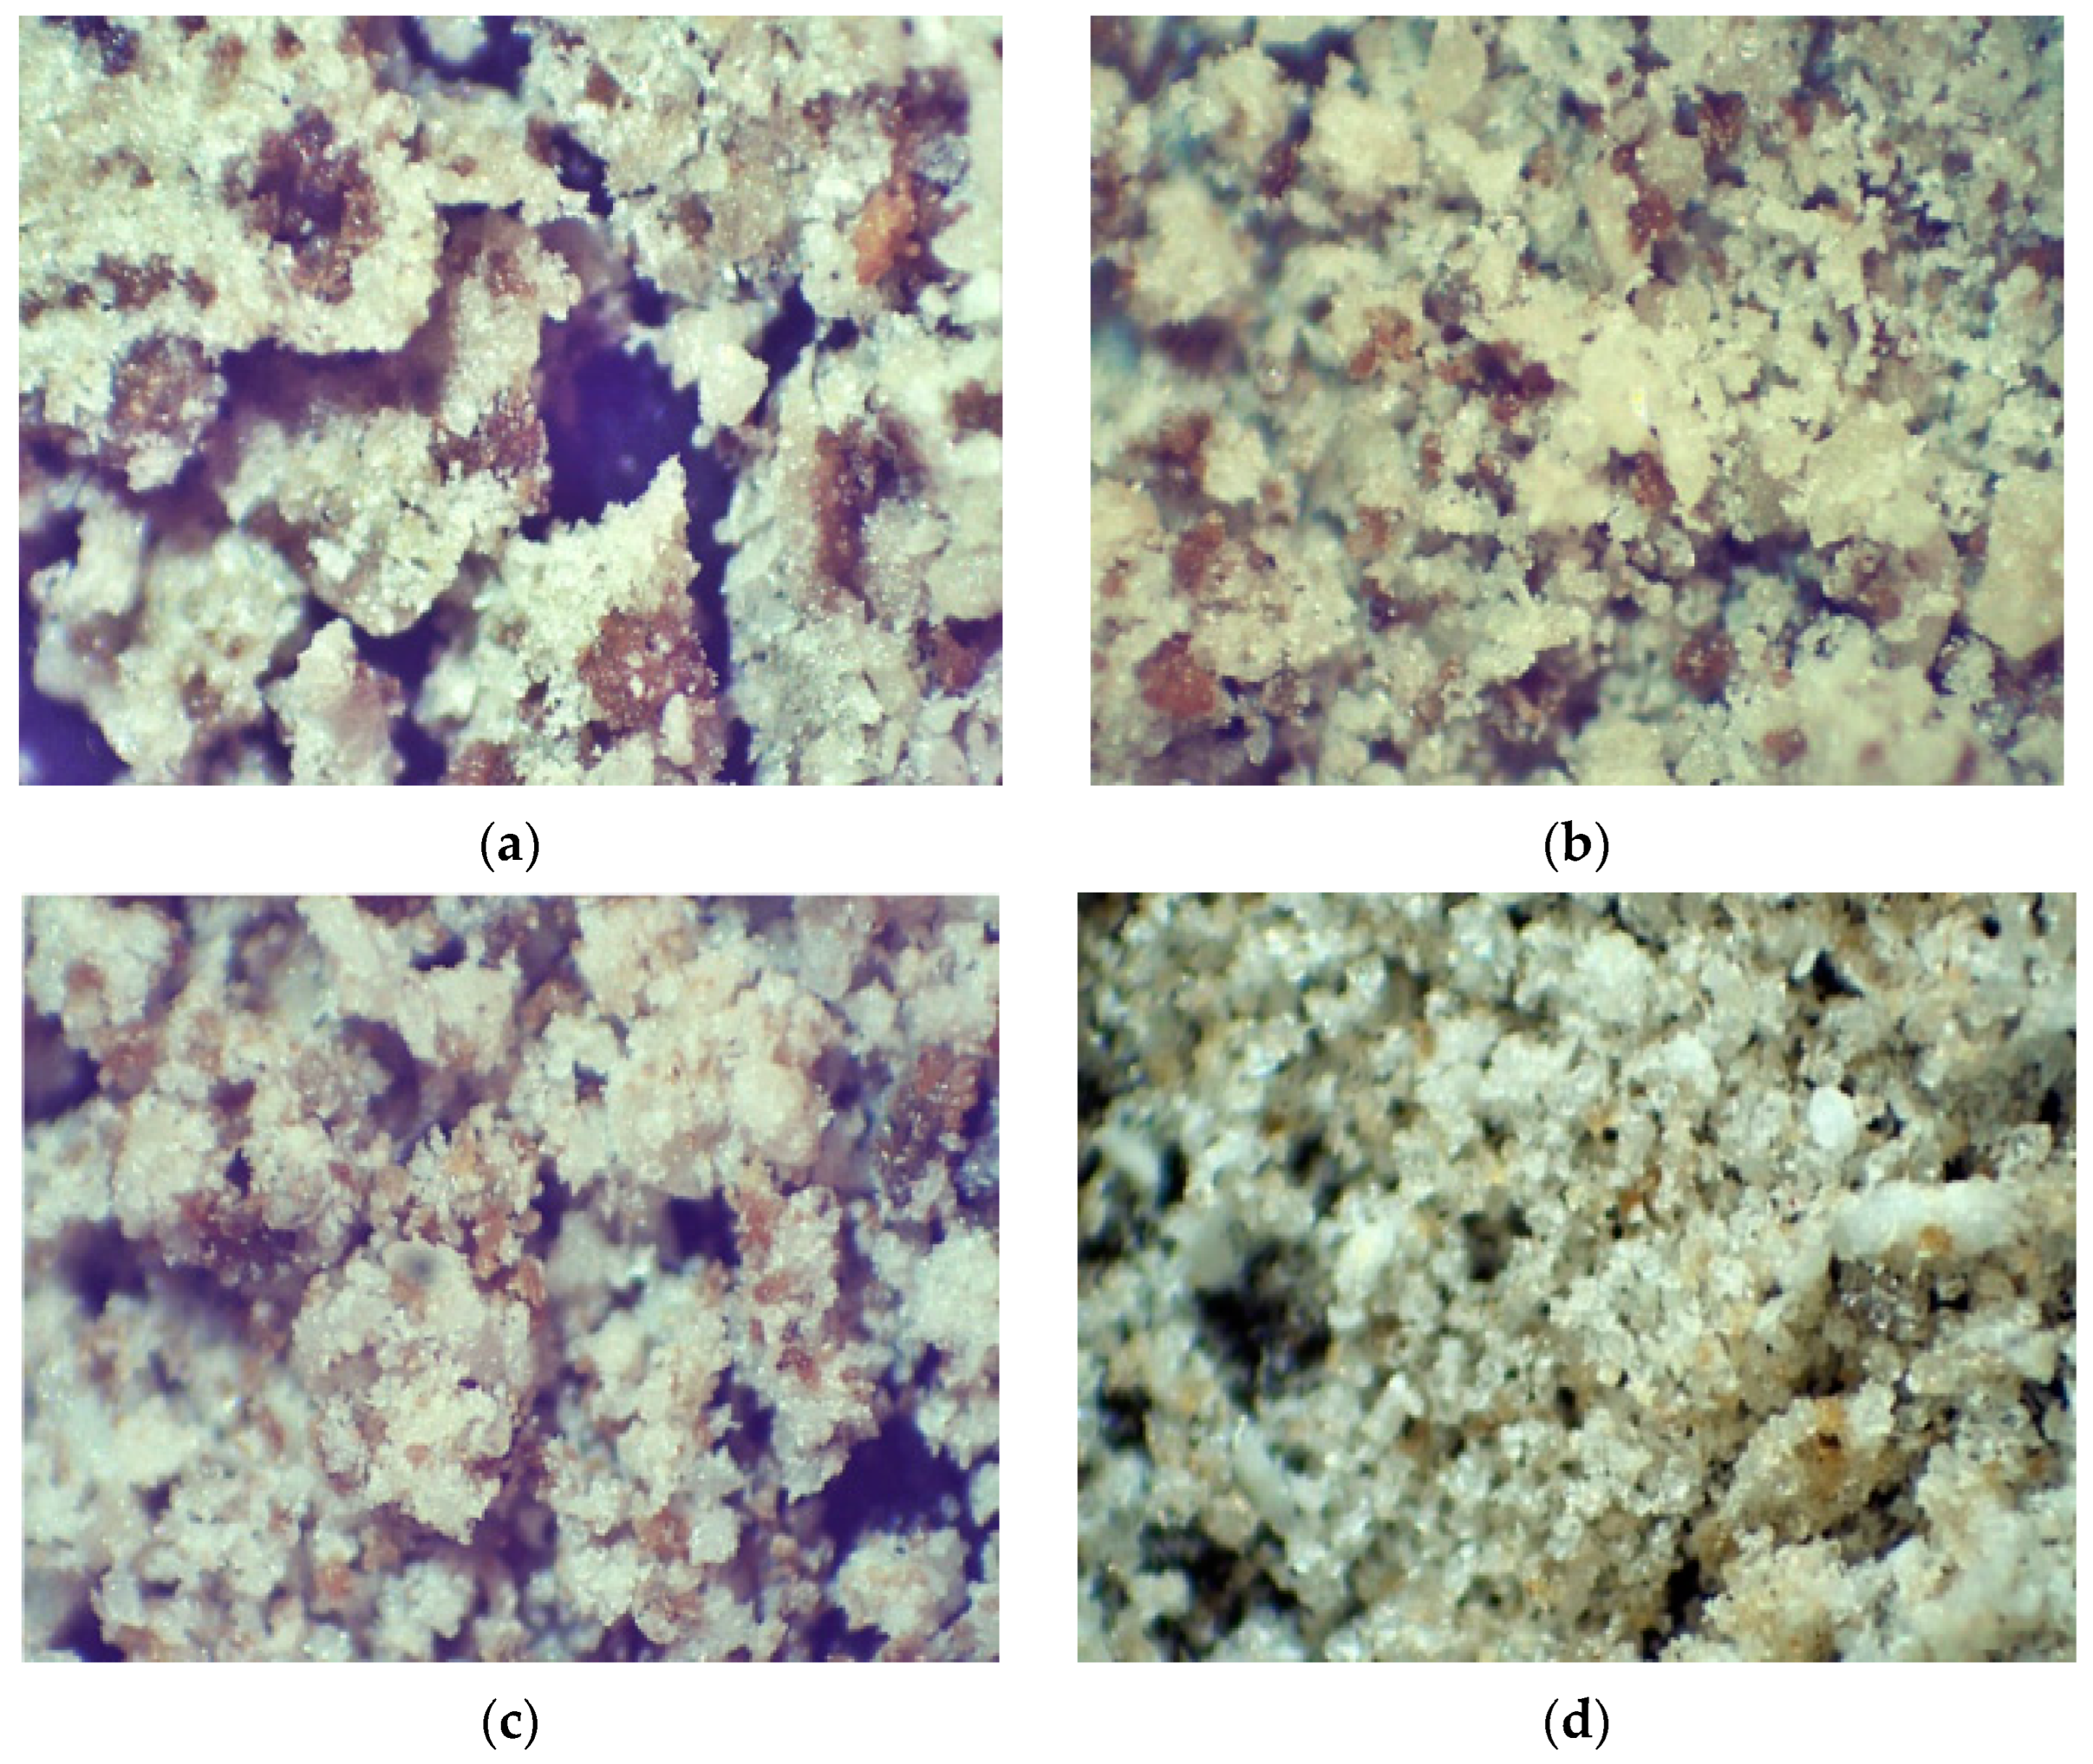
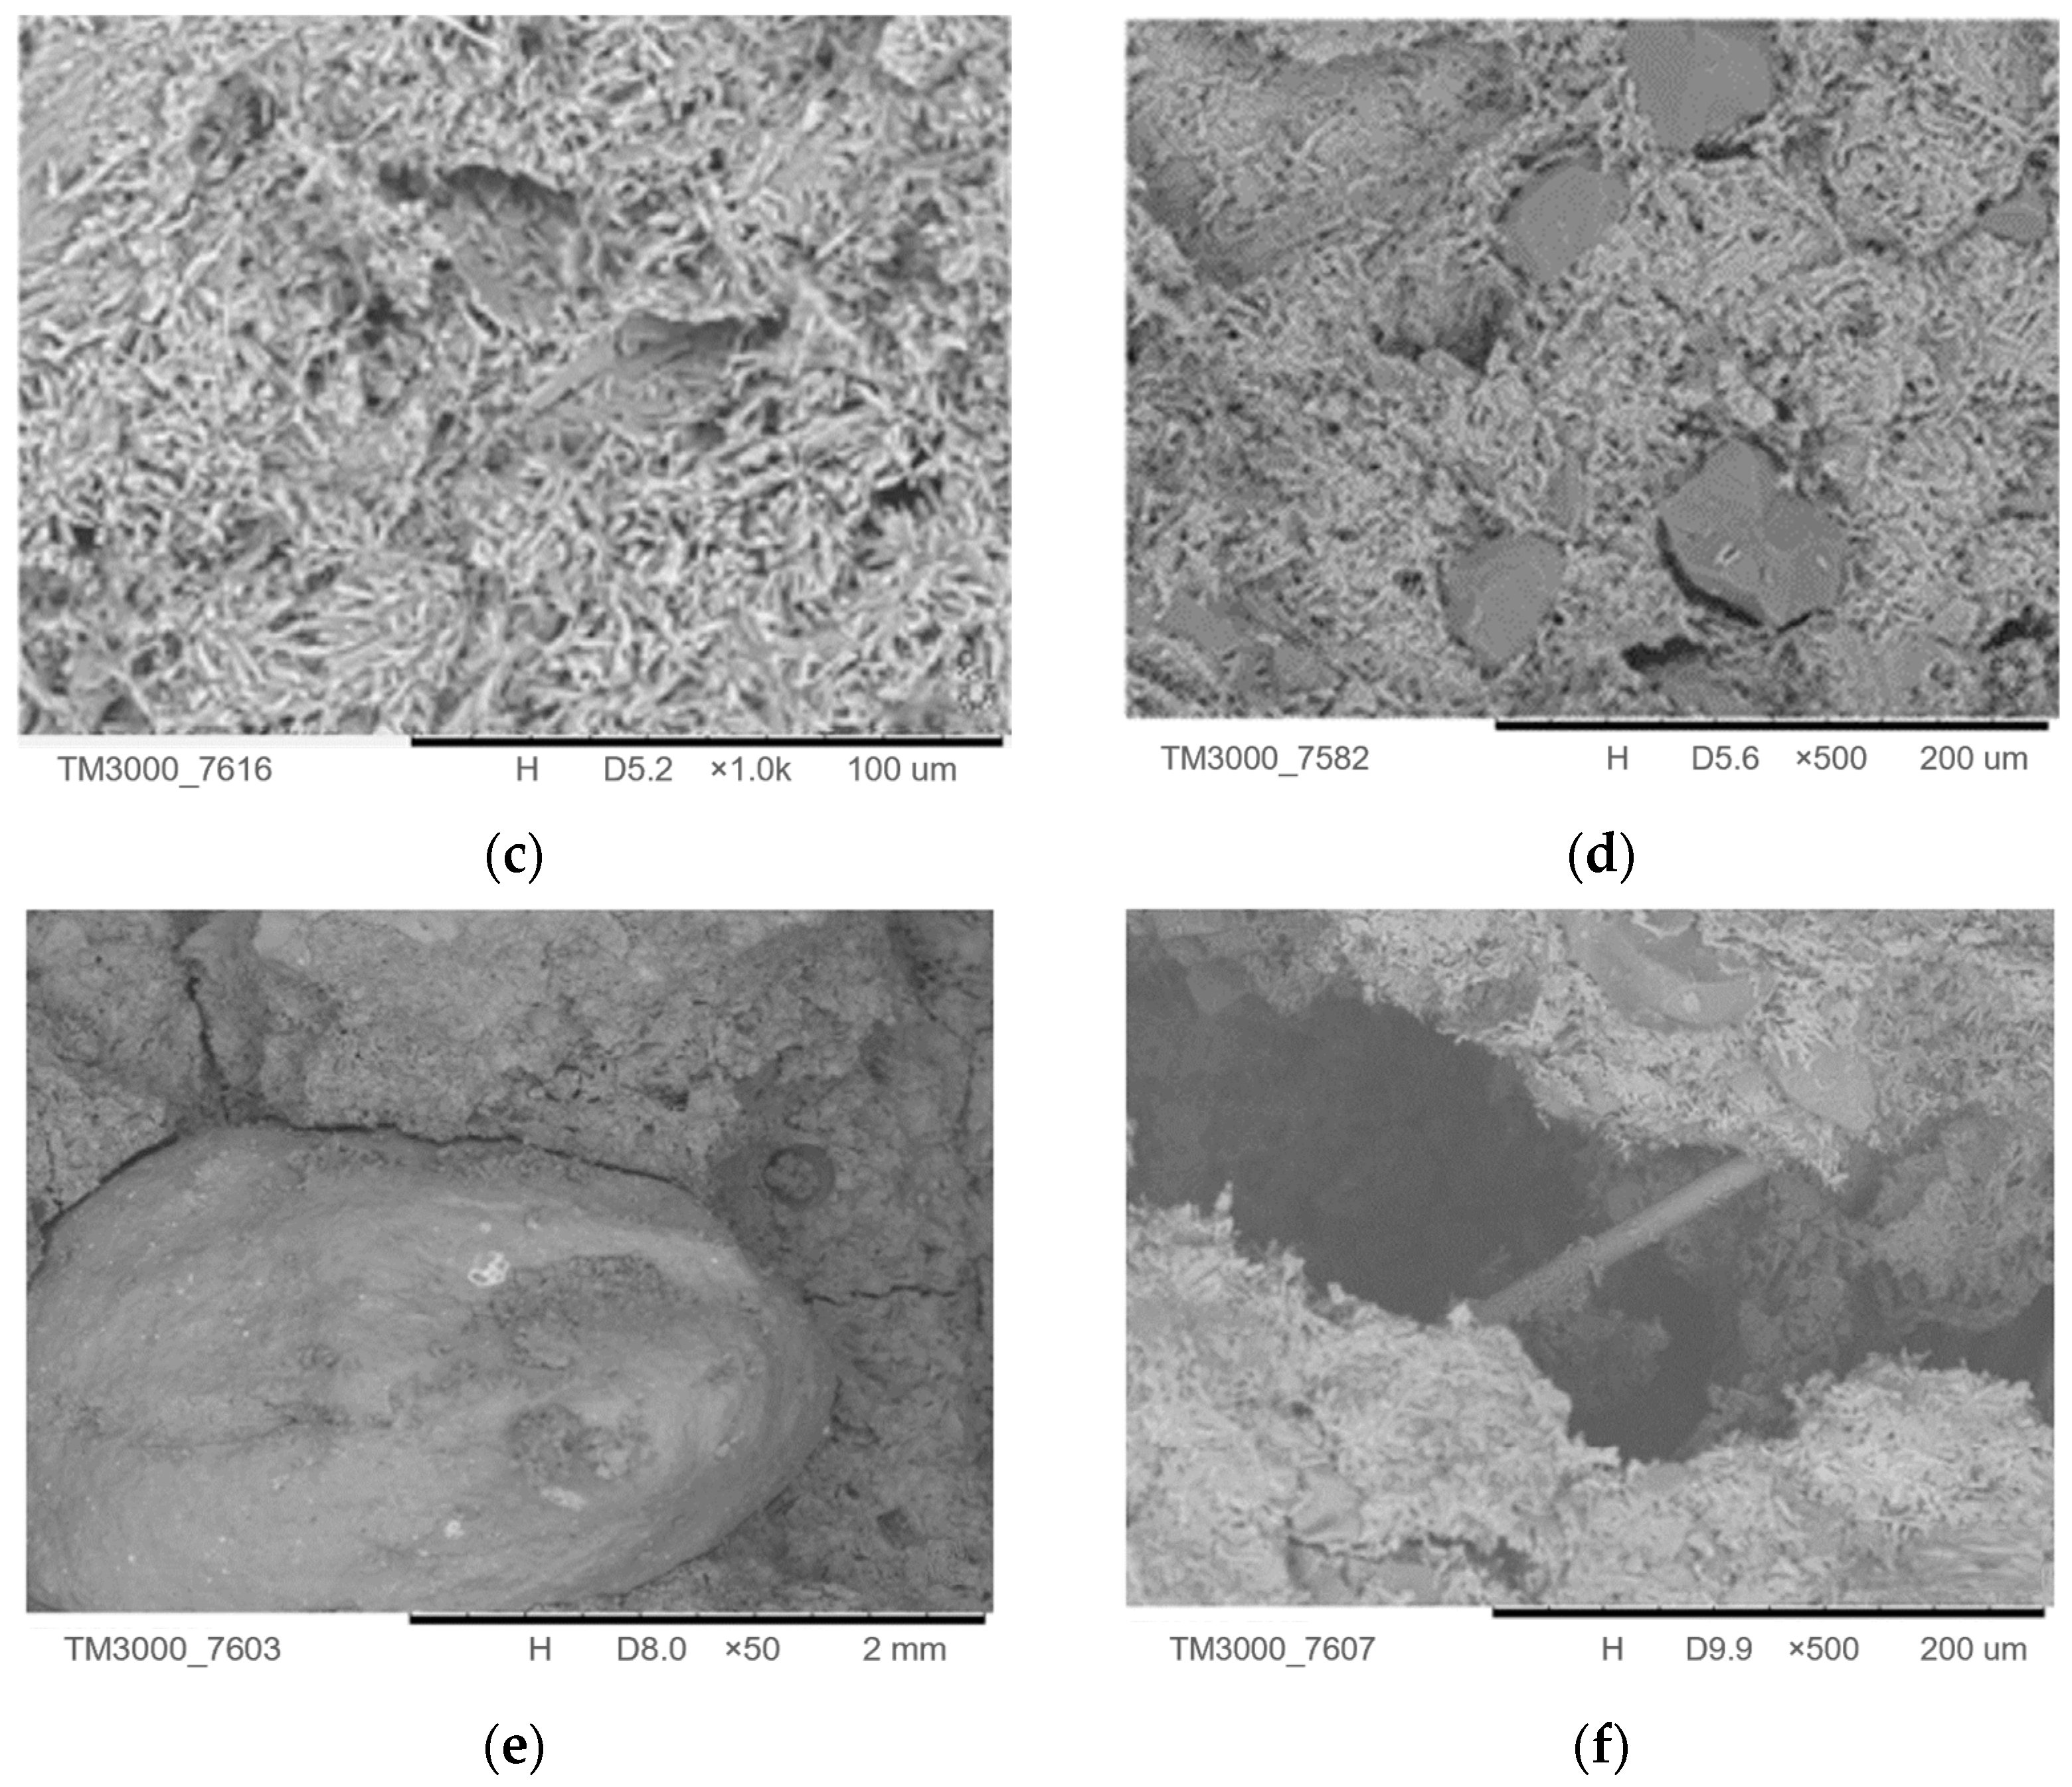
3.4.4. Microstructure

The following images obtained by SEM of the specimens before and after heating are presented to evaluate the changes in their matrix structures (see Figure 13). Figure 13a,b show the crystals formed during the hydration process, some small common pores, and no changes in the microstructure after heating. Figure 13c shows the MQ-20 specimen, highlighting the interface between the EC grains and the gypsum crystals. Figure 13d shows quartz grains among the gypsum crystals, which are still well-adhered to each other.
A study conducted by Javangula et al. [38] indicates that the addition of FW and EC increases the resistance of the plates to high temperatures. However, the compositions of the EC can vary, and the addition of this component did not result in significant improvements in high-temperature resistance. As seen in Figure 13e, volumetric variation was observed in the EC grains, leading to widespread cracking in the matrices. Despite this, the failure of the specimens was not severe, possibly due to the presence of the FW, which provided greater stability to the matrices (Figure 13f), characterized by their hydrophilic properties [50,51].

4. Conclusions

This study presents an experimental design for the development of a lightweight, fire-resistant composite gypsum board incorporating quartz waste as a gypsum replacement, fiberglass waste as reinforcement, and expanded clay as a lightweight aggregate. Compared to conventional gypsum-only panels, the panels developed in this study offer a more environmentally sustainable alternative. The obtained composite panels exhibit properties that are comparable to those of typical commercial products. The conclusions of this study can be summarized as follows:
(a)
The experimental design to determine the optimal dosage indicated that a 20% quartz waste content, as a replacement for commercial gypsum, is suitable. This dosage was selected based on the criteria of the (i) quartz waste consumption, (ii) free water loss, and (iii) crystallization water;
(b)
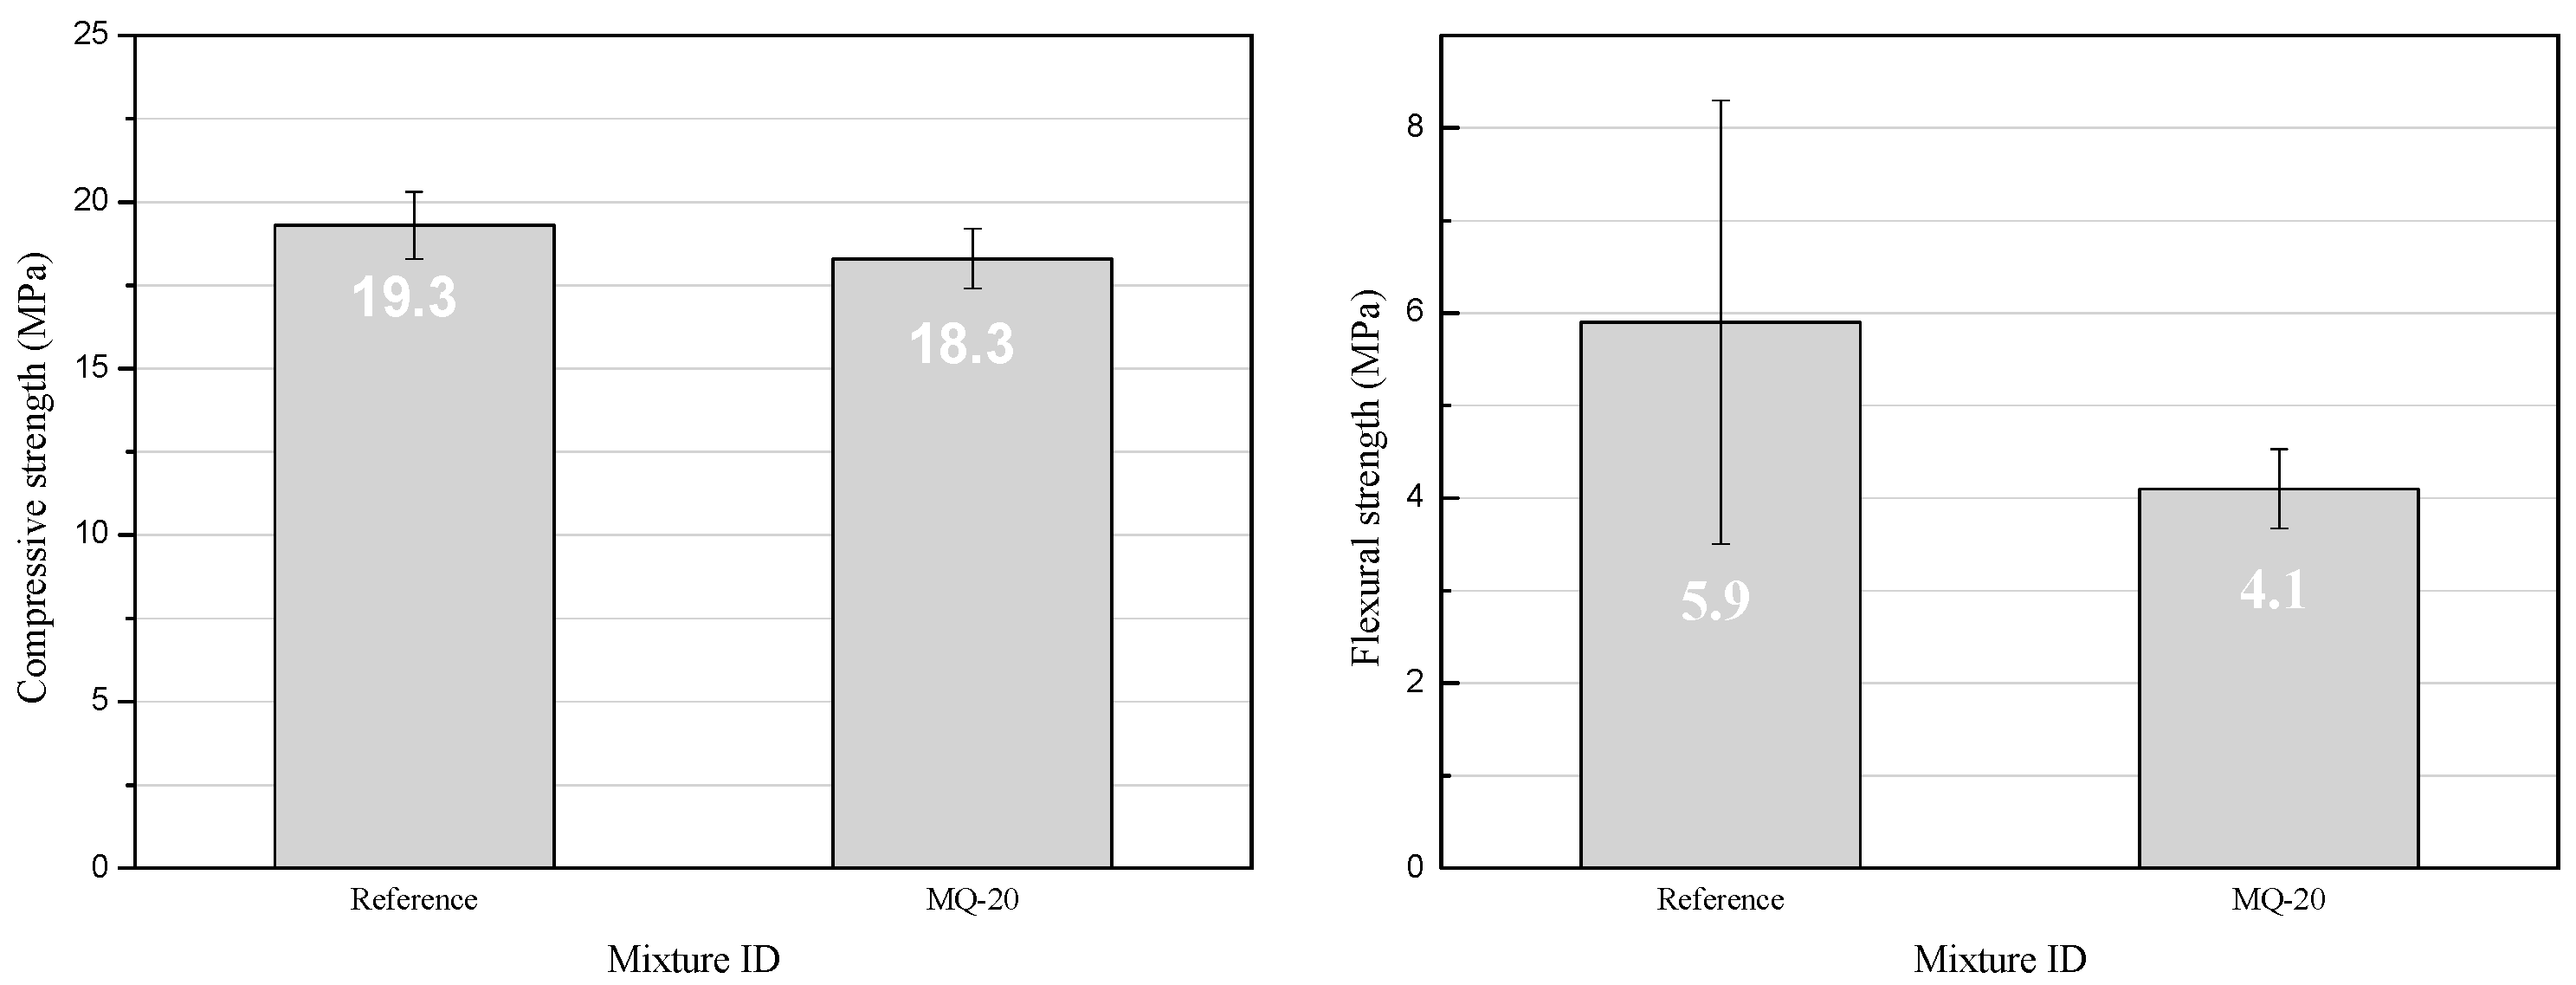
The MQ-20 specimens exhibited lower flexural and compressive strength values (a reduction of up to ~30% in flexural strength). Nevertheless, the obtained results remain above the standard requirements for gypsum boards, and the fracture behavior underwent a transformation due to the addition of fiberglass waste;
(c)
The thermal conductivity of the MQ-20 specimens was slightly lower than that of the reference specimens (from 0.58 to 0.54 W/(m·K)). The use of quartz and fiberglass waste significantly reduced the size and number of cracks developed in the boards during the fire test. This can be attributed to the increased porosity of the board and the presence of fiber particles, which help mitigate the crack propagation caused by the deterioration of gypsum crystals.
In summary, the key findings indicate that the developed panels achieve a balance between sustainability and mechanical and thermal performance, meeting standard requirements while exhibiting improved fire resistance. The incorporation of quartz and fiberglass waste enhances the functional properties of the material, reduces its environmental impact, and offers a viable alternative for construction applications.
For future research, it is recommended to produce panels with different dosages and to eliminate the expanded clay content to assess its impact on the materials’ properties. Additionally, the incorporation and study of new materials that could further improve the performance of the developed composites are proposed. Furthermore, investigating the acoustic properties of these composites is essential to expand their applications in construction.

Author Contributions

R.M.R.M.: Conceptualization, Methodology, Research. M.H.R.: Research, Writing—Original Draft, Writing—Proofreading and Editing. K.D.C.e.S.: Writing—Proofreading and editing, Research, Supervision. R.A.F.P.: Resources, Writing—Proofreading and editing, Supervision. All authors have read and agreed to the published version of the manuscript.

Funding

This research received no external funding.

Data Availability Statement

All data generated or analyzed during this study are included in this published article.

Acknowledgments

We gratefully acknowledge the Ministry of Science, Technology, Innovation and Communications, the National Council for Scientific and Technological Development (CNPq), the agencies CAPES and FAPEMIG for providing financial support. We also grateful for the Laboratory of Civil Materials Construction, at DECIV, UFOP; Research Group on Solid Waste—RECICLOS-CNPq for infrastructure and collaboration.

Conflicts of Interest

The authors declare that they have no known competing financial interests or personal relationships that could have appeared to influence the work reported in this paper.

Abbreviations

The following abbreviations are used in this manuscript:
QWQuartzite Waste
FWFiberglass Waste
ECExpanded Clay
ASTMAmerican Society for Testing and Materials
TG/DTAThermogravimetric Analysis/Differential Thermal Analysis
W/GWater/Gypsum Ratio
ITZInterfacial Transition Zone
XRFX-ray Fluorescence
SEMScanning Electron Microscopy
XRDX-ray Diffraction
MPaMegapascal (Unit of Pressure)
W/(m·K)Watts per meter-Kelvin (Unit of Thermal Conductivity)

References

  1. Mahpour, A.R.; Sadrolodabaee, P.; Ardanuy, M.; Haurie, L.; Lacasta, A.M.; Rosell, J.R.; Claramunt, J. Serviceability parameters and social sustainability assessment of flax fabric reinforced lime-based drywall interior panels. J. Build. Eng. 2023, 76, 107406. [Google Scholar] [CrossRef]
  2. Gonçalves, R.; Martinho, A.; Oliveira, J. Evaluating the potential use of recycled glass fibers for the development of gypsum-based composites. Constr. Build. Mater. 2022, 321, 126320. [Google Scholar] [CrossRef]
  3. Feng, Y.C.; Zhao, F.Q.; Xu, H. Recycling and utilization of waste glass fiber reinforced plastics. In MATEC Web of Conferences; EDP Sciences: Les Ulis, France, 2016; Volume 67, p. 07012. [Google Scholar]
  4. Baux, C.; Mélinge, Y.; Lanos, C.; Jauberthie, R. Enhanced Gypsum Panels for Fire Protection. J. Mater. Civ. Eng. 2008, 20, 71–77. [Google Scholar] [CrossRef]
  5. Wang, S.; Pancheti, J.; Xi, Y.; Mahendran, M. Lightweight composite gypsum boards with clay mineral and glass fibre for enhanced fire-resistance. Compos. Part B Eng. 2023, 266, 111044. [Google Scholar] [CrossRef]
  6. Singh, S.; Dalbehera, M.M.; Kumar, A.A.; Maiti, S.; Balam, N.B.; Bisht, R.S.; Panigrahi, S.K. Elevated temperature and performance behaviour of rice straw as waste bio-mass based foamed gypsum hollow blocks. J. Build. Eng. 2023, 69, 106220. [Google Scholar] [CrossRef]
  7. del Río-Merino, M.; Vidales-Barriguete, A.; Piña-Ramírez, C.; Vitiello, V.; Cruz-Astorqui, J.S.; Castelluccio, R. A review of the research about gypsum mortars with waste aggregates. J. Build. Eng. 2022, 45, 103338. [Google Scholar] [CrossRef]
  8. Ferrández, D.; Álvarez, M.; Zaragoza-Benzal, A.; Cobo-González, Á.; Santos, P. Development and Characterization of Innovative Hemp–Gypsum Composites for Application in the Building Industry. Appl. Sci. 2024, 14, 2229. [Google Scholar] [CrossRef]
  9. Sheng, D.D.C.V.; Ramegowda, N.S.; Guna, V.; Reddy, N. Groundnut shell and coir reinforced hybrid bio composites as alternative to gypsum ceiling tiles. J. Build. Eng. 2022, 57, 104892. [Google Scholar] [CrossRef]
  10. Wu, H.; Liu, X.; Wang, C.; Zhang, Y.; Ma, Z. Micro-properties and mechanical behavior of high-ductility engineered geopolymer composites (EGC) with recycled concrete and paste powder as green precursor. Cem. Concr. Compos. 2024, 152, 105672. [Google Scholar] [CrossRef]
  11. Wang, C.; Zhang, Z.; Liu, X.; Zhang, Y.; Ma, Z. Elucidating the role of recycled concrete aggregate in ductile engineered geopolymer composites: Effects of recycled concrete aggregate content and size. J. Build. Eng. 2024, 95, 110150. [Google Scholar] [CrossRef]
  12. López, F.A.; Martín, M.I.; Alguacil, F.J.; Rincón, J.M.; Centeno, T.A.; Romero, M. Thermolysis of fibreglass polyester composite and reutilisation of the glass fibre residue to obtain a glass–ceramic material. J. Anal. Appl. Pyrolysis 2012, 93, 104–112. [Google Scholar] [CrossRef]
  13. Ribeiro, R.P.; Nieves, L.J.J.; Bernardin, A.M. Effect of fiberglass waste and fly ash addition on the mechanical performance of Portland cement paste. Clean. Mater. 2023, 7, 100176. [Google Scholar] [CrossRef]
  14. Silva, M.; Leão, V.; Reis, E. Incorporation of quartzite fines in the production of red ceramics. J. Clean. Prod. 2021, 288, 125098. [Google Scholar] [CrossRef]
  15. Martins, L.M.; Marques, K.M.; Elói, F.P.d.F.; Mendes, L.A.; Peixoto, R.A.F.; Mendes, J.C. Thermal insulating coating mortars with mining and steel residues and the proposition of a “thermal insulating admixture”. J. Mater. Cycles Waste Manag. 2024, 26, 1432–1449. [Google Scholar] [CrossRef]
  16. Danish, P.; Ganesh, G.M. Study on influence of Metakaolin and waste marble powder on self-compacting concrete – A state of the art review. Mater. Today Proc. 2021, 44, 1428–1436. [Google Scholar] [CrossRef]
  17. de Souza, A.M.; de Carvalho, J.M.F.; Salgado, I.L.; Santos, C.F.R.; Ferreira, F.A.; Pedroti, L.G.; Lara, R.C.; Peixoto, R.A.F. Influence of filler/cement and powder/total solids on the mixture design of self-compacting micro-concretes containing waste from the ornamental stone industry. Constr. Build. Mater. 2023, 407, 133445. [Google Scholar] [CrossRef]
  18. de Carvalho, J.M.F.; de Melo, T.V.; Fontes, W.C.; Batista, J.O.d.S.; Brigolini, G.J.; Peixoto, R.A.F. More eco-efficient concrete: An approach on optimization in the production and use of waste-based supplementary cementing materials. Constr. Build. Mater. 2019, 206, 397–409. [Google Scholar] [CrossRef]
  19. Alkhaly, Y.R.; Abdullah; Husaini; Hasan, M. Characteristics of reactive powder concrete comprising synthesized rice husk ash and quartzite powder. J. Clean. Prod. 2022, 375, 134154. [Google Scholar] [CrossRef]
  20. Ciocan, C.; Annels, C.; Fitzpatrick, M.; Couceiro, F.; Steyl, I.; Bray, S. Glass reinforced plastic (GRP) boats and the impact on coastal environment – Evidence of fibreglass ingestion by marine bivalves from natural populations. J. Hazard. Mater. 2024, 472, 134619. [Google Scholar] [CrossRef]
  21. Ardebili, A.A.; Sáez, P.V.; Cortina, M.G.; Cruz, D.M.T.; Sáiz, Á.R.; Atanes-Sánchez, E. Mechanical characterization of gypsum mortars with waste from the automotive sector. Constr. Build. Mater. 2023, 370, 130675. [Google Scholar] [CrossRef]
  22. ASTM C25; Standard Test Methods for Chemical Analysis of Limestone, Quicklime, and Hydrated Lime. ASTM International: West Conshohocken, PA, USA, 2021.
  23. Roces, E.; Muñiz-Menéndez, M.; González-Galindo, J.; Estaire, J. Lightweight expanded clay aggregate properties based on laboratory testing. Constr. Build. Mater. 2021, 313, 125486. [Google Scholar] [CrossRef]
  24. ASTM C127-24; Standard Test Method for Relative Density (Specific Gravity) and Absorption of Coarse Aggregate. ASTM International: West Conshohocken, PA, USA, 2024.
  25. ASTM C472; Standard Test Methods for Physical Testing of Gypsum, Gypsum Plasters, and Gypsum Concrete. ASTM International: West Conshohocken, PA, USA, 2021.
  26. ASTM C1396; Standard Specification for Gypsum Board. ASTM International: West Conshohocken, PA, USA, 2017.
  27. ASTM C473; Standard Test Methods for Physical Testing of Gypsum Panel Products. ASTM International: West Conshohocken, PA, USA, 2020.
  28. ASTM C1629; Standard Classification for Abuse-Resistant Nondecorated Interior Gypsum Panel Products and Fiber-Reinforced Cement Panels. ASTM International: West Conshohocken, PA, USA, 2022.
  29. ASTM C518; Standard Test Method for Steady-State Thermal Transmission Properties by Means of the Heat Flow Meter Apparatus. ASTM International: West Conshohocken, PA, USA, 2022.
  30. ASTM E119; Standard Test Methods for Fire Tests of Building Construction and Materials. ASTM International: West Conshohocken, PA, USA, 2023.
  31. Gou, M.; Zhao, M.; Zhou, L.; Zhao, J.; Hou, W.; Ma, W.; Hou, Z. Hydration and mechanical properties of FGD gypsum-cement-mineral powder composites. J. Build. Eng. 2023, 69, 106288. [Google Scholar] [CrossRef]
  32. Barbosa, W.; Ramalho, R.D.; Portella, K. Influence of gypsum fineness in the first hours of cement paste: Hydration kinetics and rheological behaviour. Constr. Build. Mater. 2018, 184, 304–310. [Google Scholar] [CrossRef]
  33. Gentile, V.; Libralato, M.; Fantucci, S.; Shtrepi, L.; Autretto, G. Enhancement of the hygroscopic and acoustic properties of indoor plasters with a Super Adsorbent Calcium Alginate BioPolymer. J. Build. Eng. 2023, 76, 107147. [Google Scholar] [CrossRef]
  34. Zhernovsky, I.V.; Cherevatova, A.V.; Voitovich, E.V.; Kozhukhova, N.I.; Evtushenko, E.I. High-temperature phase transformations in CaO-SO3-SiO2-H2O system with nanosized component. Int. J. Appl. Eng. Res. 2016, 11, 7732–7735. [Google Scholar]
  35. Jia, R.; Wang, Q.; Feng, P. A comprehensive overview of fibre-reinforced gypsum-based composites (FRGCs) in the construction field. Compos. Part B Eng. 2021, 205, 108540. [Google Scholar] [CrossRef]
  36. Yang, J.; Chen, B.; Wu, X.; Xu, G. Quantitative analysis of steel fibers on UHPFRC uniaxial tensile behavior using X-CT and UTT. Constr. Build. Mater. 2023, 368, 130349. [Google Scholar] [CrossRef]
  37. Khan, S.A.; Hussain, F.; Amjad, H.; Khushnood, R.A. A scientometric review of the synthesis and application of expanded clay aggregate in cementitious composites. Constr. Build. Mater. 2024, 437, 136654. [Google Scholar] [CrossRef]
  38. Javangula, H.; Lineberry, Q. Comparative studies on fire-rated and standard gypsum wallboard. J. Therm. Anal. Calorim. 2014, 116, 1417–1433. [Google Scholar] [CrossRef]
  39. Yue, K.; Liang, B.; Liu, J.; Li, M.; Pu, Y.; Lu, W.; Han, Z.; Li, Z. Fire resistance of light wood frame walls sheathed with innovative gypsum-particle composite: Experimental investigations. J. Build. Eng. 2022, 45, 103576. [Google Scholar] [CrossRef]
  40. Mélinge, Y.; Lanos, C.; Nguyen, K.; Daiguebonne, C.; Guillou, O.; Freslon, S. One-Dimensional-Time Study of the Dehydration of Plasterboards Under Standard Fire Condition (ISO 834): Thermo-Chemical Analysis. J. Fire Sci. 2010, 29, 299–316. [Google Scholar] [CrossRef]
  41. Engbrecht, D.C.; Hirschfeld, D.A. Thermal analysis of calcium sulfate dihydrate sources used to manufacture gypsum wallboard. Thermochim. Acta 2016, 639, 173–185. [Google Scholar] [CrossRef]
  42. Kappert, E.J.; Bouwmeester, H.J.; Benes, N.E.; Nijmeijer, A. Kinetic Analysis of the Thermal Processing of Silica and Organosilica. J. Phys. Chem. B 2014, 118, 5270–5277. [Google Scholar] [CrossRef]
  43. Jafari, B.; Rezaei, E.; Dianat, M.J.; Abbasi, M.; Hashemifard, S.A.; Khosravi, A.; Sillanpää, M. Development of a new composite ceramic membrane from mullite, silicon carbide and activated carbon for treating greywater. Ceram. Int. 2021, 47, 34667–34675. [Google Scholar] [CrossRef]
  44. Bouguerra, A. Temperature and moisture dependence on the thermal conductivity of wood-cement-based composite: Experimental and theoretical analysis. J. Phys. D: Appl. Phys. 1999, 32, 2797–2803. [Google Scholar] [CrossRef]
  45. Zaragoza-Benzal, A.; Ferrández, D.; Santos, P.; Atanes-Sánchez, E. Upcycling EPS waste and mineral wool to produce new lightweight gypsum composites with improved thermal performance. Constr. Build. Mater. 2024, 449, 138464. [Google Scholar] [CrossRef]
  46. ISO 834-1; International Standard Fire-Resistance Tests—Elements of Building Construction. Part 1: General Requirements; International Organization for Standardization: Geneva, Switzerland, 1999.
  47. Ahmed, W.; Lim, C.W.; Akbar, A. Influence of Elevated Temperatures on the Mechanical Performance of Sustainable-Fiber-Reinforced Recycled Aggregate Concrete: A Review. Buildings 2022, 12, 487. [Google Scholar] [CrossRef]
  48. Shalwan, A.; Alajmi, A.; Yousif, B.F. Theoretical Study of the Effect of Fibre Porosity on the Heat Conductivity of Reinforced Gypsum Composite Material. Polymers 2022, 14, 3973. [Google Scholar] [CrossRef]
  49. Zhou, H.; Puttige, A.R.; Nair, G.; Olofsson, T. Thermal behaviour of a gypsum board incorporated with phase change materials. J. Build. Eng. 2024, 94, 109928. [Google Scholar] [CrossRef]
  50. Yuan, Z.; Jia, Y. Mechanical properties and microstructure of glass fiber and polypropylene fiber reinforced concrete: An experimental study. Constr. Build. Mater. 2021, 266, 121048. [Google Scholar] [CrossRef]
  51. Rosas, M.H.; Chileno, N.G.C.; Campos, A.A.; Rocha, J.H.A. Analysis of concrete mechanical properties when adding type-E glass fibers. J. Build. Pathol. Rehabilitation 2023, 8, 1–12. [Google Scholar] [CrossRef]
Figure 1. Morphology of the (a) gypsum with 2 mm scale, (b) gypsum with 0.5 mm scale, (c) quartzite waste with 2 mm scale, (d) quartzite waste with 0.5 mm, (e) expanded clay with 2 mm scale, (f) expanded clay with 0.5 mm scale, (g) fiberglass waste with 2 mm scale, and (h) fiberglass waste with 0.5 mm scale.
Constrmater 05 00030 g001aConstrmater 05 00030 g001b
Figure 2. Thermal analysis of samples MQ-0, MQ-0.5, MQ-5, and MQ-50.
Constrmater 05 00030 g002
Figure 3. Relationship between the amount of quartzite waste, mass loss, and crystallization water.
Constrmater 05 00030 g003
Figure 4. Microscopic images after thermal analysis of (a) MQ-0, (b) MQ-0.5, (c) MQ-5, and (d) MQ-50.
Constrmater 05 00030 g004
Figure 5. Thermometry curves of reference and MQ-20 samples.
Constrmater 05 00030 g005
Figure 6. Compressive and flexural strength at 28 days.
Constrmater 05 00030 g006
Figure 7. Flexural strength test of (a) reference and (b) MQ-20 specimen.
Constrmater 05 00030 g007
Figure 8. Water absorption of the reference and MQ-20 specimens.
Constrmater 05 00030 g008
Figure 9. Thermal analysis of the plates: (a) reference and (b) MQ-20 samples.
Constrmater 05 00030 g009
Figure 10. Behavior of reference and MQ-20 specimens under fire exposure.
Constrmater 05 00030 g010
Figure 11. Post-test surface aspect of (a) reference and (b) MQ-20 specimens.
Constrmater 05 00030 g011
Figure 12. Heat distribution in the (a) reference and (b) MQ-20 specimens.
Constrmater 05 00030 g012
Figure 13. Microstructure of (a) pre-test reference, (b) post-test reference, (c) MQ-20 specimen pre-test, (d) MQ-20 specimen post-test, (e) details of EC, and (f) details of FW.
Constrmater 05 00030 g013aConstrmater 05 00030 g013b
Table 1. Mixture design of the experimental boards.
Mixture IDMaterial (g)
GypsumExpanded ClayFiberglass WasteQuartzite WasteWater
Reference1080.00.00.00.0464.4
MQ-0966.6108.05.40.0367.3
MQ-0.5961.2108.05.45.4365.3
MQ-5912.6108.05.454.0346.8
MQ-50426.6108.05.4540.0162.1
MQ-20 *750.6108.05.4216.0285.2
* The determination of optimal dosage (MQ-20) is described in Section 3.2.
Table 2. Chemical composition of gypsum, quartzite waste, and fiberglass waste.
Element (%) S O 3 S r O C a O A l 2 O 3 S i O 2 M g O K 2 O F e 2 O 3 P 2 O 5 T i O 2 C l
Gypsum58.190.1340.760.480.250.13-----
Quartzite Waste--0.1422.0774.530.112.200.140.460.160.13
Fiberglass Waste--21.313.255.03.30.10.2-1.0-
Table 3. Percentage of free and crystallization water.
Mixture IDFree Water (%)Crystallization Water (%)
Reference1.4012.50
MQ-02.8411.50
MQ-0.52.749.50
MQ-52.449.00
MQ-501.866.00
Disclaimer/Publisher’s Note: The statements, opinions and data contained in all publications are solely those of the individual author(s) and contributor(s) and not of MDPI and/or the editor(s). MDPI and/or the editor(s) disclaim responsibility for any injury to people or property resulting from any ideas, methods, instructions or products referred to in the content.

