Article

Influence of the Addition of Carbon Fibres on Gypsum–PCM Mixtures

Buildwise, Avenue Pierre Holoffe 21, 1342 Limelette, Belgium
*
Author to whom correspondence should be addressed.
Constr. Mater. 2024, 4(1), 154-172; https://doi.org/10.3390/constrmater4010009
Submission received: 18 September 2023 / Revised: 19 October 2023 / Accepted: 20 October 2023 / Published: 1 February 2024

Abstract

:
This study investigated the influence of carbon fibre addition on the thermal performances of gypsum compositions doped with 20 wt % of phase-change material (PCM) microspheres. The influences of the length (150 µm/3 mm) and additive amount (0.5/2/4 wt %) of the carbon fibres were investigated. Characterizations were performed throughout the various preparation steps to check that the materials aligned with the construction standards. The consistency of compositions with 3 mm carbon fibres did not seem to be suitable for construction implementation. On the contrary, thanks to an adequate amount of thinning additive, the compositions with 150 µm carbon fibres showed acceptable implementation properties. The materials were tested in a climatic chamber under temperature cycles that were either favourable (15 °C/40 °C) or unfavourable (20 °C/40 °C) for the regeneration process of the PCM. Tests with a plateau at 40 °C/15 °C were also performed to obtain a better understanding of the thermal behaviours. The tests were performed using walls with thicknesses of either 15 mm or 30 mm. The results show that, in all cases, the addition of carbon fibres was not beneficial to the thermal performance of the PCM. These observations were in opposition to those of other studies in the literature. We hypothesized that the performances of these composite materials would be different under convective or conductive fluxes. It was also shown that, in unfavourable conditions (20 °C/40 °C), the large thickness of 30 mm could not be fully regenerated, even in the compositions with carbon fibres. However, the PCM of boxes with 15 mm thick walls was deactivated faster (after ~400 min) than that of those with 30 mm thick walls (after ~700 min). Finally, the laboratory results were compared with the results of a previous large-scale study. It was estimated that, despite a surface-to-volume ratio that was 25 times higher, the energy storage efficiency was only increased by a factor of 2.6 between our laboratory study and the large-scale study. Hence, the PCM storage process seems to be mainly involved in maintaining the temperature of the gypsum walls rather than the temperature of the air.

1. Introduction

The use of phase-change materials, known as PCMs, to regulate the temperature inside buildings and maintain a comfortable temperature during heat waves is an area of study that has been attracting interest for more than two decades [1,2,3]. The high latent heat of melting of these composite materials makes it possible to store heat when the temperature is above a certain value, usually between 25 and 27 °C [4]. When the temperature drops below this value, heat is released via the solidification of the PCMs, and the materials are, therefore, regenerated.
Among the different methods of incorporating PCMs into building materials, the integration of PCM microcapsules into gypsum renders appears to be a promising solution. Microcapsules usually have a diameter of about 5 μm and are supplied by manufacturers in powder or liquid form. The use of microcapsules improves the transfer of heat thanks to the large area-to-volume ratio and improves stability throughout temperature cycles since the distribution of components is limited to microscopic distances [5,6].
Gypsum plaster is a material that is appropriated for the incorporation of PCM microcapsules. Several academic studies have been carried out at the laboratory scale [7,8] and pilot scale [9,10,11] to understand the properties of these innovative materials. According to some academic and industrial studies, these materials have economic potential. Borreguero et al. [12] estimated that the addition of 15 wt % of PCM microcapsules to plasterboard would save 4.5 kWh of energy per operating cycle in a conventional room covered with 1 m3 of this material. A study carried out in 2004 by BASF estimated that the use of gypsum and PCM materials instead of a conventional air-conditioning system could save up to 0.53 EUR /m2/month and would be profitable after 5 years [13].
Furthermore, numerous studies have been carried out to determine the influence of the thickness of a plasterboard containing a PCM. Oliver et al. [14] modelled gypsum plasterboard with 44.5 wt % PCM with thicknesses of 1.5 cm or 2.5 cm under different conditions. The authors calculated that after 2 h at 35 °C, the 1.5 cm panel had a higher energy storage (47 kJ/kg) compared to the 2.5 cm panel (41 kJ/kg). However, after 4 h, the stored energy reached a similar value (~60 kJ/kg) for both thicknesses. This effect was attributed to the low conductivity of the gypsum, which limited the efficiency of the PCM inside the gypsum board.
Zhou et al. [15] combined modelling and experimental values to obtain a better understanding of the convection heat transfer coefficient, h, and thickness on the performance of PCM gypsum boards. The thickness was set from 2 to 10 mm, and the heat transfer coefficients were set from 5 to 15 W/(m2.K). The authors showed that complete energy storage (>97%) of the 10 mm thick panel was theoretically only feasible for a high-convection heat transfer coefficient of 15 W/(m2·K).
For a number of reasons (e.g., mechanical stability and price), the thickness of gypsum layers does not exceed 30 mm. In addition, the amount of PCM that can be added to a gypsum mixture cannot exceed 40 wt % without the risk of weakening the final material [4]. The amount of a PCM that can be implemented in a room is, therefore, physically limited. The second most important disadvantage that PCMs face is that they must be entirely regenerated to fully express their potential. The regeneration of a PCM depends on the conductivity of the entire material as well as the time and temperature during which the material has remained below its solid–liquid transition. For example, consecutive mild nights and hot days may result in the PCM being unable to regenerate and, therefore, completely lose its efficiency. In order to address this issue, some researchers have studied the use of different additives to improve the efficiency of materials mixed with PCMs [1]. For example, graphite has been used to boost cement with a microencapsulated PCM [16]. With a thermal conductivity 15 to 400 times higher than gypsum (0.35 W/(m.K) instead of 5 to 150 W/(m.K)), carbon fibres are presented as a potentially promising additive [17,18].
In their study, Zhang et al. [19,20] used carbon fibres that were 7 μm in diameter and 3 mm long to improve the performance of gypsum board with 10–20 wt % PCM. The results showed that 1 wt % of carbon fibres increased the material’s thermal conductivity by up to +36%. A gain of 0.6 °C to 0.8 °C was achieved compared to the reference samples containing only the PCM. Interestingly, the addition of carbon fibres also improved the mechanical properties of the material (i.e., a 65% increase in bending strength and a 6% increase in compressive strength).
The present study aimed to better understand the influence of innovative materials made with the addition of carbon fibres on the efficiency of mixtures of gypsum and PCM. Experiments were carried out with gypsum and PCM mixtures manufactured in a laboratory setting and doped with two different types of commercial carbon fibres. The influences of the type and/or additive amount of carbon fibre, the thickness of the material, the temperature, and the cycle time were studied. Particular attention was paid to the practical aspects of the material’s preparation in order to provide interesting results both for the academic world and for the industrial construction sector.
In the final section, in order to identify general trends in the types and characteristics of implementation, the results obtained in this study were compared with those obtained in a previous study carried out on a larger scale. The objective was to identify trends and make assumptions about the influence of the dimensions and form factors of the implementations.

2. Materials and Methods

2.1. Materials

The base material used in this study was conventional commercial gypsum composed of calcium sulphate hemihydrate CaSO4.1/2H2O (Goldband ® from Knauf manufacturer, Brussel, Belgium).
The phase change material (PCM) was an aqueous solution of microcapsules produced by Mikrocaps company. The membrane of the microcapsules was made of polyurethane, and the PCM itself consisted of paraffin wax. The PCM content in the dispersion was 41–45 wt.%. The melting zone of the PCM was 23–27 °C; this is the optimal range for a temperate European climate [4]. The heat storage capacity of the dry microcapsules was 140–175 J/g. The viscosity of the dispersion at 25 °C was 500–1500 cPs. The average particle size was 1 to 15 μm.
The two types of carbon fibres were acquired from SGLcarbon under the Sigrafil® brand. This choice was guided by the fact that these dimensions are common in the market, which would facilitate their large-scale use. The first type of fibres was 3 mm in length and 7 μm in diameter. The second type consisted of microscopic fibres with lengths of 150 μm and diameters of 7 μm. The characteristics of the two types of carbon fibres were specifically chosen in order to be in line with the French Organization for Safety (INRS) guideline which indicates that carbon fibres do not cause health problems when their diameter is greater than 2.5 μm and their length greater than 15 μm [21].
Determining the exact value of the thermal conductivity of carbon fibres is a complex task that depends on many parameters (fibre orientation, entanglement, density, etc.), and this information cannot be found either on the manufacturer’s site or in the literature. However, other studies have shown that using this exact type of fibre has effectively increased the thermal conductivity of polymer composites [22,23]. Comparing these fibres with other manufacturers’ products and taking into account the manufacturing process, mechanical and chemical properties, diameters, and lengths, it can be hypothesized that the thermal conductivity of these fibres is around 5 to 10 W/(m.K) [18], which is between 20 and 50 times higher than plaster alone (~0.22 W/(m.K)).
The thinning additive was supplied by Sika under the brand name Sika ViscoCrete Versuchsprodukt 30% PCE®. It is a mixture of 1,2-benzisothiazol-3(2H)-one (BIT), 2-methyl-2H-isothiazol-3-one (MIT), and 2-octyl-2H-isothiazole-3-one (OIT). Previous studies [7,24,25] showed that PCM microcapsules change the consistency of fresh gypsum mixtures. The authors of these studies hypothesized that the presence of very small microcapsules creates van der Waals forces that increase the viscosity of gypsum, making the mixing process more difficult; in addition, microcapsules provide nucleation points that promote gypsum solidification. Unfortunately, the increase in the amount of water needed for fresh mixtures in order to achieve an acceptable consistency is detrimental to the final mechanical properties of the material [7]. Therefore, in the present study, the same amount of water was set for all compositions, and the correct consistency was achieved through the addition of a thinning additive. For each composition, the amount of additive needed to achieve the correct consistency was determined by several experimental tests. For conciseness, not all orientation tests are listed in this article.
In total, six different types of compositions were studied:
-
A material composed of conventional commercial gypsum (calcium sulphate hemihydrate, CaSO4.1/2H2O, brand Goldband from manufacturer Knauf), called “Plaster”;
-
A material made from the combination of gypsum and 20 wt.% PCM, called “Plaster + PCM”;
-
The effect of adding long carbon fibres was studied with a material made from the combination of gypsum, 20 wt.% PCM, and 2 wt.% long carbon fibre (3 mm length), called “Plaster + PCM + 2%-3 mm”;
-
In order to study the influence of the length and amount of carbon fibre, compositions were prepared with short carbon fibres (150 μm length) and with either 0.5, 2, or 4 wt.% carbon fibre; these materials are called “Plaster + PCM + 0.5%-150 μ”, “Plaster + PCM + 2%-150 μ”, and “Plaster + PCM + 4%-150 μ”.

2.2. Characterizations

2.2.1. Consistency

Consistency measurements were carried out with a flow table and following the European standard EN 13279-2 [26] for premixed gypsum plasters. Demineralized water and plaster powder were added to a mixer and mixed manually for 1 min, then mechanically with a rotational speed of 140 rpm for 3 min. The required consistency was obtained when the empirically determined diameter of the plaster spread reached 165 ± 10 mm (see EN 13279-2).

2.2.2. Setting Time

The setting time, also known as the solidification time, is defined as the time between the initial mixing of raw materials and curing. It is determined by the Vicat cone method referenced in EN 13279-2 [26]. This method is usually employed for all premixed gypsum plasters that incorporate additives. The principle of the test is to measure the penetration of a needle into the mixture after different adjustment times. The needle is allowed to penetrate the initial mixture for 30 s. Two reference parameters are generally used: the initial setting time and the final setting time. The initial setting time is defined by the moment when the needle reaches a distance of 22 mm between the end of the needle and the bottom of the container. The final setting time is defined by the moment when the needle cannot penetrate the mixture at all.

2.2.3. Density of Fresh Mortar

The density of the fresh mortar was determined in accordance with EN 1015-6 [27]. In this method, the mixture was placed in a container of a known volume (1 L) and vibrated until it became compact.

2.2.4. Shrinkage

Shrinkage measurements were determined in accordance with ETAG 004 [28] and EN 13872 [29]. For each composition, 2 samples of 10 × 40 × 160 mm were prepared, and markers were fixed on their ends. Subsequently, the samples were placed in a climatic chamber at 23 °C and a relative humidity of 50 ± 5%. Sample lengths were measured for 28 days.

2.2.5. Mechanical Tests

The mechanical properties of the samples were determined with samples prepared in accordance with EN 13279-2 [26]. Samples of 160 × 40 × 40 mm were prepared and stored at T = 23 ± 2 °C and a relative humidity of RH = 50 ± 5%. Subsequently, they were dried at T = 40 ± 2 °C until they reached a constant mass.
Three-point bending tests were carried out thereafter with a mechanical press (Zwick Z20) according to EN 13279-2. Bending resistances were determined according to the equation below.
Equation (1): Flexural strength formula.
f = 1.5 × F l b d 2
where f is the flexural strength (N/mm2), b is the width (mm), d is the thickness (mm), F is the maximum bending load (N), and l is the support span (mm).
The compression tests were carried out with a mechanical press according to EN 13279-2 [26]. Bending resistances were determined according to the equation below.
Equation (2): Compressive strength formula.
R = F c A
where R is the compressive strength (N/mm2), Fc is the maximum compressive load (N), and A is the area of the section (mm2).

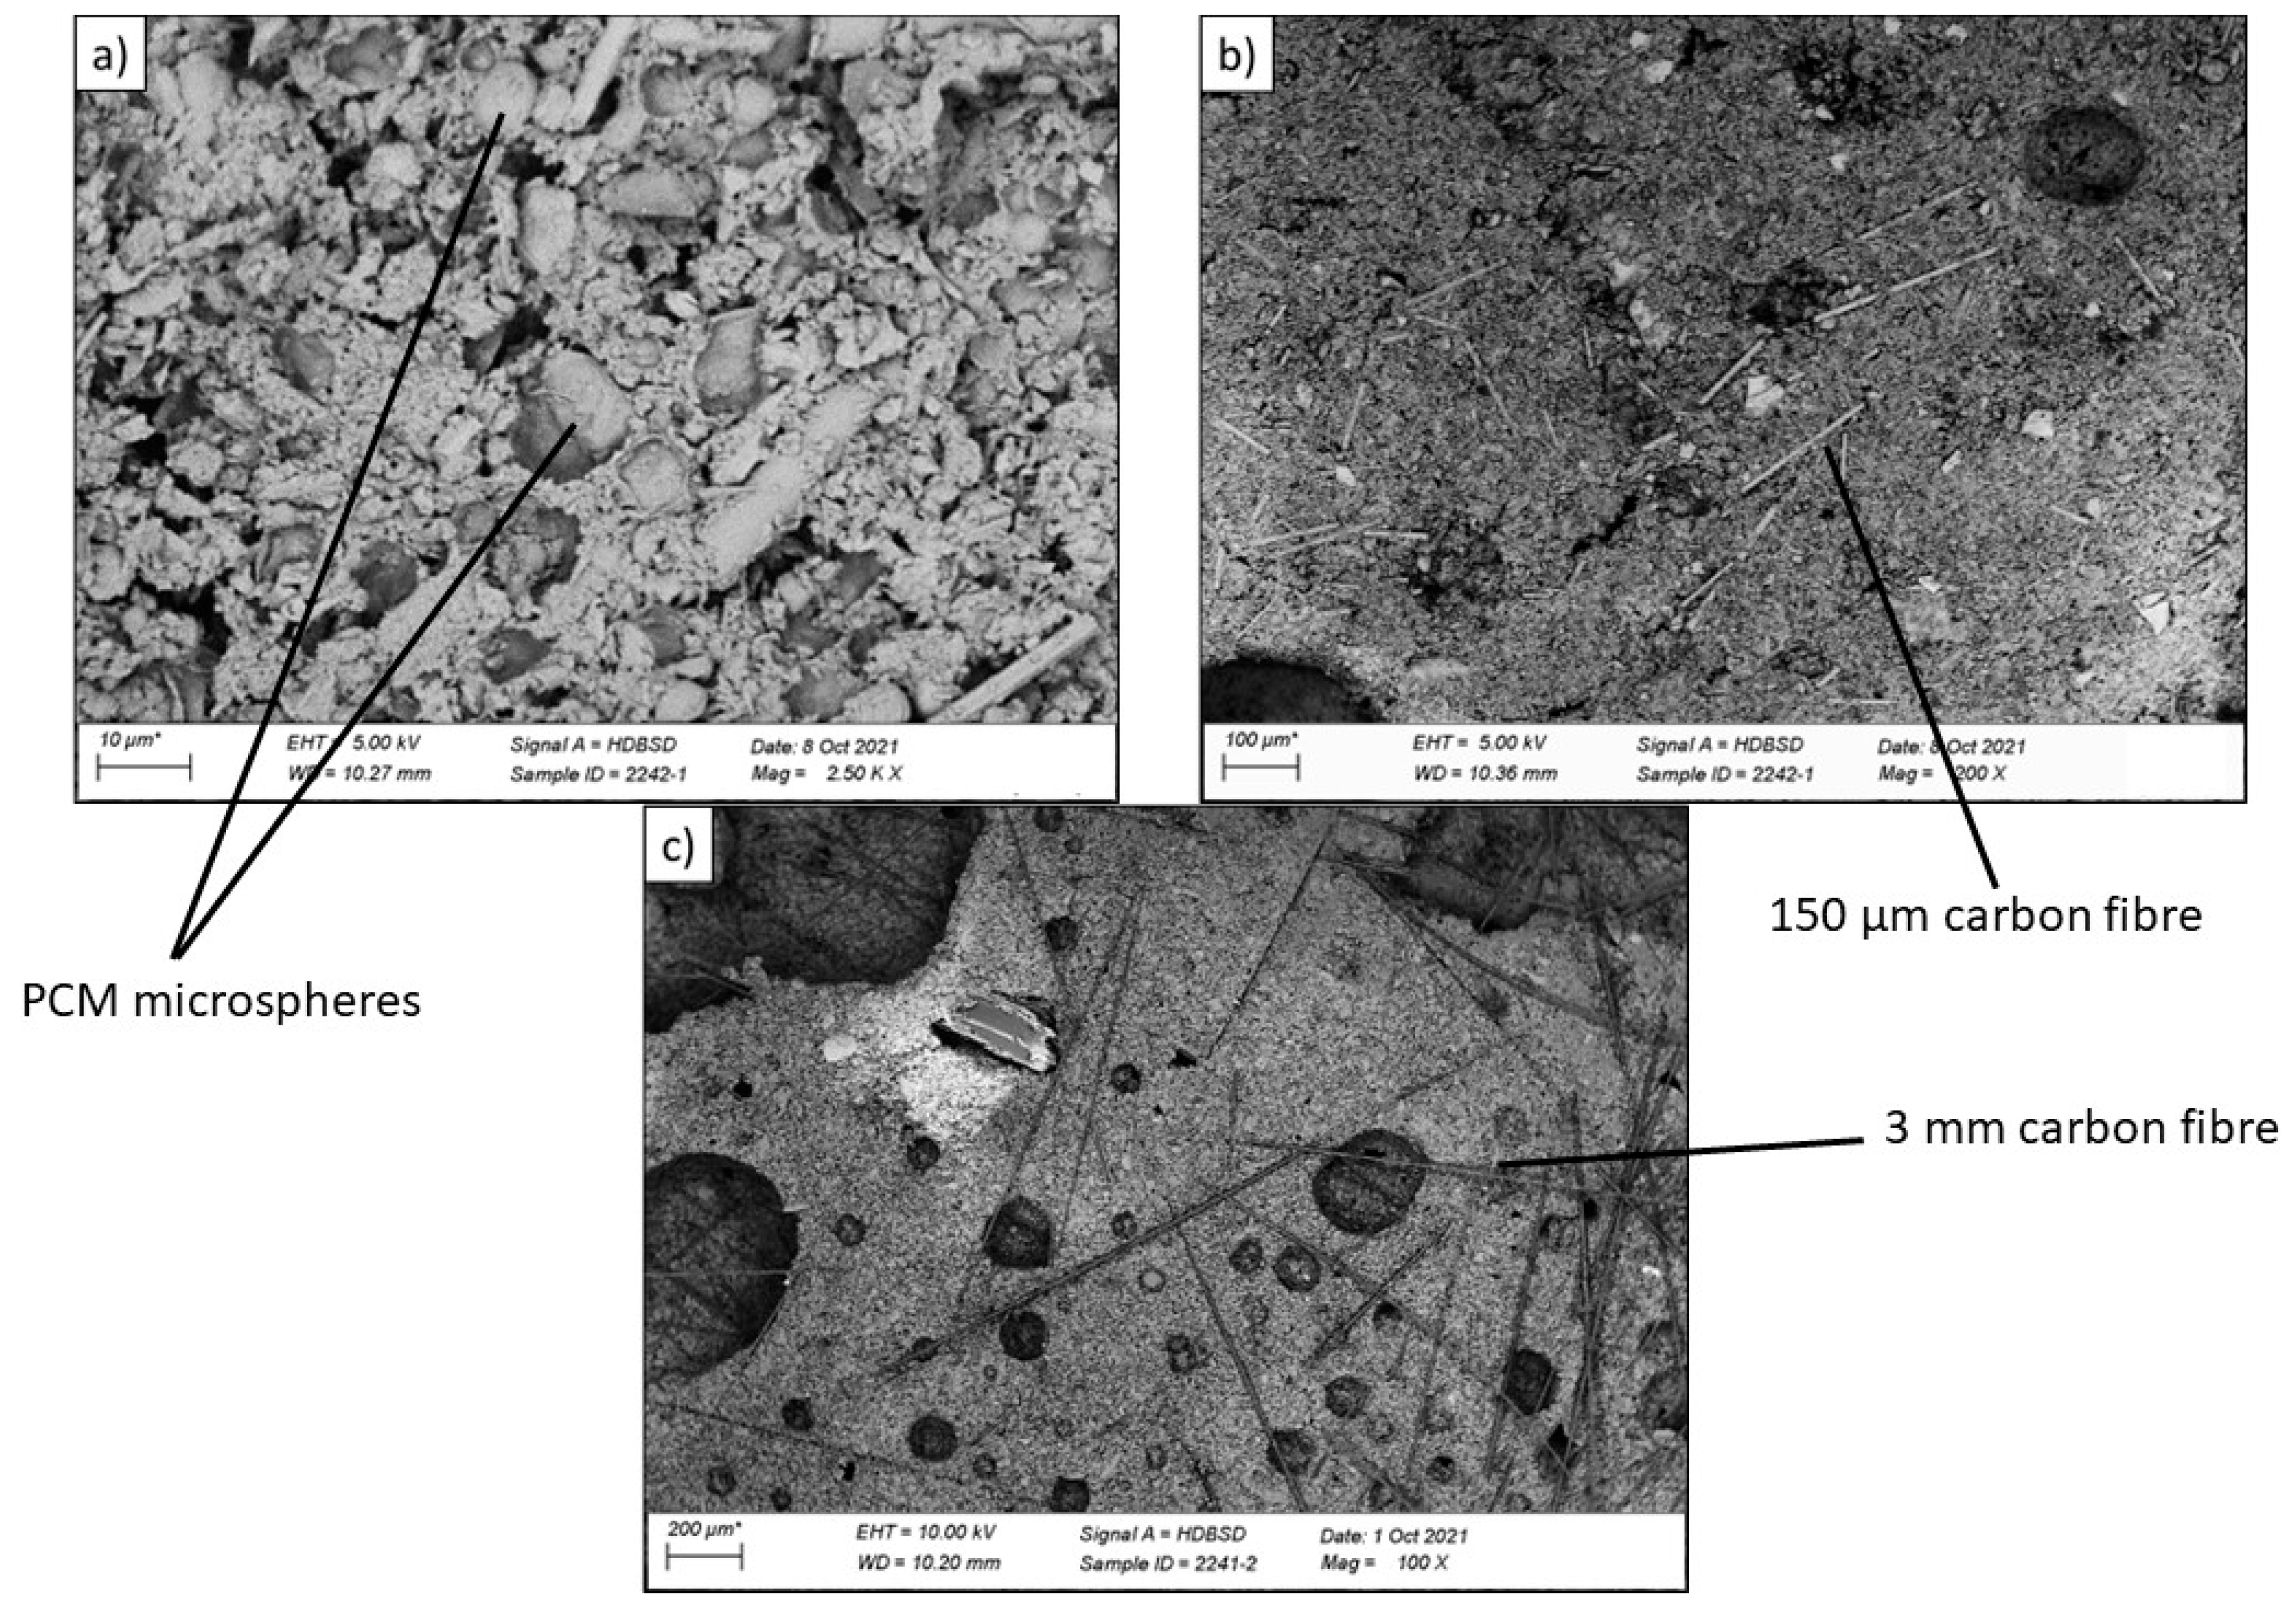
2.2.6. SEM Measurements

Microscopic measurements were performed with a Quanta 200 FEG SEM equipped with an EDS (EDAX). The photos were taken with an HV of 15.0 kV and a pressure of 130.0 Pa.

2.2.7. Thermal Conductivity

The thermal conductivities were measured with a Thermoconcept thermoprojector device, in accordance with EN 1946-3 [30] and EN 12667 [31]. Before the measurements, the device was calibrated with an IRMM440 reference sample in order to provide a measurement with less than 2% error. The measurements were made on slabs of 300 × 300 × 10 mm.

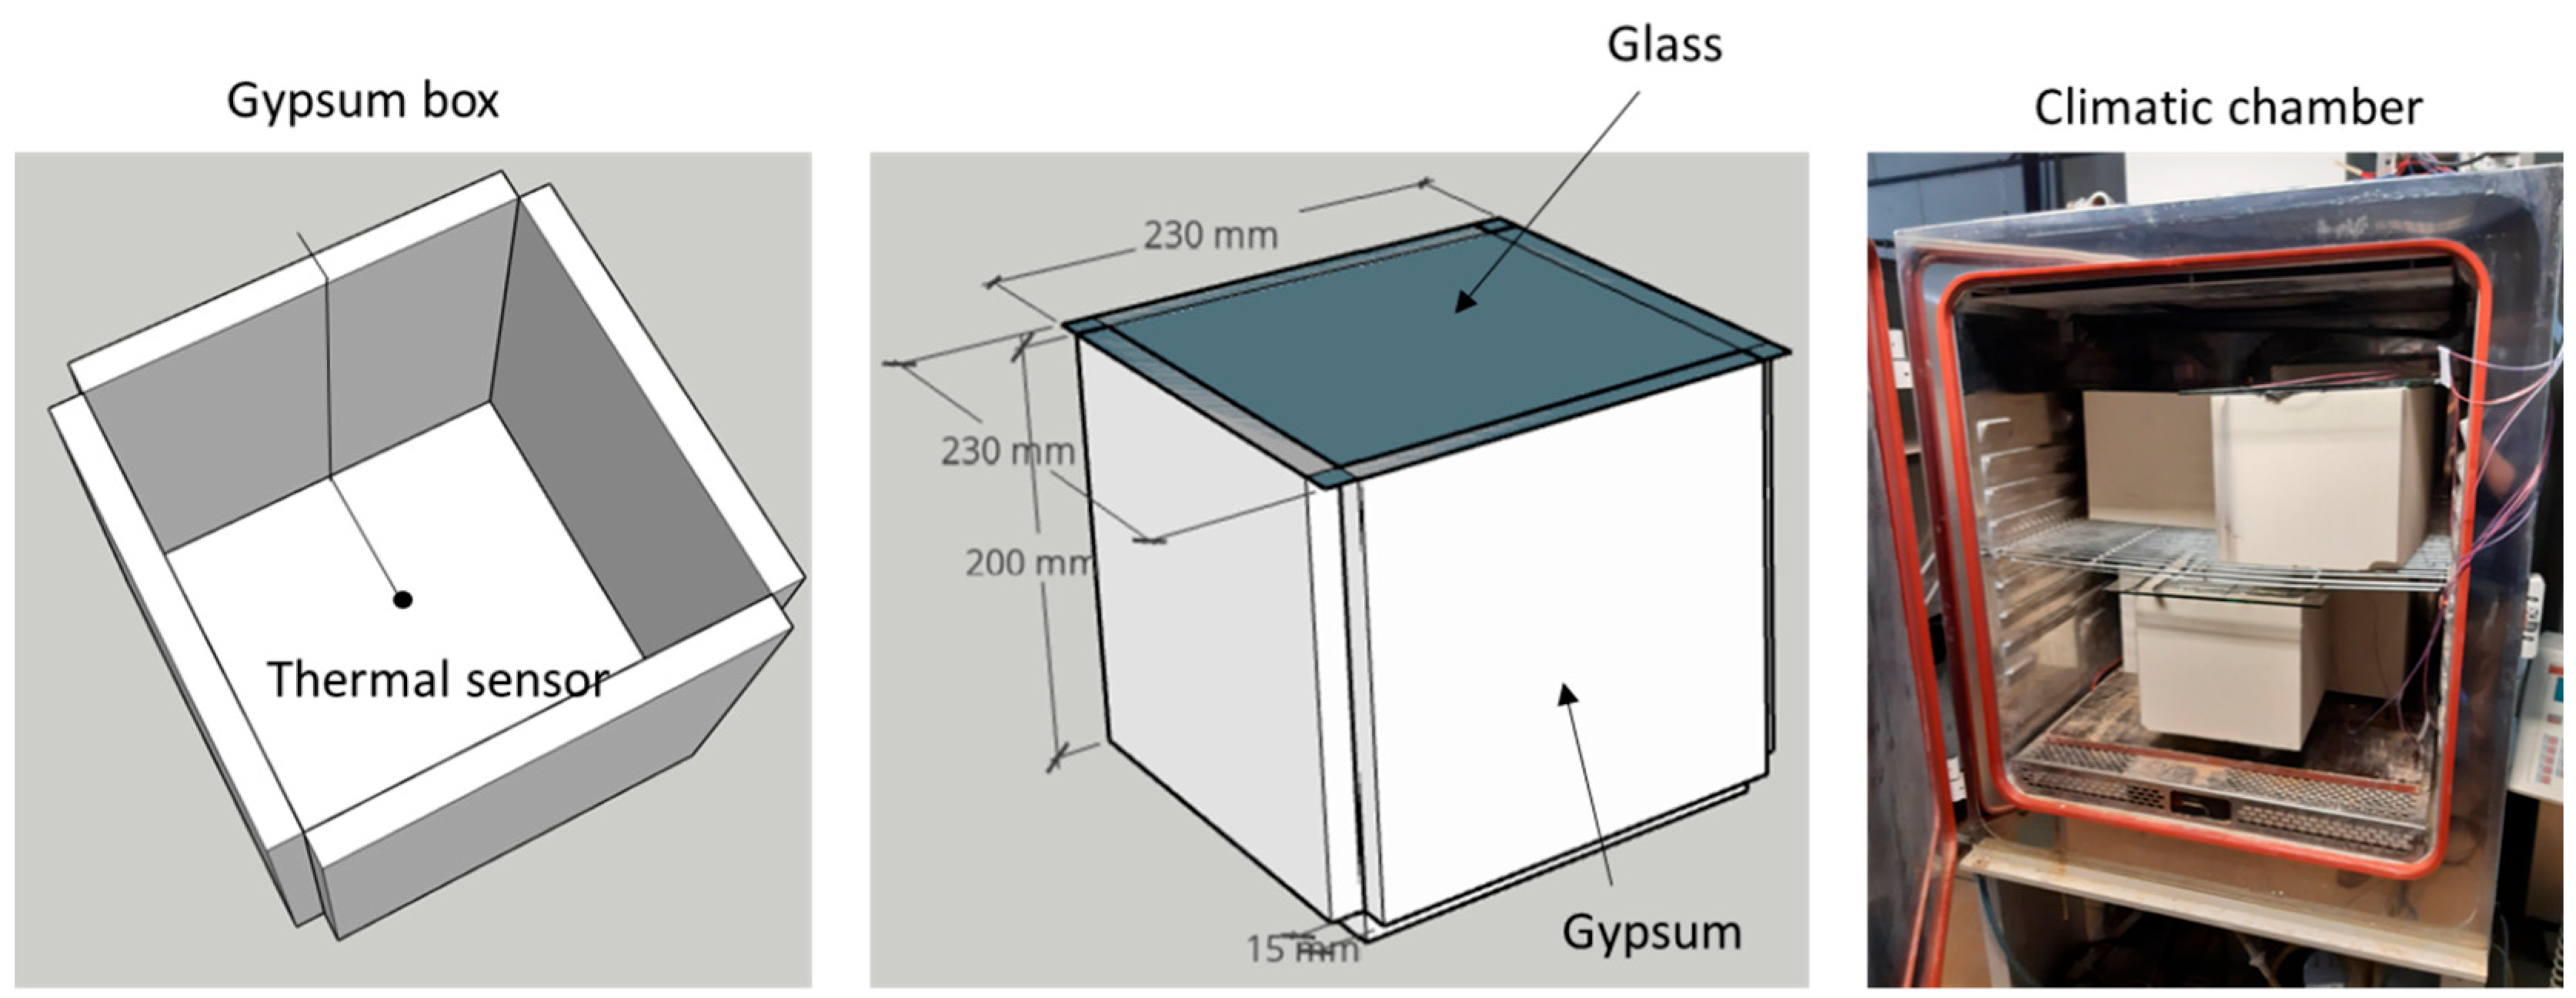
2.2.8. Climate Chamber Tests

The climate chamber tests were carried out with wall assemblies made from different combinations of material compositions and thicknesses. The objective of these tests was to study the properties of PCM-doped materials under conditions close to real life. It is worth noting that there is currently no standard method for this type of test. The design of the experimental set-up for this study was developed by Buildwise on the basis of preliminary research available in the literature [19,20].
For the construction of these box assemblies, slabs of 200 × 200 mm and either 15 or 30 mm thick were prepared for each gypsum-based composition. The slabs were conditioned at 23 °C for 28 days and then assembled together. Panels of high-performance polyurethane 40 mm thick were then glued to the sides of the gypsum boxes. All junctions were sealed with conventional sealant. For each box, a wired thermocouple was installed. The sensors were arranged to measure the air temperature 10 mm from the middle of the inner underside (see Figure 1). The boxes were then closed with a 6 mm thick float glass panel. The sensors were connected to an Agilent device that enabled temperature acquisition with a step size of 1 measurement/min. The size of the climate chamber was 900 × 900 × 900 mm, and ventilation during the test was set to allow a renewal of the air volume every minute. Figure 1 shows the box assemblies and the photo of the climatic chamber.
Several rounds of tests were carried out in order to obtain a better understanding of the behaviour of the materials under different conditions (see Table 1). Before each series of tests, the chamber was first systematically conditioned at T = 15 °C for 24 h in order to completely regenerate the PCM.

3. Results and Discussion

3.1. Preparation and Characterization of Fresh Mixtures

In order to study the materials in conditions as close as possible to a real-life context, the sample preparations were adjusted to meet the relevant construction standards. The consistency of the fresh mixture was the critical parameter to be respected. Indeed, the consistency of a fresh gypsum plaster mortar is a decisive parameter in a good implementation of the material. In addition, it should be noted that the consistency range declared as correct by the European standard EN 13279-2 is narrow: 165 ± 10 mm. Beyond compliance with a standard, meeting this parameter is also essential for an easy application of the plaster and to obtain an aesthetically pleasing finish.
Table 2 lists the results obtained for the different compositions. More details about the device used to determine the properties of fresh mixtures can be found in a previous study [7]. Water-based PCM dispersion was added to reach 20 wt.% of raw PCM (excluding the microcapsule shell) in the final composition.
In accordance with the results obtained in a previous study [7], the addition of PCM microcapsules led to a significant increase in consistency. In this way, the first attempt to produce a composition with PCM without the use of a fluidizing additive for the Plaster + PCM (test) sample led to a very low consistency of 100 mm. Nevertheless, it can be seen that for the Plaster + PCM sample, a proper consistency (165 mm) could be obtained thanks to a small amount of fluidizing additive (0.9 mL). The addition of an additive slightly increased the initial setting time but especially the final setting time (380 min instead of 200 min). This is interesting to note since a previous study [7] showed that gypsum and PCM materials without additives had significantly shorter setting times. This study reported that the microspheres of the PCM acted as nucleation points and facilitated the densification of the material. In the present study, the chemical functions of the different molecules of the additive (BIT, MIT, and OIT) slowed down the aggregation of gypsum grains and, therefore, slowed down the densification of the material. Nevertheless, considering the initial and final time, the Plaster + PCM sample is suitable for implementation by a contractor. Finally, the density of the fresh mixture remained similar to a fresh gypsum paste (~1300 g/L).
For the first attempt to synthesize a mixture with 2 wt.% of 3 mm long carbon fibres (Plaster + PCM + 2%-3 mm (test) sample), the same amount of additive was used as for the Plaster + PCM sample. The consistency obtained was far too low (113 mm), and the initial and final setting times were also too low (less than 60 min and 110 min). Carbon fibres thus acted as nucleating agents and greatly facilitated the densification of the material. With such properties, the fresh mixture would not be adequate for implementation in field conditions. Several orientation trials (not detailed in this document) enabled us to reach a correct consistency thanks to the use of a significantly larger amount of additive (3.25 mL). However, the greater amount of additive resulted in a consequent increase in the initial and final setting time (390 and 460 min). Such values could be problematic for the proper implementation by a contractor. Despite these technical drawbacks, the Plaster + PCM + 2%-3 mm sample was kept in the study in order to observe the influence of carbon fibre size.
The same amount of additive was used for the three materials made with shorter carbon fibres (150 μm). The properties of the fresh sample mixtures Plaster + PCM + 0.5%-150 μ, Plaster + PCM + 2%-150 μ, and Plaster + PCM + 4%-150 μ were relatively similar (Table 1). However, the initial and final setting time values increased with the carbon fibre content. This could be explained by the fact that more carbon fibres meant more nucleation points, which led to the densification of the material. For these three examples, the setting time values were within a range that could allow implementation in real conditions.
Microscopy observations confirmed a homogeneous distribution of PCM microspheres and carbon fibres (3 mm and 150 μm) for all samples (Figure 2).

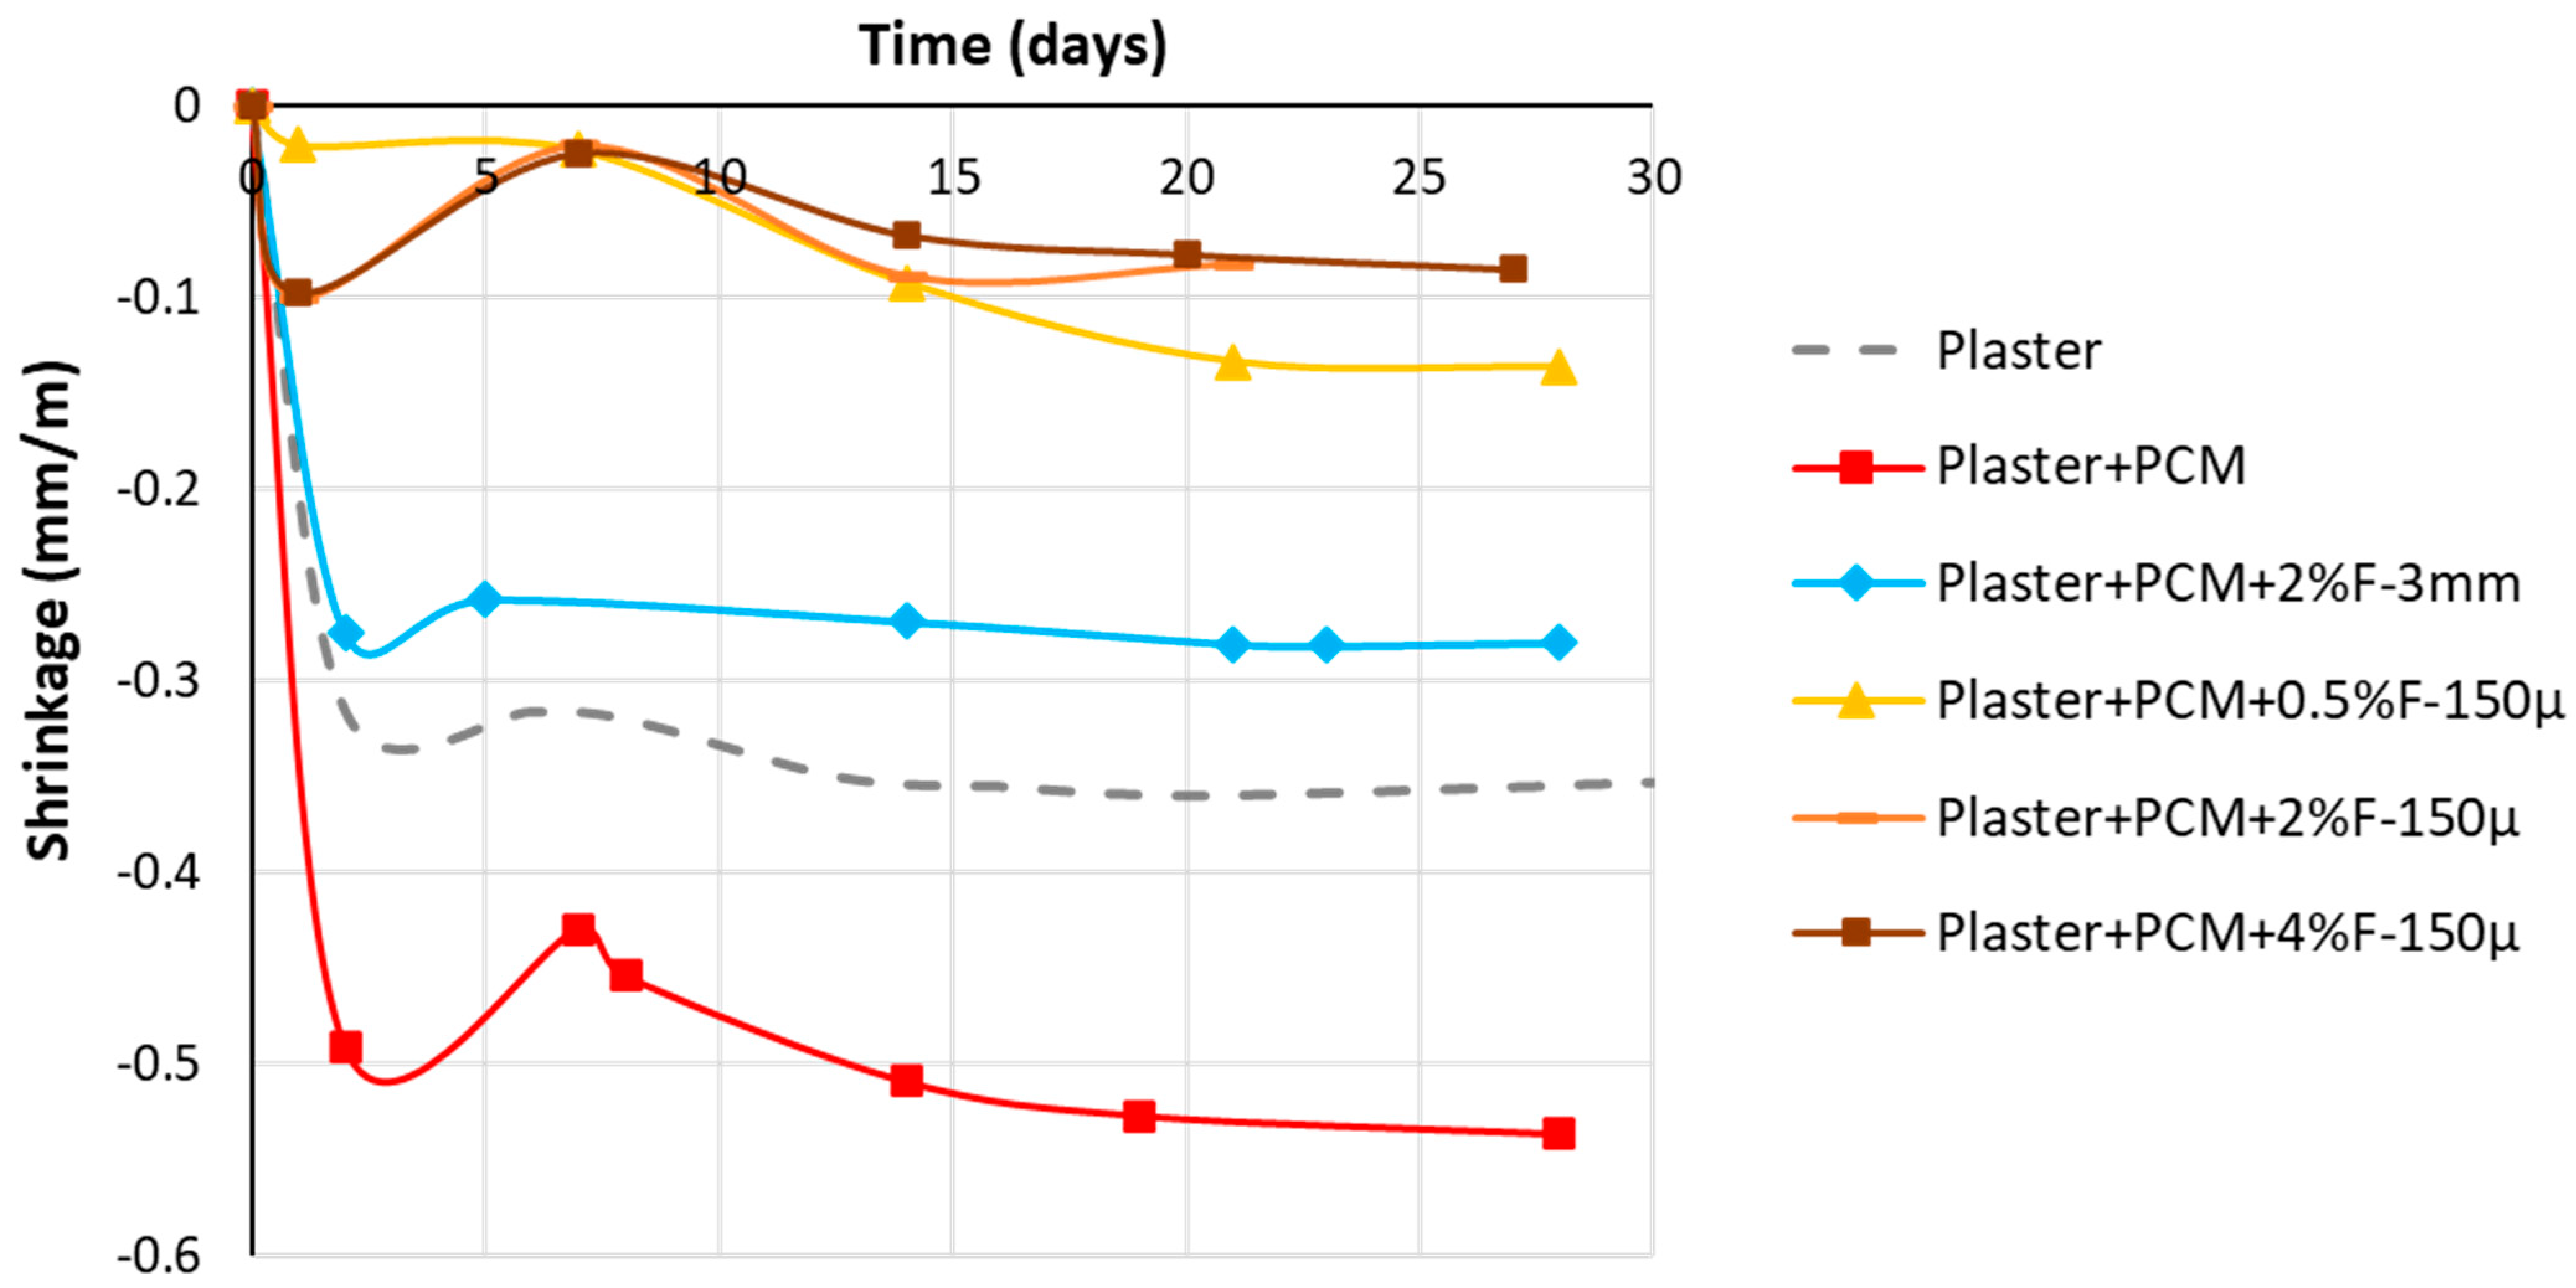
3.2. Shrinkage and Density

Swelling and shrinkage are parameters to be checked during the implementation of gypsum plasters. The phenomenon of shrinkage is mainly due to the fact that the amount of water added to gypsum plaster is generally greater than what is required for the hydration of calcium sulphate hemihydrate. This greater amount of water is necessary to obtain adequate consistency and to allow better manoeuvrability. As a result, expansion is observed during the early stages of the implementation of plaster. Over time, the plaster undergoes dimensional changes due to moisture loss and evaporation of excess water, causing shrinkage [32].
Figure 3 shows the shrinkage of all compositions obtained over 28 days at 23 °C and 50% relative humidity. The bulk densities of the dried samples are listed in Table 3. It can be observed that the addition of PCM microspheres results in a greater shrinkage of the Plaster + PCM sample compared to the reference Plaster sample (about 60% more). Previous studies [7,24] have shown that a greater amount of water initially leads to higher shrinkage. However, in this study, the initial amount of water was the same for all compositions. One hypothesis is that the presence of PCM microspheres initially tends to separate the gypsum grains and prevent their agglomeration in the fresh mortar, and that densification finally occurs during the drying step, which causes greater shrinkage. Another hypothesis is that the high shrinkage is caused by the addition of the fluidizing additive, which could also slow down the agglomeration of gypsum grains in the fresh mixture. Deeper investigations are needed to determine the causes. Interestingly, the bulk density of the Plaster + PCM sample was much higher than the value theoretically calculated by adding the quantity and densities of the Plaster sample and PCM microcapsules taken separately (1023 instead of 842 kg/m3). This is consistent with other studies [7,24,25] that have indicated that PCM microspheres act as nucleation points and promote material densification.
The Plaster + PCM + 2%F-3 mm sample had a relatively similar shrinkage as Plaster. However, its density was close to that of the Plaster + PCM sample. For the Plaster + PCM + 2%F-3 mm sample, it appeared that the 3 mm carbon fibres counteracted the effect of the PCM and/or additive in the fresh mixture and also acted as nucleation points during densification.
The three materials designed with carbon fibres of 150 μm showed very low shrinkage values (around 0.1 mm/m) but similar densities when dried (957–1023 kg/m3). It can, therefore, be assumed that the short carbon fibres promoted the agglomeration of gypsum grains in the fresh mixture.
Table 3 shows that the mechanical properties of the Plaster + PCM sample were lower than those for the Plaster sample (about 20% less for flexural strength and 50% less for compressive strength). These losses were of the same order as those obtained by other authors on similar compositions [12,33,34]. Although less important, the mechanical values still met the requirements of standard EN 13279-1 (1 and 2 N/mm2 for bending and compression, respectively). These values also confirmed that the low mechanical properties obtained in a previous study were mainly due to an excessive amount of water and not because of the addition of PCM microspheres [7].
The comparison of the values obtained for the Plaster + PCM and Plaster + PCM + 2%F-3 mm samples highlighted that the 3 mm carbon fibres significantly increased bending strength (+300%) and compressive strength (+200%). This is in line with other studies where carbon fibres have been used to reinforce plaster [19] and makes sense since these fibres are known for their high tensile strength (4000 N/mm2) [21]. In comparison, although their tensile strengths were also high (3000 N/mm2), carbon fibres with a length of 150 μm did not increase the mechanical properties of the materials. The amount was probably too small for effective reinforcement at this fibre length.

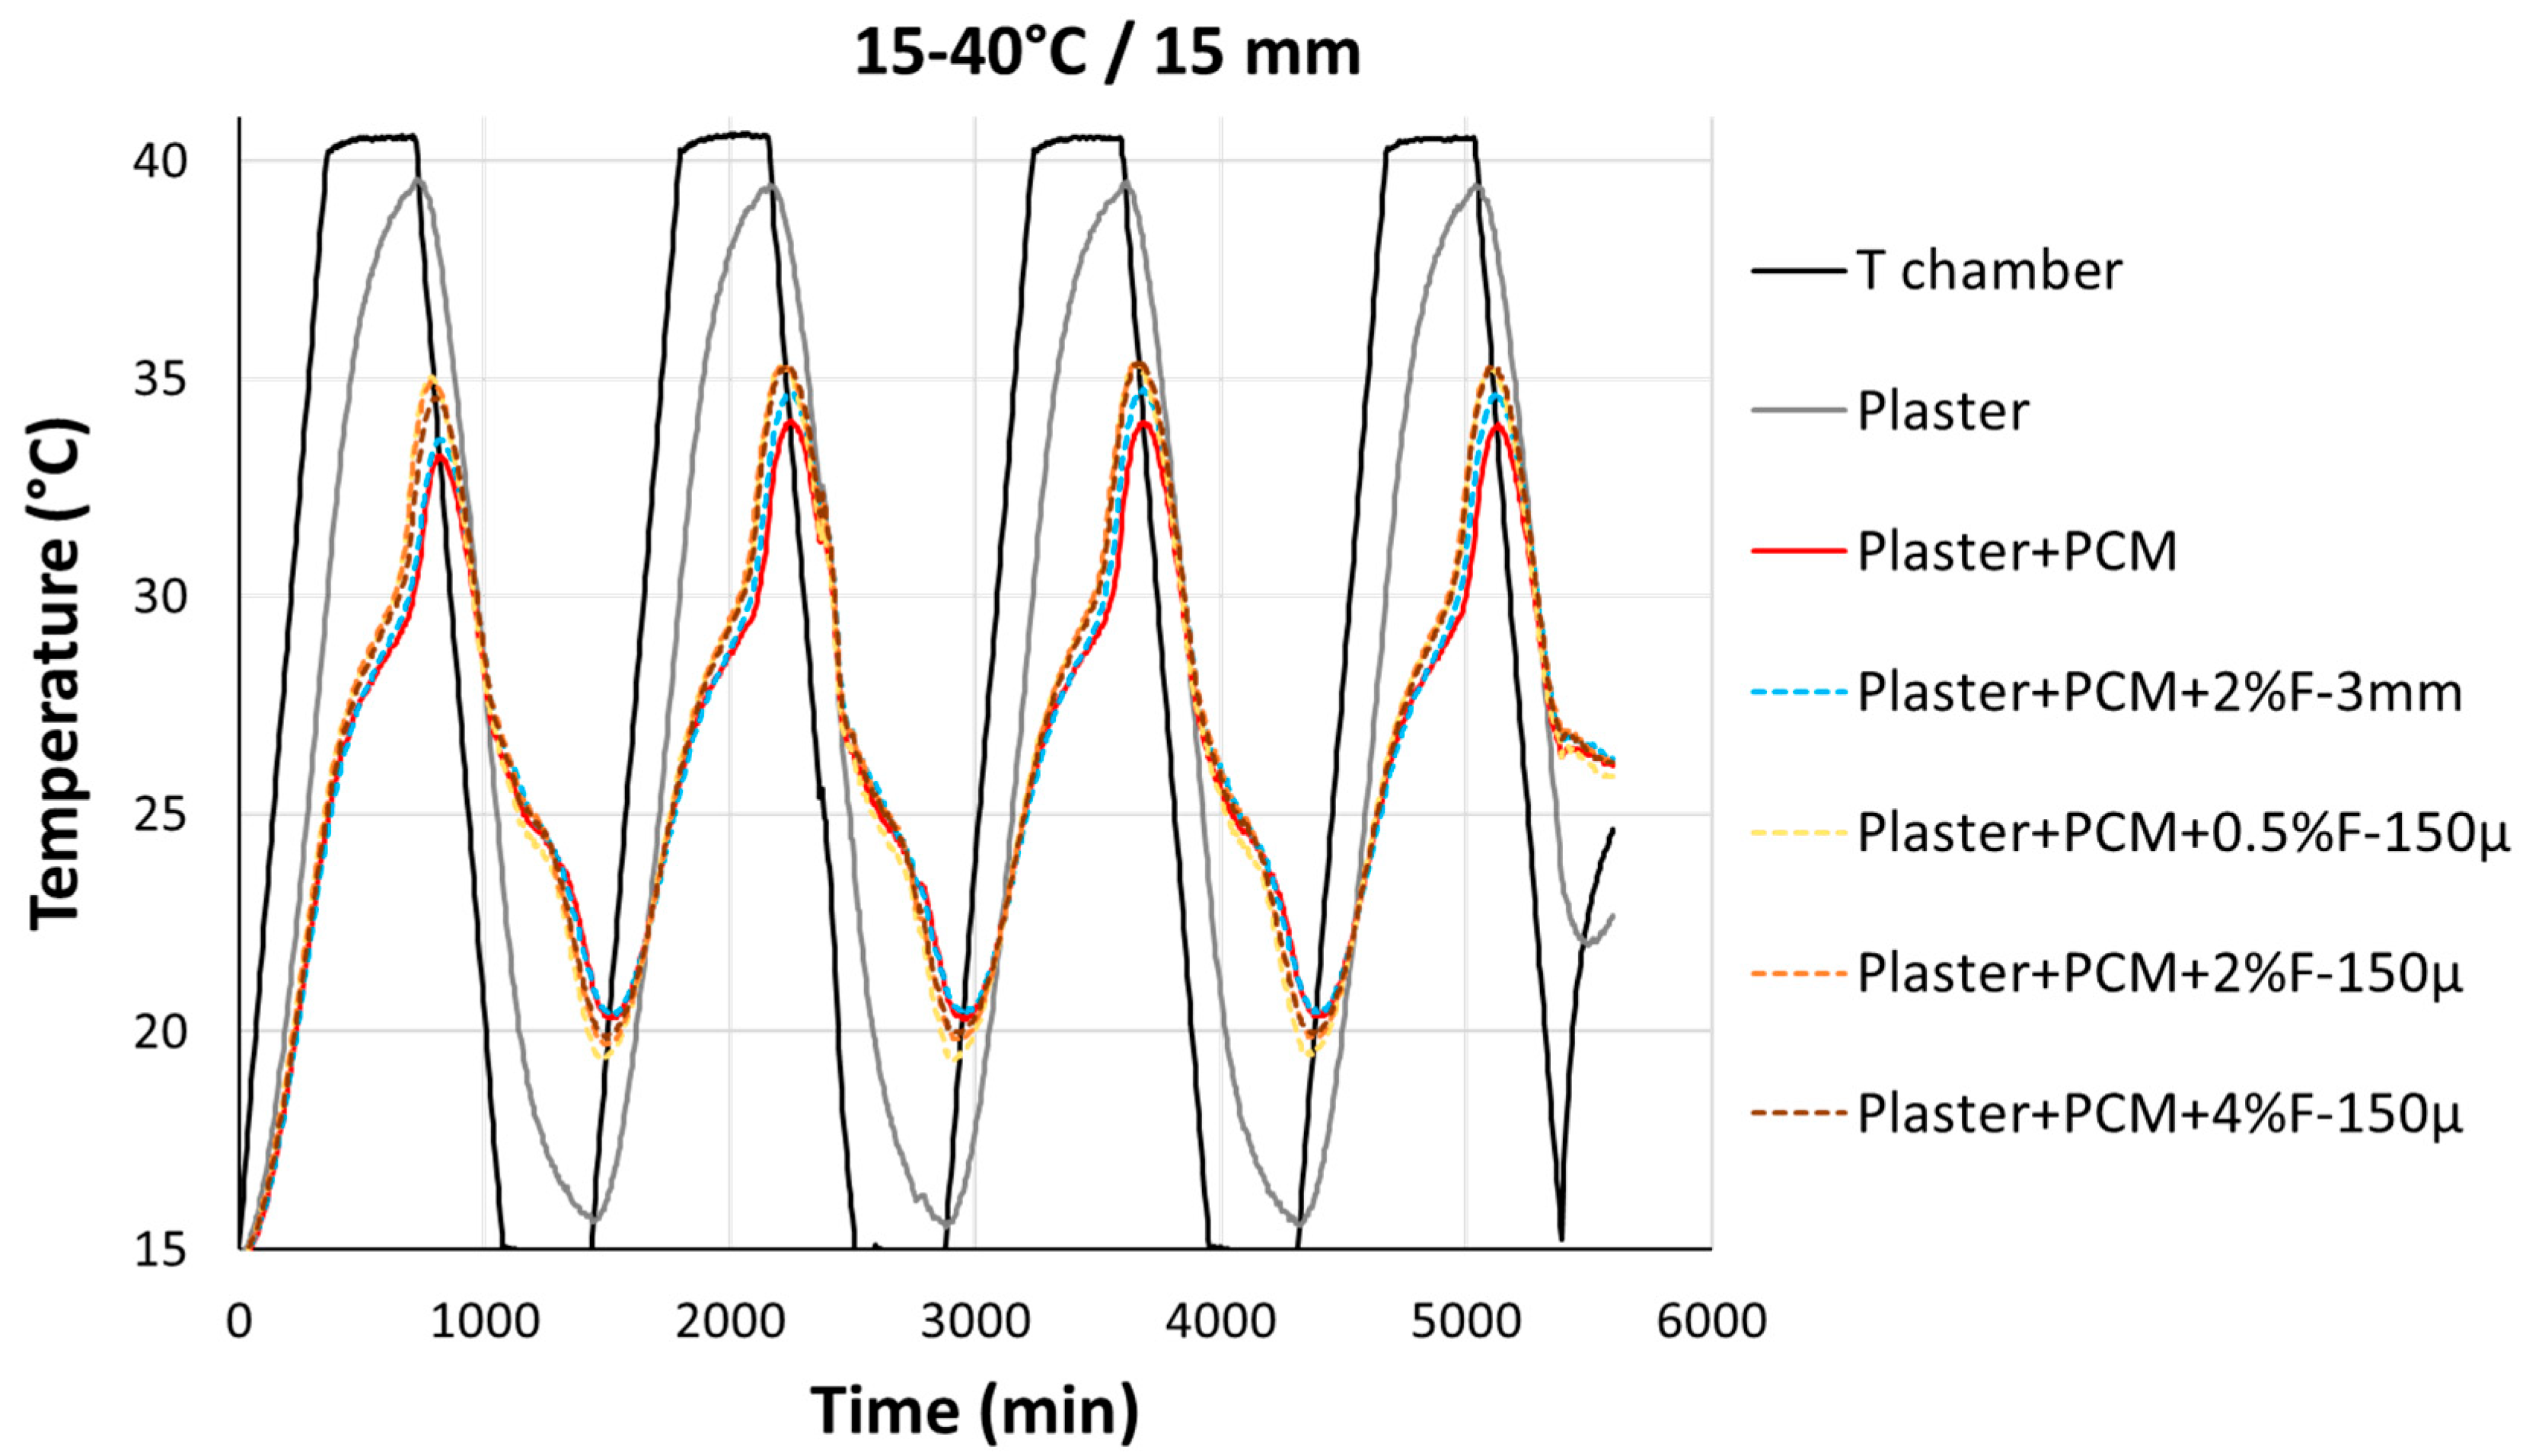
3.3. Thermal Behaviour

3.3.1. Thermal Conductivities

The main goal of this work was to study whether the doping of plaster with carbon fibres improved thermal conductivity in order to obtain better efficiency from PCM microspheres. This investigation was inspired by some promising results shown in the literature [19,20]. The exact value of the thermal conductivity of the carbon fibres used in this study was not available. However, as explained above, based on competing products and the characteristics of the fibres, as well as other similar studies, the thermal conductivity of the fibres is logically estimated as around 5 to 10 W/(m.K) [18,35].
It can be observed that the addition of PCM led to a slight decrease in the thermal conductivity of the Plaster + PCM sample compared to the Plaster sample. The reason for this decrease was not clearly understood since PCM microspheres were supposed to have thermal conductivities close to conventional gypsum (Table 4). Nevertheless, it could be noted that the same trend was observed for other studies with similar materials [20].
The addition of carbon fibres compensated for the loss of thermal conductivity caused by the PCM, but it did not significantly improve the thermal conductivities as initially expected. In this way, the addition of 2 wt.% of 3 mm carbon fibres increased the thermal conductivity by about +8% for the Plaster + PCM + 2%-3 mm sample compared to the Plaster + PCM reference sample. The addition of shorter carbon fibres also increased thermal conductivity, but the impact was relatively small (from +8% for the Plaster + PCM + 0.5%-150 μ sample to +12% for the Plaster + PCM + 4%-150 μ sample). These values, however, were relatively of the same order of magnitude as those obtained by Zhang et al. [20], whose materials, composed of gypsum and PCM, saw an increase in their thermal conductivity of 20% following the addition of 1 wt.% of carbon fibres. Similar influences were obtained by Krause et al. [36] when the same type of carbon fibres was used to improve the properties of their studied polymer, obtaining an increase in thermal conductivity of 30% with a doping of 5 wt.%.
Table 4. Thermal properties of constituents and different compositions.
Origin of the DataMaterialsThermal Conductivity
(W/(m.K))
Heat Capacity
(J/(kg.K))
Literature
(adapted from cited references)
Conventional gypsum~0.220 (ref. [14])~1000 (ref. [14])
PCM Microspheres0.200–0.300 (ref. [34]) ~2000 (ref. [37])
Carbon fibre5–10 (ref. [17,36,38])~700 (ref. [35])
ExperimentalPlaster0.226/
Plaster + PCM0.208/
Plaster + PCM + 2%-3 mm0.225/
Plaster + PCM + 0.5%-150μ0.224/
Plaster + PCM + 2%-150μ0.230/
Plaster + PCM + 4%-150μ0.233/

3.3.2. Thermal Performances
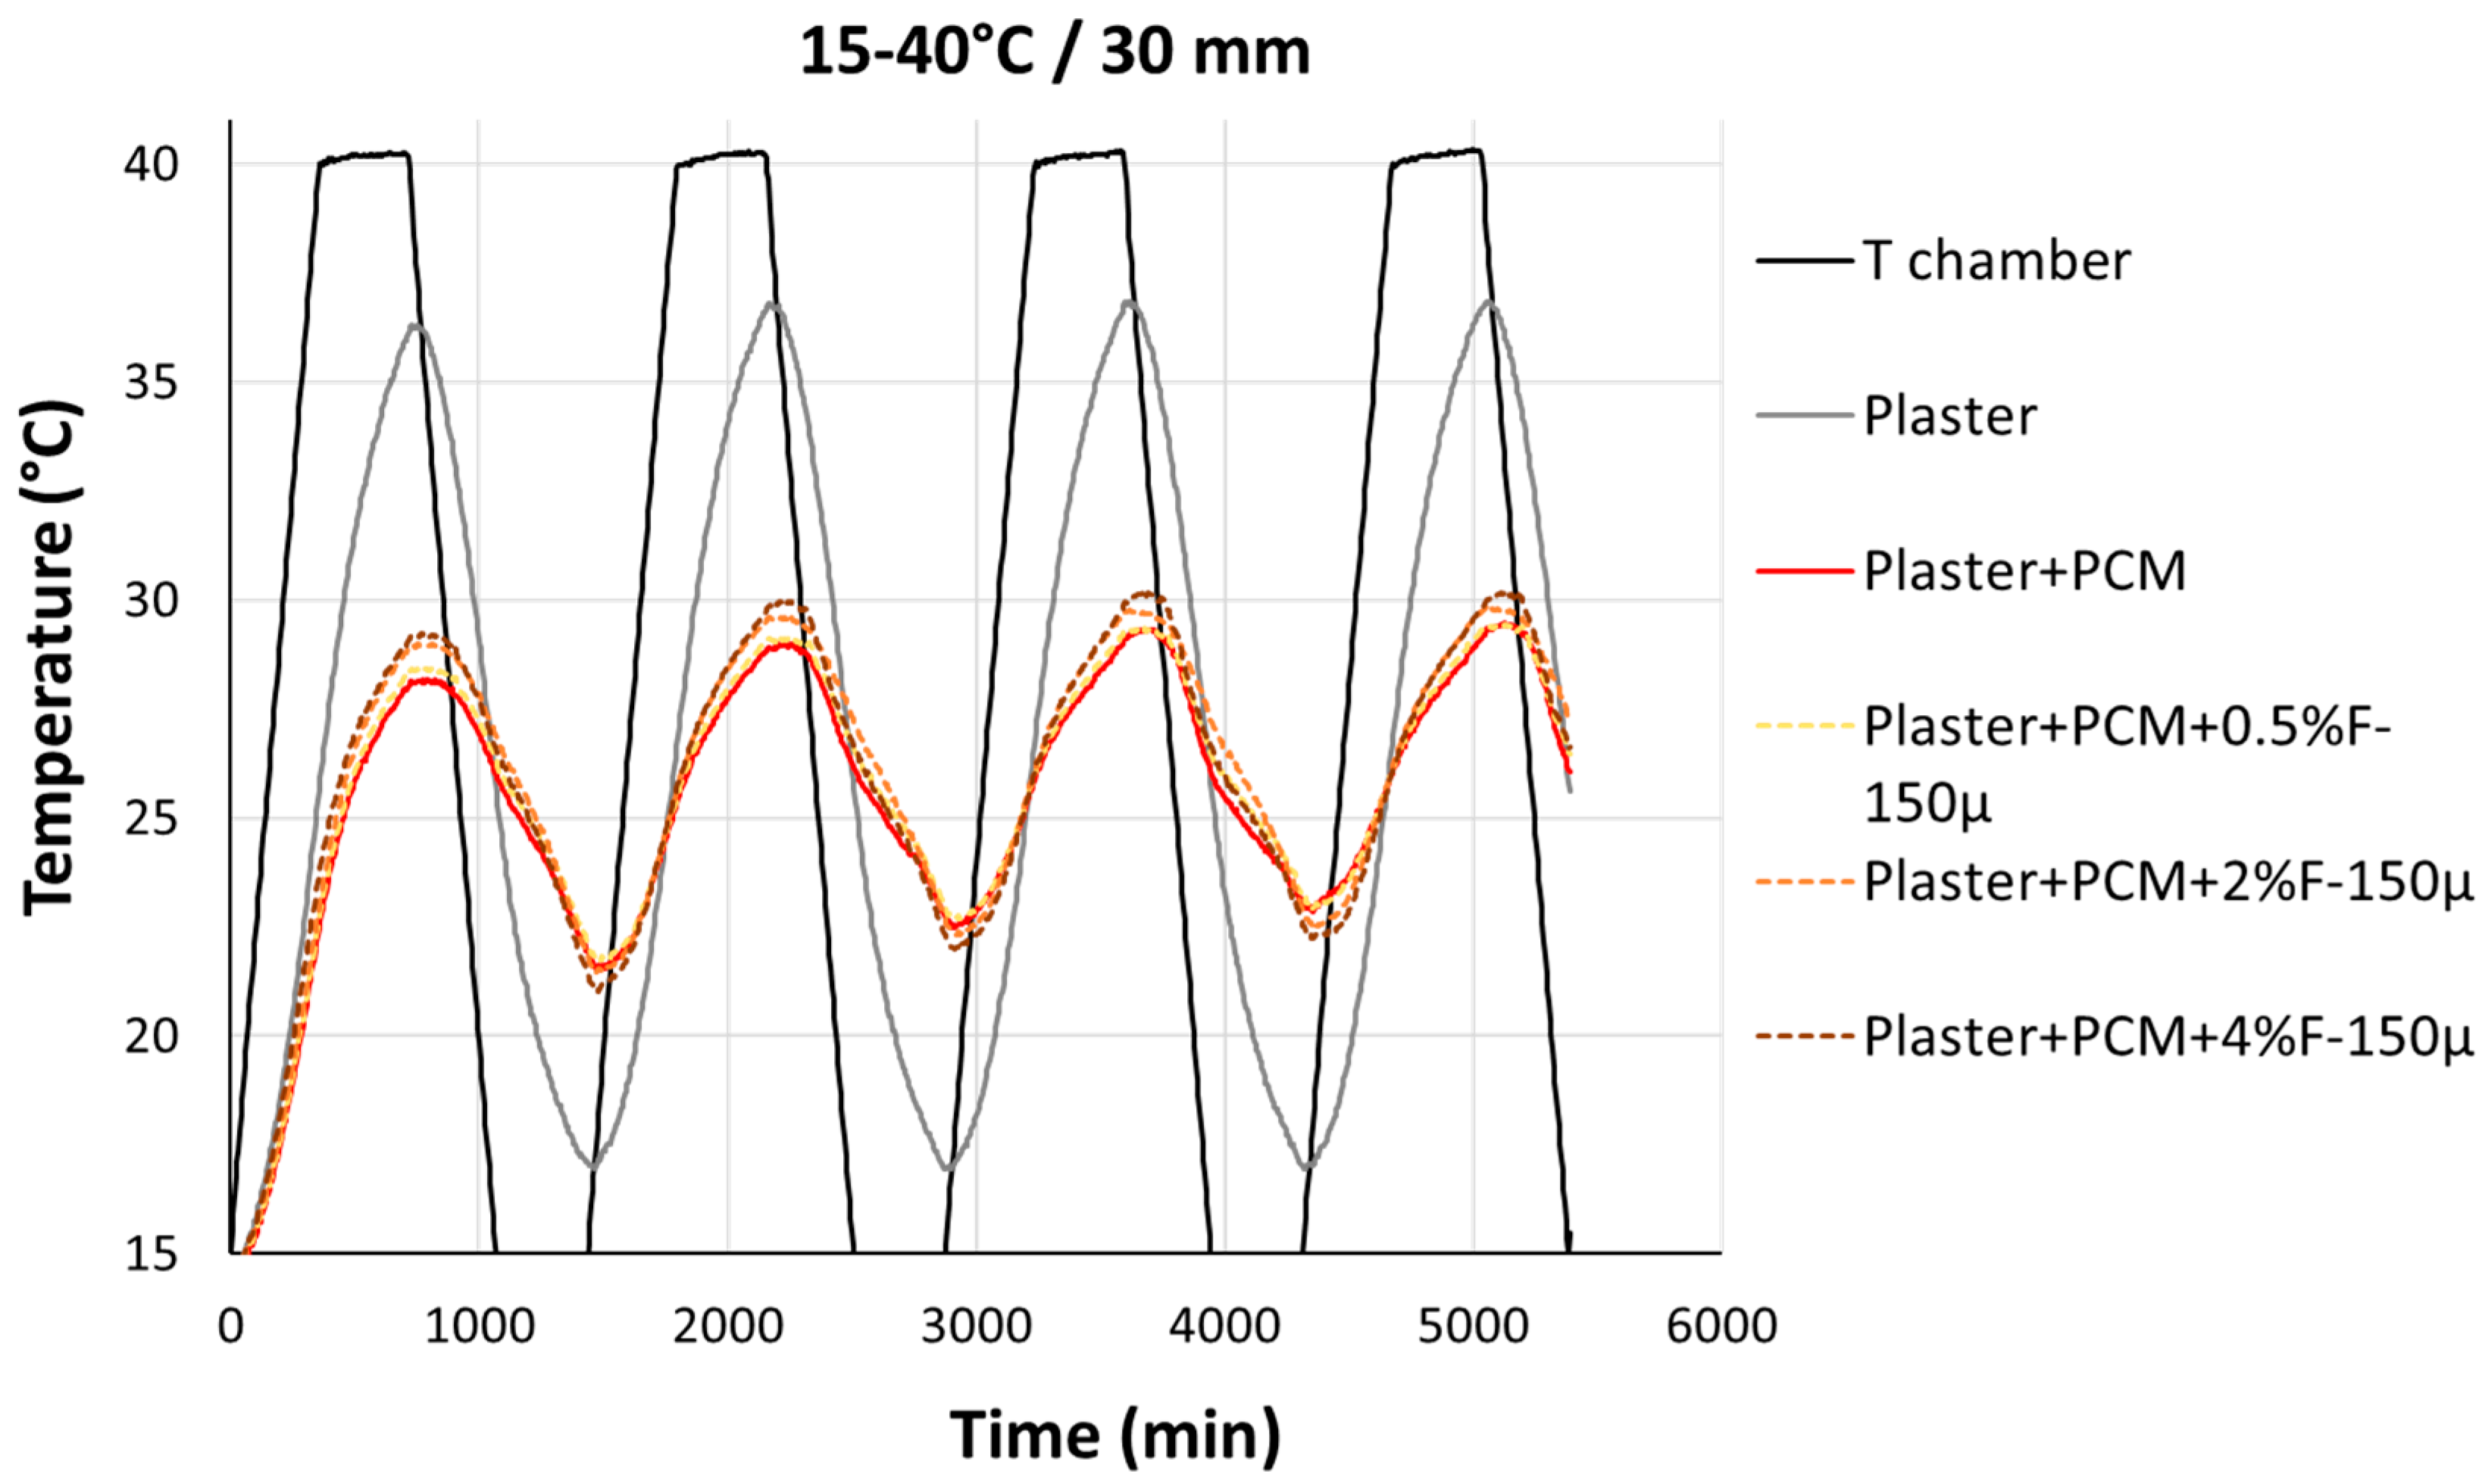
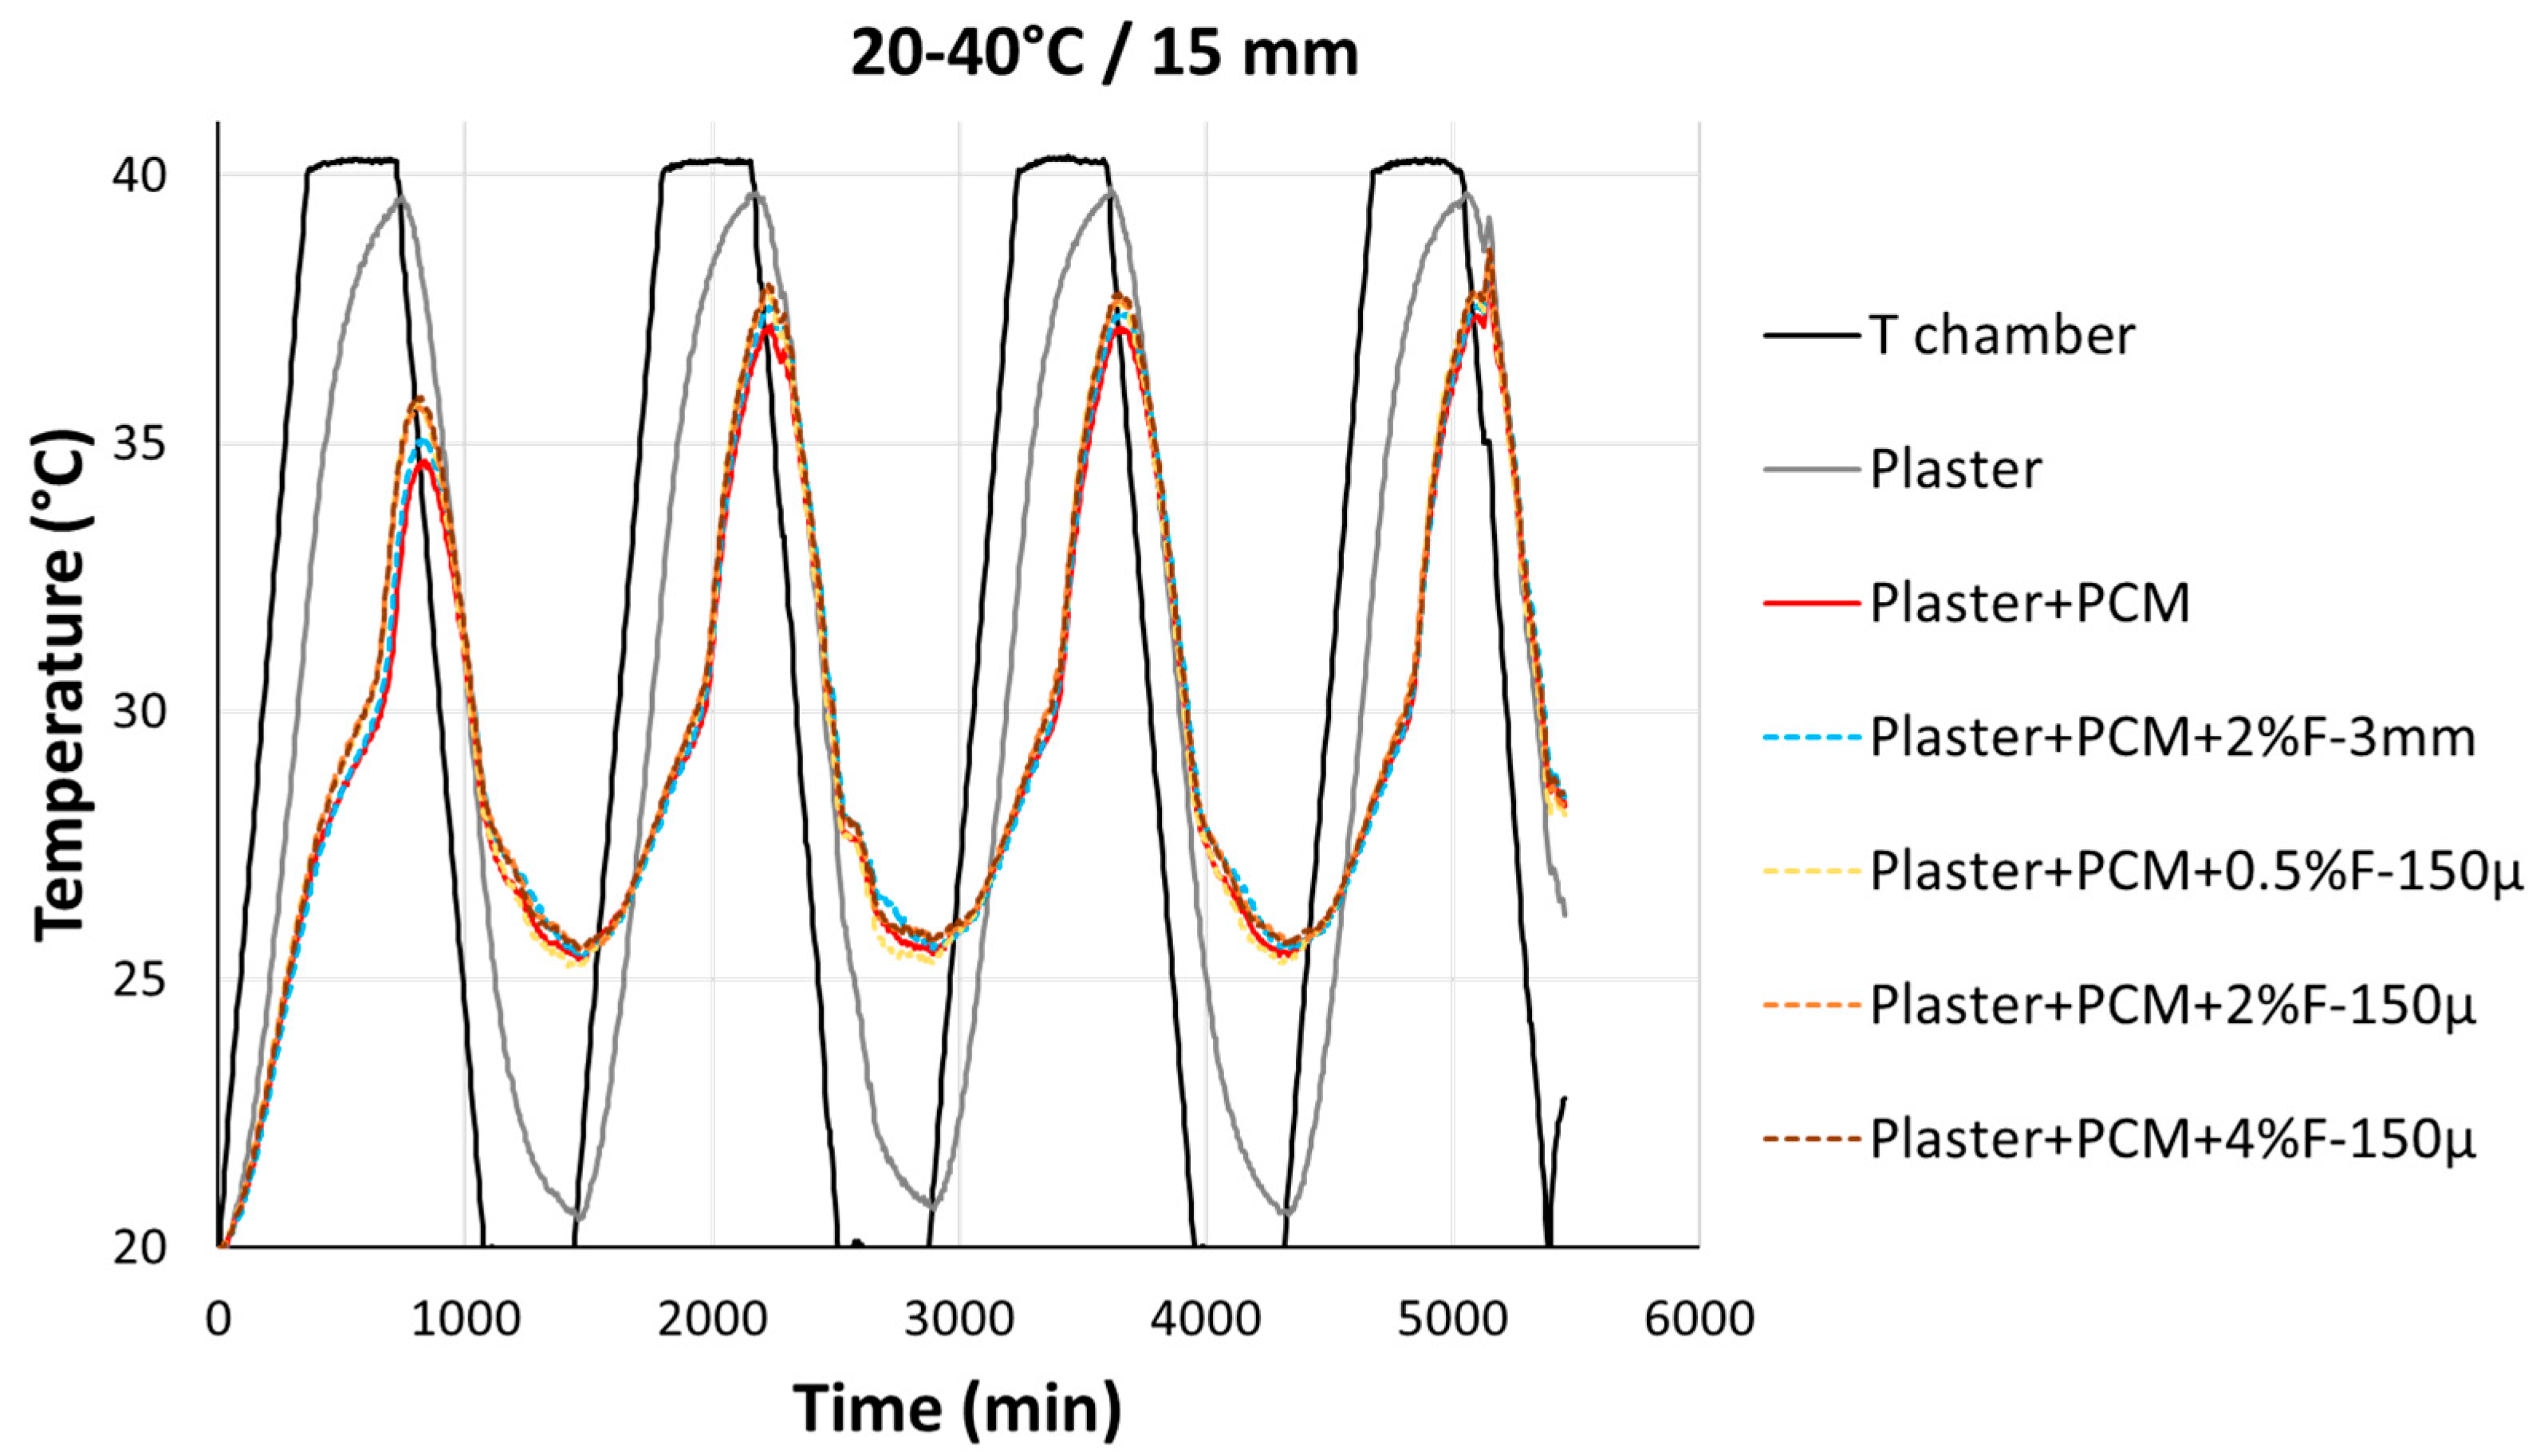
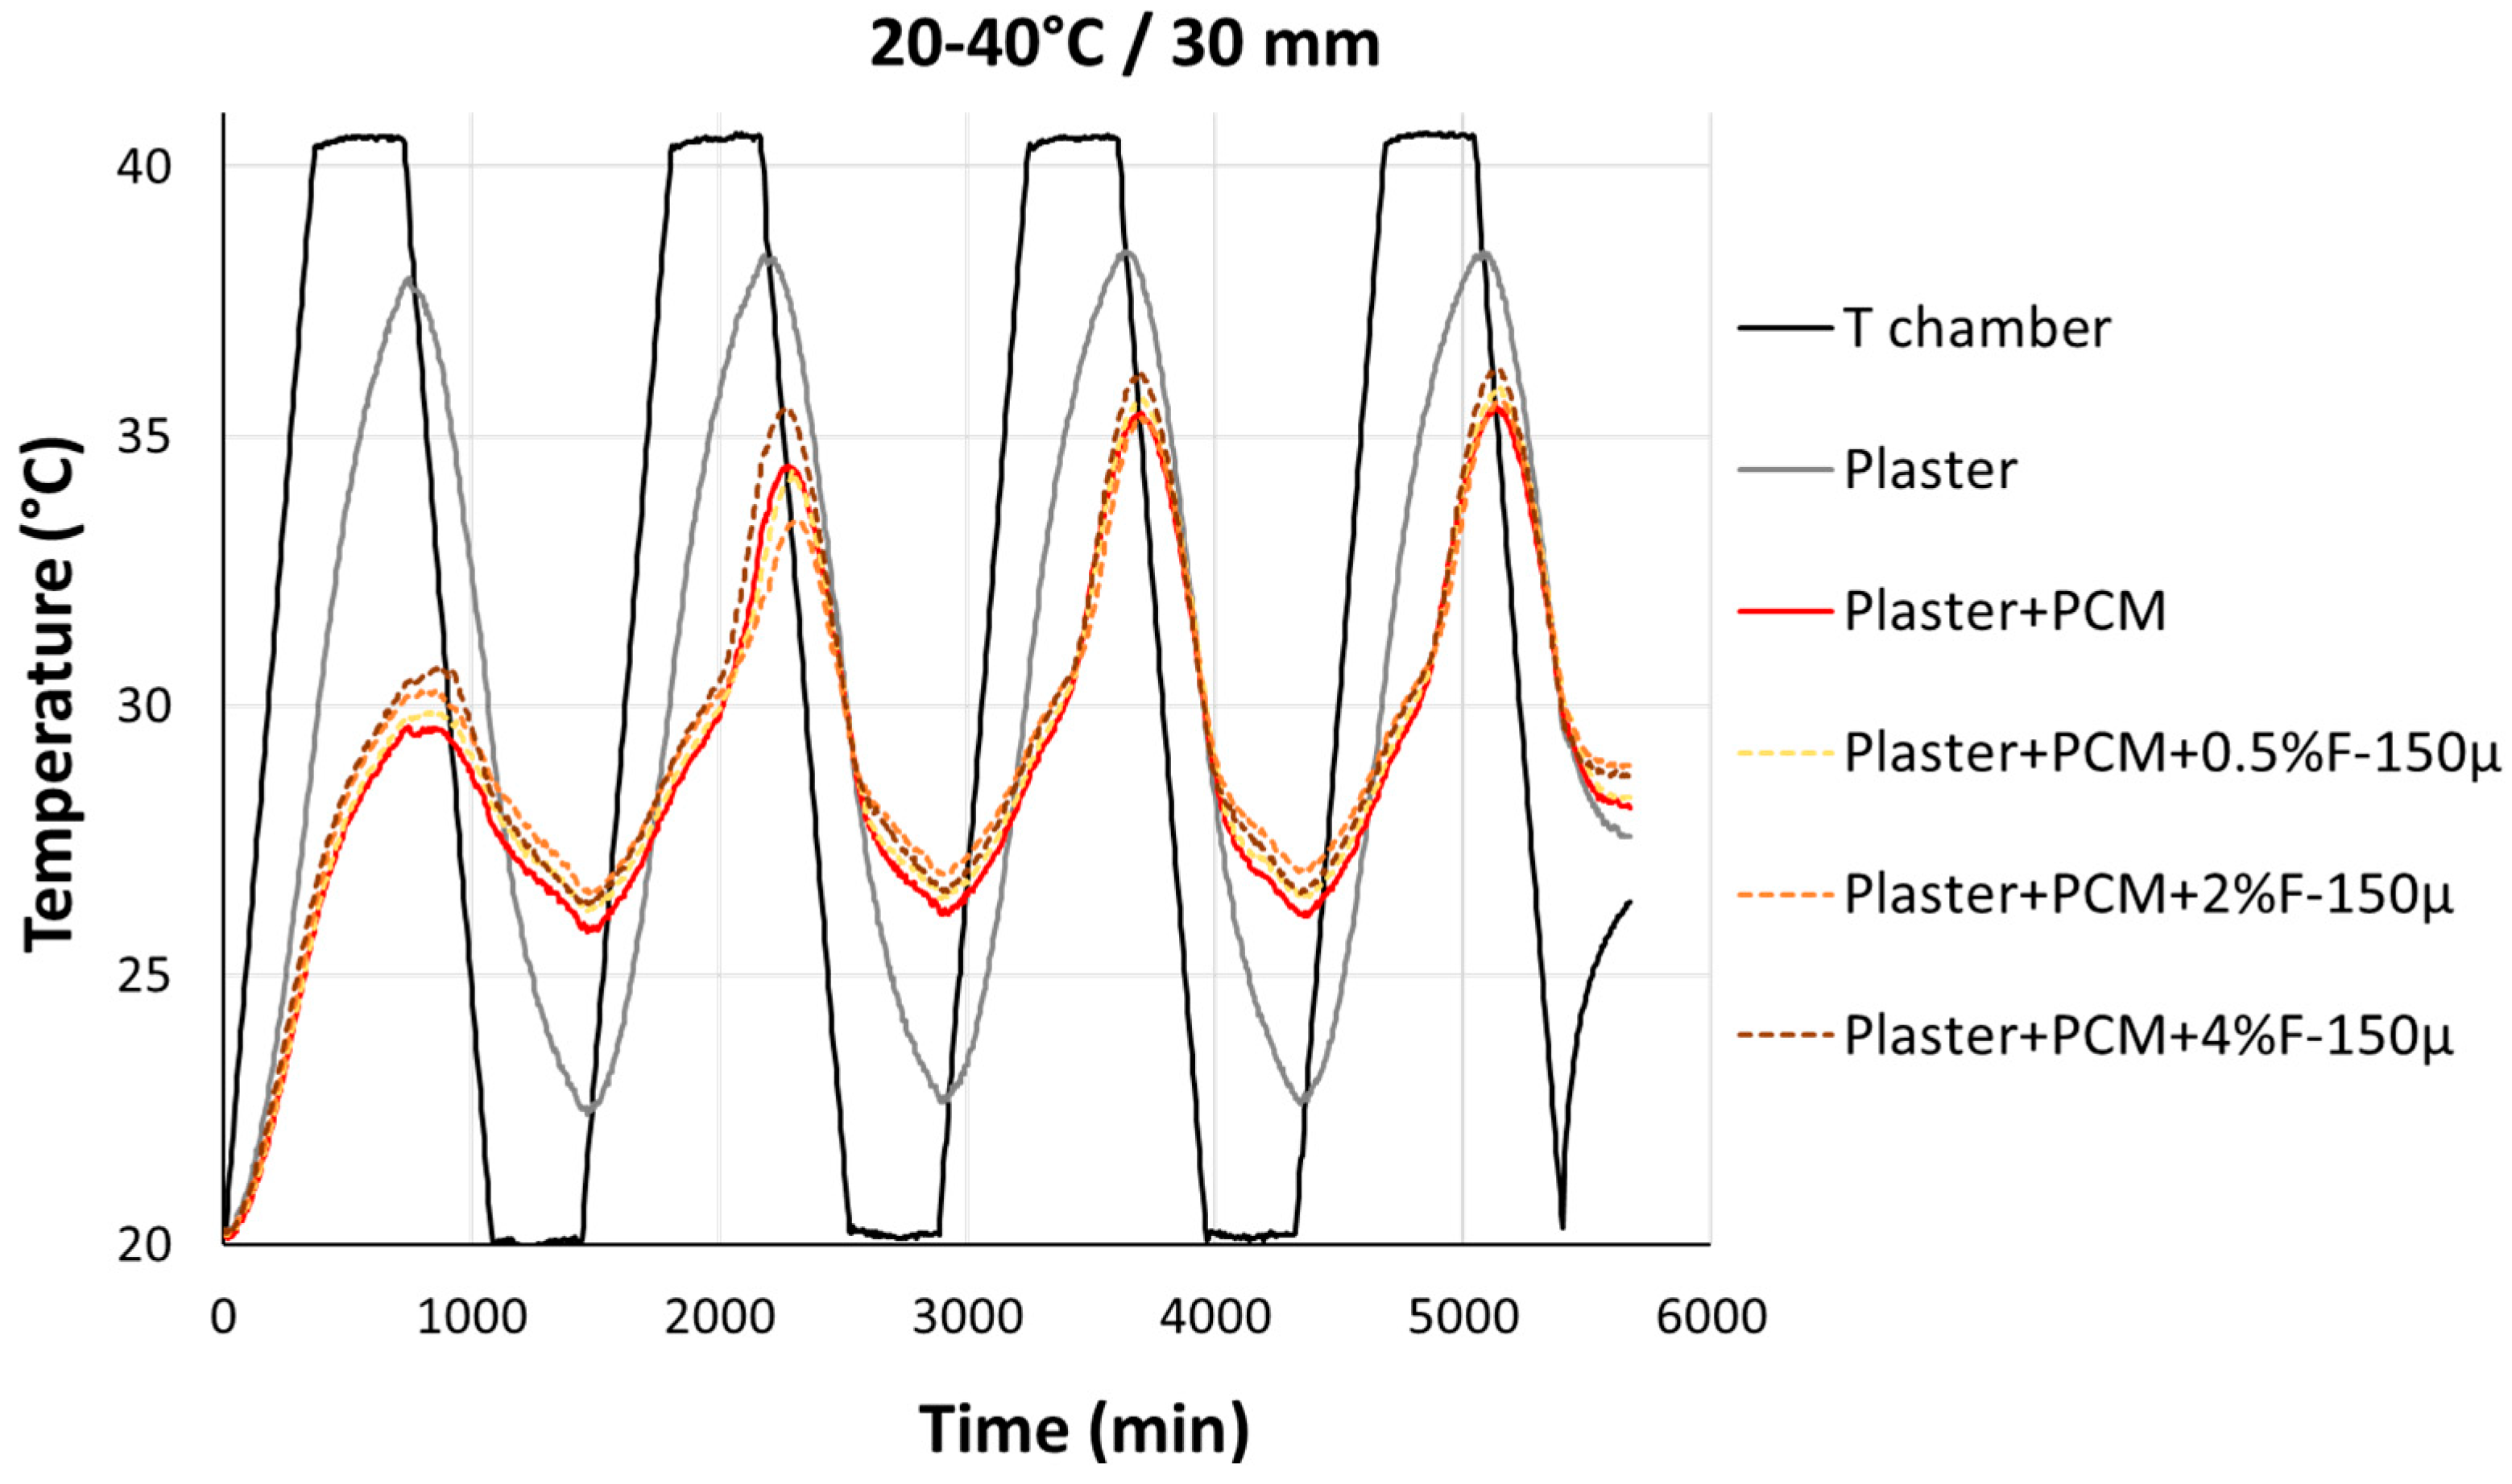
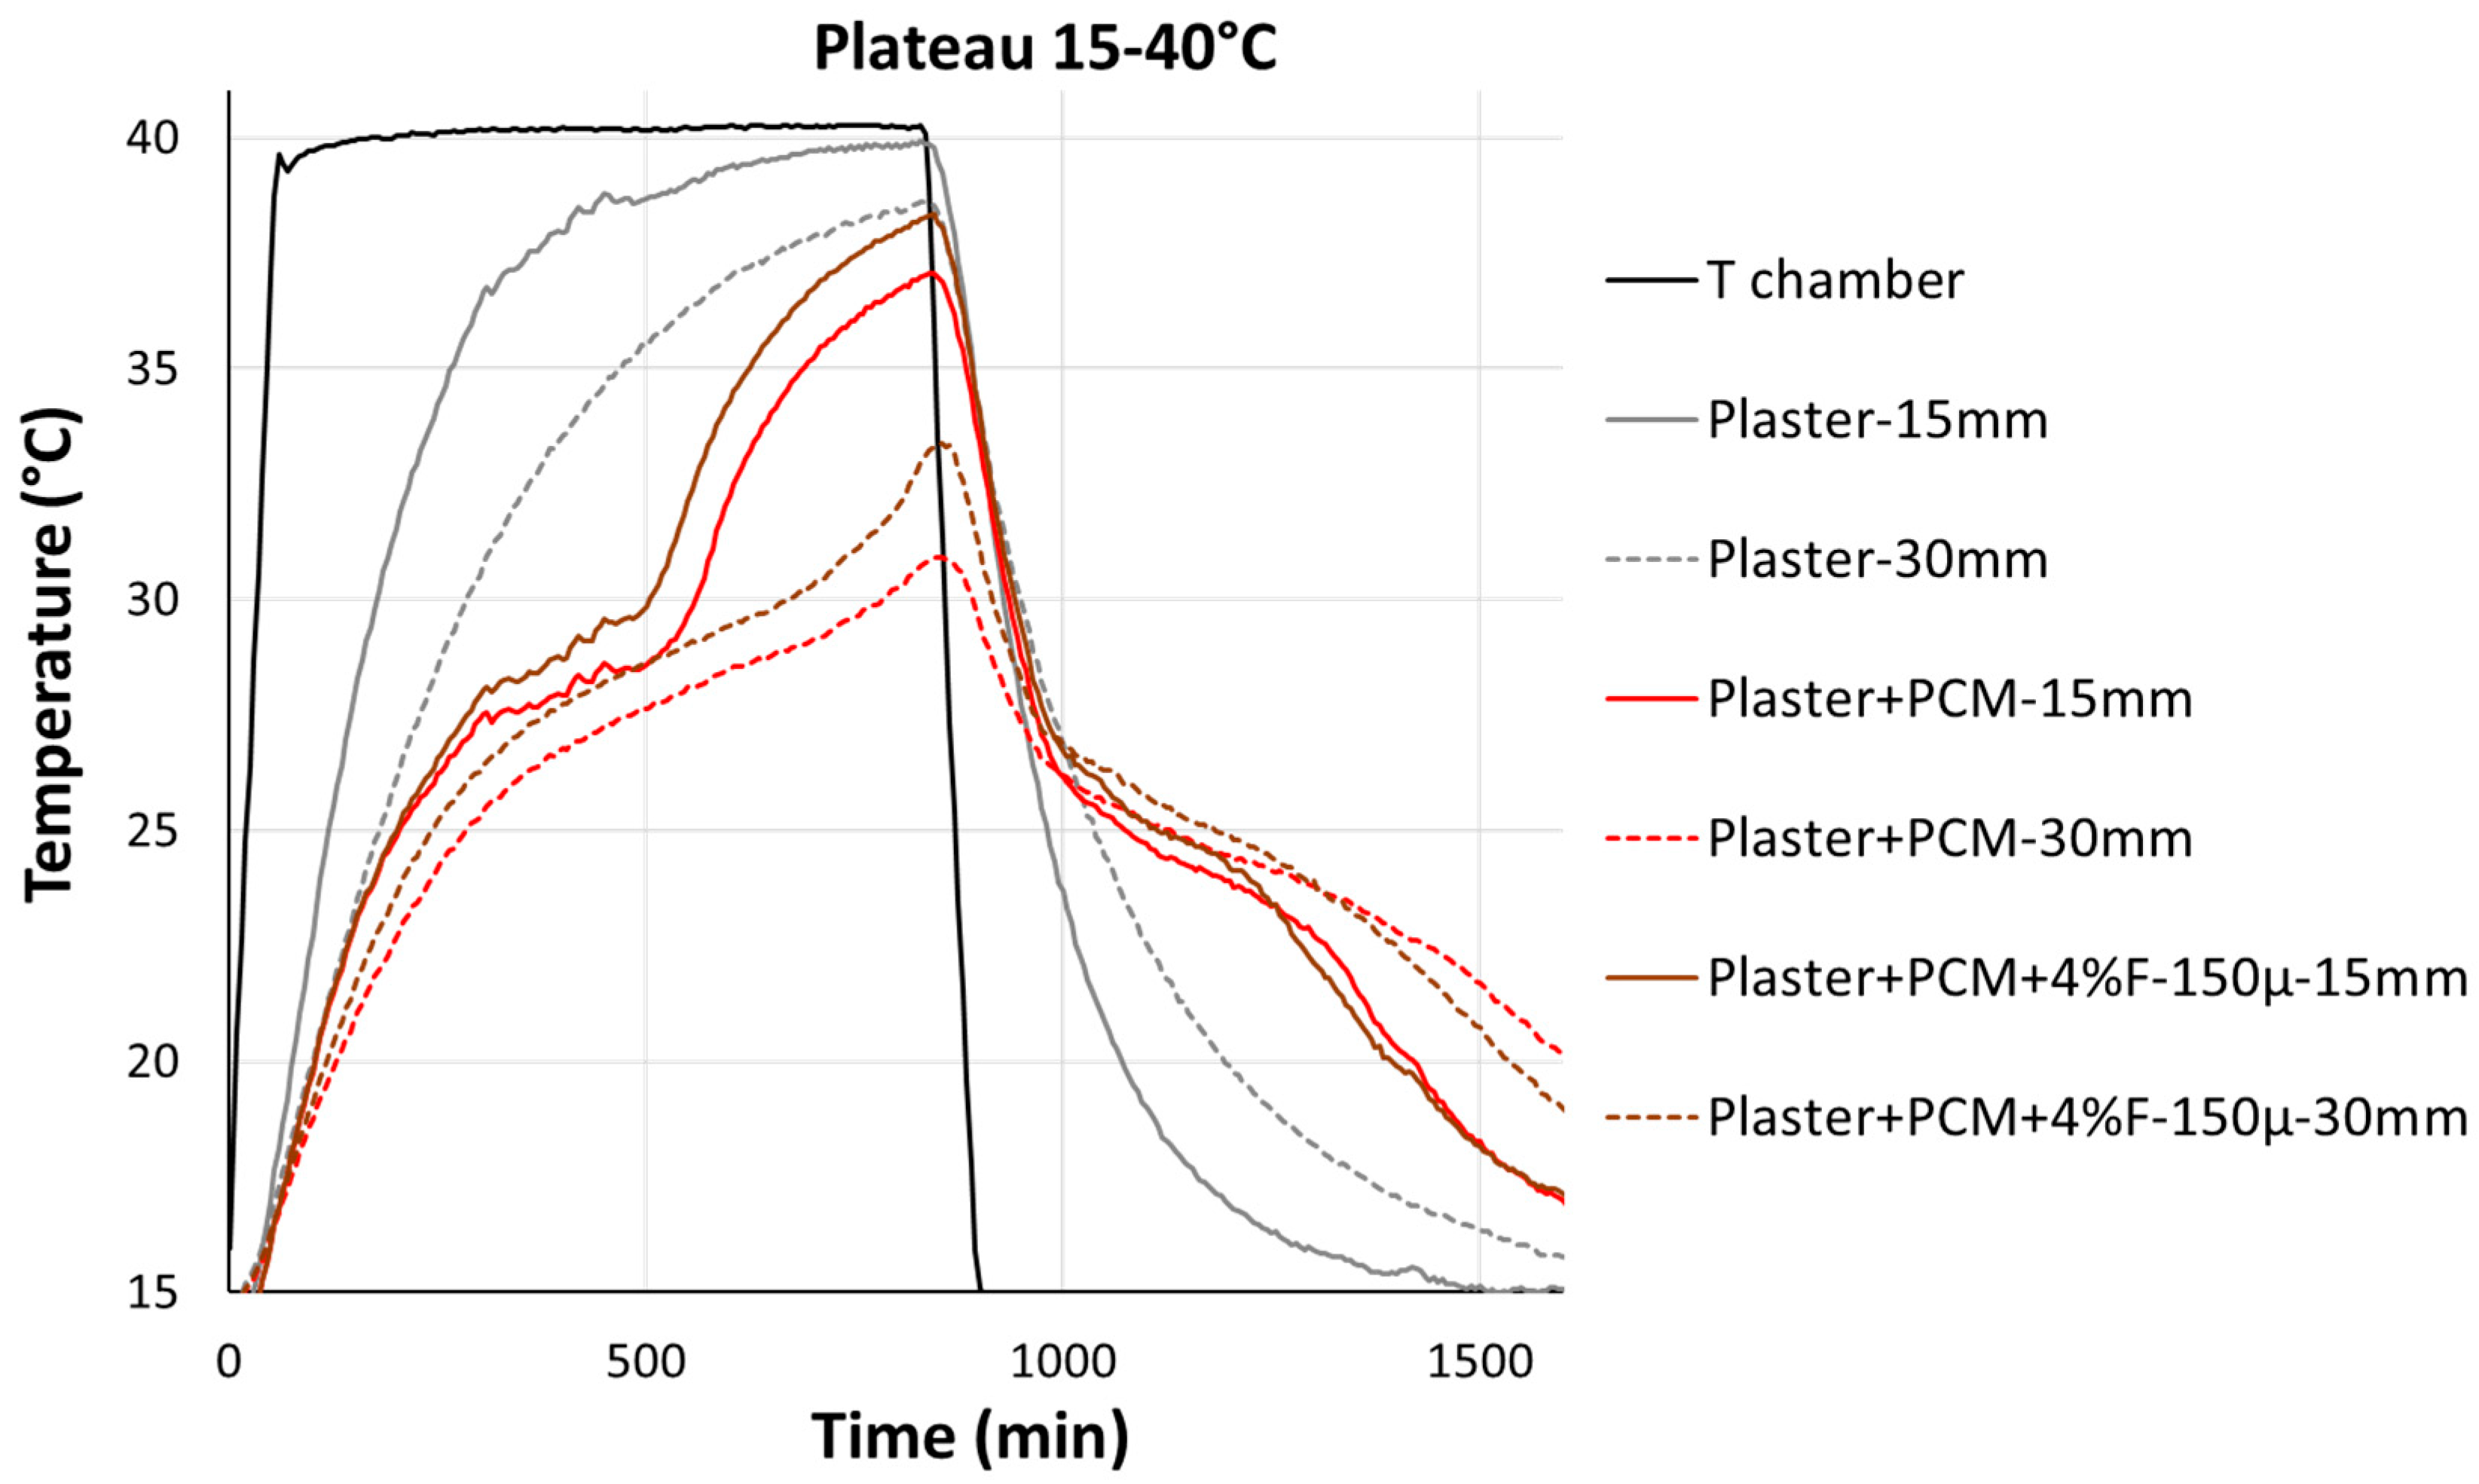
The climatic chamber tests were carried out according to the parameters described in Table 1. The tests were carried out with either “Cycles of cool nights and hot days”, “Cycles of temperate nights and hot days”, or “Plateau at T = 40 °C”. Before the tests, the samples were conditioned for 24 h at 15 °C in order to allow the complete regeneration of the PCM.
A first series of tests was carried out on the boxes with 15 mm thick walls. A second series of tests was carried out on the boxes with 30 mm thick walls. The composition with 3 mm carbon fibres was not tested for a wall thickness of 30 mm because the results obtained for the 15 mm thick walls were not significant and this composition did not seem interesting for future development, mainly because its setting time was too long (see Table 2). Graphical test results are shown in Figure 4, Figure 5, Figure 6, Figure 7 and Figure 8. Table 5 and Table 6 summarize the results obtained.
  • Cyclic tests
    Cycle: cool nights–hot days
The “Cool nights and hot days” cycles evaluated the performance of samples under conditions beneficial for the complete regeneration of the PCM after each cycle. Different trends were observed depending on the thickness of the walls.
For assemblies made with 15 mm thick walls (Figure 4), it was observed that all compositions containing PCM showed a significantly lower maximum temperature at the end of each cycle than for raw plaster (from 6.5 to 4.2 °C less). The trends were similar for all materials: the PCMs were completely deactivated after about 200 min while being held at 40 °C. Once deactivated, their temperatures rose with greater speed. The maximum and minimum temperatures of each material were very similar after each cycle, meaning that the PCMs were completely discharged and regenerated after each stage of the cycle. The PCMs were able to express their full potential but were unable to maintain the temperature within a comfortable range. Of note, the addition of carbon fibres did not lead to better performance. While the Plaster + PCM sample showed a 16% improvement, the sample with carbon fibres showed lower improvement values of 11%/12% (see Table 5). In addition, the Plaster + PCM sample had the highest thermal phase shift.
More marked differences were observed for cyclic tests performed with the assemblies with 30 mm thick walls (Figure 5). The curves highlighted that the PCMs could not express their full potential and were not completely discharged during the heating steps. Indeed, although the amount of PCM was doubled for similar indoor volumes, the improvement increased only by a maximum of 50% compared to the 15 mm thick boxes (Table 5). The step at T = 15 °C enabled the fractions of PCM that were discharged during the hot steps to regenerate almost completely. Of note, the maximum temperature values (Tmax) increased gradually with the number of cycles, but at a very slow rate (less than 1.2 °C between Tmax of the first cycle and Tmax fourth cycle). This increase was only due to the thermal stabilization of the material. The hypothesis of a degradation in the PCMs’ performance because of the number of cycles was rejected since these materials are known to be able to easily bear up to 200 cycles [39].
The use of thicker gypsum walls with PCMs makes it possible to keep the interior of the assemblies within a thermal comfort zone (22 to 27 °C), despite the strong thermal variations (15 to 40 °C). It is important to note that with this configuration, the addition of carbon fibres led to similar trends. The addition of carbon fibres did not improve the regeneration and discharge stages of the PCMs. On the contrary, their addition led to a higher maximum temperature of + 1.8 °C for the Plaster + PCM + 4%F-150 μ sample compared to the Plaster + PCM sample. Noticeably, in this case, the Plaster + PCM sample also had the longest thermal phase shift.
 
Cycle: temperate nights–hot days
The “Cycles of temperate nights and hot days” assessed the performances of the materials under conditions that were not optimal for a complete PCM regeneration after each cycle. It was also observed in this case that the most important difference was the thickness of the walls.
In the case of the 15 mm walls, a significant decrease in performance between the first cycle and the following ones was observed for all compositions containing PCMs (Figure 6). Indeed, the maximum temperature difference between the Plaster and Plaster + PCM samples was 4.6 °C for the first cycle and dropped to 1.9 °C by the fourth cycle. In this case, the presence of carbon fibres did not improve the regeneration or the discharge of the PCM.
Assemblies with 30 mm walls showed more marked differences for these test conditions (Figure 7). In this case, no samples showed a complete PCM regeneration after the first cycle. It can be noted that the addition of carbon fibres decreased the performance. Whereas the Plaster + PCM sample showed an improvement of 8% after four cycles, the Plaster + PCM + 0.5%F-150 μ sample showed, in contrast, an improvement of only 5% (Table 5).
  • Plateau at T = 40 °C
Tests with a Plateau at T = 40 °C were carried out on all boxes following the procedure in Table 1. All results are listed in Table 6. Although the tests were carried out for all the compositions, Figure 8 only shows the graphs obtained for the Plaster + PCM + 4%F-150 μ sample since it had the most notable differences. To allow for comparisons, the graphs of the Plaster and Plaster + PCM samples are added.
The results followed the trends observed in the cyclic tests. The PCMs in the boxes with 15 mm thick walls were deactivated faster (after ~400 min) than those in the 30 mm thick walls (after ~700 min). Also in this case, for both the 15 mm or 30 mm thick walls, the Plaster + PCM + 4%F-150 μ sample showed significantly higher maximum temperatures and a lower thermal phase shift than the Plaster + PCM sample.
Taking into account these results and the results presented for the cyclic tests, it can be concluded that, in the present study, the addition of carbon fibres was clearly not beneficial to the efficiency of plaster and PCM microspheres. It can be assumed that these poor performances were caused by the materials’ higher thermal conductivities, allowing external heat to diffuse more easily through the sample walls. This effect was observed for all samples with fibres. It is important to note that these observations contradict the results obtained by Zhang et al. [19,20]. In their first study, the authors showed that the addition of 1 wt.% carbon fibre increased thermal conductivity by 28% to 36% and allowed for a lower final temperature of 0.6 to 0.8 °C during plateau tests. In contrast, in the current study, thanks to the addition of carbon fibres, the Plaster + PCM + 4%F-150 μ sample had the highest increase in thermal conductivity (by 12%) but was also the one that showed the worst performance.
No interpretation was found to explain these discrepancies, but it should be noted that the materials and test procedures were slightly different between the studies. In the literature [19,20], the authors used diatomite, expanded graphite, and liquid paraffin combined with gypsum instead of PCM microspheres. Furthermore, the tests were carried out with an assembly where a single wall was tested, whose outer face was directly exposed to the air of the climatic chamber. The sample was, therefore, exposed to a strong convection movement of hot air. On the contrary, in the present study, the use of a glass tile on one side and a high-performance insulating material on the outer surfaces of the other walls suggests that the inside section of the walls was exposed only to conduction heat transfer. It is possible that an increase in thermal conductivity is beneficial in the case of convection heat transfer, but detrimental in the case of conductive heat transfer. This hypothesis could be reinforced by the fact that Oliver et al. [14] showed that for plasters containing 44 wt.% PCM, the air velocity increased the flow and exchange of energy with the material containing PCM. The author showed that a 0.5 m/s increase in air velocity theoretically allowed a 14% increase in stored energy.

4. Comparison with a Large-Scale Study

In this section, the results obtained from this laboratory-scale study were compared to a previous large-scale study in a house composed of two small rooms of 27 m3 (Figure 9). The study was carried out by Buildwise (ex-Belgium Building Research Institute) as part of the RETERMAT project [40]. The temperatures inside a room containing a conventional plaster render were compared to those inside a room with a render composed of plaster and PCM microspheres. The tests were carried out over two years, and the houses were located near Brussels (Belgium), with a southern exposure. A commercial product (Maxit Clima 23®, developed by Maxit Deutschland GmbH) made of a mixture of gypsum and 30 wt.% PCM microspheres was used.
It was observed that the maximum temperature difference between the room containing PCM and the reference room was ΔT = 1.28 °C. At the end of this study, and thanks to numerous measurements, a general relationship was established between the amount of PCM and the decrease in temperature. It was shown experimentally that for this case, with proper cooling ventilation at night, an amount of 100 kg of PCM microspheres led to a decrease in temperature of about 1.9 °C on hot days. However, many questions remained unanswered, especially concerning the correlation between the efficiency of the PCM and the size of the room. Since the materials and conditions had similarities with the current study (gypsum panels with PCM microspheres, no convection during testing), a relatively simple calculation was performed in order to identify trends and hypothesize the impact of the test’s scale.
The results in our laboratory study that came as close as possible to the conditions encountered in the large-scale study were those of the Plaster and Plaster + PCM samples shown in Figure 6. The different comparisons between our study and the large-scale study are listed in Table 7. In view of the various unknowns and assumptions, the results presented in this section can only be interpreted as trends and a general orientation rather than as absolute facts.
Three main observations can be made from the results listed in Table 7:
-
While the surface-to-volume ratio of the laboratory study was 25 times higher than for the large-scale study, the performance of the PCM only increased 2.6 times. Further studies should be conducted to determine whether this observation is still accurate for a significantly larger volume and what would happen if convective movements and/or air renewals were present.
-
For both systems, the main impact of the PCM was to regulate the temperature of the plaster. The regulation of the air temperature was negligible. In the case of the laboratory study, the thermal energy of the air represents only 0.4% of the total thermal energy absorbed by the PCM, and for the large-scale study, it represents only 15.4%. This observation is essential in the field of natural cooling with PCM materials. On one hand, it is possible to say that the large amount of energy required to cool gypsum plaster prevents effective air cooling. However, since gypsum plaster was cooled by the PCM microspheres, their addition could help to maintain thermal inertia in case of air renewal inside the room. In order to set apart these influences and obtain a better understanding of the whole mechanism of cooling of the PCM, further simulations as well as experimental tests should be carried out.
-
The total thermal energies absorbed by the PCM in kJ/kg are much lower than what can be observed in strictly theoretical studies. In the present study, they are around 10 kJ/kg and were about 3.8 kJ/kg in the large-scale study. In contrast, in the modelling of Oliver et al. [14], 15 mm thick plasterboard with 44 wt.% PCM reached a thermal energy storage of 35 kJ/kg. Since the tests in this study were performed under dynamic conditions, the thermal inertia of the glass tile in the laboratory and the brick walls in the large-scale study could be a reason for such large differences between theoretical and experimental values.

5. Conclusions

In this study, the influence of the addition of commercial carbon fibres on the performance of plaster containing 20 wt.% PCM microspheres was studied using laboratory preparations, characterizations, and experimental assemblies to simulate conditions close to reality. The influences of the length (3 mm or 150 μm) and additive amount (0.5 to 4 wt.%) of carbon fibres were studied. Characterizations were carried out during the preparations according to standards conventionally used in construction in order to provide a practical reference on the feasibility of the development of these materials.
With an adequate amount of fluidizing additive, the preparation of a material containing plaster, PCM microspheres, and short-length carbon fibres (150 μm) displayed suitable values for consistency, setting time, and shrinkage. On the contrary, the use of longer carbon fibres (3 mm) led to practical issues during the preparation and required an excessive amount of fluidizing additives. In this case, the large amount of additive had a negative influence on the implementation, mainly because it resulted in a too long initial setting time.
It was observed that the addition of 3 mm long carbon fibres significantly increased the mechanical properties (i.e., 200% increase in compression and 300% increase in bending). This was not the case for the 150 μm long fibres.
The different compositions were tested with an experimental installation that simulated cyclic conditions close to reality. These tests mainly showed the strong influence of the thickness of the walls (15 or 30 mm) and the temperature of the nights during the cycles. In the case of cycles of cool nights and hot days (15–40 °C), the PCMs were fully regenerated during each cycle. However, thanks to higher inertia, the assemblies with thick walls (30 mm) were the only ones able to maintain a comfortable temperature zone (22 to 27 °C). For cycles of temperate nights and hot days (20–40 °C), the PCM was not fully regenerated, and the systems became unbalanced after the first cycle.
The results of the present study obtained with carbon fibres were different from those observed in other studies in the literature. According to other publications, the addition of carbon fibres improved the thermal conductivity of plaster and PCM materials, which consequently improved the discharge/regeneration steps and energy storage. An opposite influence was observed in the present study. Though the addition of carbon fibres slightly increased thermal conductivities (from +8 to +12%), the thermal phase shift and maximum temperature were, however, less interesting. For both cyclic and plateau conditions, the expected improvement in the PCM’s regeneration potential with the addition of carbon fibres was not observed.
Two hypotheses could explain these discrepancies. Firstly, the materials in this study were not exactly the same as the ones used in the literature. Secondly, the experimental devices designed to recreate conditions close to reality were slightly different between the two studies. While, in the present study, the box assemblies were exposed to a heat transfer strictly caused by thermal conduction, in the literature, the box assemblies were exposed to both conduction and convection heat flows. In order to clarify their effects, it would be advisable for future studies to test samples either under strict conduction or convection or under simultaneous conduction and convection heat flows. In addition, it could also be advisable to study the influence of different types of carbon fibres with significantly different thermal conductivities (e.g., from 5 to 150 W/(m.K)) to determine the thermal conductivities of these fibres with precision.
In order to draw general trends, the results obtained in the present laboratory study were compared with a previous large-scale study. An estimation calculus showed that, despite a surface-to-volume ratio 25 times higher, the PCM efficiency in terms of energy storage was only increased by a factor of 2.6 between the laboratory study and the large-scale study. In both the laboratory and large-scale tests, the PCM storage process was mainly involved in maintaining the temperature of gypsum walls rather than the temperature of the air. Future modelling and experimental studies where the air is renewed inside the rooms could allow for assessing whether this effect is an asset or a drawback to maintaining the room temperature in a comfortable zone.

Author Contributions

Conceptualization, V.C. and S.C.; methodology, V.C. and S.C.; validation, V.C. and S.C.; formal analysis, S.H.; investigation, V.C.; resources, V.C.; data curation, V.C.; writing—original draft preparation, V.C.; writing—review and editing, V.C. and S.C.; visualization, V.C.; supervision, S.C.; project administration, V.C. and F.d.B.; funding acquisition, F.d.B. All authors have read and agreed to the published version of the manuscript.

Funding

Buildwise is thankful to Region Wallonne for their grant in the project RETERMAT under convention number 716707. Buildwise is thankful to the Region Wallonne and to the Fonds Européen de Développement Régional (FEDER) for their grant in the project S.T.O.C.C. included in the portfolio 500324-352426 and folder 3441.

Data Availability Statement

Data are contained within the article.

Conflicts of Interest

The authors declare no conflicts of interest.

References

  1. Drissi, S.; Ling, T.C.; Mo, K.H.; Eddhahak, A. A review of microencapsulated and composite phase change materials: Alteration of strength and thermal properties of cement-based materials. Renew. Sustain. Energy Rev. 2019, 110, 467–484. [Google Scholar] [CrossRef]
  2. D’Alessandro, A.; Pisello, A.L.; Fabiani, C.; Ubertini, F.; Cabeza, L.F.; Cotana, F. Multifunctional smart concretes with novel phase change materials: Mechanical and thermo-energy investigation. Appl. Energy 2018, 212, 1448–1461. [Google Scholar] [CrossRef]
  3. Cunha, S.; Sarcinella, A.; Aguiar, J.; Frigione, M. Perspective on the Development of Energy Storage Technology Using Phase Change Materials in the Construction Industry: A Review. Energies 2023, 16, 4806. [Google Scholar] [CrossRef]
  4. Saffari, M.; De Gracia, A.; Fernández, C.; Zsembinszki, G.; Cabeza, L.F. Study on the optimum PCM melting temperature for energy savings in residential buildings worldwide. IOP Conf. Ser. Mater. Sci. Eng. 2017, 251, 012113. [Google Scholar] [CrossRef]
  5. Zhao, C.Y.; Zhang, G.H. Review on microencapsulated phase change materials (MEPCMs): Fabrication, characterization and applications. Renew. Sustain. Energy Rev. 2011, 15, 3813–3832. [Google Scholar] [CrossRef]
  6. Tyagi, V.V.; Kaushik, S.C.; Tyagi, S.K.; Akiyama, T. Development of phase change materials based microencapsulated technology for buildings: A review. Renew. Sustain. Energy Rev. 2011, 15, 1373–1391. [Google Scholar] [CrossRef]
  7. Claude, V.; Charron, S.; de Barquin, F.; Dirkx, I. Microencapsulated Phase Changing Materials for Gypsum Plasters: A Practical Approach. Constr. Mater. 2021, 1, 188–202. [Google Scholar] [CrossRef]
  8. Lachheb, M.; Younsi, Z.; Naji, H.; Karkri, M.; Nasrallah, S.B. Thermal behavior of a hybrid PCM/plaster: A numerical and experimental investigation. Appl. Therm. Eng. 2017, 111, 49–59. [Google Scholar] [CrossRef]
  9. DeBarquin, F.; Flamant, G. Des enduits pour une climatisation douce ? CSTC Contact 2010, 27, 11–12. [Google Scholar]
  10. Klubal, T.; Ostrý, M.; Brzoň, R. Application of phase change materials to reduce the risk of overheating of building interior. Adv. Mater. Res. 2014, 899, 479–483. [Google Scholar] [CrossRef]
  11. Ostry, M.; Charvat, P. Materials for advanced heat storage in buildings. Procedia Eng. 2013, 57, 837–843. [Google Scholar] [CrossRef]
  12. Borreguero, A.M.; Garrido, I.; Valverde, J.L.; Rodríguez, J.F.; Carmona, M. Development of smart gypsum composites by incorporating thermoregulating microcapsules. Energy Build. 2014, 76, 631–639. [Google Scholar] [CrossRef]
  13. BASF. BASF Report; BASF: Ludwigshafen, Germany, 2007. [Google Scholar]
  14. Oliver, A. Thermal characterization of gypsum boards with PCM included: Thermal energy storage in buildings through latent heat. Energy Build. 2012, 48, 1–7. [Google Scholar] [CrossRef]
  15. Zhou, T.; Darkwa, J.; Kokogiannakis, G. Thermal evaluation of laminated composite phase change material gypsum board under dynamic conditions. Renew. Energy 2015, 78, 448–456. [Google Scholar] [CrossRef]
  16. Cui, H.; Liao, W.; Mi, X.; Lo, T.Y.; Chen, D. Study on functional and mechanical properties of cement mortar with graphite-modified microencapsulated phase-change materials. Energy Build. 2015, 105, 273–284. [Google Scholar] [CrossRef]
  17. Tavman, I.H. Preparation and Characterization of Conductive Polymer Nanocomposites Based on Ethylene–Vinylacetate Copolymer (EVA) Reinforced with Expanded and Unexpanded Graphite. Adv. Mater. Res. 2015, 1114, 92–99. [Google Scholar] [CrossRef]
  18. Newcomb, B.A. Processing, structure, and properties of carbon fibers. Compos. Part A. Appl. Sci. Manuf. 2016, 91, 262–282. [Google Scholar] [CrossRef]
  19. Zhang, B.; Tian, Y.; Jin, X.; Lo, T.Y.; Cui, H. Thermal and Mechanical Properties of Expanded Graphite/Paraffin Gypsum-Based Composite Material Reinforced by Carbon Fiber. Materials 2018, 11, 2205. [Google Scholar] [CrossRef]
  20. Zhang, B.; Yang, H.; Xu, T.; Tang, W.; Cui, H. Mechanical and thermo-physical performances of gypsum-based pcm composite materials reinforced with carbon fiber. Appl. Sci. 2021, 11, 468. [Google Scholar] [CrossRef]
  21. Pettit Moussally, S.; Le Bacle, C.; Vincent, R.; Guimon, M.; Roos, F. Fibres de carbone et graphite, Fiche INRS. Doc. Pour Le Médecin Du Trav. 2002, 92, 353–368. [Google Scholar]
  22. Khizhnyak, P.E.; Chechetkin, A.V.; Glybin, A. Thermal conductivity of carbon black. Inzhenerno-Fiz. Zhurnal 1980, 37, 1073–1075. [Google Scholar] [CrossRef]
  23. Guglhoer, T.; Korkisch, M.; Sause, M.G.R. Influence of carbon fibres on the crystallinity of polyamide-6. In Proceedings of the 20th International Conference on Composite Materials, Copenhagen, Denmark, 19–24 July 2015. [Google Scholar]
  24. Toppi, T.; Mazzarella, L. Gypsum based composite materials with micro-encapsulated PCM: Experimental correlations for thermal properties estimation on the basis of the composition. Energy Build. 2013, 57, 227–236. [Google Scholar] [CrossRef]
  25. Collepardi, M. Scienza e Tecnologia del Calcestruzzo; U. Hoepli: Milano, Italy, 1987. [Google Scholar]
  26. EN 13279-2; Gypsum Binders and Gypsum Plasters—Part 2: Test Methods. iTeh: Etobicoke, ON, Canada, 2014.
  27. EN 1015-6; Methods of test for mortar for masonry—Part 6: Determination of Bulk Density of Fresh Mortar. iTeh: Etobicoke, ON, Canada, 1998.
  28. ETAG 004; Guideline for European Technical Approval of External Thermal Insulation Composite Systems with Rendering. EOTA: Brussels, Belgium, 2000.
  29. EN 13872-1; Method of Test for Smoothing and/or Levelling Compounds—Determination of Shrinkage. European Standards: Pilsen, Czech Republic, 2004.
  30. NBN EN 1946-3; Thermal Performance of Building Products and Components—Specific Criteria for the Assessment of Laboratories Measuring Heat Transfer Properties—Part 3: Measurements by Heat Flow Meter Method. iTeh: Etobicoke, ON, Canada, 1999.
  31. EN 12667; Thermal Performance of Building Materials and Products—Determination of Thermal Resistance by Means of Guarded Hot Plate and Heat Flow Meter Methods—Products of High and Medium Thermal Resistance. iTeh: Etobicoke, ON, Canada, 2001.
  32. Raja, M.A.; Sophia, M. Influence of Expansive Agent on the Dimensional Stability and Mechanical Properties of Gypsum Plaster. Int. J. Recent. Technol. Eng. 2019, 8, 928–931. [Google Scholar] [CrossRef]
  33. Bajare, D.; Kazjonovs, J.; Korjakins, A. The thermal characteristics of gypsum boards with phase change materials (PCM). Vide Tehnol. Resur. Environ. Technol. Resour. 2011, 2, 132–138. [Google Scholar] [CrossRef]
  34. Bajare, D.; Kazjonovs, J.; Korjakins, A. Development of latent heat storage phase change material containing plaster. Medziagotyra 2016, 22, 94–97. [Google Scholar] [CrossRef]
  35. SGL Properties. Available online: https://www.sglcarbon.com/en/markets-solutions/material/sigrafil-short-carbon-fibers/ (accessed on 19 October 2023).
  36. Krause, B.; Rzeczkowski, P.; Pötschke, P. Thermal conductivity and electrical resistivity of melt-mixed polypropylene composites containing mixtures of carbon-based fillers. Polymers 2019, 11, 1073. [Google Scholar] [CrossRef] [PubMed]
  37. MikroCapsPCM25-S50 Technical Data; MikroCaps: Ljubljana, Slovenia, 2019.
  38. Weber, R.; Freitag, C.; Kononenko, T.V.; Hafner, M.; Onuseit, V.; Berger, P.; Graf, T. Short-pulse Laser Processing of CFRP. Phys. Procedia 2012, 39, 137–146. [Google Scholar] [CrossRef]
  39. da Cunha, S.R.L.; de Aguiar, J.L.B. Phase change materials and energy efficiency of buildings: A review of knowledge. J. Energy Storage 2020, 27, 101083. [Google Scholar] [CrossRef]
  40. Larnicol, M. 2014 Confort Thermique: Un Avenir Pour les Matériaux à Changement de Phase? Available online: https://fdocuments.fr/document/confort-thermique-un-avenir-pour-les-materiaux-a-changement-de-phase-par-maiwenn-larnicol-liege-creative-241014.html (accessed on 19 October 2023).
Figure 1. Diagram of the boxes created as part of the experimental tests in climatic chambers.
Constrmater 04 00009 g001
Figure 2. Electron microscopy observations: (a) PCM microcapsules; (b) 150 μm carbon fibre; (c) 3 mm carbon fibre.
Constrmater 04 00009 g002
Figure 3. Shrinkage curves for samples conditioned at T = 23 °C/RH = 50%.
Constrmater 04 00009 g003
Figure 4. Cyclic test, cool nights and hot days, thickness of 15 mm.
Constrmater 04 00009 g004
Figure 5. Cyclic test, cool nights and hot days, thickness of 30 mm.
Constrmater 04 00009 g005
Figure 6. Cyclic test, temperate nights and hot days, thickness 15 mm.
Constrmater 04 00009 g006
Figure 7. Cyclic test, temperate nights and hot days, thickness of 30 mm.
Constrmater 04 00009 g007
Figure 8. Test with a Plateau, 15–40 °C, thicknesses of 15 and 30 mm.
Constrmater 04 00009 g008
Figure 9. Diagram and photo of the houses used in a previous large-scale study (RETERMAT project, Buildwise) [40]. (Left) 3D scheme of the house and position of sensors. (Right) Picture of the houses.
Constrmater 04 00009 g009
Table 1. Parameters of experimental tests in climatic chambers.
Designation of the TestTest Settings
“Cycles cool nights/hot days”4 cycles, each consisting of 4 steps:
-
Gradual increase from 15°C to 40 °C for 6 h;
-
Hold at 40 °C for 6 h;
-
Gradual decrease from 40 °C to 15 °C for 6 h;
-
Hold at 15 °C for 6 h.
“Cycles temperate nights/hot days”4 cycles, each consisting of 4 steps:
-
Gradual increase from 20 °C to 40 °C for 6 h;
-
Hold at 40 °C for 6 h;
-
Gradual decrease from 40 °C to 20 °C for 6 h;
-
Hold at 20 °C for 6 h.
“Plateau at T = 40 °C”Sudden increase from 15 to 40 °C in 1 h (0.4 °C/min);
-
Hold at 40 °C for 13 h;
-
Sudden decrease from 40 to 15 °C in 1 h (0.4 °C/min);
-
Hold at 40 °C for 13 h;
-
Sudden decrease to 15 °C;
-
Hold at 15 °C for 12 h.
Table 2. Quantities involved in the preparation of the different compositions and properties of fresh mixtures.
Sample NamePlaster (g)Water (g)Dispersion of Water-Based PCM (g)Fibre (g)V Additive (mL)Consistency (mm)Setting Time (min)Density of Fresh Mixture (g/L)
Initial
(22 mm)
Final
(40 mm)
Plaster10062---1651022001305
Plaster + PCM (test)
(Orientation test without additive)
803846.5--100---
Plaster + PCM803846.5-0.91651153801283
Plaster + PCM + 2%-3 mm (test)
(Orientation test with 0.9 mL of additive)
783846.520.9113<60110-
Plaster + PCM + 2%-3 mm783846.523.251613904601250
Plaster + PCM + 0.5%-150 μ79.53846.50.52.51741955101324
Plaster + PCM + 2%-150 μ783846.522.51771853601241
Plaster + PCM + 4%-150 μ763846.542.51591653201218
-: No data.
Table 3. Bulk densities, resistance to bending, and compression of samples after conditioning.
MaterialsBulk Density
(kg/m3)
Flexural Strength
(N/m2)
Compressive Strength (N/m2)
Plaster9782.173.42
Plaster + PCM10231.791.62
Plaster + PCM
(theoretical value)
842 1//
Plaster + PCM + 2%-3 mm10415.383.26
Plaster + PCM + 0.5%-150 μ9771.681.42
Plaster + PCM + 2%-150 μ10232.211.92
Plaster + PCM + 4%-150 μ9571.691.53
1 The theoretical bulk density was calculated using the gypsum and PCM percentages for the sample Plaster + PCM and the values for raw plaster and PCM microcapsule densities separately.
Table 5. Results obtained for cyclic tests in climatic chambers.
Type of TestThicknessPlasterPlaster + PCMPlaster + PCM
+ 2%F-3 mm
Plaster + PCM
+ 0.5%F-150 μ
Plaster + PCM
+ 2%F-150 μ
Plaster + PCM
+ 4%F-150 μ
TmaxTmaxImprovement (%)TmaxImprovement (%)TmaxImprovement
(%)
TmaxImprovement (%)TmaxImprovement (%)
15–40 °C15 mm39.432.91634.81235.11135.21135.111
30 mm36.128.322//29.61829.91730.117
20–40 °C15 mm39.537.2637.8437.8437.8438.04
30 mm38.235.38//36.0635.6736.25
Note: The % of improvement is calculated in comparison to the values obtained for the Plaster reference sample.
Table 6. Results obtained for tests with a plateau.
ThicknessPlasterPlaster + PCMPlaster + PCM
+ 2%F-3 mm
Plaster + PCM
+ 0.5%F-150 μ
Plaster + PCM
+ 2%F-150 μ
Plaster + PCM
+ 4%F-150 μ
TmaxTmaxImprovement (%)Phase Shift
(min)
TmaxImprovement (%)Phase Shift
(min)
TmaxImprovement (%)Phase Shift
(min)
TmaxImprovement (%)Phase Shift
(min)
TmaxImprovement (%)Phase Shift
(min)
15 mm39.937.5638537.6636538.0532038.2432038.34330
30 mm38.531.020495/30.92049031.01945033.413375
Note: Thermal phase shift is measured at T = 30 °C. The % of improvement is calculated compared to the sample of reference Plaster.
Table 7. Comparisons between the results obtained for the present laboratory study and a previous large-scale study.
PropertiesLaboratory StudyLarge-Scale Study
Amount of PCM (kg)0.671.6
Amount of gypsum (kg)2.4167.1
Room volume (m3)0.00827
Wall area (m2)0.227
Ratio wall area/volume (m−1)251
Maximum indoor air difference temperature, ΔT (°C)2.301.28
Thermal energy of the air absorbed by PCM, QAir = mAir. CpAir.ΔT (Joules)2342,505
Thermal energy of the plaster absorbed by PCM, QPlaster = mPlaster.CpPlaster.ΔT (Joules)6006232,710
Total thermal energy absorbed by PCM, QTotal = QPlaster + QAir (Joules)6029275,215
Total thermal energy absorbed by PCM per 1 kg of PCM (Joules/kg)10,0473844
Efficacy ratio between the laboratory study and the large-scale study2.6
Note: With CpAir = 1004 J/kg.K, ρAir = 1225 kg/m3, CpPlaster = 1088 J/kg.K, ρPlaster = 1000 kg/m3. For these calculations, it is assumed that the temperature of the gypsum was the same as the air. In view of the various unknowns, these calculations must be interpreted in a relative way and not an absolute way.
Disclaimer/Publisher’s Note: The statements, opinions and data contained in all publications are solely those of the individual author(s) and contributor(s) and not of MDPI and/or the editor(s). MDPI and/or the editor(s) disclaim responsibility for any injury to people or property resulting from any ideas, methods, instructions or products referred to in the content.

