Article

Impact of Crushed Natural and Recycled Fine Aggregates on Fresh and Hardened Mortar Properties

Institute of Construction Material Technology, Department of Civil Engineering, RPTU University of Kaiserslautern-Landau, 67663 Kaiserslautern, Germany
*
Author to whom correspondence should be addressed.
Constr. Mater. 2024, 4(1), 37-57; https://doi.org/10.3390/constrmater4010003
Submission received: 8 November 2023 / Revised: 16 December 2023 / Accepted: 21 December 2023 / Published: 23 December 2023

Abstract

:
Increasing the amount of crushed natural and recycled fine aggregates in mortar and concrete can help to reduce depletion of resources and increase the recycling rate of construction and demolition waste. Differences in particle morphology influence fresh and hardened mortar and concrete properties. The quantitative assignment of this impact to specific characteristics, such as shape or angularity in differentiation to other mix design parameters, is currently scarcely known. Therefore, a multiple linear regression analysis was performed to investigate the impact of crushed natural and recycled fine particles on rheological and strength properties of mortar. The emphasis lies on the impact of differences in shape and angularity, which were quantified by the three-dimensional particle representation obtained from micro-computed tomography. A total of 160 mortar mixtures containing 5 sands of different origins and varying water-to-cement ratios, binder-to-aggregate ratios, and shapes of grading curves were produced. The results indicate that the particle shape and angularity of the crushed natural and recycled fine aggregates had a complex impact on fresh and hardened mortar properties and interacted with other mix design parameters. Careful composition of the aggregate fraction with respect to shape and angularity and their interaction with mix design parameters is necessary to maintain sufficient mortar properties.

1. Introduction

Fine and coarse aggregates cover the largest volume fraction of mortar and concrete compositions used in construction. However, depletion of natural sand resources imposes several risks to the environment, such as erosion and decreasing biodiversity [1,2]. In addition, the exploitable availability of natural sand resources is low in some countries [3]. Crushed natural and recycled sands, which are by-products of crushed stone production or the process of recycling construction and demolition waste, could serve as an alternative [3,4].
Crushed sands differ from natural sands in terms of particle shape, mineral composition, chemical interaction with the surrounding binder, and the number of fine aggregates [5,6]. Differences in particle shape and angularity result from the crushing process in particular [7]. In comparison to natural sand, these crushed sands have a different particle shape, impacting fresh and hardened mortar and concrete properties. Particle shape in general is known to have a decisive influence on rheological and strength properties. Several studies have observed that the use of angular crushed aggregates, as opposed to rounded natural aggregates, results in a change in plastic viscosity and yield stress. While performing rheological measurements on mortars, Westerholm et al. [5] observed an increase in plastic viscosity and yield stress when analyzing mortars with crushed fine aggregates in comparison to natural fine aggregates. Among others, the shape of particles was determined by the ratio of the shortest to longest axis of an equivalent-area ellipse based on two-dimensional (2D) images. A decrease in particle roundness from 0.59 to 0.41 resulted in a pronounced increase in plastic viscosity by a factor of 2.7 and a moderate increase in yield stress. However, the impact of particle angularity was not quantified in the study. Therefore, it was not possible to differentiate between shape and angularity.
Cordeiro et al. [8] analyzed both particle shape by sphericity and angularity based on 2D images. Both morphological indicators were calculated as mean values from only 30 selected particles of one natural sand and one crushed granite sample. Using different replacement rates of natural sand with fine granite aggregates resulted in concrete mixtures with varying morphological characteristics of the aggregate fraction. The results show that a replacement of natural sand with a sphericity index of 0.88 and a roundness index of 0.68 with fine granite aggregates with a sphericity index of 0.66 and a roundness index of 0.44 caused an increase in plastic viscosity by a factor of 1.7 and a decrease in yield stress by a factor of 0.9. However, tracing these effects back to either sphericity or angularity was not part of the study.
For super-workable concrete, Aissoun et al. [9] analyzed the impact of the differences in morphological characteristics of rounded and crushed coarse aggregates on rheological and strength properties. The morphological differences between those aggregates were not quantified but were described based on visual impressions. Only the number of flat and elongated particles was quantitatively provided based on gauge measurements. They observed an increase in plastic concrete viscosity by a factor of 1.3 and an increase in yield stress by a factor of 2.5, resulting from a 22% to 31% increase in the number of flat and elongated particles. Replacing rounded coarse aggregates with crushed aggregates resulted in an increase in plastic viscosity by a factor of up to 1.48 and a moderate increase in yield stress by a factor of 1.06. However, morphological characteristics of different aggregates were not quantified and grading curves were not uniform among the different materials used. Therefore, assigning a certain proportion of the impact that the crushed aggregates had on concrete rheology to morphological characteristics like shape or angularity was impossible.
For mortars with varying binder content, Ren et al. [7] showed that replacing glass beads characterized by low angularity and high sphericity with crushed sand with higher angularity and a less spherical particle shape resulted in an increase in relative plastic viscosity by a factor of up to 6 depending on the fraction size of the particle used. For their study, they quantified particle shape and angularity based on digital image analysis using 2D microscopic pictures of different aggregate samples. In addition to the kind of aggregates used, the sieve size fraction of the particles varied, which made differentiating between the particle shape and the particle size effect difficult.
Based on 2D images of particles in combination with digital image analysis, Zhao et al. [10] quantified several morphological parameters of three different coarse aggregate samples. Among others, roundness was characterized by the comparison of the projection area to the perimeter of the particle projection and sphericity was determined based on the similarity between the three particle dimensions and a sphere. They analyzed five concrete mixtures containing an aggregate fraction with different morphological properties composed of the three analyzed particle samples. A change from ellipsoidal aggregates with a roundness of 0.072 and a sphericity of 0.714 to more angular aggregates with a roundness of 0.05 and a sphericity of 0.62 resulted in a decrease in plastic viscosity by a factor of approximately 0.7 and an increase in yield stress by a factor of around 1.6. A limitation of this study is, however, the low number of concrete mixtures analyzed. This did not allow the cause of the observed effect of the morphological characteristics of the aggregate fraction to be identified in terms of the differentiation between angularity and other shape parameters.
In addition to fresh mortar and concrete properties, particle shape also has an influence on hardened properties like compressive and flexural strength. The above-mentioned study by Zhao et al. [10] also showed that more angular aggregates resulted in an increase in compressive strength by a factor of up to 1.1 and in flexural strength by a factor of approximately 1.25. Within their study, Aissoun et al. [9] observed an increase in compressive strength by a factor of 1.1 when incorporating crushed instead of rounded coarse aggregates for super-workable concrete. With respect to compressive and flexural strength, the study by Donza et al. [11] on concretes produced with fine aggregates of different material origin showed an increase in compressive strength by a factor of 1.1 and a similar range of increase for flexural strength when replacing rounded river sand with crushed granite fine aggregates. But, due to the limited number of concrete mixtures and the visual classification of aggregate shape and angularity, a quantitative relationship between changes in morphological characteristics of aggregates and concrete strength could not be drawn, except that the angularity flakiness had an influence on the compressive strength. To isolate the particle shape effect, Polat et al. [12] manually sorted gravel particles into the categories of spherical, elongated, and flat before concrete production. The mean flakiness of a particle sample was afterwards determined via 2D images from two sides of the particle and digital image processing as the ratio of thickness to width, whereas elongation was characterized by the ratio of width to length. Concrete with flat particles showed a decrease in compressive strength by a factor of 0.80 in comparison to concrete with spherical particles. When incorporating elongated instead of spherical particles, the compressive strength decreased by a factor of 0.83. Difficulties lay in the delimitation of those results to other parameters such as roundness or grading curve, which changed when sorting the gravel aggregates into groups.
This summary of the results of several studies analyzing the impact of morphological particle characteristics on rheological and strength properties of mortar or concrete shows that, in part, contradictory observations have been made. Comparison of the observed impacts is complicated by the difficulty of quantitatively describing the morphological parameters of aggregates, as well as assigning effects to either particle shape or angularity, and the differentiation between different mixture parameters such as binder content remains unclear.
Laboratory procedures exist to characterize particle characteristics like flakiness according to EN 933-3 [13] or elongation according to EN 933-4 [14] for coarse particles with a sieve size larger 4 mm that are not suitable for the characterization of fine aggregates used in mortar or concrete. To this end, micro-computed tomography (µCT) offers the possibility of detailed shape characterization for this particle size fraction. This has been demonstrated in studies such as those of Garboczi et al. [15] and Cepuritis et al. [16], which focused on crushed particles with a minimum sieve size of 20 µm or different crushed sands with a sieve size range of 4 µm to 250 µm, respectively. Using µCT imaging, the three-dimensional (3D) shape of particles can be characterized with respect to form and angularity. From a large number of proposed morphological descriptors, one shape parameter found suitable by Erdogan et al. [17] and Estephane et al. [18] for describing the prolate particles within a particle sample and one angularity parameter introduced by Zhang et al. [19] for 2D particle representations and extended to the 3D case here were chosen. Thus, based on µCT images, the distribution of a shape descriptor within one sample of sand particles and the quantitative degrees of a shape descriptor of different sand samples could be calculated.
Due to the described limitations of the above-mentioned studies, this study aimed to carry out a systematic analysis of the effect that different crushed natural and recycled fine aggregates have on mortar properties. Although many of those studies relied on laboratory tests or visual classification of the shape of particles within the bulk material, µCT imaging can now be used to quantify mean measurements and the distribution of a shape descriptor within the bulk material. This allows for differences in particle shape to be described, especially for crushed recycled sands. However, using this knowledge in mix design to increase the amount of crushed natural or recycled sands would require a detailed quantification of the effect these materials have as well as their interaction with other parameters, which would guide the mortar mix design. Therefore, the emphasis of this study lies on the differences in particle shape observed for crushed fine aggregates in comparison to natural fine aggregates. This study focuses on the interactions of those particle shape characteristics determined for various sands using µCT imaging with the mixture design properties of water–cement ratio (w/c ratio), binder–aggregate ratio (b/a ratio), and the grading curve of fine aggregates. This study is based on a multiple linear regression analysis and therefore is limited to the considered materials and range of variation of the variables. Other mortar mixtures used in practice may exceed these limitations. Furthermore, it can serve as a basis for discrete element modeling, which was not performed in this study.

2. Materials and Methods
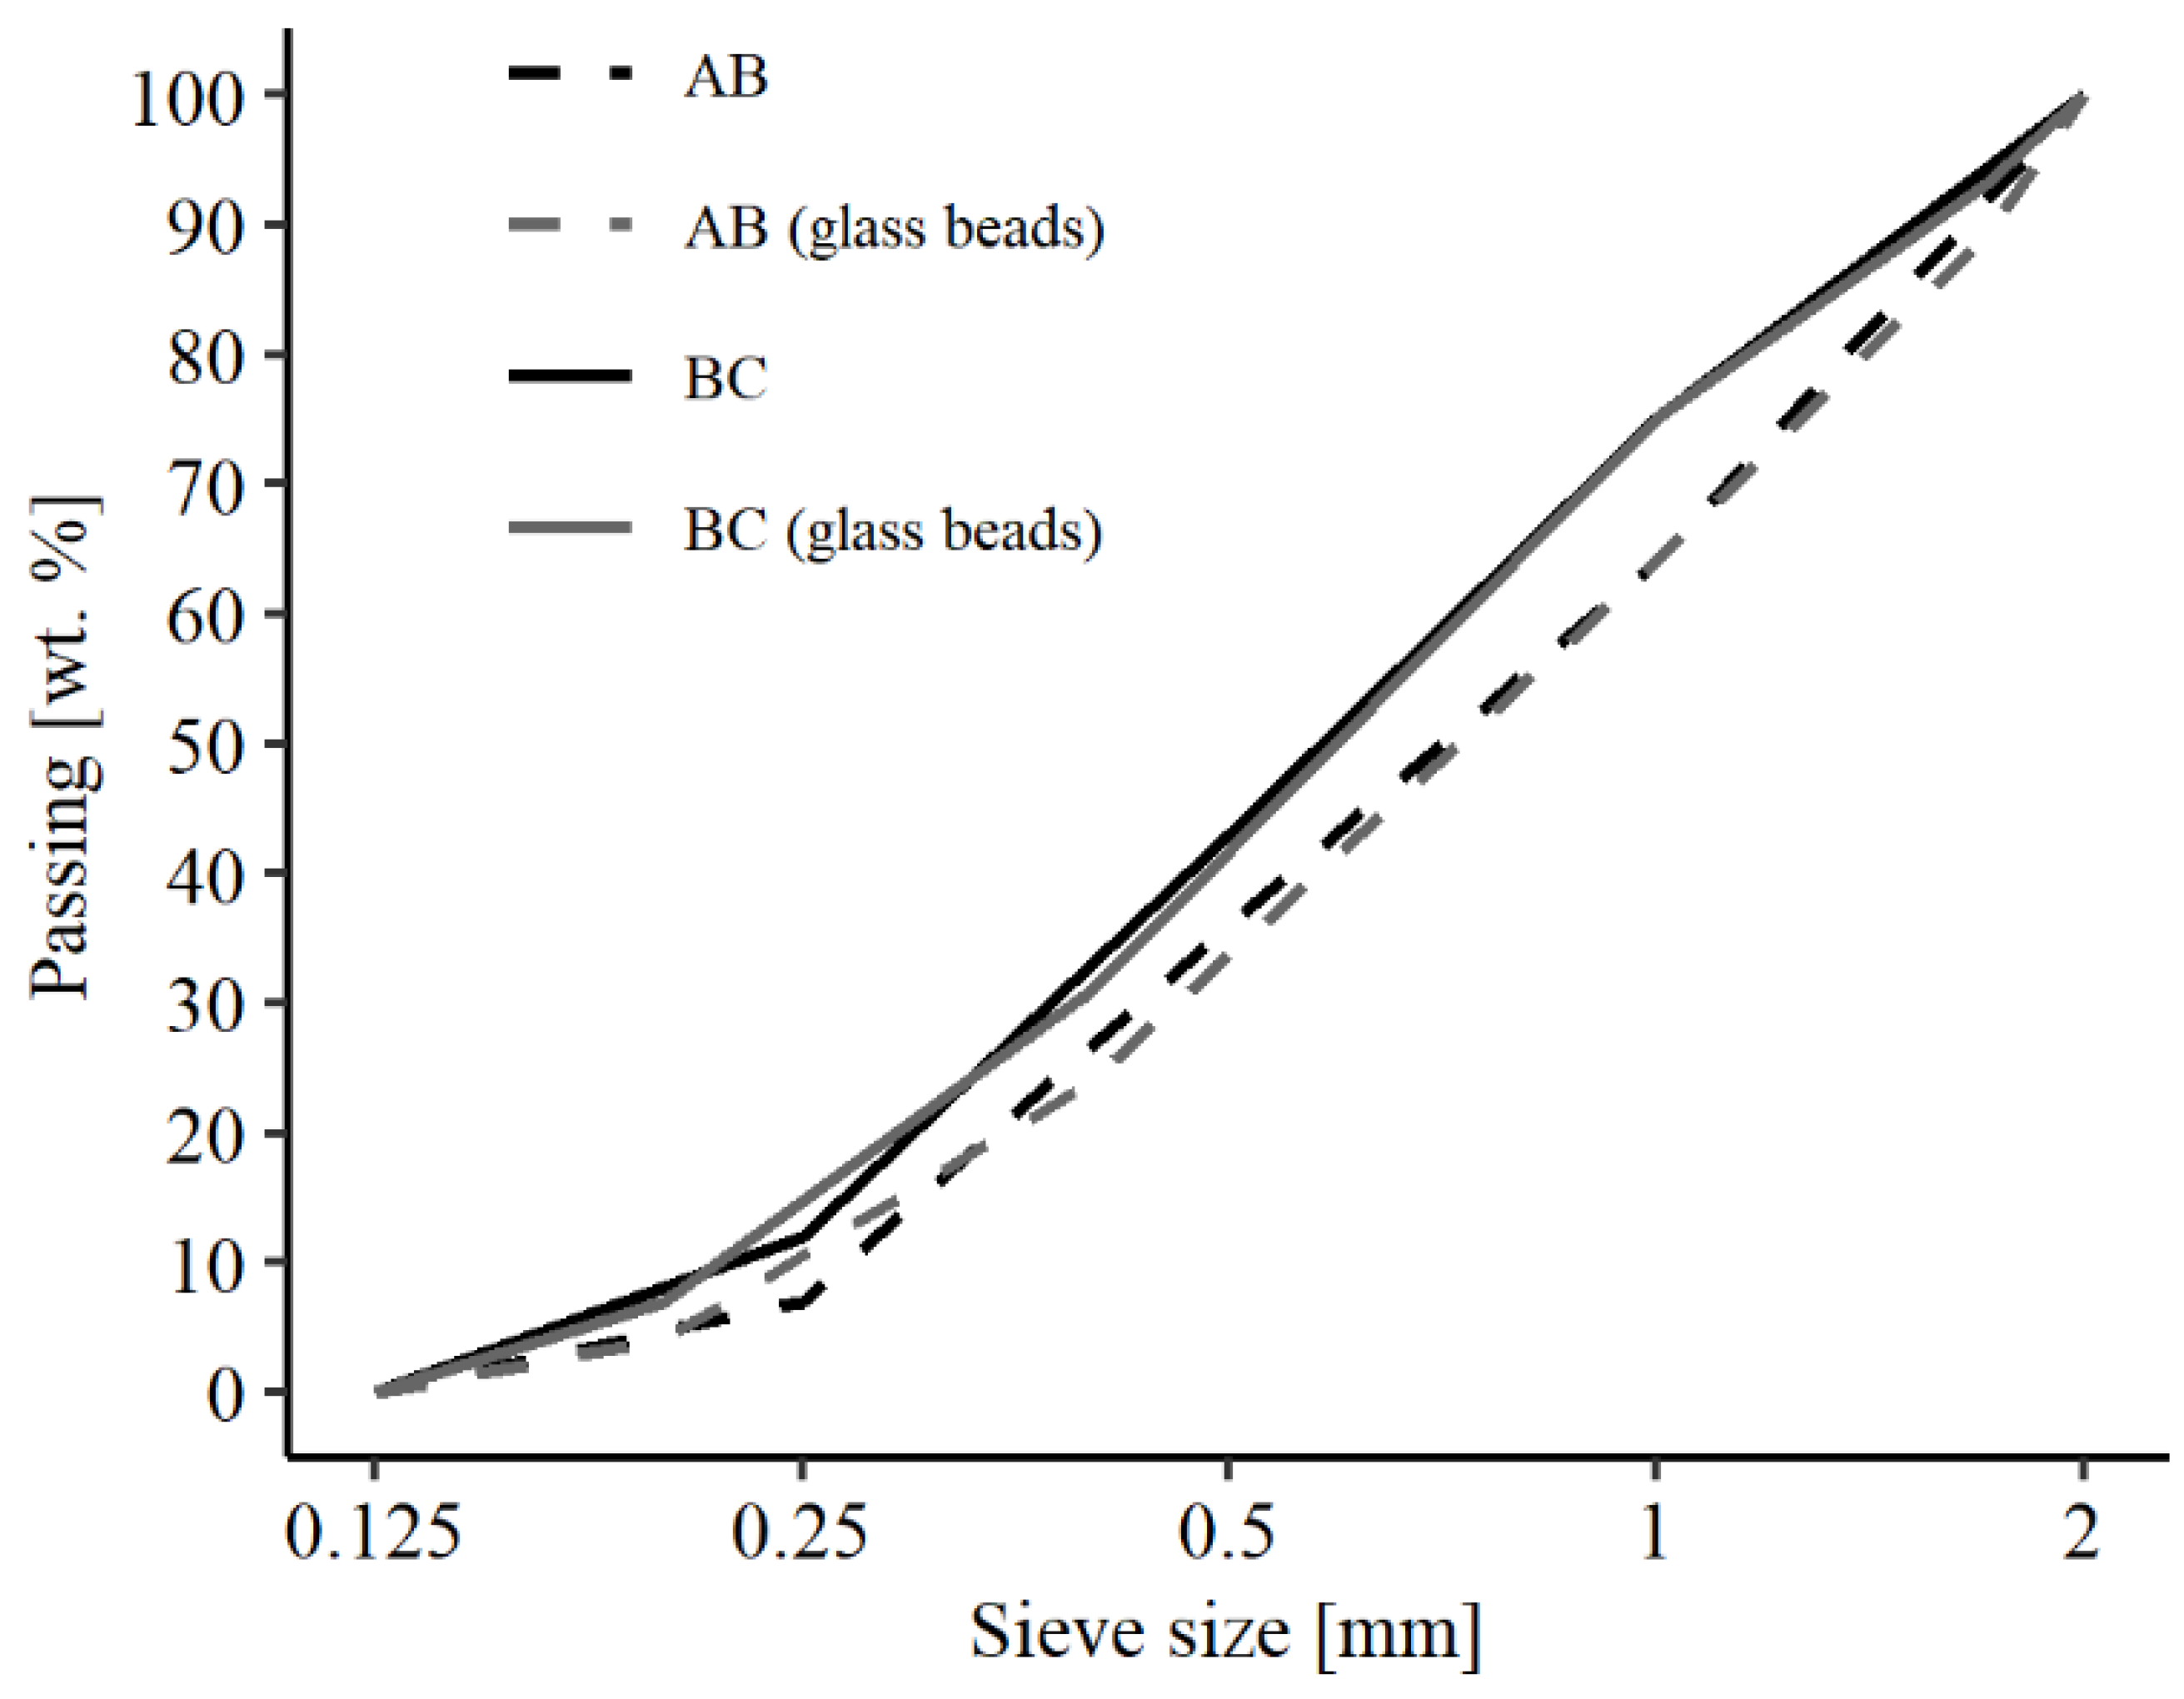
2.1. Materials

Five sands with sieve size between 125 µm and 2 mm were used for the experimental investigation. Particles smaller and larger than these bounds were removed by dry sieving according to EN 933-1 [20] due to the limitations of µCT imaging described in Section 2.2 as well as the limitations of rheological measurement described in Section 2.3. Materials used in this study included glass beads (G) as a reference material with a very spherical shape and high roundness. Furthermore, a natural sand (S) with less rounded surfaces but a spherical shape was used. Three different kinds of crushed sand were considered: one natural crushed microdiorite (M) with sharp edges and two recycled sands—one from concrete (RC) and one from masonry (RM) demolition waste with intermediate roundness and sphericity. After sieving the natural and crushed materials into the four sieve size fractions of 0.125 mm/0.25 mm, 0.25 mm/0.5 mm, 0.5 mm/1 mm, and 1 mm/2 mm, two grading curves were manually composed from those groups. The glass bead grading curve was slightly different due to the limitations in glass bead sizes available. One grading curve was characterized by a larger coarse aggregate fraction (AB), whereas the other contained a larger number of fine aggregates (BC) (see Figure 1). The denominations AB and BC were chosen following DIN 1045-2, annex Q [21]. Table 1 lists the details of the material properties. Water absorption was measured either according to EN 1097-6 [22] or by electrical resistivity following the procedure described by Kim et al. [23], which proved to be suitable for recycled fine aggregates with a high water absorption rate and crushed natural materials. Following the procedure of Kim et al. [23], a sample of 2500 g from the recycled concrete, recycled masonry, and crushed microdiorite was immersed in water for 24 h. Each sample was dried stepwise while taking subsamples with different moisture contents in regular intervals. After cooling each subsample to room temperature, the electrical resistivity was measured in a measurement cell with an edge length of 25 mm × 60 mm. The moisture content was plotted against the electrical resistivity and approximated by two regression lines. The water absorption after 24 h of those samples was indicated by the point of intersection between the two regression lines. In addition, the bulk density according to EN 1097-3 [24] and the apparent density according to EN 1097-6 [22] were determined. For the apparent density measurement, two to three pycnometers were filled with subsamples of each material, fulfilling the requirements regarding minimum sample sizes according to EN 1097-6, and immersed in water for 24 h. Afterwards, the apparent density was measured by determining the ratio of the oven-dried sample mass to the mass of the water-saturated samples. For the glass beads and natural sand samples, the water-saturated but surface-dry moisture state was determined by the slump cone criterion according to EN 1097-6 for the water absorption measurement after 24 h. The results of the bulk density measurements represent the mean of three independent measures for each material sample according to EN 1097-3. The bulk density was determined by filling a cylindrical sample holder with a 1 L capacity with aggregates following the requirements of EN 1097-3.

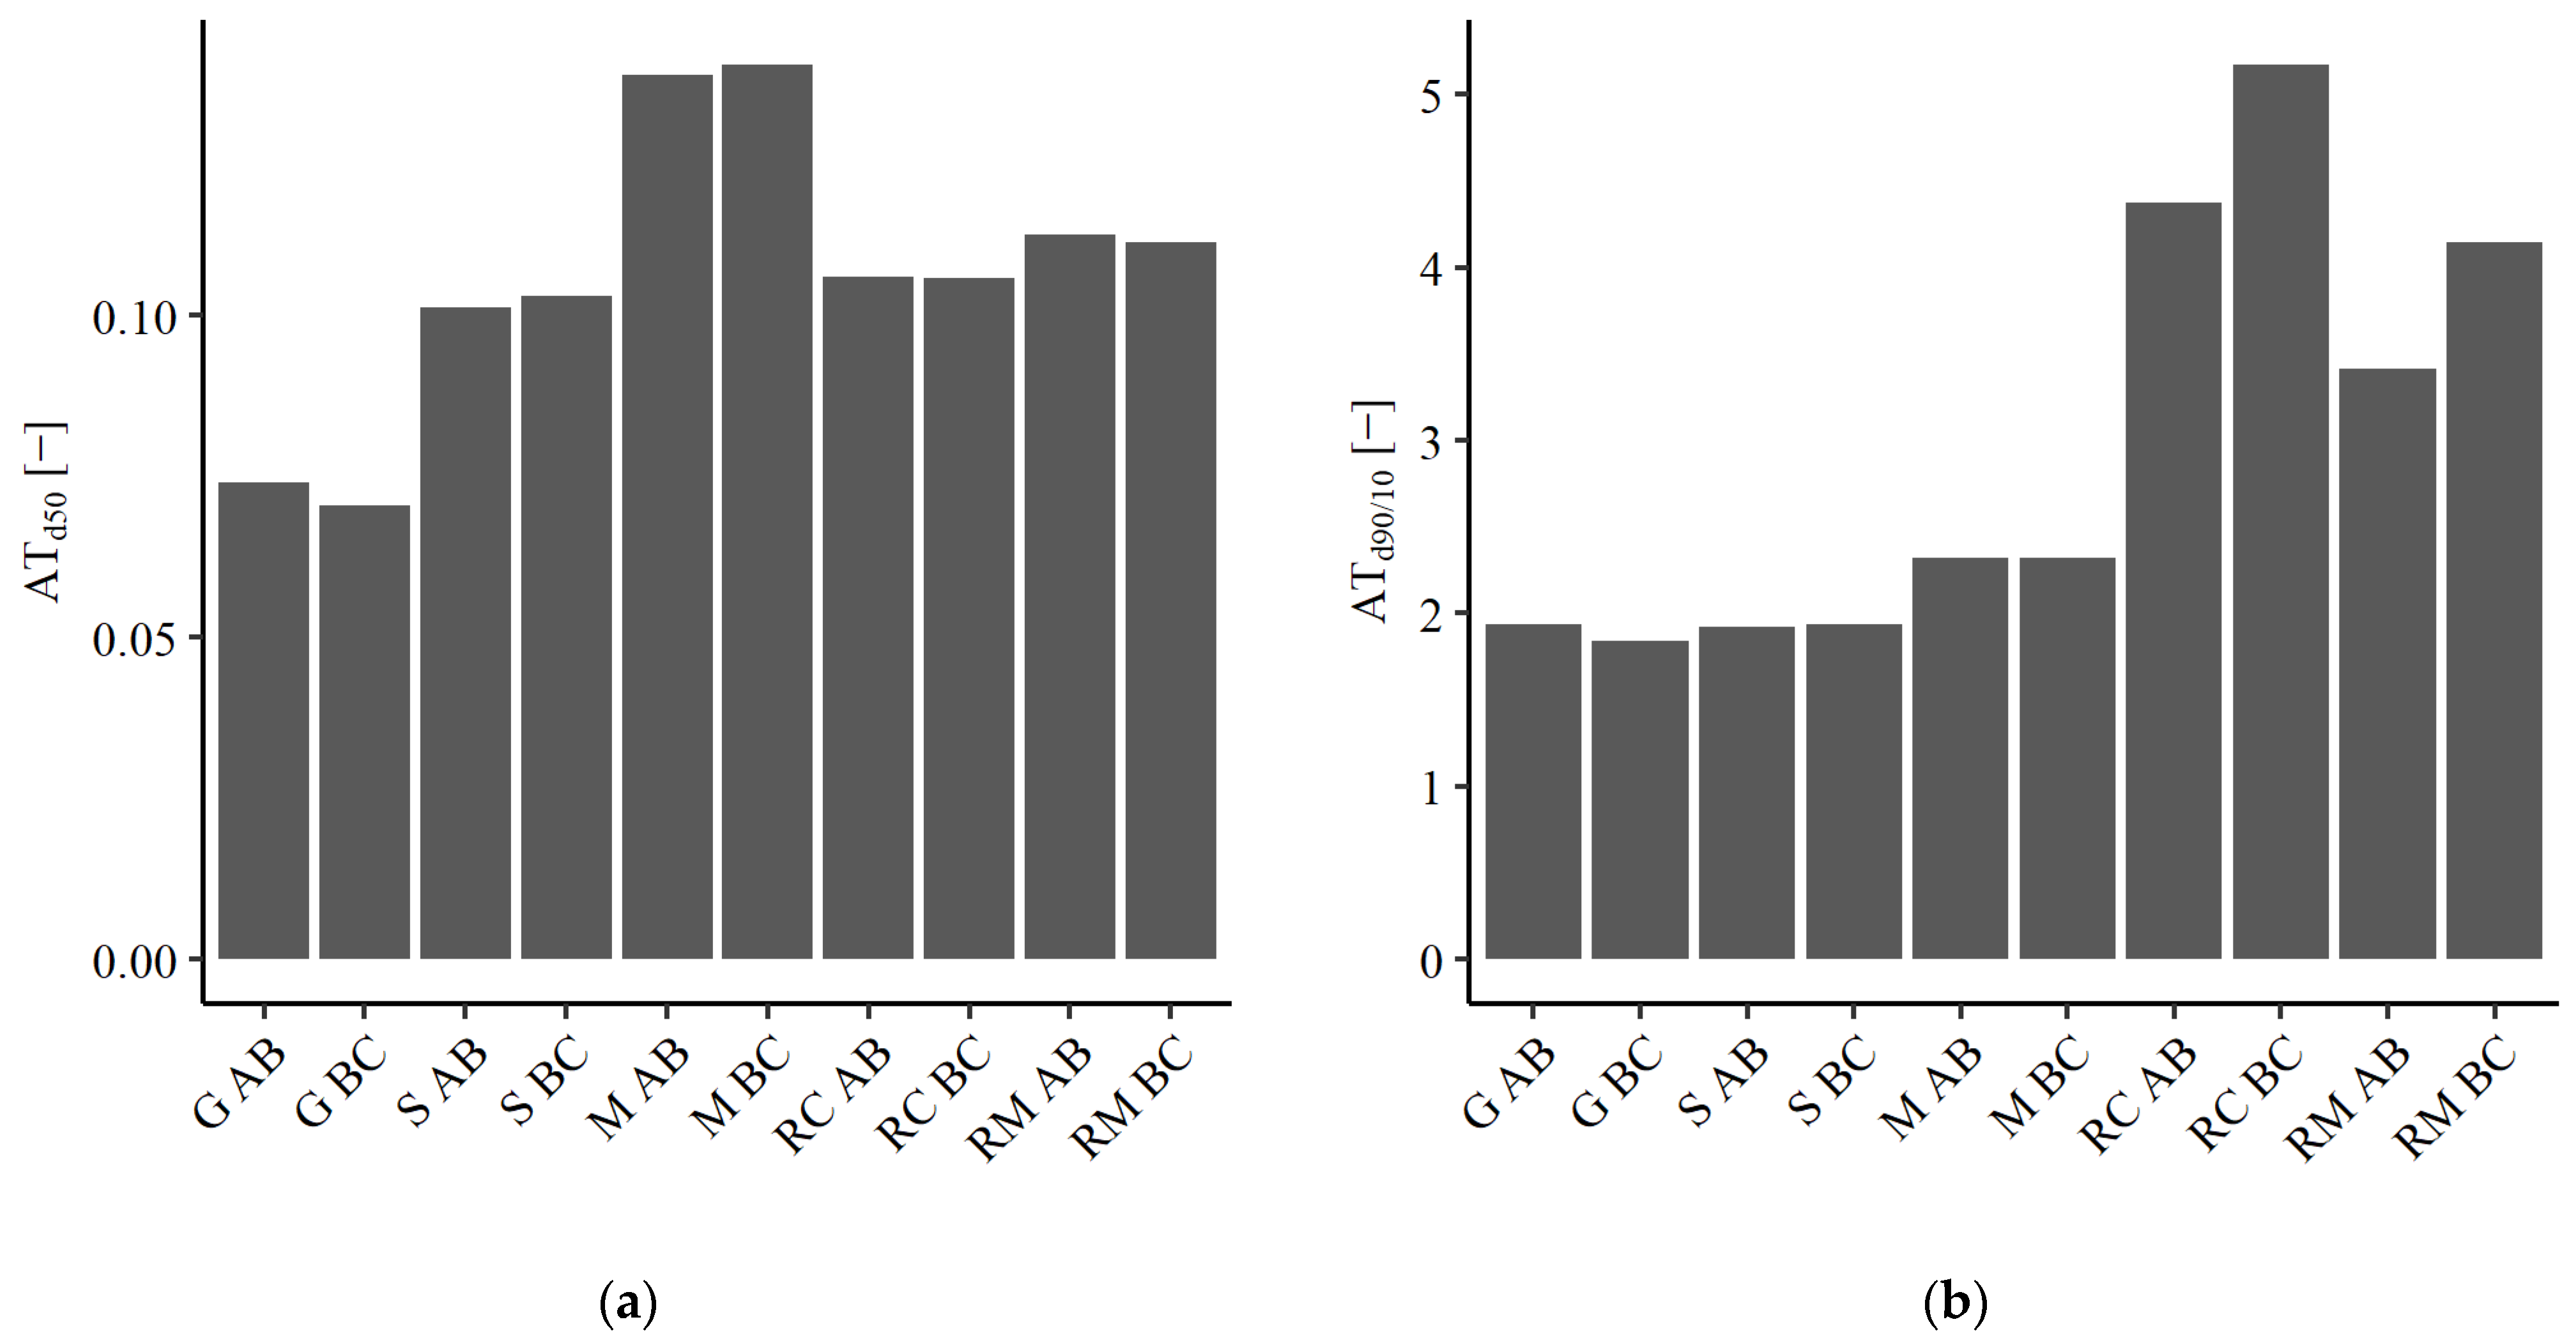
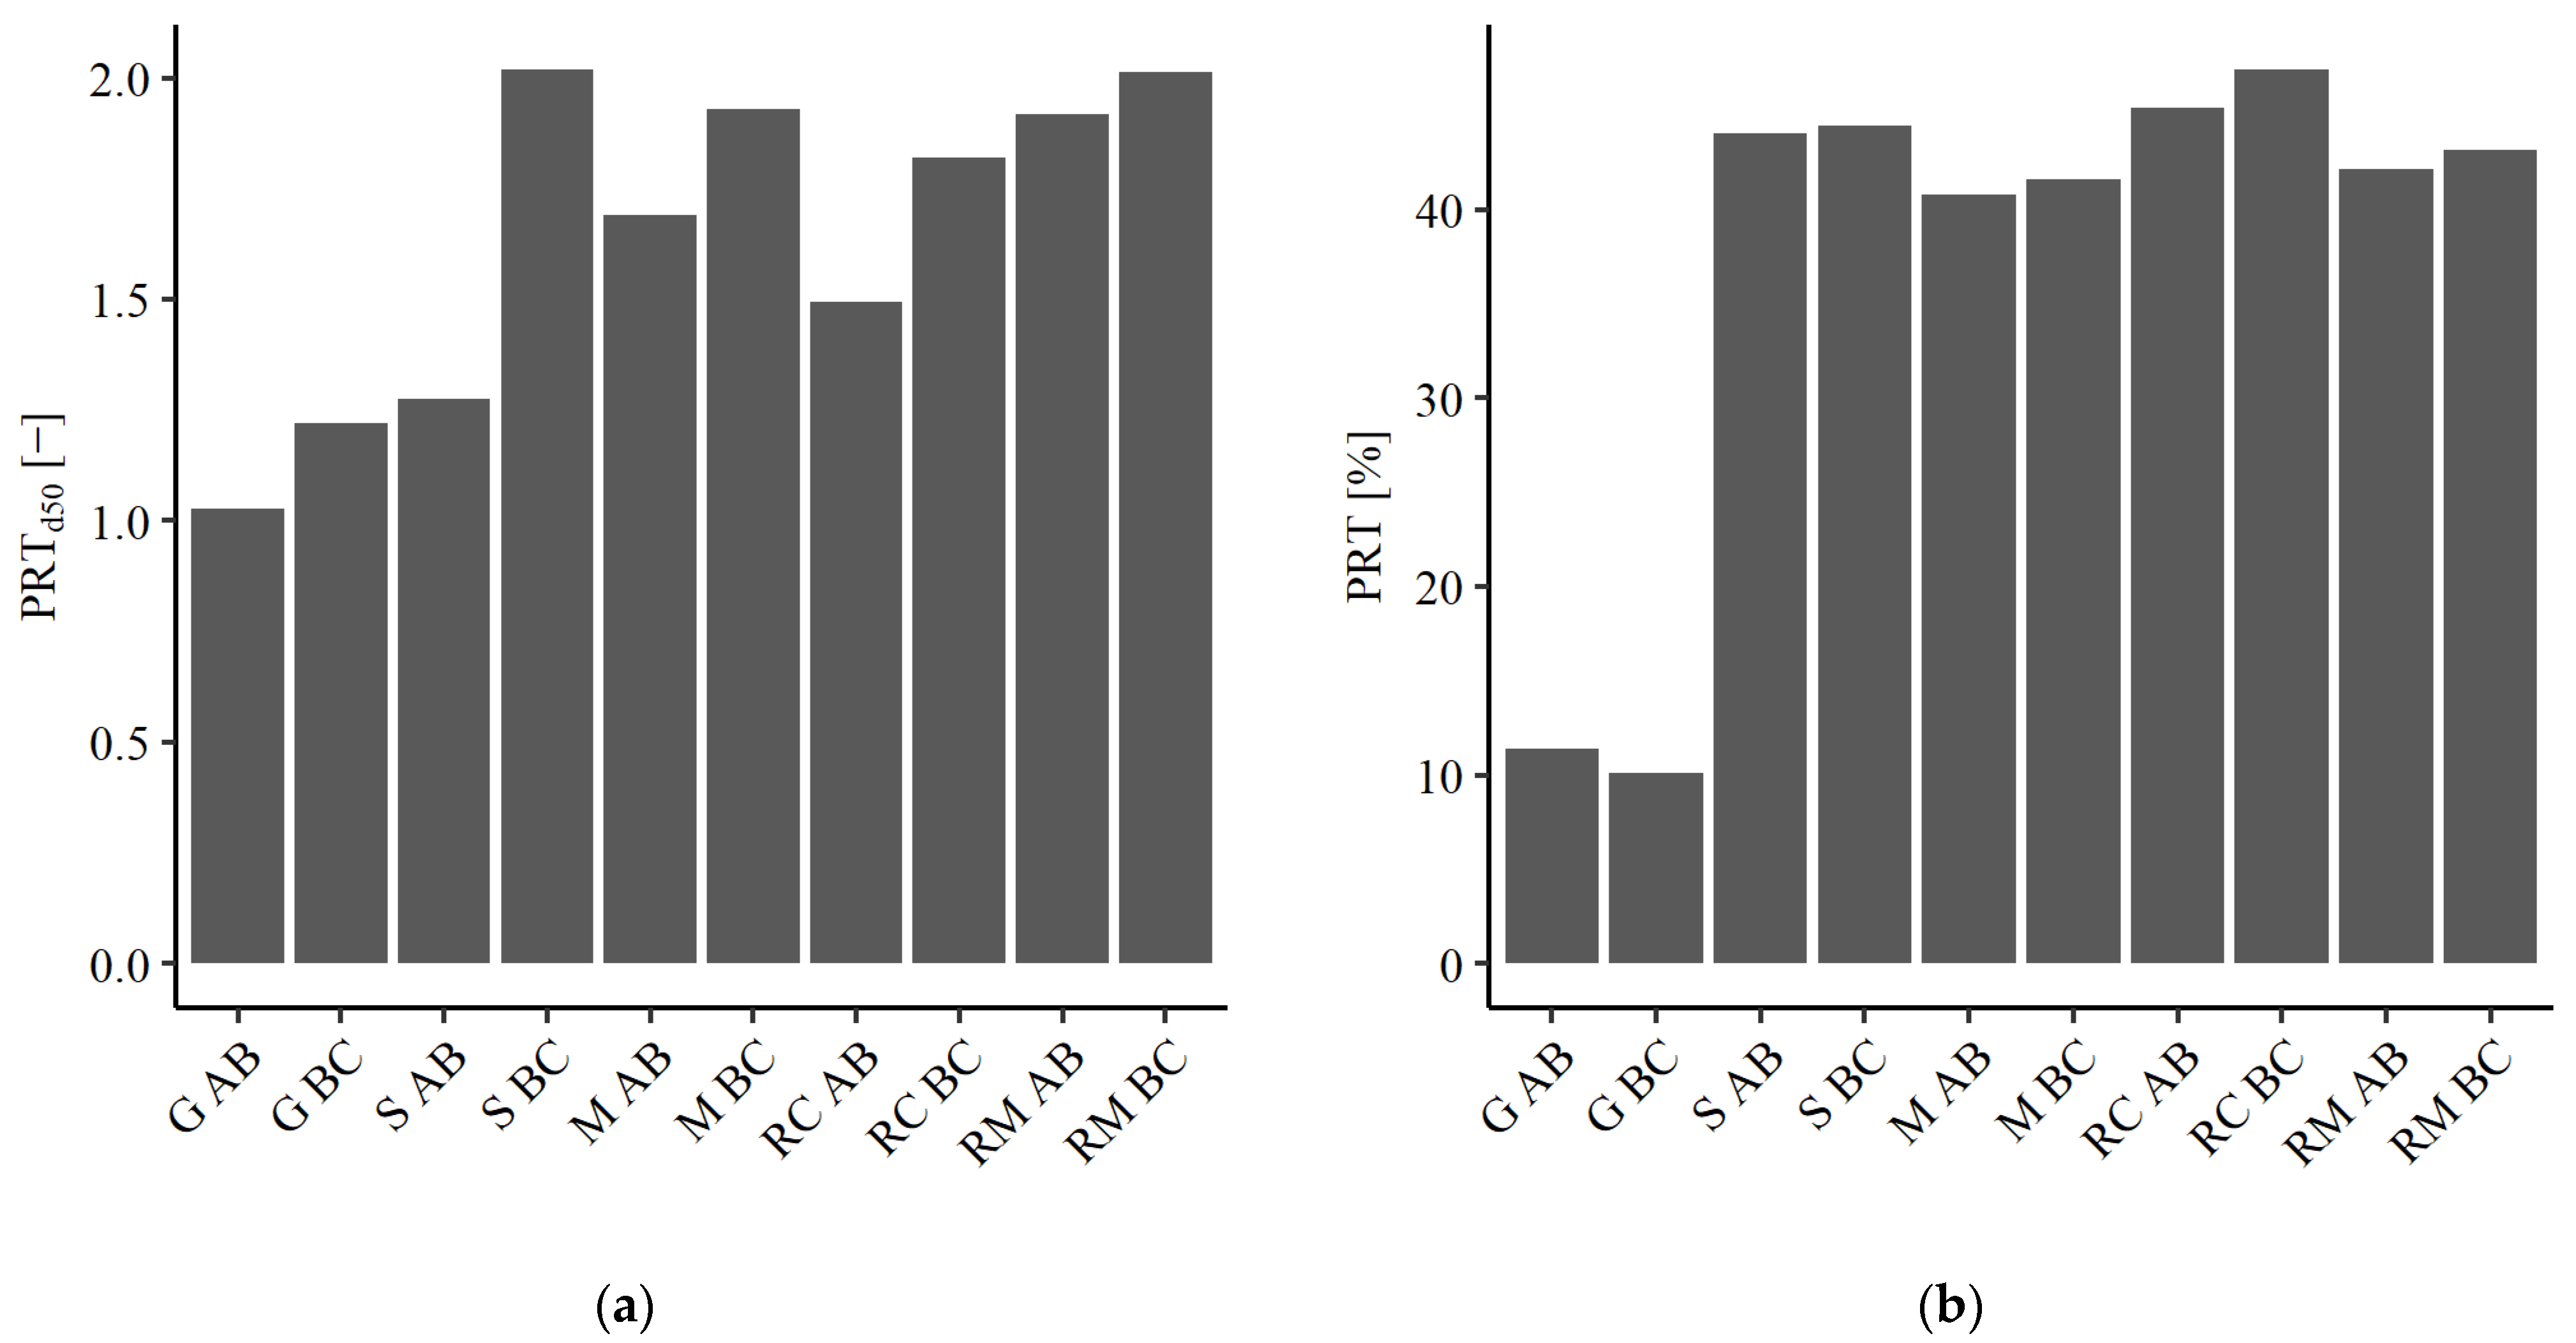
2.2. µCT Imaging and Particle Shape Characterization

To determine the shape characteristics, µCT images of five samples from each material and grading curve were taken using a CT ALPHA-240 (ProCon X-Ray GmbH). The associated 16 bit flat-bed detector had a size of 2144 × 1760 pixels with an edge length of 127 µm. Images were taken with a voltage of 100 kV, a current of 80 µA, an exposure time of 0.45 s, and a voxel size of 8 µm. The voxel size of 8 µm represented the lower limit of the µCT system specifications and guided the image resolution. To guarantee a sufficient level of measurement accuracy, only particles larger than 125 µm were analyzed within this study. The ratio of particle sieve size to voxel size was therefore in between the recommendation of [25] for the minimum required voxel size. Following the recommendation from EN ISO 15708-3 [26], projections of 1680 rotation increments were recorded. To reduce image noise and scattering, a flat-field correction was performed prior to scanning, and for every rotation increment, three projections were averaged. Every sand sample was scanned as a packed bed in a scanning container made of floral foam. Using VGSTUDIO 3.2 (Volume Graphics), the µCT images were reconstructed. Afterwards, image processing and particle shape characterization were performed using ToolIP with MAVIkit and MAVI with MAVIparticle (Fraunhofer Institute for Industrial Mathematics). Image processing, including smoothing of the grey-value image, thresholding into a binary image, and segmentation of individual particles by adaptive h-extrema transformation, was performed using the procedure described in detail in [27]. The resulting µCT images after segmentation are presented in Figure 2 for the five materials used in this study.
After segmentation, size and shape characteristics for all particles were calculated. For each material sample and grading curve, a minimum of 38,000 particles formed the basis for particle shape characterization. The particle dimensions of thickness t, width w, and length l (with t < w < l) refer to the edge length of a box with minimal volume surrounding the particle, as defined by Blott and Pye [28]. To quantify angularity and texture, the modified descriptor AT proposed by Zhang et al. [19] for 2D images of particles and transferred to the 3D case herein was calculated according to Equation (1). It is based on a comparison between the surface area (SA) and the surface area of the convex hull ( SA CH ) of a particle.
AT = SA SA CH SA CH
To characterize the whole aggregate sample, two metrics were calculated. The first one, AT d 50 , is the median value of AT with respect to the particle volume. The second metric, AT d 90 / 10 , is the ratio of the AT value at a cumulative volume passing of 90% to the AT value at a cumulative volume passing of 10%. Whereas AT d 50 is suitable for characterizing the magnitude of angularity and texture of a sample, AT d 90 / 10 describes the spread within the sample. The results for AT d 50 and AT d 90 / 10 for the ten samples considered here are presented in Figure 3a,b, respectively. Another parameter used within this study described how prolate a particle was. Based on the procedure described in [17,18], every particle was assigned to a bin within a matrix based on the ratios l/t and w/t. Particles falling in the bin with l/t and w/t between 1.0 and 1.5 were considered to be spherical. All particles falling within one of the bins with w/t between 1.0 and 1.5 but l/t larger 1.5 were considered prolate. To characterize each aggregate sample, the number of prolate particles in comparison to the total number of particles PRT was calculated. In addition, the median of the ratio of l/t of all particles classified as prolate PRT d 50 was calculated analogously to the definition of AT d 50 . Figure 4a,b show the results for PRT d 50 and PRT for the ten considered materials.

2.3. Design of Experiment and Laboratory Tests

The experimental plan followed a full factorial design based on three two-level factors and one five-level factor, resulting in 40 mixture compositions. The w/c ratio was varied on the two levels of 0.45 and 0.55, whereas the factor b/a ratio varied on the levels of 0.95 and 1.05. Aggregate samples with two grading curves, namely, AB and BC, were used. The fourth factor was the material. To increase statistical power, four replicates of every mixture were produced and tested, resulting in a total test program of 160 mixtures to be analyzed. The experimental design was divided into four blocks, with each block containing the 40 different mixture compositions. To minimize the impact of random errors, mixtures within each block were produced and tested in a random order. Every mixture consisted of 1700 g of aggregates. The aggregate fraction was composed of 212.5 g limestone powder, oven-dried aggregates, and additional water to compensate for 80% [29] of the water absorption capacity of the material, as listed in Table 1. The amount of cement and mixing water depended on the factor’s w/c ratio and b/a ratio. All laboratory tests were carried out at (20 ± 2) °C room temperature and (65 ± 5)% humidity. A laboratory mixer with a low speed of 62 rpm and a high speed of 125 rpm according to EN 196-1 [30] was used. The mixing procedure included the following steps:
  • Blend the aggregates and 2/3 of the total amount of water and mix for 30 s at low speed.
  • Wait for 570 s for the aggregates to saturate.
  • Add the remaining water, limestone powder, and cement within 30 s.
  • Mix for 60 s at low rotational speed and 30 s at high rotational speed.
  • Wait and clean the mixer for 90 s.
  • Mix at high rotational speed for 60 s.
The rheological measurements were performed using a Viskomat NT (Schleibinger Testing Systems) with a rotating cylindrical sample cell 90 s after the end of the mixing procedure. Every measurement was performed for a mortar sample of approximately 375 mL. This measurement setup is suitable for rheological measurements on mortars and binders with particles smaller than 2 mm. In this study, the maximum particle size was therefore limited to a sieve size of 2 mm. A stationary mortar probe with a fishbone shape was used to minimize the risk of sedimentation during measurement [31]. The pre-shearing phase consisted of an increase in rotational speed from 0 to 50 rpm within 20 s and a constant rotational speed of 50 rpm for additional 25 s. After pre-shearing, the rotational speed was lowered by 10 rpm every 15 s. For each down-step, the first 7 s and the last 2 s of measured torque values were discarded. The median of the remaining 6 s of torque measurements was calculated. From the torque, which correlates with the shear stress of a mixture, and from the rotational speed, which corresponds to shear rate, the parameters of yield stress and dynamic viscosity were calculated based on the Bingham model [32,33]. After the rheological measurement, three mortar prisms (160 mm × 40 mm × 40 mm) were produced and demolded after 24 h. After 28 days of curing under water at a temperature of (20 ± 2) °C, the flexural strength in a three-point bending test setup and the compressive strength according to EN 196-1 [30] were measured.

2.4. Statistical Methods

The results were evaluated using R (R Core Team) and RStudio [34]. The relationship between one of the dependent variables—yield stress, dynamic viscosity, flexural strength, or compressive strength—and the independent variables was analyzed using multiple linear regression. The aim of this regression analysis was not to precisely predict the dependent variable but to evaluate the effect that particle shape had on it. As independent variables, w/c ratio (categorial), b/a ratio (categorial), grading curve (categorial), and the four shape parameters described in Section 2.2 (continuous) were considered.
As the factor for material included redundant information on particle shape and thus had a high correlation to the shape descriptors, it was not incorporated into the regression analysis in order to prevent multicollinearity. It was assumed that variables describing shape and angularity were sufficient to represent the variable material for fresh mortar properties. Other influencing factors, such as mineralogical composition or particle strength, were assumed to play a subordinate role and were therefore neglected. This assumption could be incorrect for the evaluation of particle strength. Therefore, the additional variable material origin was considered for multiple linear regression analysis. This categorial variable distinguishes between the two levels of natural (N) and recycled (R). It covers differences in particle strength as well as the effect of unhydrated cement attachments to the recycled particles that might interact with the surrounding cement binder. The three sands from natural origins formed a group of similar-strength materials and were expected to exhibit an inert mortar phase. A potential alkali–silica reaction originating from the glass beads was expected to play a subordinate role due to the short time of 28 days between mortar production and strength testing.
Within this study, the main effects as well as the interactions between two variables were considered. Whereas the main effects describe the impact that an independent variable has on the dependent variable, the interactions indicate whether this impact depends on the level of a second independent variable. Interactions between the categorial and the continuous independent variables were considered. However, the interactions between shape descriptors or between categorial variables were neglected. Due to the large number of variables possibly contributing to the regression results, variable selection was necessary. To avoid multiple testing, a best subset regression was performed. Regression models for all combinations of main factors and interactions were calculated. To ensure a meaningful evaluation of the regression, all combinations in which interactions were present but whose corresponding main effects were not were excluded [35]. This resulted in 8694 potential regression models for fresh mortar properties and 17,389 models for hardened mortar properties. From the remaining regression models, the model with the lowest Bayesian information criterion (BIC) was chosen for further analysis [36]. After model selection, the validity of the assumptions of multiple linear regression were checked. The linearity between the dependent and independent variables as well as the independence of residuals was validated visually based on scatter plots. The assumption of no multicollinearity was verified by ensuring that the maximum variance inflation factor (VIF) was below ten [37]. Normal distribution of the residuals was checked via the Shapiro–Wilk test [38] and homoscedasticity via the Breusch–Pagan test [39]. If an assumption was not met, transformation of the dependent or independent variables was performed. In the case of strong outliers, those data points were excluded from further evaluation.

3. Results and Discussion

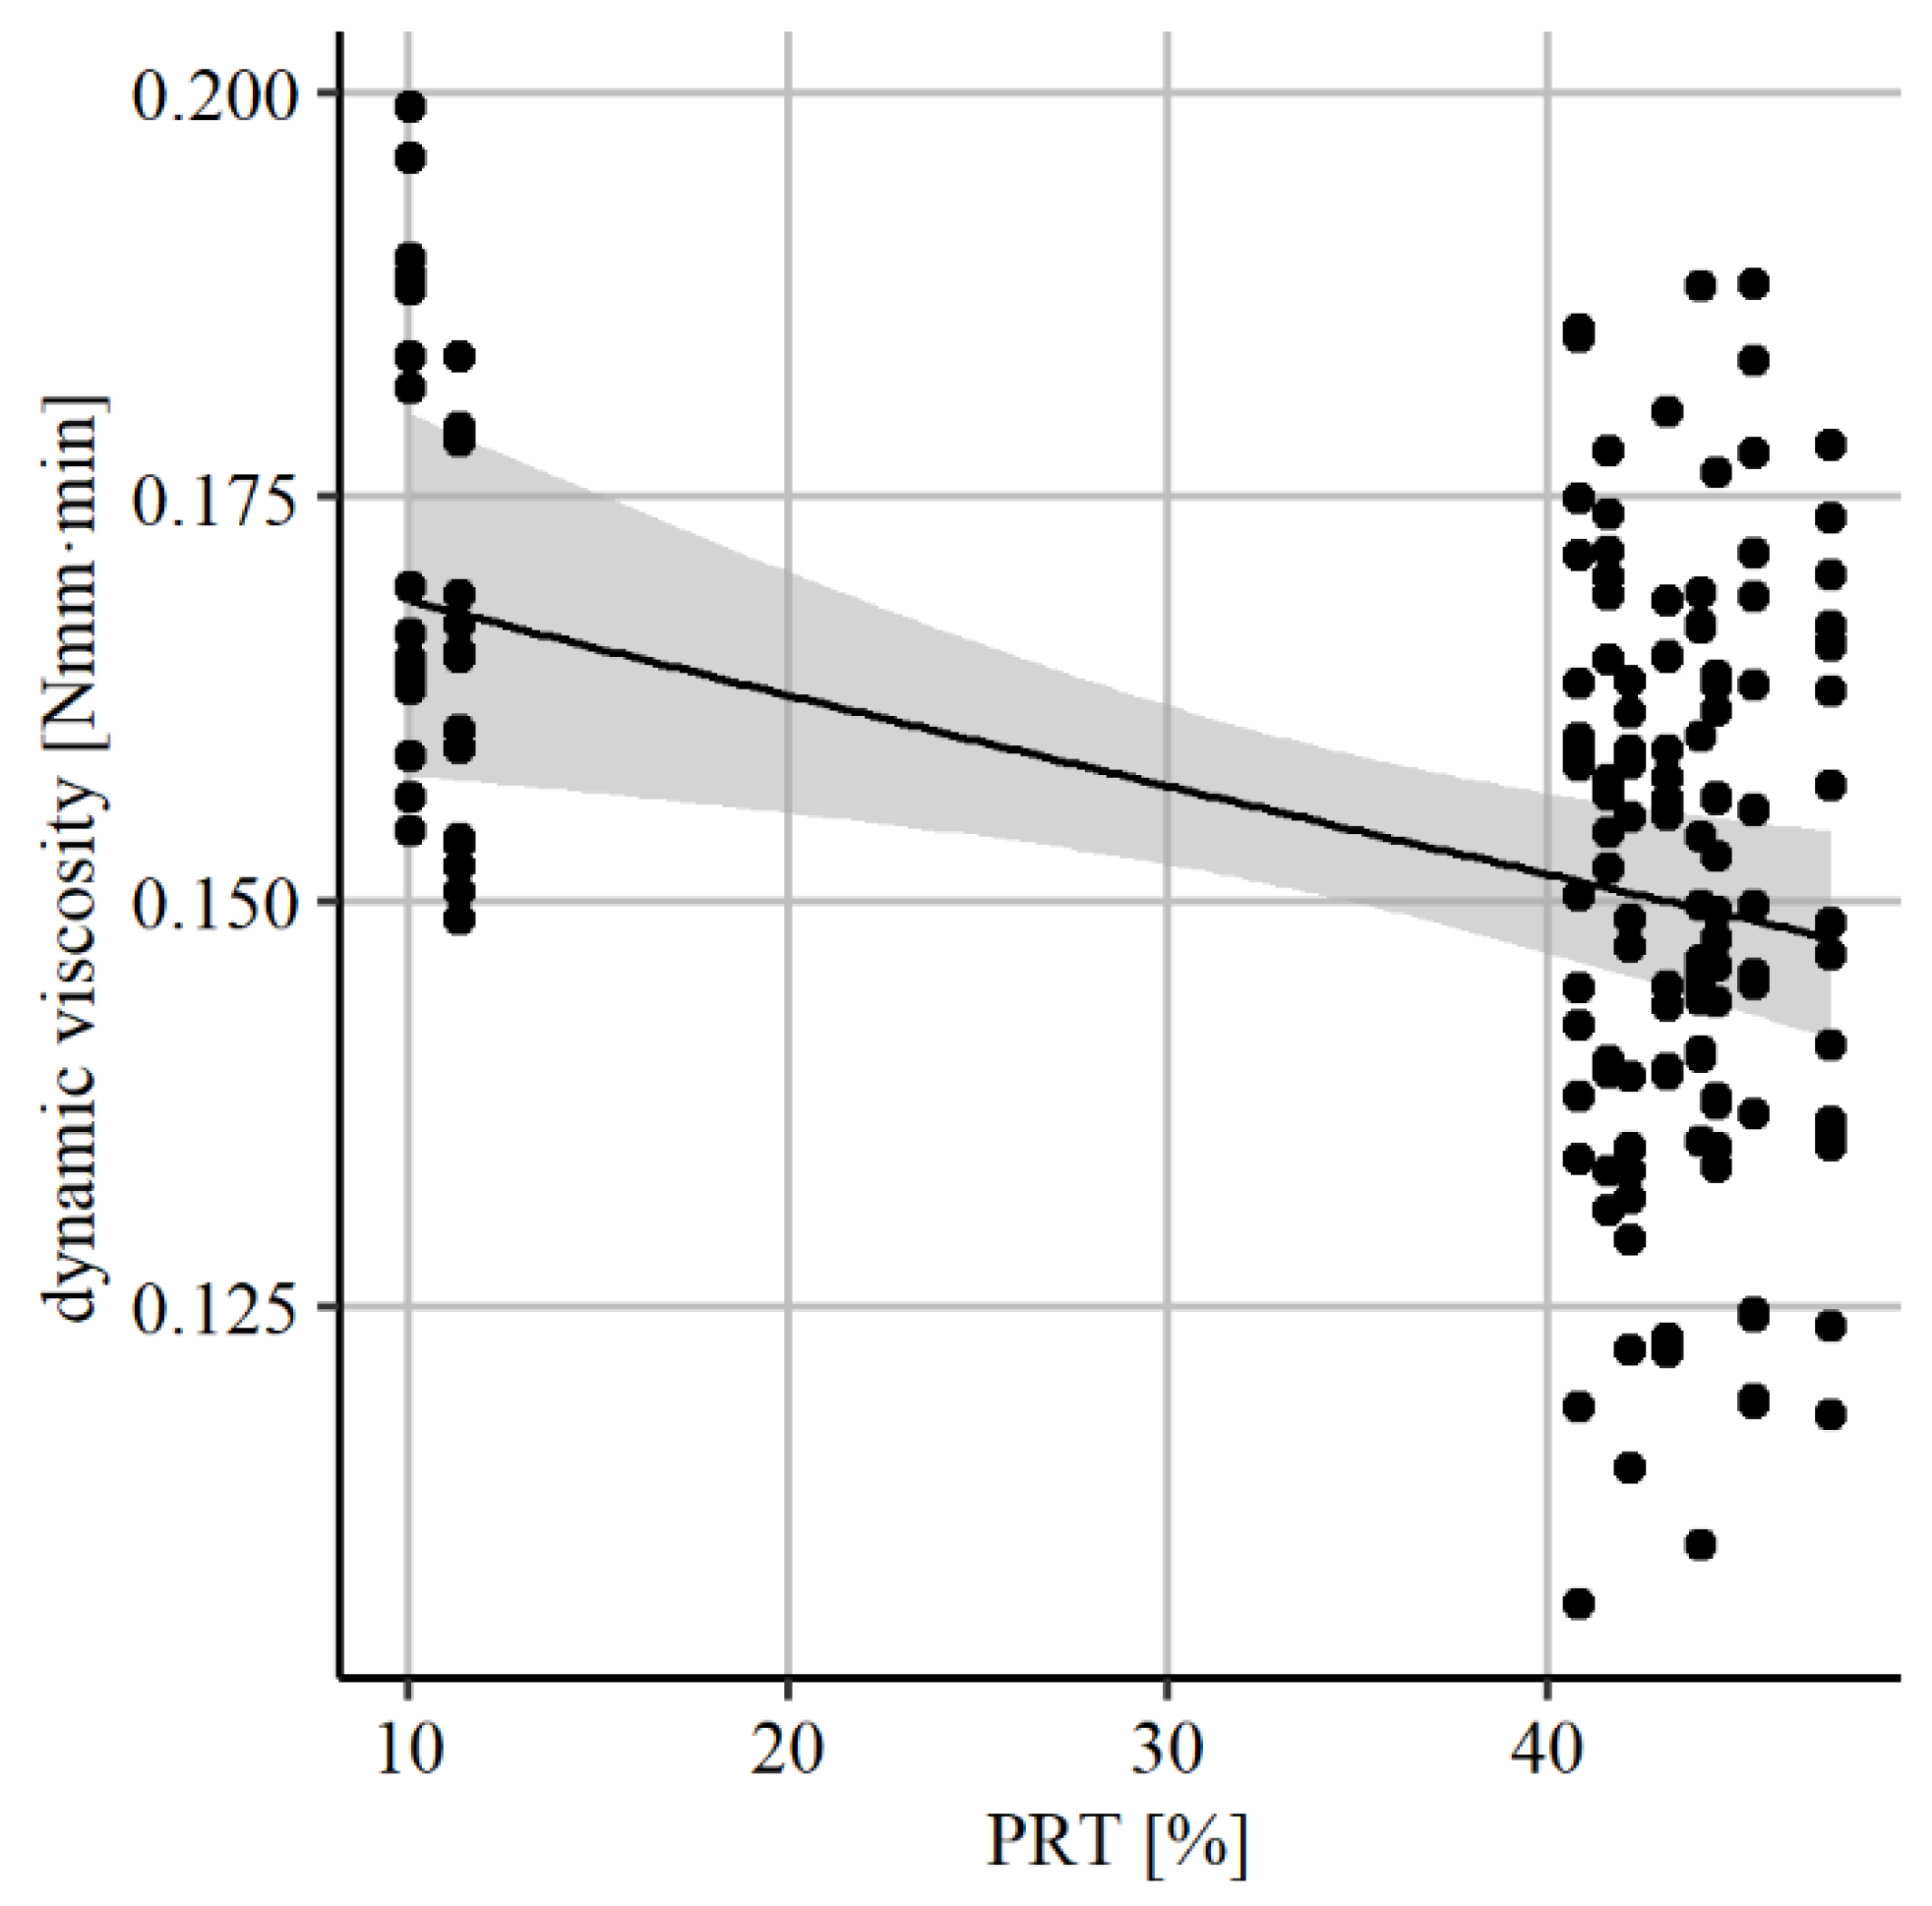
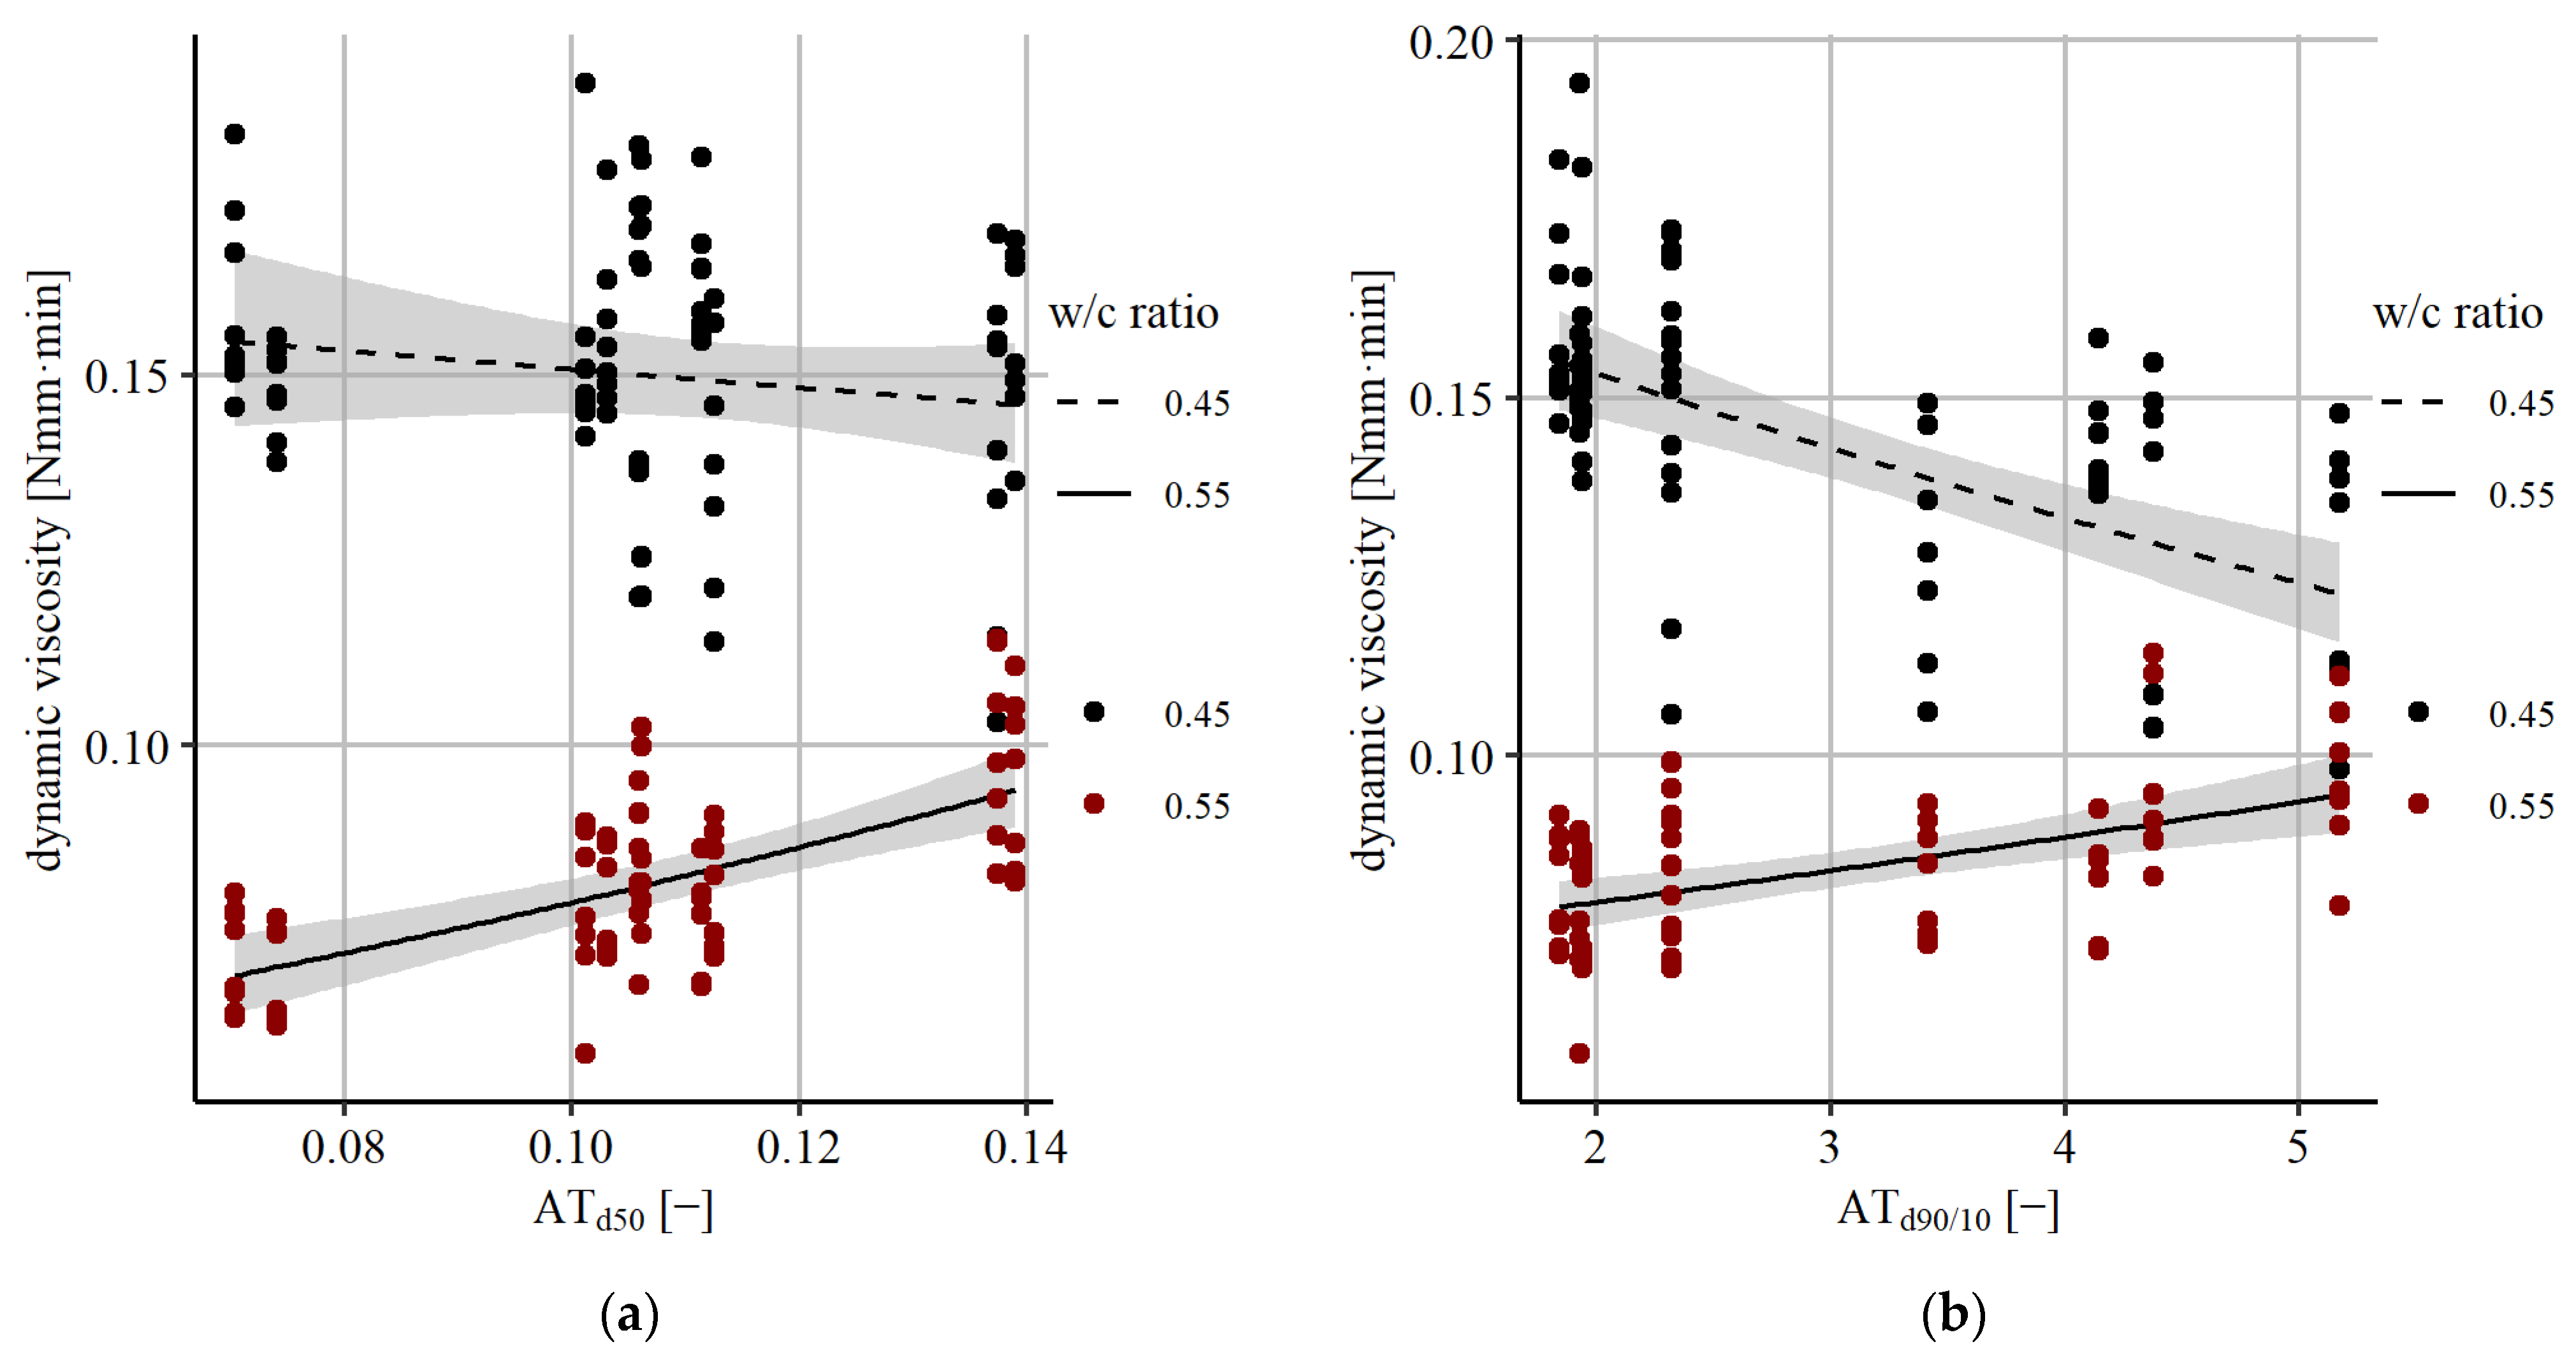
3.1. Dynamic Viscosity
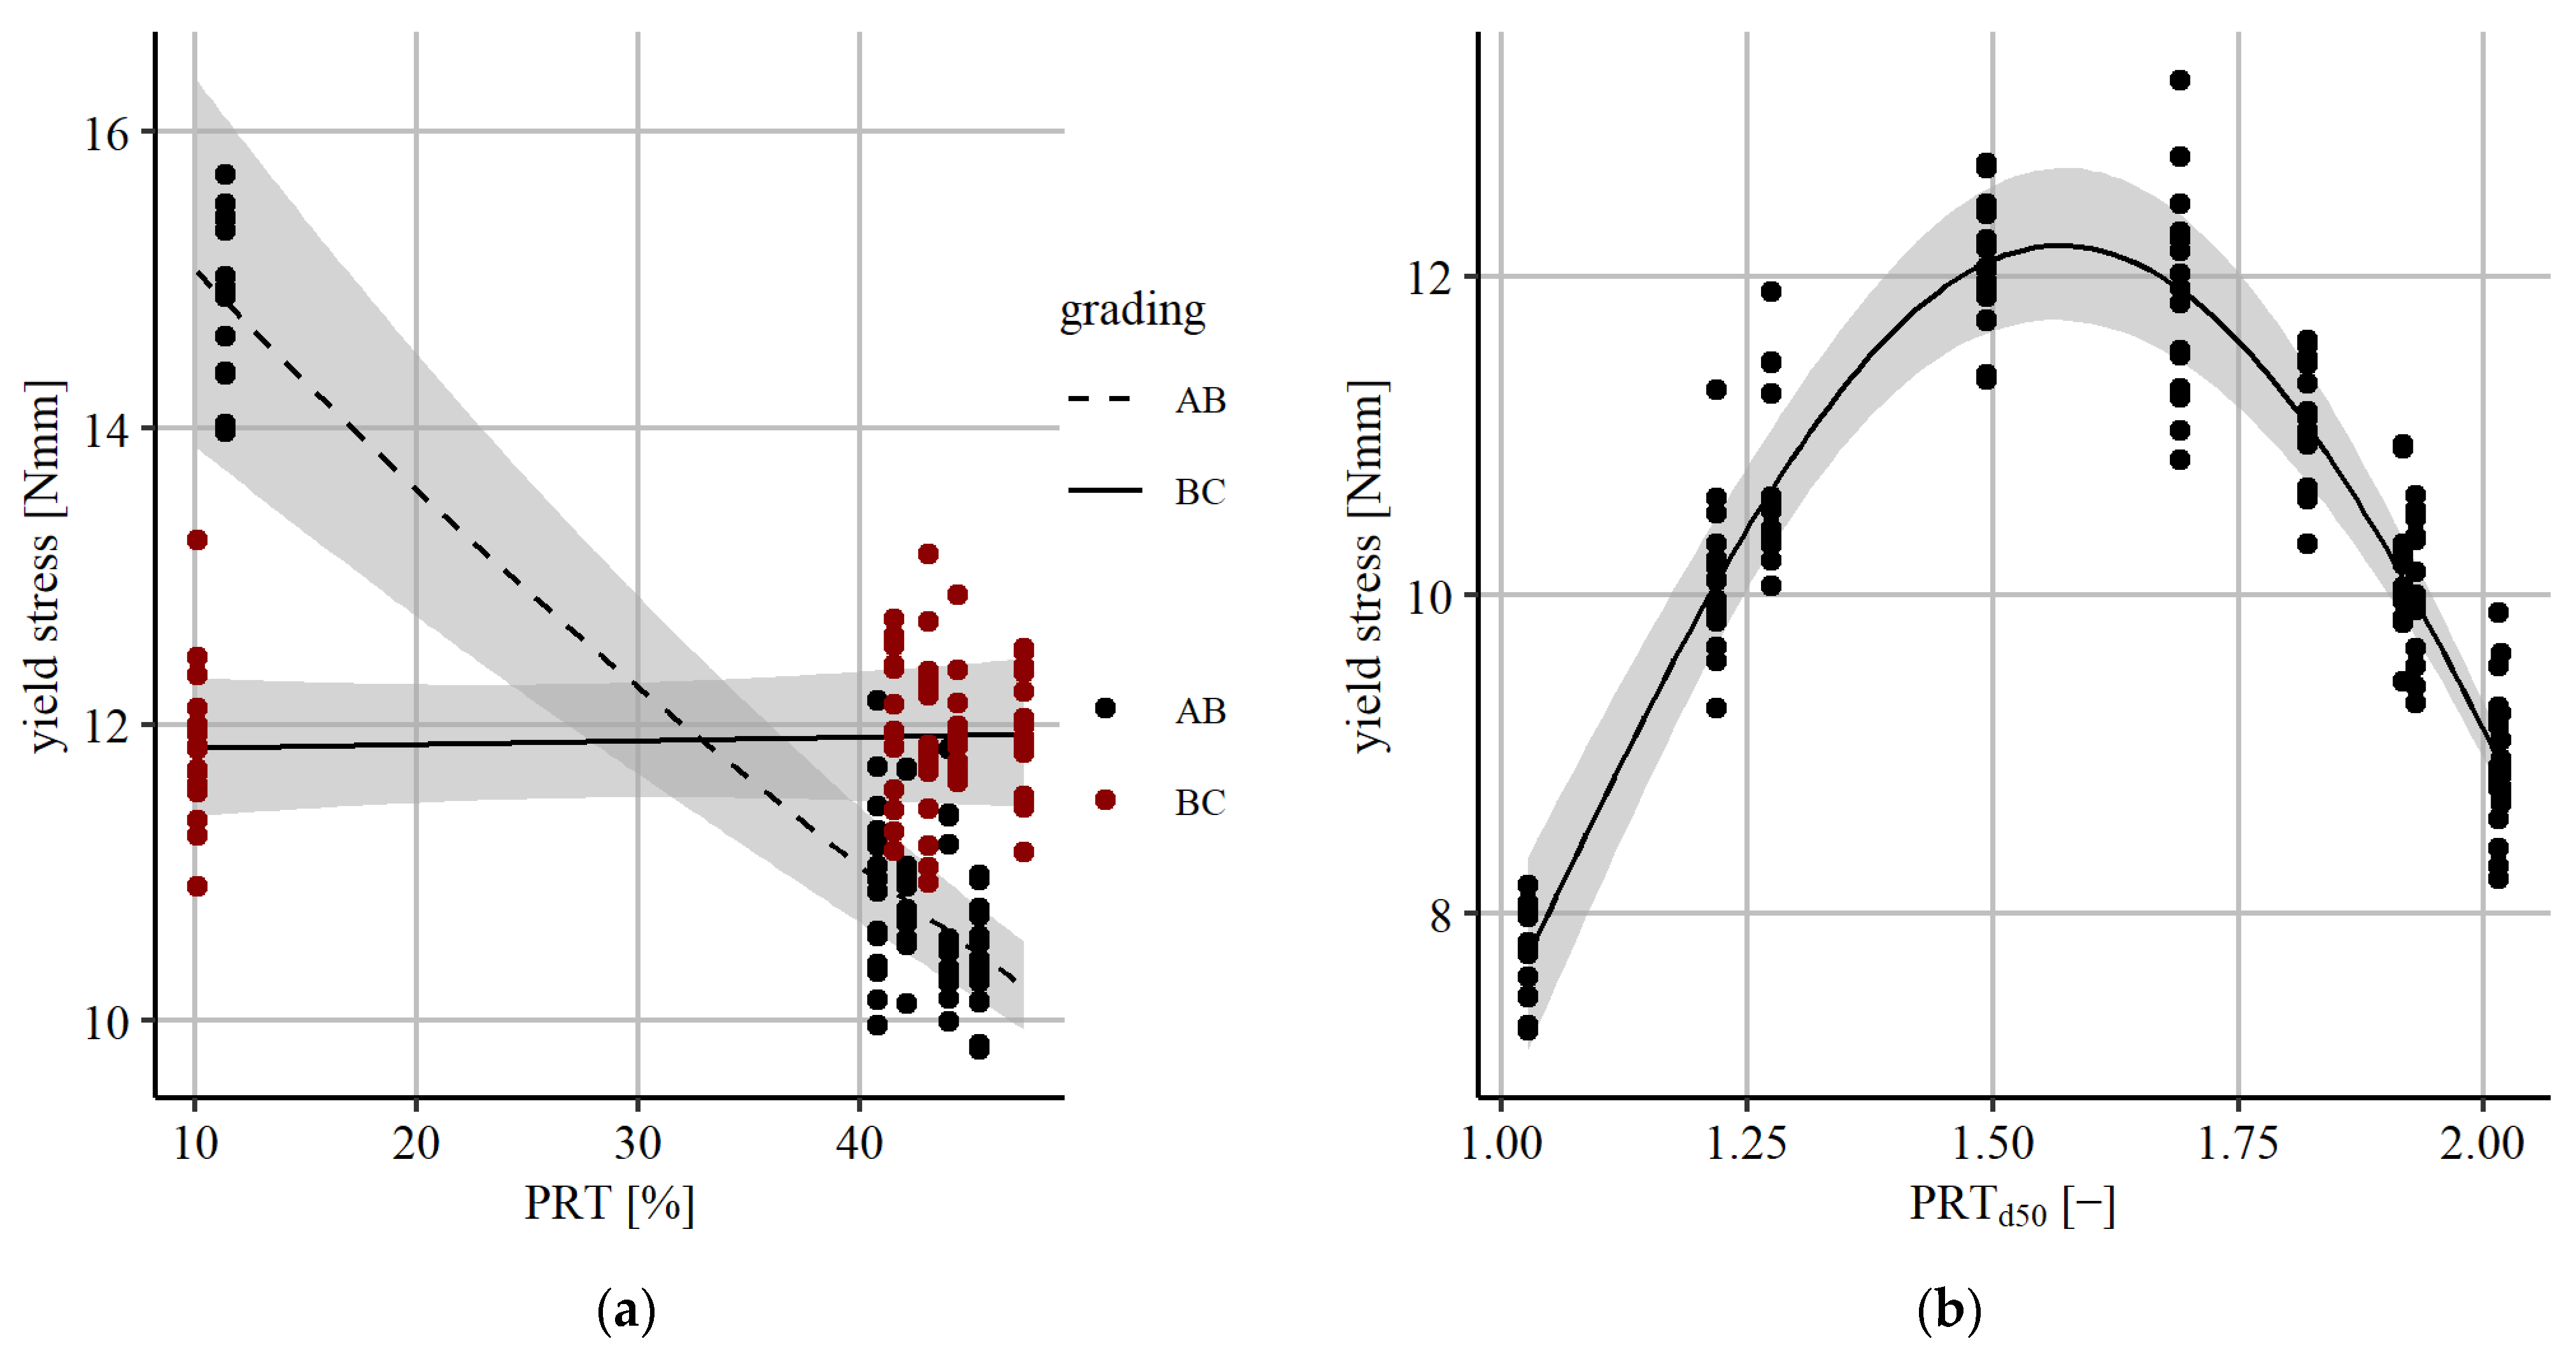
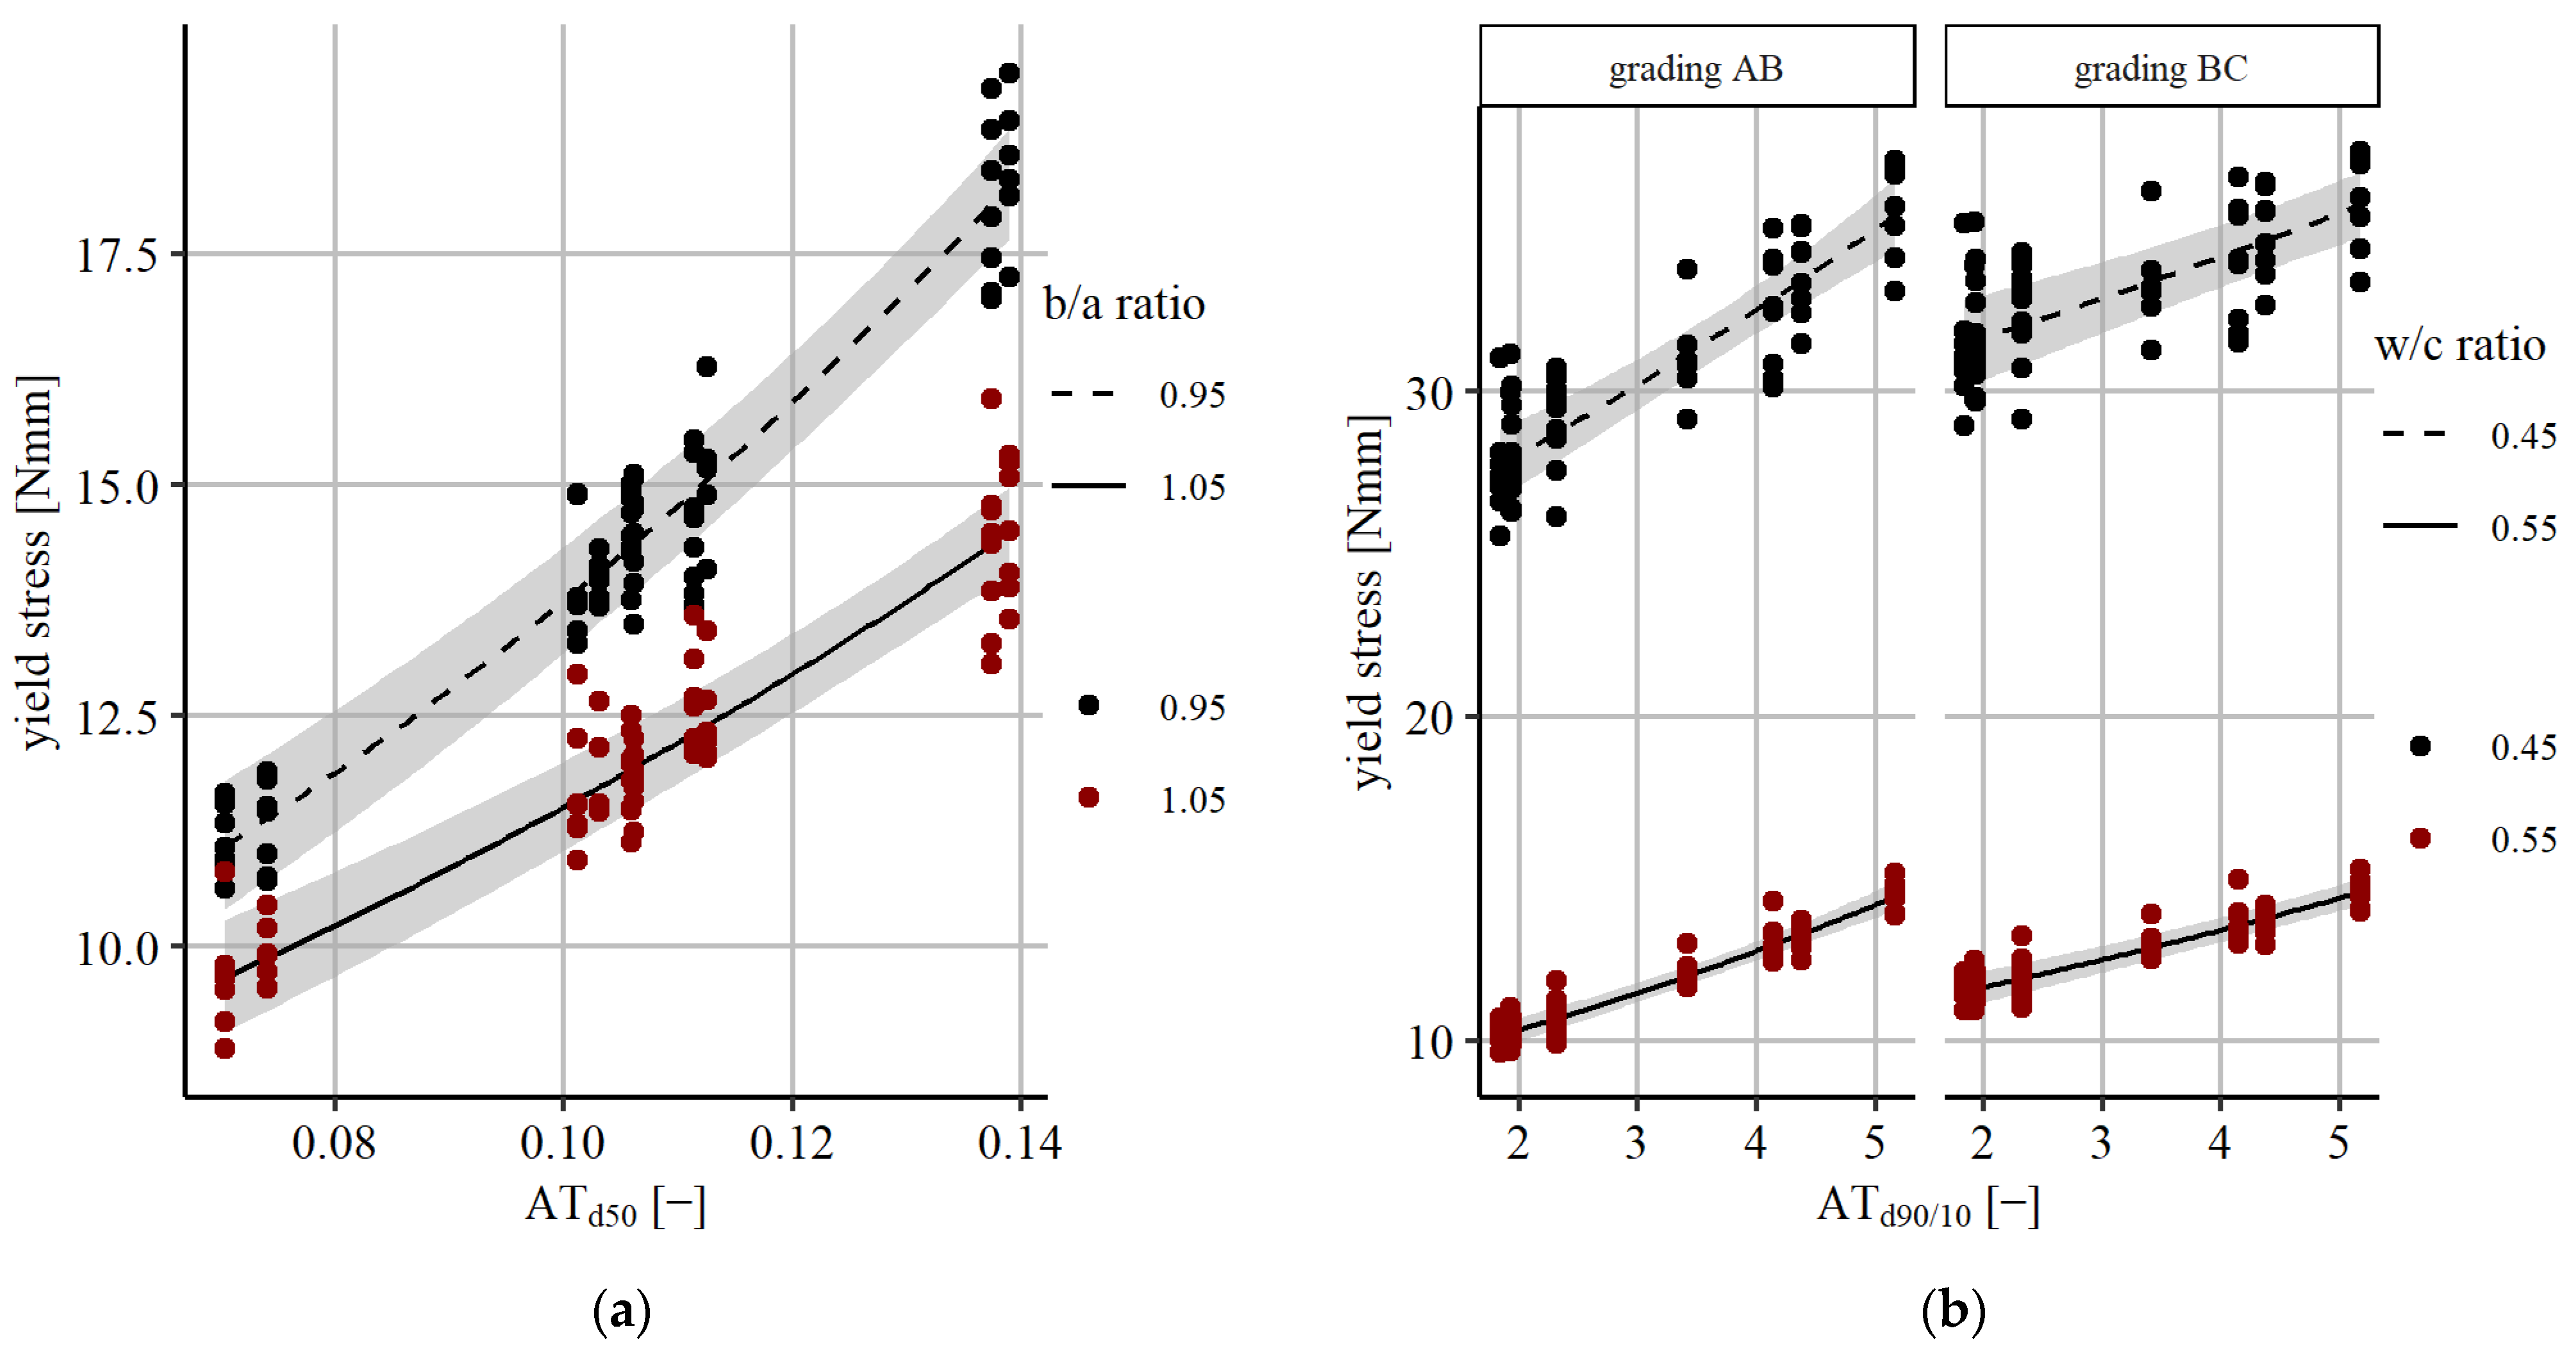
The chosen regression model was significant (F(6, 150) = 164.5, p < 0.000), with an R2 of 0.86, for analyzing the effect that particle shape had on the log-transformed variable of dynamic viscosity of the mortar mixtures, as shown in Table 2. From the 160 observations, 1 missing data point and 2 strong outliers were excluded from analysis. The value in brackets behind the categorial variable indicates the dummy-coded level. For example, the w/c ratio (0.55) indicates that w/c = 0.55 was dummy coded 1, whereas the level w/c = 0.45 was the reference level of 0.
Next, each part of the determined regression model concerning the impact of a shape or angularity characteristic on the dependent variable was visualized as an effect plot. Effect plots show the impact of one selected independent variable on the dependent variable while correcting for the impact of other independent variables as part of the regression model. The gray-shaded area related to the effect plot reflects the confidence interval. Further, the underlying raw data points were visualized by residuals of the regression model, indicating the scatter observed within the study. Whereas prediction of the dependent variable required the consideration of the full model, which is presented, for example, in Table 2, effect plots illustrate trends caused by isolated variables of a multiple linear regression model.
As shown in Table 2, a significant impact of the number of prolate particles PRT on the dynamic viscosity was detected. Figure 5 demonstrates this effect. With an increasing number of prolate particles, the dynamic viscosity decreased, as shown in Figure 5. An increase in PRT from 10% to 40% resulted in a decrease in dynamic viscosity of 0.017 Nmm∙min. Although this decrease was small in comparison to the scatter of dynamic viscosity values observed in Figure 5, PRT had a statistically significant impact on the behavior of the fresh mortar with respect to the dynamic viscosity. This large scatter also contributed to the comparably low coefficient of determination R2 of 0.86. This could be a possible indication of other factors influencing the measurement result that were not considered within this study. However, the degree of PRT d 50 did not have a significant impact on dynamic viscosity. Westerholm et al. [5] and Aissoun et al. [9] expected the dynamic viscosity to increase with an increasing degree of elongation due to the increase in specific surface area of the particles. In comparison to spherical particles, the specific surface area of prolate or elongated particles was larger, resulting in a higher demand of binder to cover the surface of the particles. This resulted in a thinner mortar layer between particles when the total amount of binder was kept constant [40]. Both authors expected the probability of collision between neighboring particles to rise, thus leading to an increase in dynamic viscosity. However, the effect plot of the impact of prolate particles on dynamic viscosity presented in Figure 5 does not reflect the observations described by Westerholm et al. [5] and Aissoun et al. [9]. A similar observation as the one in this study was, however, made by Zhao et al. [10]. A possible cause could be that prolate particles orient themselves in suspension with the longest dimension in the direction of motion. Although the effect of a thinner mortar layer between particles was expected to be present, the effect of orientation in suspension under motion may have been dominant here. Due to this orientation under motion, the risk of collision between particles might have decreased, and thus, the resistance against shearing was minimized.
Looking at the angularity and texture parameter AT d 50 , a strong impact on dynamic viscosity was only present for mortar mixtures with a high w/c ratio (see Figure 6a). Here, an increase in AT d 50 from 0.08 to 0.12 resulted in an increase in dynamic viscosity of 0.043 Nmm∙min. The observation that dynamic viscosity increased with increasing angularity and texture made for high w/c ratios corresponds to the results of other studies [7,8,9]. One possible cause may be in the higher specific surface area of particles with high angularity and texture in comparison to rounded particles. With a constant amount of mortar available, the mortar layer between particles decreased due to the increased amount necessary to cover each particle [40]. This could have led to more collisions between particles [7,8,9]. In addition, friction between angular and rough particles as well as particles and the binder matrix was higher than in the case of rounded particles [8]. Both causes could have led to the increased dynamic viscosity. This effect was, however, not observed for mixtures with a low w/c ratio. Here, an increase in AT d 50 from 0.08 to 0.12 resulted in a slight decrease in dynamic viscosity of 0.015 Nmm∙min. One reason could be that, for these mixtures, the dynamic viscosity is mainly driven by the properties of the binder matrix. As this binder was relatively stiff, it might have prevented the particles from colliding or interlocking. Testing of further mortar mixtures with additional w/c ratios could have been suitable for exploring this hypothesis. However, rheological measurements for mortars with very low w/c ratio might be difficult to carry out.
With respect to the spread of angularity and texture within the mixtures shown in Figure 6b, an increase in the parameter AT d 90 / 10 was observed for mixtures with a high w/c ratio and a decrease for mixtures with a low w/c ratio. In the case of a w/c ratio of 0.45, an increase of AT d 90 / 10 from 2 to 5 caused a decrease in dynamic viscosity of 0.030 Nmm∙min, whereas in the case of a high w/c ratio of 0.55, an increase of 0.014 Nmm∙min was observed. Mixtures with low AT d 90 / 10 contained either mainly round or mainly angular particles. Mixes between round and angular particles resulted in increasing AT d 90 / 10 values. A possible cause could be in the loosening effect, which describes a decrease in packing density due to mismatching particle sizes or shapes [41]. Looking at Table 1, it can be seen that a decrease in bulk density, a measure for packing density without compaction, was accompanied by an increase in AT d 90 / 10 . For mixtures with a high w/c ratio, an increased amount of binder would be necessary to fill the additional voids from the loosening effect, leading to a potential decrease in lubrication between particles. For mixtures with a low w/c ratio, the same loosening effect could have led to a decrease in the significance of the binder and an increase in the significance of the aggregate fraction for the mobility of particles within the mixture, resulting in a decreasing dynamic viscosity. Further tests on mortar mixtures with additional w/c ratios could contribute to exploring the underlying mechanisms.

3.2. Yield Stress

For yield stress, the resulting regression model is shown in Table 3. The model was significant (F(12, 144) = 2077.0, p < 0.000), with an R2 of 0.99. The dependent variable was log-transformed, and 1 missing data point and 2 outliers from a total of 160 observations were excluded. All four shape parameters had a significant influence on yield stress either as a main effect or as part of an interaction.
With respect to the number of prolate particles within a mixture, a different impact on yield stress depending on grading curve was observed (see Figure 7a). In comparison to other parameters like PRT d 50 , AT d 50 , and AT d 90 / 10 , the effect PRT had on yield stress was less pronounced (see Table 3). This is represented by the large scatter of data shown in Figure 7a as well as the comparably large confidence interval associated with the regression line in Figure 7a. Due to this large confidence interval, interpretation of the results is associated with severe uncertainty. Although the results in Figure 7a show no explicit impact of increasing PRT values on yield stress for grading curve BC, a more pronounced decrease was observed for mixtures with grading curve AB. Other studies observed either no impact of the elongation of prolate particles on yield stress [5] or an increasing yield stress with increasing elongation of particles [10], which is attributed to the thinner binder layer between particles. The difference between the two grading curves is in the higher number of fine aggregates for BC gradings. The reason for the decreasing yield stress with increasing number of prolate particles observed within this study could be the difference in packing when filling mortar in the measurement cell. If the particle shape differed from spherical, a loosening effect was observed in several studies [18,42,43]. The torque needed to overcome the static condition of a less packed mortar probe might be lower than for dense packings, resulting in a decrease in yield stress. The fact that this behavior was observed to be more pronounced for AB gradings than for BC gradings could indicate that the prolate shape of larger particles in particular leads to a loosening of the packing. This effect probably plays only a subordinate role for the yield stress, as in mixtures with BC grading the number of larger particles was low. However, a follow-up study considering additional grading curves could contribute to analyzing this effect in greater detail. In addition, aggregate samples with PRT values of between 10% and 40% could expand the informative value of the observed interaction between PRT and grading curve.
Looking at Figure 7b, an increase in PRT d 50 values of 1.0 to 1.5 caused an increase in yield stress of 4.61 Nmm followed by a decrease in yield stress of 3.03 Nmm for a rise in PRT d 50 from 1.5 to 2.0. Zhao et al. [10] observed an increase in yield stress when incorporating prolate particles. They indicated the increased probability of collision between prolate particles as a reason for the increasing yield stress. This trend is verified by the results presented here for low to moderate PRT d 50 values. The decrease in yield stress for increasing PRT d 50 from a moderate to high level shown in Figure 7b was, however, an unexpected observation. This decrease in yield stress could have resulted from an orientation of highly prolate particles along their major axis during the filling process. As the measurement motion occurred vertical to the filling direction, this effect could have led to a decrease in yield stress. Additional experimental tests are necessary.
With increasing angularity and texture AT d 50 as well as an increasing spread in angularity and texture AT d 90 / 10 , an increase in yield stress was observed, as shown in Figure 8a,b. Here, the results of multiple linear regression analysis reveal the importance of the consideration of interactions with other influencing parameters like w/c ratio or b/a ratio. An increase in AT d 50 from 0.08 to 0.12 caused an increase in yield stress of 2.74 Nmm for mixtures with a b/a ratio of 1.05 and an even stronger increase of 4.03 Nmm for mixtures with b/a ratio of 0.95. The impact of an increase in AT d 90 / 10 from 2.0 to 5.0 on yield stress depended on two interactions and ranged from an increase of 2.75 Nmm for mixtures with a w/c ratio of 0.55 and grading curve BC to an increase of 6.93 Nmm for mixtures with a w/c ratio of 0.45 and grading curve AB. This observation follows the expectations and is consistent with the results from other studies [9,10]. The increase in yield stress could have been caused by increasing friction between angular particles, according to Aissoun et al. [9]. In addition, the specific surface area increased for angular particles, resulting in a thinner layer of binder between particles and thus stiffer contact between particles [10,40]. This would also explain the different effects observed for mixtures with high and low b/a ratios. With a high b/a ratio, the remaining binder layer between particles was still larger than for mixtures with a low b/a ratio, probably resulting in a certain preservation of flexible contact between particles. Further experiments could include additional mortar mixtures covering a larger range of b/a ratios. The effect of increasing AT d 90 / 10 values was more pronounced for mixtures with grading curve AB and a low w/c ratio. Apparently, the difference in angularity values of the coarser particle fraction in particular seemed to influence yield stress. It was expected that, for high w/c ratio mixtures, the binder consistency would superimpose the interaction between round and angular particles and thus result in a less strong effect on yield stress in comparison to mixtures with a low w/c ratio.

3.3. Compressive Strength

Following the procedure used in Section 3.1 and Section 3.2, multiple linear regression analysis showed that the differences between natural and recycled aggregates could not be sufficiently explained by the considered variables. It was expected that the difference in particle strength would play an important role in mortar strength [29]. In addition, unhydrated cement could have been attached to recycled particles, impacting the strength behavior of the mortar produced within this study. Therefore, a simplified categorial factor for the material origin with the two levels of natural (N) and recycled (R) was considered as an additional input variable for the multiple linear regression analysis for flexural and compressive strength. The interaction between the variable origin and the shape parameters was considered. The interactions with the b/a ratio were excluded instead, as no significance was observed in trial tests. The fourth replication of compressive strength tests needed to be excluded due to a detected measurement error as well as one strong outlier, resulting in a total of 119 data points. The result of the multiple linear regression analysis for compressive strength is shown in Table 4. The model was significant (F(7, 111) = 342.0, p < 0.000), with an R2 of 0.95.
For compressive strength, no impact of the number of prolate particles or the degree of the l/t ratio was observed. This complies with the observation made by Aissoun et al. [9]. However, angularity and texture played an important role in affecting the compressive strength of mortar. For natural aggregates, an increasing compressive strength was observed with increasing angularity AT d 50 , as shown in Figure 9a. An increase in AT d 50 from 0.08 to 0.12 resulted in an increase in compressive strength of 7.61 MPa. As angular particles have a larger specific surface area than rounded particles, larger bond forces can form between the particle and the binder matrix [9,10,11]. In addition, the interlocking between particles increases [11]. Both effects result in an increase in compressive strength. However, for recycled aggregates, compressive strength decreased with increasing AT d 50 (see Figure 9a). As shown in Figure 9a, no sample with recycled aggregates in conjunction with very low or very high angularity was investigated in this study. Both recycled aggregate samples exhibited quite similar AT d 50 values. Therefore, the regression line in Figure 9a for recycled aggregates presented a strong extrapolation beyond the data points analyzed here. This is also indicated by the large confidence interval in the region of low angularity. It is therefore questionable whether higher strength could be achieved for mortar with recycled aggregates in combination with low angularity in comparison to natural aggregate mortar. Eckert and Oliveira [29] observed a decreasing compressive strength with an increasing number of recycled aggregates incorporated into a concrete mixture. They determined that one of the main causes of this behavior was the lower particle strength of recycled aggregates in comparison to that of natural aggregates. An interpretation of the results observed within this study was limited to the observed uncertainty regarding the course of the regression line, indicating the impact of AT d 50 on compressive strength for recycled aggregates. This result could suggest that different failure behavior for mortar specimens with recycled aggregates might apply. Due to the high porosity of aggregates and lower aggregate strength, fractures could occur within particles. This would explain the difference between the compressive strength of natural and recycled aggregate mortar mixtures. The decrease in compressive strength for recycled aggregates with increasing AT d 50 could have resulted from the higher probability of fracture of a particle if angularity was high in comparison to more rounded particles. However, additional tests covering a larger range of AT d 50 values for recycled aggregate samples, including a quantitative analysis of the number of fractured particles, would be necessary to confirm this theory.
Figure 9b shows that an increased spread of angularity AT d 90 / 10 resulted in a decrease in compressive strength, especially for mortar mixtures with a low w/c ratio. However, the confidence interval for AT d 90 / 10 values was high, making an interpretation of these results difficult. The large scatter of residual data points shown in Figure 9b also indicates no clear trend of compressive strength development depending on AT d 90 / 10 . To further explore this impact, additional tests with mortars of different w/c ratios could be useful. A potential cause could lie in the difference in bond forces between angular and rounded particles, resulting in an unequal distribution of compressive stresses. Thus, the potential for a fracture in an area of a concentration of compressive stresses might increase. Modeling of the stress distribution around angular and rounded aggregates could be useful for further investigation of the described effect.

3.4. Flexural Strength

The significant regression model (F(2, 155) = 90.07, p < 0.000) for the effect that particle shape has on flexural strength is shown in Table 5. Two missing data points were excluded from the analysis. The low R2 of 0.53 indicates that the considered input variables resulted in a comparably large fraction of unexplained variance.
The only statistically significant shape parameters besides the w/c ratio affecting flexural strength were angularity and texture AT d 50 , according to the results of this study. Going against expectations, parameters determining compressive strength as b/a ratio or material origin did not contribute to the explanation of variance for the regression model of flexural strength. No significant differences in flexural strength between mortar mixtures with natural and recycled aggregates were observed. Although the observed impact of the w/c ratio on flexural strength was small, an increase in AT d 50 from 0.08 to 0.12 resulted in an increase in flexural strength of 2.15 MPa (see Figure 10 and Table 5). The residual data points shown in Figure 10 also reveal this trend while also indicating the large scatter of the data. The comparably low coefficient of determination of R2 = 0.53 also reflects that part of the observed scatter remains unexplained by the regression model from Table 5. A large variance between results was observed during the flexural strength testing of replicated mortar mixtures with identical w/c ratio, b/a ratio, grading curve, and material used. This could have resulted from the three-point bending test setup used, which is known to result in larger variance between identical mortar mixtures in comparison to a four-point bending test setup [44]. For future investigations, a modification of the test setup could therefore be considered. The observation of increasing flexural strength with increasing angularity of particles corresponds to those of other studies [10,11]. Two effects, namely, the increased interlocking between particles [11] and the increased bond forces between particle and binder matrix due to the larger specific surface area of angular particles [10,11], led to the increase in flexural strength. Here, the origin of the aggregates, whether natural or recycled, did not seem to influence the measurement result.

4. Conclusions

In this study, the effect of particle shape and angularity on the dynamic viscosity and yield stress of fresh mortar as well as on the flexural and compressive strength of hardened mortar was investigated. In total, 40 different mortar mixtures were produced four times, each resulting in a test program based on 160 samples. A multiple linear regression analysis including the main effects and interactions was used to evaluate the impact of particle shape and angularity, determined by µCT imaging on mortar properties. The following conclusions can be drawn based on the presented results:
  • With an increasing number of prolate particles, a decrease in the dynamic viscosity was observed within this study. If reducing the risk of segregation of a mixture is the aim of optimization, a reduction in the number of prolate particles could therefore lead to an increase in dynamic viscosity. If an improvement in workability is the aim of optimization, an increase in the number of prolate particles could be beneficial. With respect to angularity, a strong increase in dynamic viscosity was observed for mixtures with a high w/c ratio with increasing angularity. To reduce the risk of segregation for mixtures with a high w/c ratio, it might be beneficial to include higher numbers of angular particles, like recycled fine aggregates. For mortar mixtures with a low w/c ratio, no strong impact of angularity on dynamic viscosity was observed.
  • The interaction between shape and angularity characteristics, mortar composition properties, and the yield stress of mortar mixtures was quite complex. For grading curves with low fine aggregate content (AB), decreasing yield stress was observed for increasing numbers of prolate particles, whereas there was no impact for grading curves with high fine aggregate content (BC). As severe scatter and large confidence intervals are associated with this observation, a follow-up study with additional experimental tests would be required to examine this impact in greater detail. In addition, a moderate increase in the degree of l/t ratio resulted in higher yield stresses, whereas very high degrees of l/t ratio seemed to result in decreasing yield stress values. Thus, to improve the workability of mortar, the incorporation of prolate particles for grading curves with low fine aggregate content could be suitable. With increasing angularity, yield stress increased as well. From a practical point of view, reducing the number of angular particles as well as the degree of angularity could lead to mortar mixtures with improved workability.
  • For compressive strength, an increase was observed with increasing angularity of natural aggregates. Increasing the number of fine crushed natural aggregates with higher angularity in comparison to weathered fine aggregates resulted in higher compressive strength values for mortar. However, when fine recycled aggregates were incorporated into mortar mixtures, a different impact on compressive strength was observed, associated with large confidence intervals that showed the uncertainty related to this observation. Independent of angularity, a lower compressive strength was observed for mortar mixtures with recycled aggregates in comparison to mixtures with natural aggregates. For a reliable interpretation of results, additional experimental tests covering a larger range of angularity and texture characteristics for recycled aggregate samples is required.
  • With increasing angularity and texture, an increase in flexural strength was observed independent of the use of natural or recycled fine aggregates. The results show a comparably large number of unexplained variance, which could have been caused by the test setup used. Incorporating crushed natural or recycled aggregates into mortar mixtures with increased angularity and texture in comparison to natural aggregates therefore had a potential positive effect on flexural strength.
In summary, prolate particles and particle angularity have a decisive influence on fresh mortar properties like yield stress and dynamic viscosity, as well as on hardened mortar properties like compressive and flexural strength. Incorporating crushed fine aggregates with shape and angularity differing from the characteristics of natural fine aggregates thus has a complex impact on various mortar properties. The results obtained within this study show that careful balancing of the aggregate fraction with respect to the particle l/t ratio and angularity is required and can allow for larger fractions of crushed fine aggregates in mortar mix design.
As differences in particle shape and angularity are introduced by incorporating fine aggregates of different origin, other characteristics, such as mineralogical composition, may have contributed to the unexplained variance observed for the four regression models presented in Section 3.1, Section 3.2, Section 3.3 and Section 3.4. Thus, the presented impact of shape and angularity on rheological mortar properties, but which was more notable on strength properties, may be partially influenced by material origin. Using the presented results for extrapolation beyond the framework of the discussed regression analysis is error prone. Therefore, future investigations could extend the number of considered variables as well as the range of factor levels covered. This could include larger ranges of grading curves, w/c ratios, b/a ratios, and materials, as well as additional independent variables like chemical composition of aggregates, particle strength, number of unhydrated cement residuals attached to recycled aggregates, or the impact of different cement types, plus additional dependent variables like slump, splitting strength, or modulus of elasticity. As µCT imaging provides the 3D digital representation of particles within a sample, the presented results could serve as a basis for discrete element modeling of the impact of aggregates on rheological and strength parameters of mortar or even concrete. With respect to the transferability of the presented results from mortar to concrete, additional tests for upscaling to the concrete level would be necessary.

Author Contributions

Conceptualization, S.B. and W.B.; methodology, S.B.; formal analysis, S.B.; investigation, S.B.; writing—original draft preparation, S.B.; writing—review and editing, S.B. and W.B.; visualization, S.B.; supervision, W.B.; project administration, W.B.; funding acquisition, W.B. All authors have read and agreed to the published version of the manuscript.

Funding

This research was funded by DEUTSCHE FORSCHUNGSGEMEINSCHAFT (DFG, German Research Foundation), grant number 413140723.

Data Availability Statement

The data presented in this study are available on request from the corresponding author.

Conflicts of Interest

The authors declare no conflicts of interest.

Abbreviations

2DTwo-dimensional
3DThree-dimensional
ABGrading curve with a larger coarse aggregate fraction
AT d 50 Median value of AT for a particle sample
AT d 90 / 10 Ratio of the AT value at a cumulative volume passing of 90% to 10%
b/a ratioBinder–aggregate ratio
BCGrading curve with a larger number of fine aggregates
GGlass beads
lParticle length
µCTMicro-computed tomography
MCrushed microdiorite
NNatural material origin
PRTNumber of prolate particles in comparison to the total number of Particles
PRT d 50 Median of the ratio of l/t of all particles classified as prolate
RRecycled material origin
RCRecycled concrete
RMRecycled masonry
SNatural sand
SASurface area
SA CH Surface area of the convex hull
tParticle thickness
wParticle width
w/c ratioWater–cement ratio

References

  1. Torres, A.; Brandt, J.; Lear, K.; Liu, J. A looming tragedy of the sand commons: Increasing sand extraction, trade and consumption pose global sustainability challenges. Science 2017, 357, 970–971. [Google Scholar] [CrossRef] [PubMed]
  2. Rentier, E.S.; Cammeraat, L.H. The environmental impacts of river sand mining. Sci. Total Environ. 2022, 838, 155877. [Google Scholar] [CrossRef] [PubMed]
  3. United Nations Environment Programme. Sand and Sustainability: Finding New Solutions for Environmental Governance of Global Sand Resources; United Nations Environment Programme: Geneva, Switzerland, 2019. [Google Scholar]
  4. United Nations Environment Programme. Sand and Sustainability: 10 Strategic Recommendations to Avert a Crisis; United Nations Environment Programme: Geneva, Switzerland, 2022. [Google Scholar]
  5. Westerholm, M.; Lagerblad, B.; Silfwerbrand, J.; Forssberg, E. Influence of fine aggregate characteristics on the rheological properties of mortars. Cem. Concr. Compos. 2008, 30, 274–282. [Google Scholar] [CrossRef]
  6. Khatib, J. Properties of concrete incorporating fine recycled aggregate. Cem. Concr. Res. 2005, 35, 763–769. [Google Scholar] [CrossRef]
  7. Ren, Q.; Tao, Y.; Jiao, D.; Jiang, Z.; Ye, G.; De Schutter, G. Plastic viscosity of cement mortar with manufactured sand as influenced by geometric features and particle size. Cem. Concr. Compos. 2021, 122, 104163. [Google Scholar] [CrossRef]
  8. Cordeiro, G.C.; de Alvarenga, L.M.S.C.; Rocha, C.A.A. Rheological and mechanical properties of concrete containing crushed granite fine aggregate. Constr. Build. Mater. 2016, 111, 766–773. [Google Scholar] [CrossRef]
  9. Aissoun, B.M.; Hwang, S.-D.; Khayat, K.H. Influence of aggregate characteristics on workability of superworkable concrete. Mat. Constr. 2016, 49, 597–609. [Google Scholar] [CrossRef]
  10. Zhao, Y.; Duan, Y.; Zhu, L.; Wang, Y.; Jin, Z. Characterization of coarse aggregate morphology and its effect on rheological and mechanical properties of fresh concrete. Constr. Build. Mater. 2021, 286, 122940. [Google Scholar] [CrossRef]
  11. Donza, H.; Cabrera, O.; Irassar, E. High-strength concrete with different fine aggregate. Cem. Concr. Res. 2002, 32, 1755–1761. [Google Scholar] [CrossRef]
  12. Polat, R.; Yadollahi, M.M.; Sagsoz, A.E.; Arasan, S. The correlation between aggregate shape and compressive strength of concrete: Digital image processing approach. Int. J. Struct. Civ. Eng. Res. 2013, 2, 62–80. [Google Scholar]
  13. DIN EN 933-3; Tests for Geometrical Properties of Aggregates: Part 3: Determination of Particle Shape—Flakiness Index. DIN German Institute for Standardization. Beuth Verlag GmbH: Berlin, Germany, 2012.
  14. DIN EN 933-4; Tests for Geometrical Properties of Aggregates: Part 4: Determination of Particle Shape—Shape Index. DIN German Institute for Standardization. Beuth Verlag GmbH: Berlin, Germany, 2015.
  15. Garboczi, E.J.; Liu, X.; Taylor, M.A. The 3-D shape of blasted and crushed rocks: From 20 μm to 38 mm. Powder Technol. 2012, 229, 84–89. [Google Scholar] [CrossRef]
  16. Cepuritis, R.; Garboczi, E.J.; Jacobsen, S.; Snyder, K.A. Comparison of 2-D and 3-D shape analysis of concrete aggregate fines from VSI crushing. Powder Technol. 2017, 309, 110–125. [Google Scholar] [CrossRef]
  17. Erdoğan, S.T.; Garboczi, E.J.; Fowler, D.W. Shape and size of microfine aggregates: X-ray microcomputed tomography vs. laser diffraction. Powder Technol. 2007, 177, 53–63. [Google Scholar] [CrossRef]
  18. Estephane, P.; Garboczi, E.J.; Bullard, J.W.; Wallevik, O.H. Three-dimensional shape characterization of fine sands and the influence of particle shape on the packing and workability of mortars. Cem. Concr. Compos. 2019, 97, 125–142. [Google Scholar] [CrossRef]
  19. Zhang, D.; Huang, X.; Zhao, Y. Investigation of the shape, size, angularity and surface texture properties of coarse aggregates. Constr. Build. Mater. 2012, 34, 330–336. [Google Scholar] [CrossRef]
  20. DIN EN 933-1; Tests for Geometrical Properties of Aggregates: Part 1: Determination of Particle Size Distribution—Sieving method. DIN German Institute for Standardization. Beuth Verlag GmbH: Berlin, Germany, 2012.
  21. DIN 1045-2; Concrete, Reinforced and Prestressed Concrete Structures: Part 2: Concrete. DIN German Institute for Standardization. Beuth Verlag GmbH: Berlin, Germany, 2023.
  22. DIN EN 1097-6; Tests for Mechanical and Physical Properties of Aggregates: Part 6: Determination of Particle Density and Water Absorption. DIN German Institute for Standardization. Beuth Verlag GmbH: Berlin, Germany, 2013.
  23. Kim, J.; Zi, G.; Lange, D.A. Measurement of water absorption of very fine particles using electrical resistivity. ACI Mater. J. 2017, 114, 957–965. [Google Scholar] [CrossRef]
  24. DIN EN 1097-3; Tests for Mechanical and Physical Properties of Aggregates: Part 3: Determination of Loose Buld Density and Voids. DIN German Institute for Standardization. Beuth Verlag GmbH: Berlin, Germany, 1998.
  25. Burgmann, S.; Godehardt, M.; Schladitz, K.; Breit, W. Influence of voxel size for µCT imaging of particles on measurement accuracy. Constr. Build. Mater. 2021, 289, 123148. [Google Scholar] [CrossRef]
  26. DIN EN ISO 15708-3; Non-Destructive Testing—Radiation Methods for Computed Tomography: Part 3: Operation and Interpretation. DIN German Institute for Standardization. Beuth Verlag GmbH: Berlin, Germany, 2018.
  27. Burgmann, S.; Godehardt, M.; Schladitz, K.; Breit, W. Separation of sand and gravel particles in 3D images using the adaptive h-extrema transform. Powder Technol. 2022, 404, 117468. [Google Scholar] [CrossRef]
  28. Blott, S.J.; Pye, K. Particle shape: A review and new methods of characterization and classification. Sedimentology 2008, 55, 31–63. [Google Scholar] [CrossRef]
  29. Eckert, M.; Oliveira, M. Mitigation of the negative effects of recycled aggregate water absorption in concrete technology. Constr. Build. Mater. 2017, 133, 416–424. [Google Scholar] [CrossRef]
  30. DIN EN 196-1; Methods of Testing Cement: Part 1: Determination of Strength. DIN German Institute for Standardization. Beuth Verlag GmbH: Berlin, Germany, 2016.
  31. Banfill, P.F.G. Rheology of fresh cement and concrete. Rheol. Rev. 2006, 61–130. [Google Scholar]
  32. Bingham, E.C. Fluidity and Plasticity, 1st ed.; McGraw-Hill Book Company: New York, NY, USA, 1922. [Google Scholar]
  33. Banfill, P.F.G. The rheology of fresh mortar. Mag. Concr. Res. 1991, 43, 13–21. [Google Scholar] [CrossRef]
  34. R Core Team. R.; R Foundation for Statistical Computing: Vienna, Austria, 2022. [Google Scholar]
  35. Harrell, F.E. Regression Modeling Strategies: With Applications to Linear Models, Logistic Regression, and Survival Analysis, 1st ed.; Springer: New York, NY, USA, 2001; ISBN 978-1-4419-2918-1. [Google Scholar]
  36. Schwarz, G. Estimating the dimensions of a model. Ann. Stat. 1978, 6, 461–464. [Google Scholar] [CrossRef]
  37. Dormann, C.F.; Elith, J.; Bacher, S.; Buchmann, C.; Carl, G.; Carré, G.; Marquéz, J.R.G.; Gruber, B.; Lafourcade, B.; Leitão, P.J.; et al. Collinearity: A review of methods to deal with it and a simulation study evaluating their performance. Ecography 2013, 36, 27–46. [Google Scholar] [CrossRef]
  38. Shapiro, S.S.; Wilk, M.B. An analysis of variance test for normality (complete samples). Biometrika 1965, 52, 591–611. [Google Scholar] [CrossRef]
  39. Breusch, T.S.; Pagan, A.R. A simple test for heteroscedasticity and random coefficient variation. Econometrica 1979, 47, 1287–1294. [Google Scholar] [CrossRef]
  40. Popovics, S. Aggregate grading and the internal structure of concrete. Highw. Res. Rec. 1973, 56–64. [Google Scholar]
  41. de Larrard, F. Concrete Mixture Proportioning: A Scientific Approach, 1st ed.; E & FN Spon/Routledge: London, UK, 1999; ISBN 0419235000. [Google Scholar]
  42. Zou, R.P.; Yu, A.B. Evaluation of the packing characteristics of mono-sized non-spherical particles. Powder Technol. 1996, 88, 71–79. [Google Scholar] [CrossRef]
  43. Hafid, H.; Ovarlez, G.; Toussaint, F.; Jezequel, P.H.; Roussel, N. Effect of particle morphological parameters on sand grains packing properties and rheology of model mortars. Cem. Concr. Res. 2016, 80, 44–51. [Google Scholar] [CrossRef]
  44. Wright, P.J.F.; Garwood, F. The effect of the method of test on the flexural strength of concrete. Mag. Concr. Res. 1952, 4, 67–76. [Google Scholar] [CrossRef]
Figure 1. AB and BC grading curves of natural and crushed materials as well as glass beads.
Constrmater 04 00003 g001
Figure 2. Two-dimensional slice of the reconstructed particle sample after µCT imaging, image processing, and particle segmentation: (a) glass beads, (b) natural sand, (c) crushed microdiorite, (d) recycled concrete, and (e) recycled masonry.
Constrmater 04 00003 g002
Figure 3. Characterization of angularity and texture for the ten material samples: (a) ATd50 and (b) ATd90/10.
Constrmater 04 00003 g003
Figure 4. Characterization of prolate particles within the ten material samples: (a) PRT d 50 and (b) PRT.
Constrmater 04 00003 g004
Figure 5. Effect plot of the impact of PRT on dynamic viscosity, including residual data points.
Constrmater 04 00003 g005
Figure 6. Impact of angularity and texture on dynamic viscosity, including residual data points: (a) effect plot of the impact of AT d 50 depending on the w/c ratio and (b) effect plot of the impact of AT d 90 / 10 depending on the w/c ratio.
Constrmater 04 00003 g006
Figure 7. Impact of prolate particles on yield stress, including residual data points: (a) effect plot of the impact of PRT depending on the grading curve and (b) effect plot of the impact of PRT d 50 .
Constrmater 04 00003 g007
Figure 8. Impact of angularity and texture on yield stress, including residual data points: (a) effect plot of the impact of AT d 50  depending on the b/a ratio and (b) effect plot of the impact of AT d 90 / 10 depending on the w/c ratio.
Constrmater 04 00003 g008
Figure 9. Impact of angularity and texture on compressive strength, including residual data points: (a) effect plot of the impact of AT d 50 depending on material origin and (b) effect plot of the impact of AT d 90 / 10 depending on the w/c ratio.
Constrmater 04 00003 g009
Figure 10. Effect plot of the impact of AT d 50 on flexural strength, including residual data points.
Constrmater 04 00003 g010
Table 1. Characteristics of the materials used in this study.
MaterialGrading CurveBulk Density ρ b (g/cm³)Apparent Density ρ a (g/cm³)Water Absorption (%)
Glass beadsAB1.622.490.00
(G)BC1.612.490.00
Natural sandAB1.532.621.28
(S)BC1.522.631.71
Crushed microdioriteAB1.463.071.80
(M)BC1.473.112.70
Recycled concreteAB1.082.6715.10
(RC)BC1.072.6716.50
Recycled masonryAB1.172.6413.70
(RM)BC1.222.7113.70
Table 2. Result of the regression analysis for the evaluation of the impact of prolate particles and the angularity of particles on the log-transform of the dynamic viscosity of mortar.
VariableCoefficientStandard Errorp-Value
Intercept−1.49320.07440.000
w/c (0.55)−1.47450.09910.000
PRT−0.00350.00120.005
AT d 50 −0.83000.82450.3157
w/c (0.55): AT d 50 5.35720.90420.000
AT d 90 / 10 −0.07060.01260.000
w/c (0.55): AT d 90 / 10 0.12490.01610.000
Table 3. Result of the regression analysis for the evaluation of the impact of prolate particles and the angularity of particles on the log-transform of the yield stress of mortar.
VariableCoefficientStandard Errorp-Value
Intercept−0.74360.24890.003
w/c (0.55)−1.06300.01810.000
b/a (1.05)−0.04070.03470.242
Grading (BC)−0.26480.04330.000
PRT−0.01030.00090.000
Grading (BC):PRT0.01050.00110.000
PRT d 50 4.86300.40290.000
PRT d 50 2 −1.54970.12120.000
AT d 50 7.27110.45100.000
b/a (1.05): AT d 50 −1.36410.32180.000
AT d 90 / 10 0.07360.00790.000
w/c (0.55): AT d 90 / 10 0.03220.00570.000
Grading (BC): AT d 90 / 10 −0.03520.00780.000
Table 4. Result of the regression analysis for the evaluation of the impact of prolate particles and the angularity of particles on the compressive strength of mortar.
VariableCoefficientStandard Errorp-Value
Intercept52.131.560.000
w/c (0.55)−11.760.990.000
b/a (1.05)0.980.370.008
Origin (R)84.0621.390.000
Origin (R): AT d 50 −891.03181.740.000
AT d 90 / 10 −1.490.850.082
w/c (0.55): AT d 90 / 10 1.300.310.000
Table 5. Result of the regression analysis for the evaluation of the impact of particle angularity on the flexural strength of mortar.
VariableCoefficientStandard Errorp-Value
Intercept−0.270.450.55
w/c (0.55)0.390.170.02
AT d 50 53.744.070.00
Disclaimer/Publisher’s Note: The statements, opinions and data contained in all publications are solely those of the individual author(s) and contributor(s) and not of MDPI and/or the editor(s). MDPI and/or the editor(s) disclaim responsibility for any injury to people or property resulting from any ideas, methods, instructions or products referred to in the content.

