Article

Sustainability Analysis of Interior Coatings for the Prevention of Fungal Development

School of Engineering, University of Minho, Campus de Azurém, 4800-058 Guimarães, Portugal
*
Author to whom correspondence should be addressed.
Constr. Mater. 2022, 2(1), 27-39; https://doi.org/10.3390/constrmater2010003
Submission received: 28 October 2021 / Revised: 4 January 2022 / Accepted: 12 January 2022 / Published: 23 January 2022

Abstract

:
The construction sector is currently challenged by environmental concerns, reducing energy consumption, and optimising the use of raw materials, hence the need to use new technologies and materials that have a better lifecycle performance. Recycling end-of-life materials or using industrial by-products is a solution in which resources are used efficiently. The considerable contribution of the production of hydraulic lime mortars to the environment, especially in relation to carbon dioxide emissions, is noteworthy. The study and use of nanotechnology and by-products, such as microgranulated corks, are solutions for more sustainable options, as they are more durable, and their properties are similar to conventional mortars. In this study, we explored the environmental benefits of mortars; to this end, we added different percentages of nano-TiO2 and microgranulated cork that can be used in the production of mortars based on hydraulic lime but with antifungal properties. With the analysed results, we verified that these two additives, besides presenting benefits regarding antifungal properties, are viable alternatives to chemical biocides and sustainable options for the mortar industry to improve its environmental performance. The best environmental performance is obtained with mortar with 2% microgranulated cork.

1. Introduction

For over 10,000 years, the oldest mortars discovered are in Galilee, located in the modern-day state of Israel, using binders such as aerial lime and gypsum. Mortars using hydraulic lime as a binder were used in Jerusalem cisterns built during the Phoenician era [1].
In Portugal, at the beginning of the 19th century, the main binder was Portland cement, which replaced hydraulic lime and hydrated lime, due to its reduced curing time, ease of use and storage, and better mechanical behaviour. However, Portland cement performs poorly when applied to old buildings, due to its high stiffness and susceptibility to cracking [2,3].
Usually, in old buildings, it is necessary to renovate part or all of the coatings, due to their high state of degradation [4].
In recent times, and as a result of several studies, hydraulic lime has been seen as a suitable binder for obtaining high-grade coatings for old buildings.
Nanomaterials assume increasingly important roles in civil construction and in the most diverse areas of science [5]. Recent advances in nanotechnology that break certain limitations existing in construction materials enable products with new functionalities and significant contributions to environmental, sustainable, and rehabilitation issues [6].
Nanotechnology is considered one of the most promising technologies of the future. The quantum mechanical properties of materials at the nanoscale (less than 100 nanometres) are important for the development of new products and applications. TiO2 has been one of the most studied by the scientific and industrial community due to its characteristics of surface self-cleaning and purification of some atmospheric pollutants [7]. Nanofibers with silver and copper are useful for protection against mould in buildings, serving as alternatives to classical methods (spraying biocides and paints) to protect against biological deterioration. Two major advantages ought to be highlighted—their low cost and simple or effortless application. Experimentally excellent results were obtained [8].
Some proposals refer to photocatalytic coatings with the addition of silver and silica nanoparticles in order to reduce the contamination of microorganisms in buildings [9].
Fungi are found everywhere, including inside buildings. The genera Alternaria, Cladosporium, and Epicoccum are those that are predominately found in communities in moderate-to-humid climatic zones [10]. The decline in the quality of both building surfaces and the environment is largely due to the development of fungi on the surface, in cracks, and inside the pores of walls and ceilings.
Most studies analyse and characterise the composition of fungi communities in a simplistic way. Most of the studies refer to old buildings [11]. In these studies, fungi were collected in various types of materials: cementitious renders, concrete, plaster, plasterboard, etc.
Symptoms such as sore throat, rhinitis, and cough are most common in buildings where there is fungal contamination, especially in damp areas. In addition to the allergic problems mentioned, fungal development also poses aesthetic and hygiene problems.
In a study carried out in Wales, they found that in homes ‘contaminated’ predominantly with Penicillium and Cladosporium, 30 to 40% of users suffer from asthma [12]. Fungi genera such as Cladosporium, Penicillium, and Aspergillus were the ones most frequently detected according to a study carried out in the São Paulo region of Brazil [13].
There are few data or case studies on fungi development inside buildings; for instance, in Portugal, some studied identified species of fungi in monuments, but outside buildings, as in the study carried out in Sé Catedral de Lamego [14].
In a study carried out in the towns of Sendim, Vila Real, and Porto in northern Portugal, in houses with walls and ceilings covered with plaster, plasterboard, and tin plaster, fungi of the genera Aspergillus, Penicillium, Cladosporium, and Alternaria were detected [15]. The fungus Cladosporium was collected and used in the investigated samples of this study, as it is considered one of the most ‘aggressive’ (develops and damages materials very fast) fungi.
With current efforts to improve the internal environment of buildings, the use of biocides is the most used solution to remedy and prevent the appearance of mould. Most biocides used with antifungal characteristics are harmful to people, animals, and the environment. Consequently, we need to find biocides with better environmental performance.
For buildings, the complete assessment of their sustainability includes construction, use, maintenance, repair, modernisation, rehabilitation, and finally, dismantling and demolition or recycling. Therefore, life cycle analysis (LCA) in buildings, as it involves many products and companies, becomes a task of considerable complexity. The longer the life cycle, the better. More recent methods of LCA include incorporating economic analysis in their evaluation, which is an important factor for any approach in construction, including sustainable principles. The increase in sustainable alternatives will influence the construction industry [16]. Inventory analysis can be extremely complex and involve tens or hundreds of unit processes. The more rigorous the LCA methods are, the more data will be needed, leading to large expenses in collecting and updating them.
Some methods aim to simplify LCA for practical use. These methods are not comprehensive, but they play essential roles in making buildings more sustainable.
The mechanical and physical properties of mortars for interior coatings of buildings, with additives with TiO2 and microgranulated cork, were analysed in several studies [17,18]. In Section 2 of this study, the formulations and results of the mechanical tests performed are presented. Section 3 summarises and compares the results of microscopic observation of the evolution of fungi in two mortar samples at 118 days. These two sections serve to frame (we do not detail the analyses) the main objective of this study, which is the analysis of the sustainable properties of the mortars presented.

2. Studied Mortar Formulations

2.1. Materials

The following materials were used for the formulations [17,18]:
(1)
Hydraulic lime as a binder (density of 1400 kg/m3; particles size < 200 µm, Secil, Maceira, Portugal);
(2)
River sand (density of 2569 kg/m3; mean particle size of 0.762 mm);
(3)
Superplasticiser (SP) based on polyacrylate (density of 1050 kg/m3) (Master Builders Solutions España, SL, Carnaxide, Portugal)
(4)
Microgranulated cork MF8 (density of 300 kg/m3; mean diameter of 51.75 µm);
(5)
nano-TiO2 (density of 3800 kg/m3; mean diameter primary particles approx. 21 nm, with 80% anatase and 20% rutile, Evonik Degussa GmbH, Hanau, Germany).

2.2. Composition and Fabrication

Different formulations were developed for each type of nano- and micro-additive; the composition of these formulations (proportions needed to produce 1 m3 of mortar) is presented in Table 1. The formulations under study were composed of nano-TiO2 (2, 4, and 6%) and microgranulated cork (2, 4, 6, and 8%) in different percentages (in relation to the binder), as well as a sample without the addition of nano- or micro-additive, used as a reference. For investigating flexural strength, 27 samples (3 per mortar) were used, and for the analysis of compression strength, 54 samples (6 per mortar) were used.
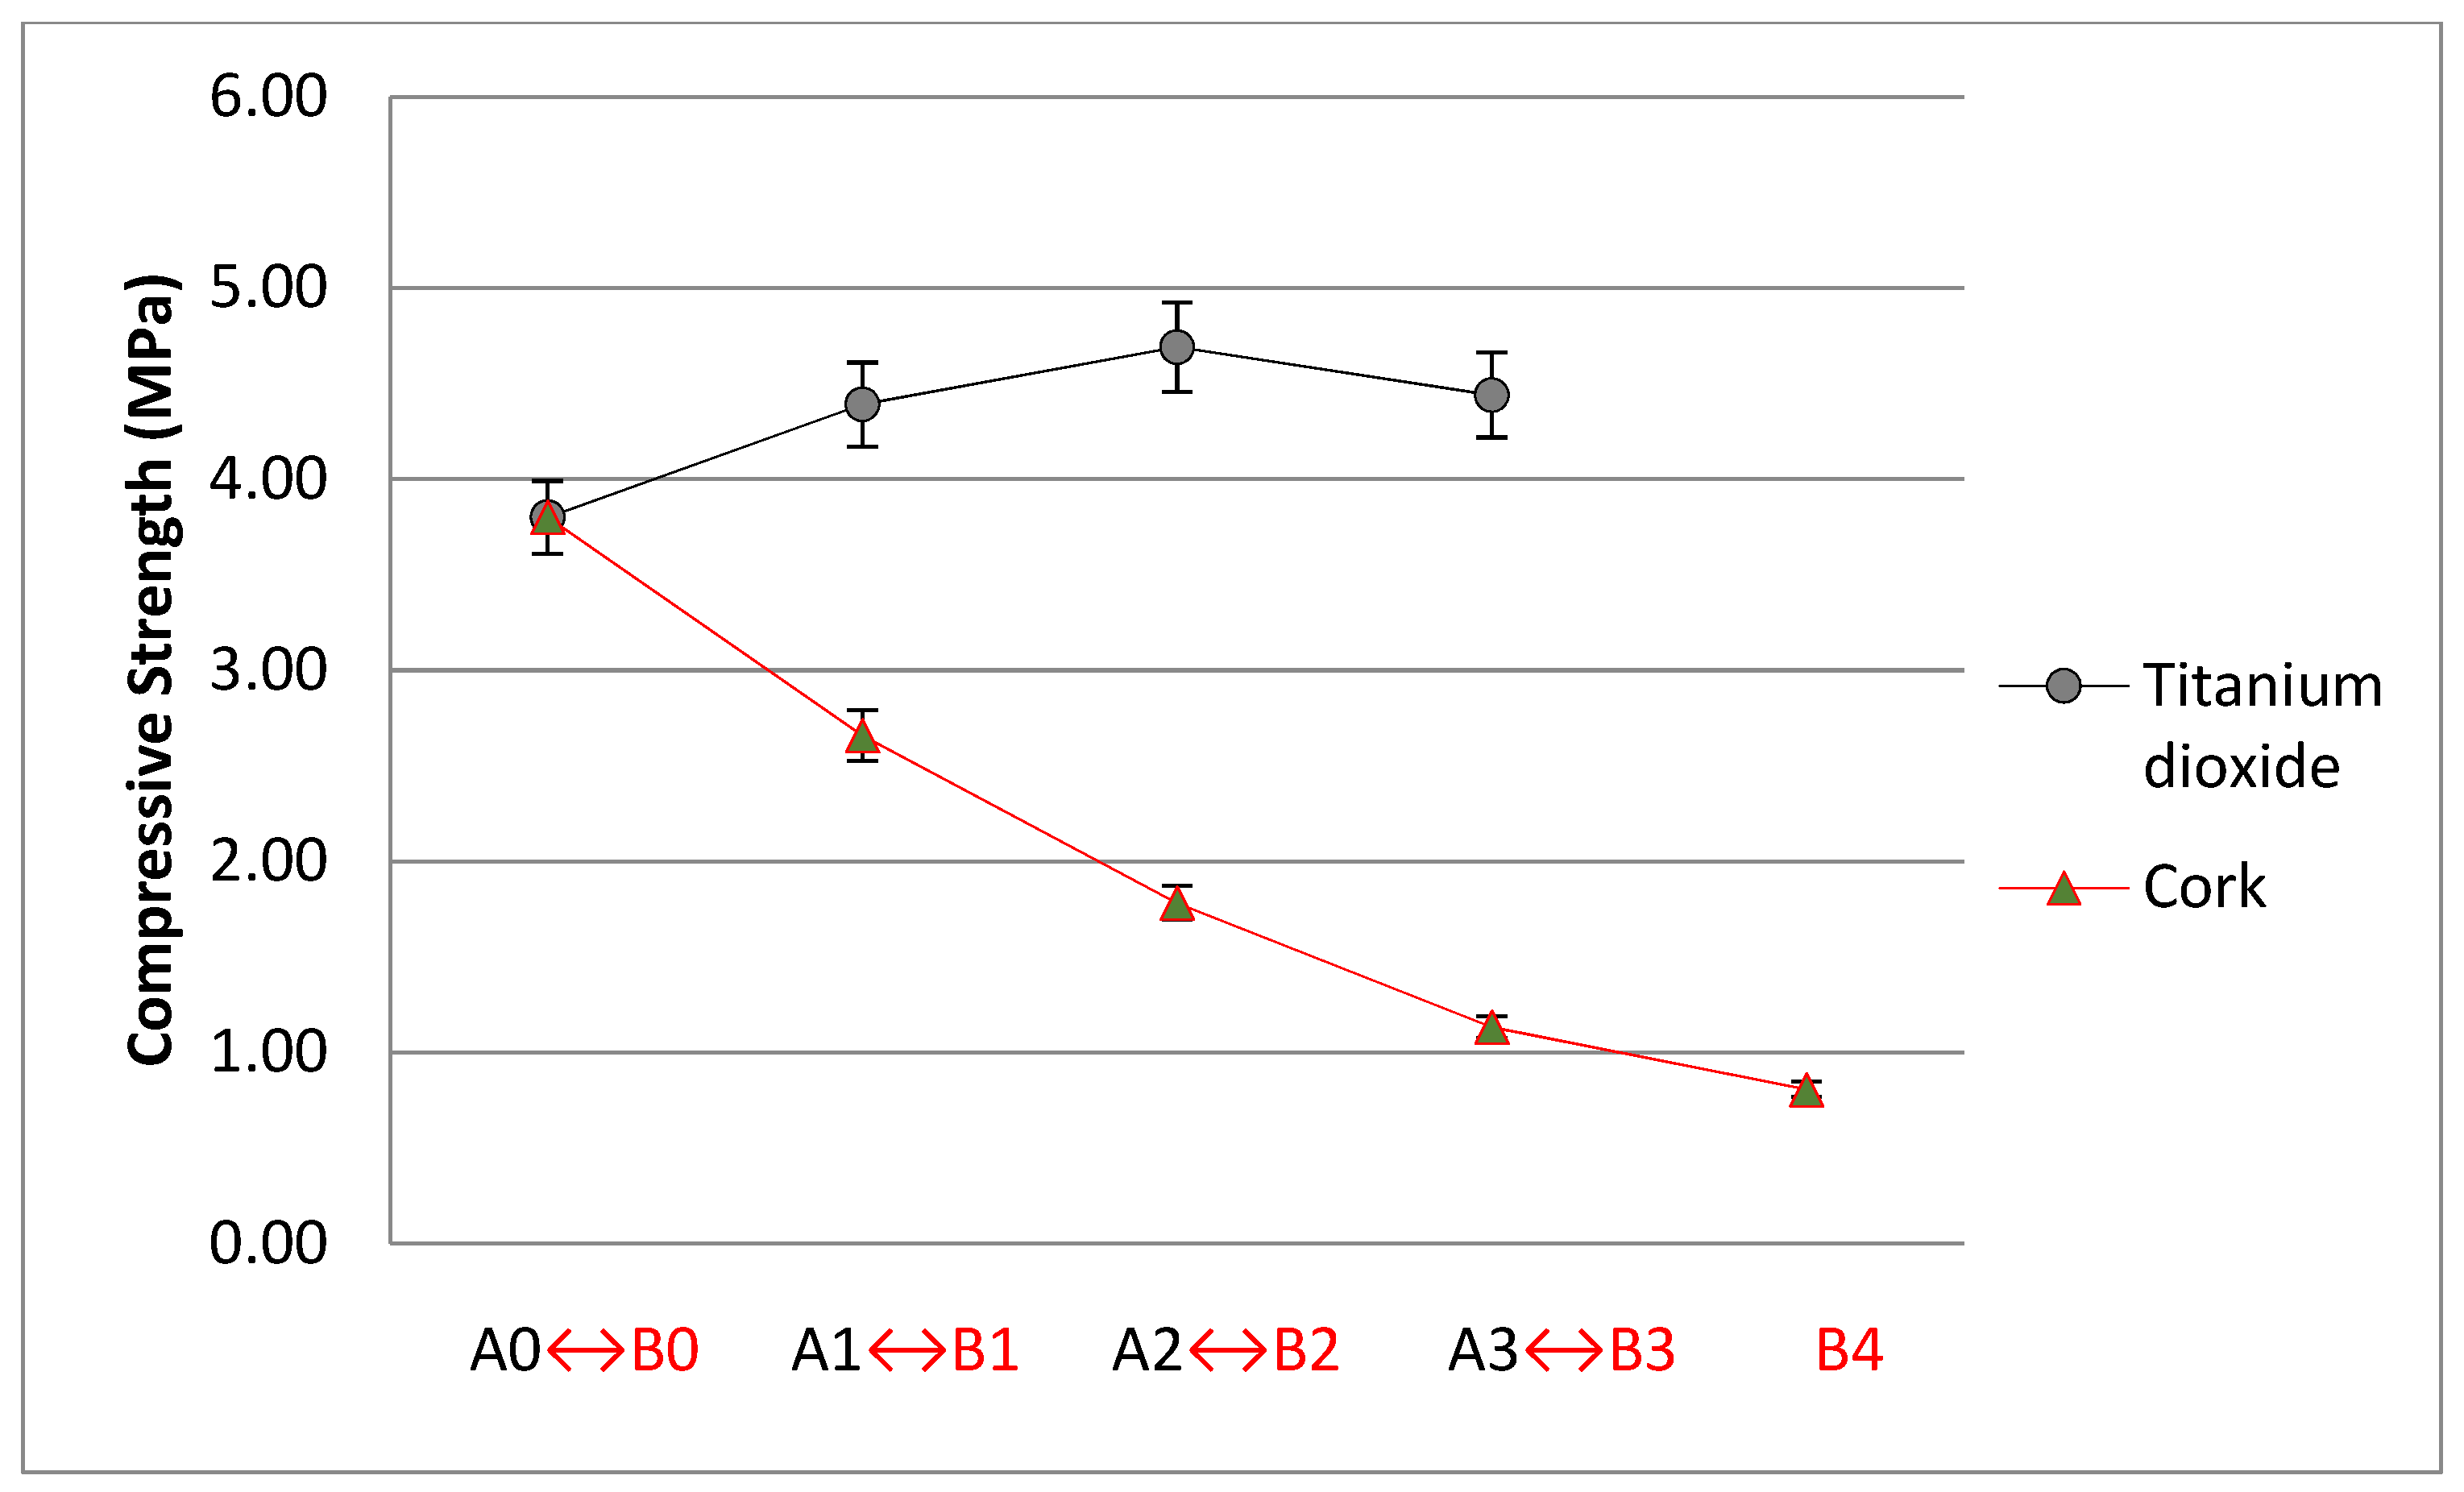
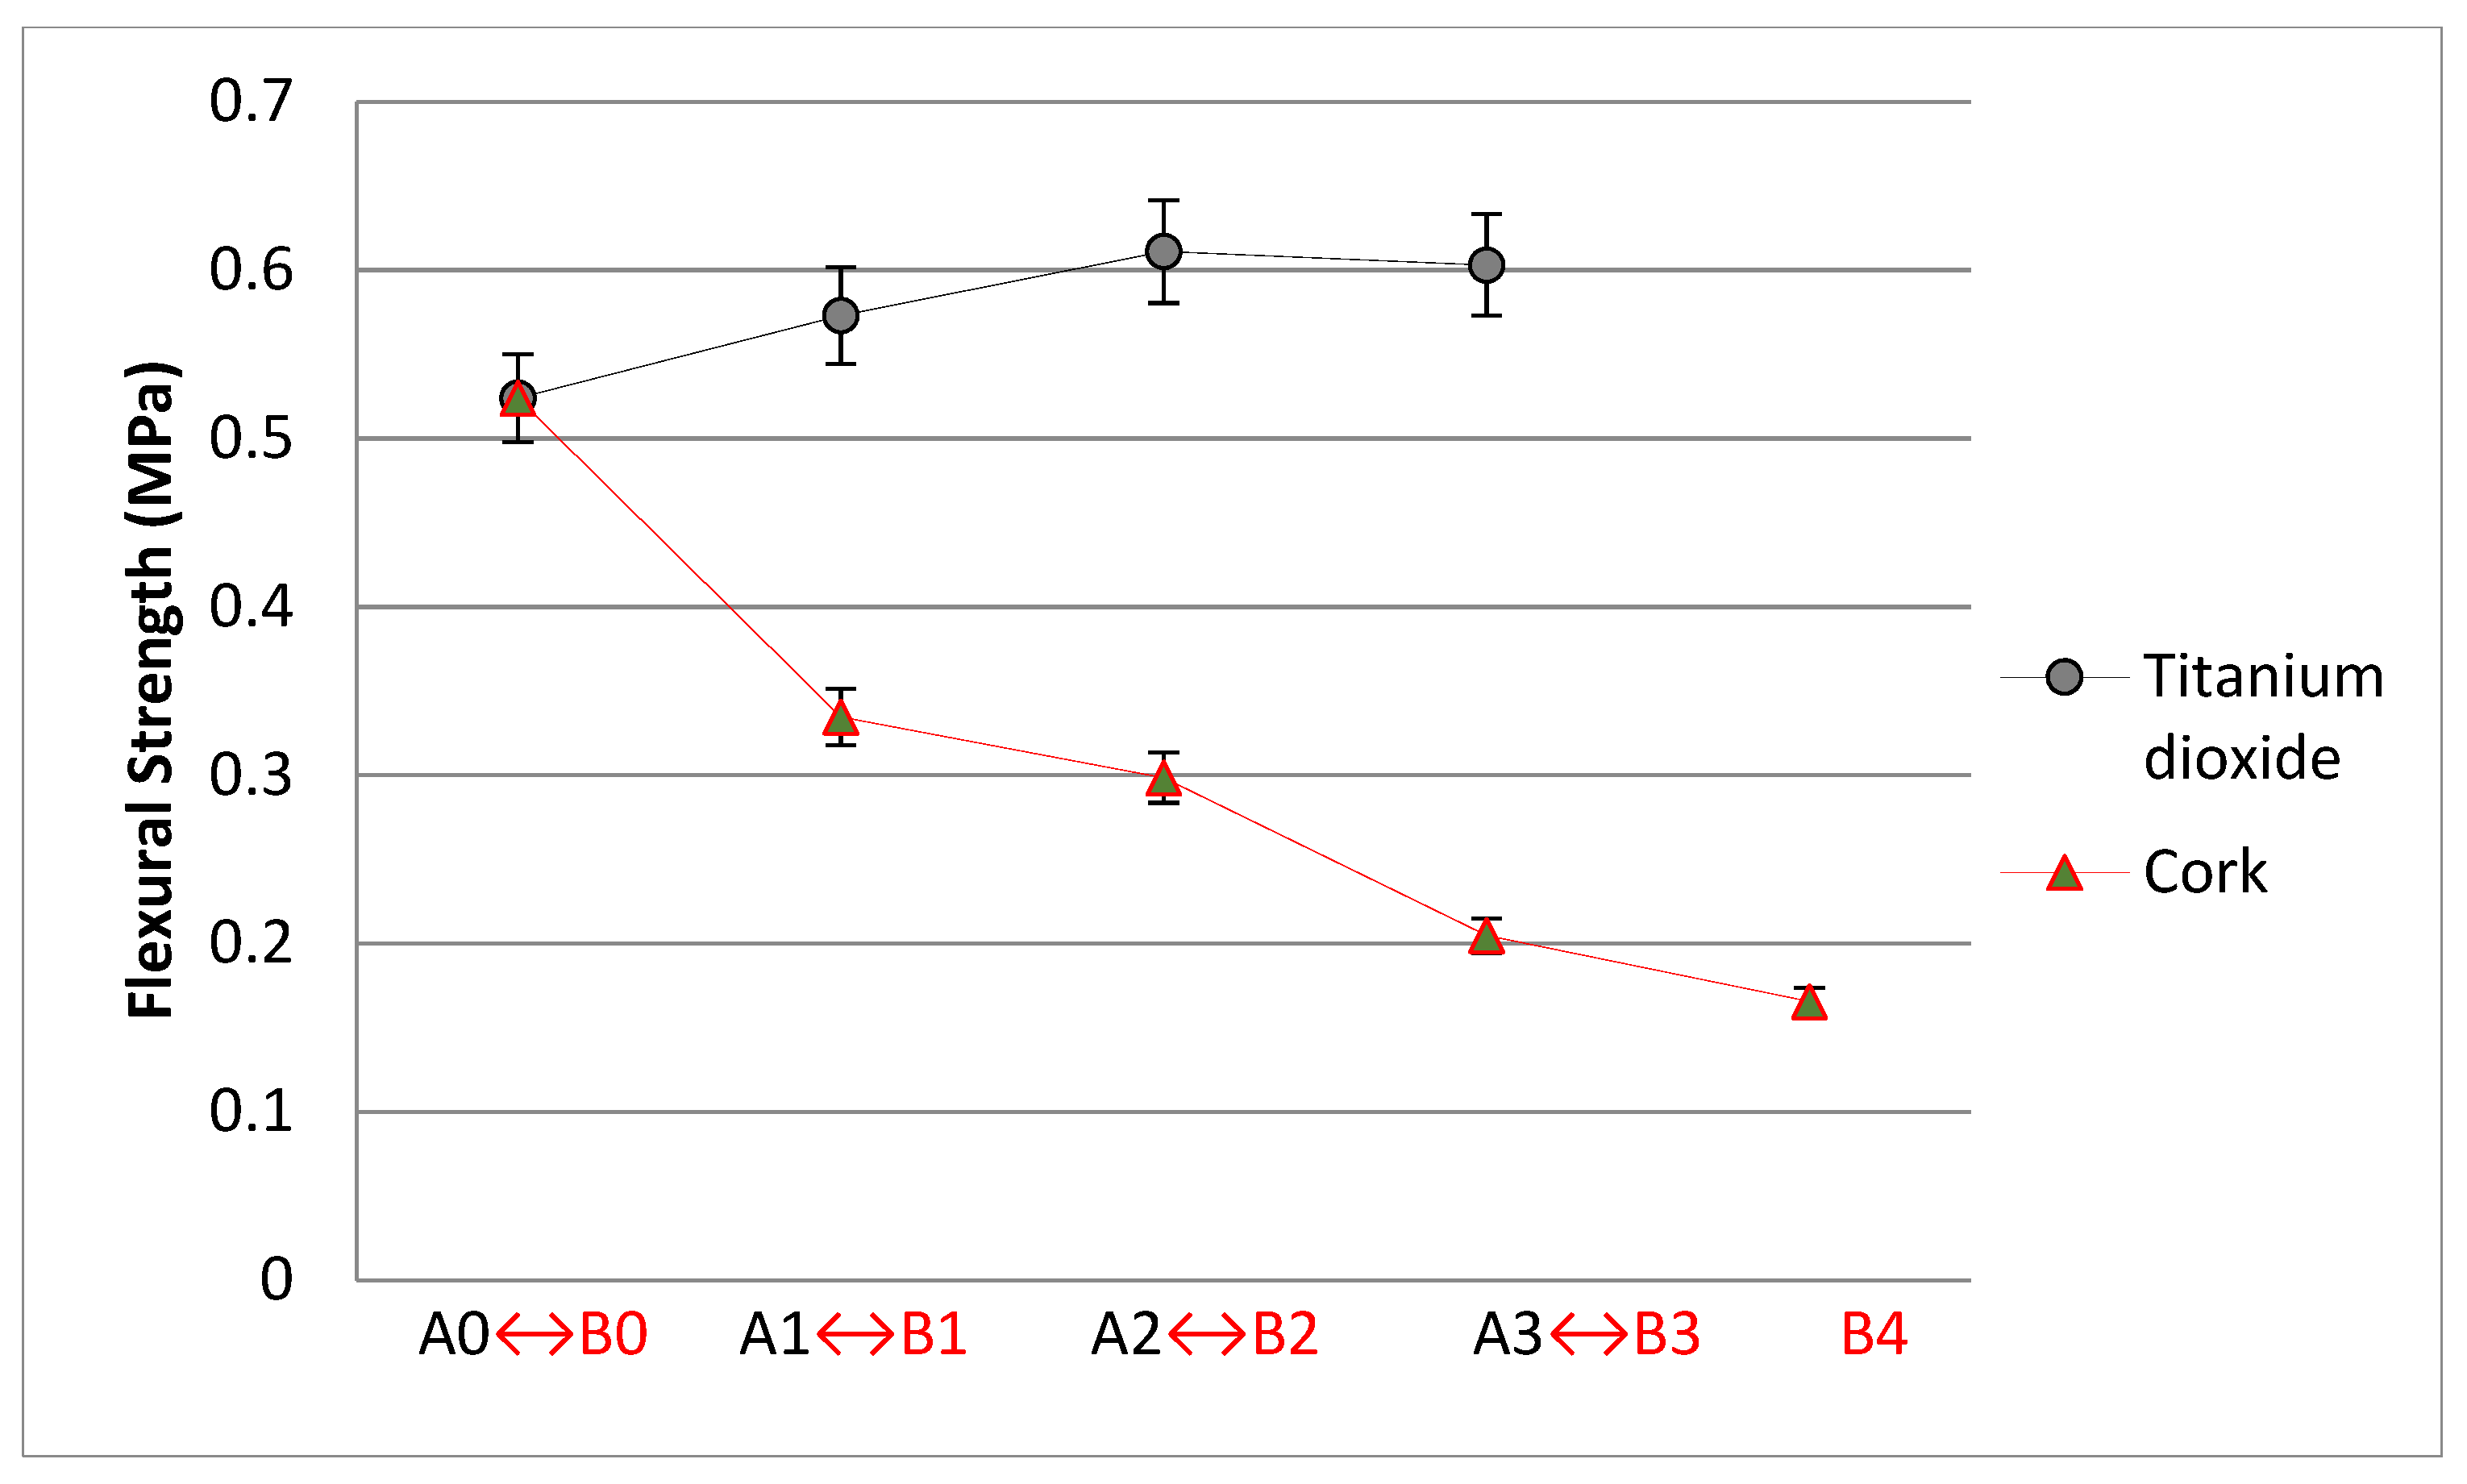
Flexural and compression strengths were determined according to the European standard EN 1015-11 [19]. Samples with dimensions of 40 × 40 × 160 mm3 were used, whose results are presented in Figure 1 and Figure 2.
According to the standard EN 998-1 [20], mortars A0, A1, A2, A3, B0, B1, and B2 can be classified as CSII, while mortars B3 and B4 can be classified as CSI.

3. Prevention of Fungi Development

3.1. Accelerated Fungal Growth

Brick samples (20 × 30 cm) were prepared, coated with the mortars described above. Curing was performed in the laboratory for 28 days.
This study adopted the accelerated growth testing conditions of fungi in mortars with nano-TiO2 and microgranulated cork used in [18], in which spores of the fungus C. halotolerans were sprayed. These tests were performed in climatic chambers at 25 °C and a constant relative humidity of 85%. It was found that it is possible to successfully incorporate nano- and micro-additives directly into lime-based mortars to improve their antifungal characteristics [18].

3.2. Scanning Electron Microscopy

The assay in the climate chamber (relative humidity, RH 85% at 25 °C) lasted 118 days, and the samples were then observed by scanning electronic microscopy (SEM -Phenom ProX, Netherlands and ProSuit software v.3.0., TermoFisher, Walteham, MA, USA).
A fragment of the surface was removed from each sample so that it could be visualised under an electron microscope. The fragments were fixed directly to aluminium pin stubs with electrically conductive carbon adhesive tape (PELCO Tabs™) on a Phenom Charge Reduction Holder (CRH; 5Kv; spot size of 3.3.). For each fragment, between 5 to 10 views were performed, and this record was noted on a scale of 0 to 10, where 0 means that the observed area does not contain traces of fungal development (0% of the contaminated area), and 10 means that the visualised area is all contaminated (100% contaminated area), that is, the fungus developed and occupied the observed surface in its entirety.
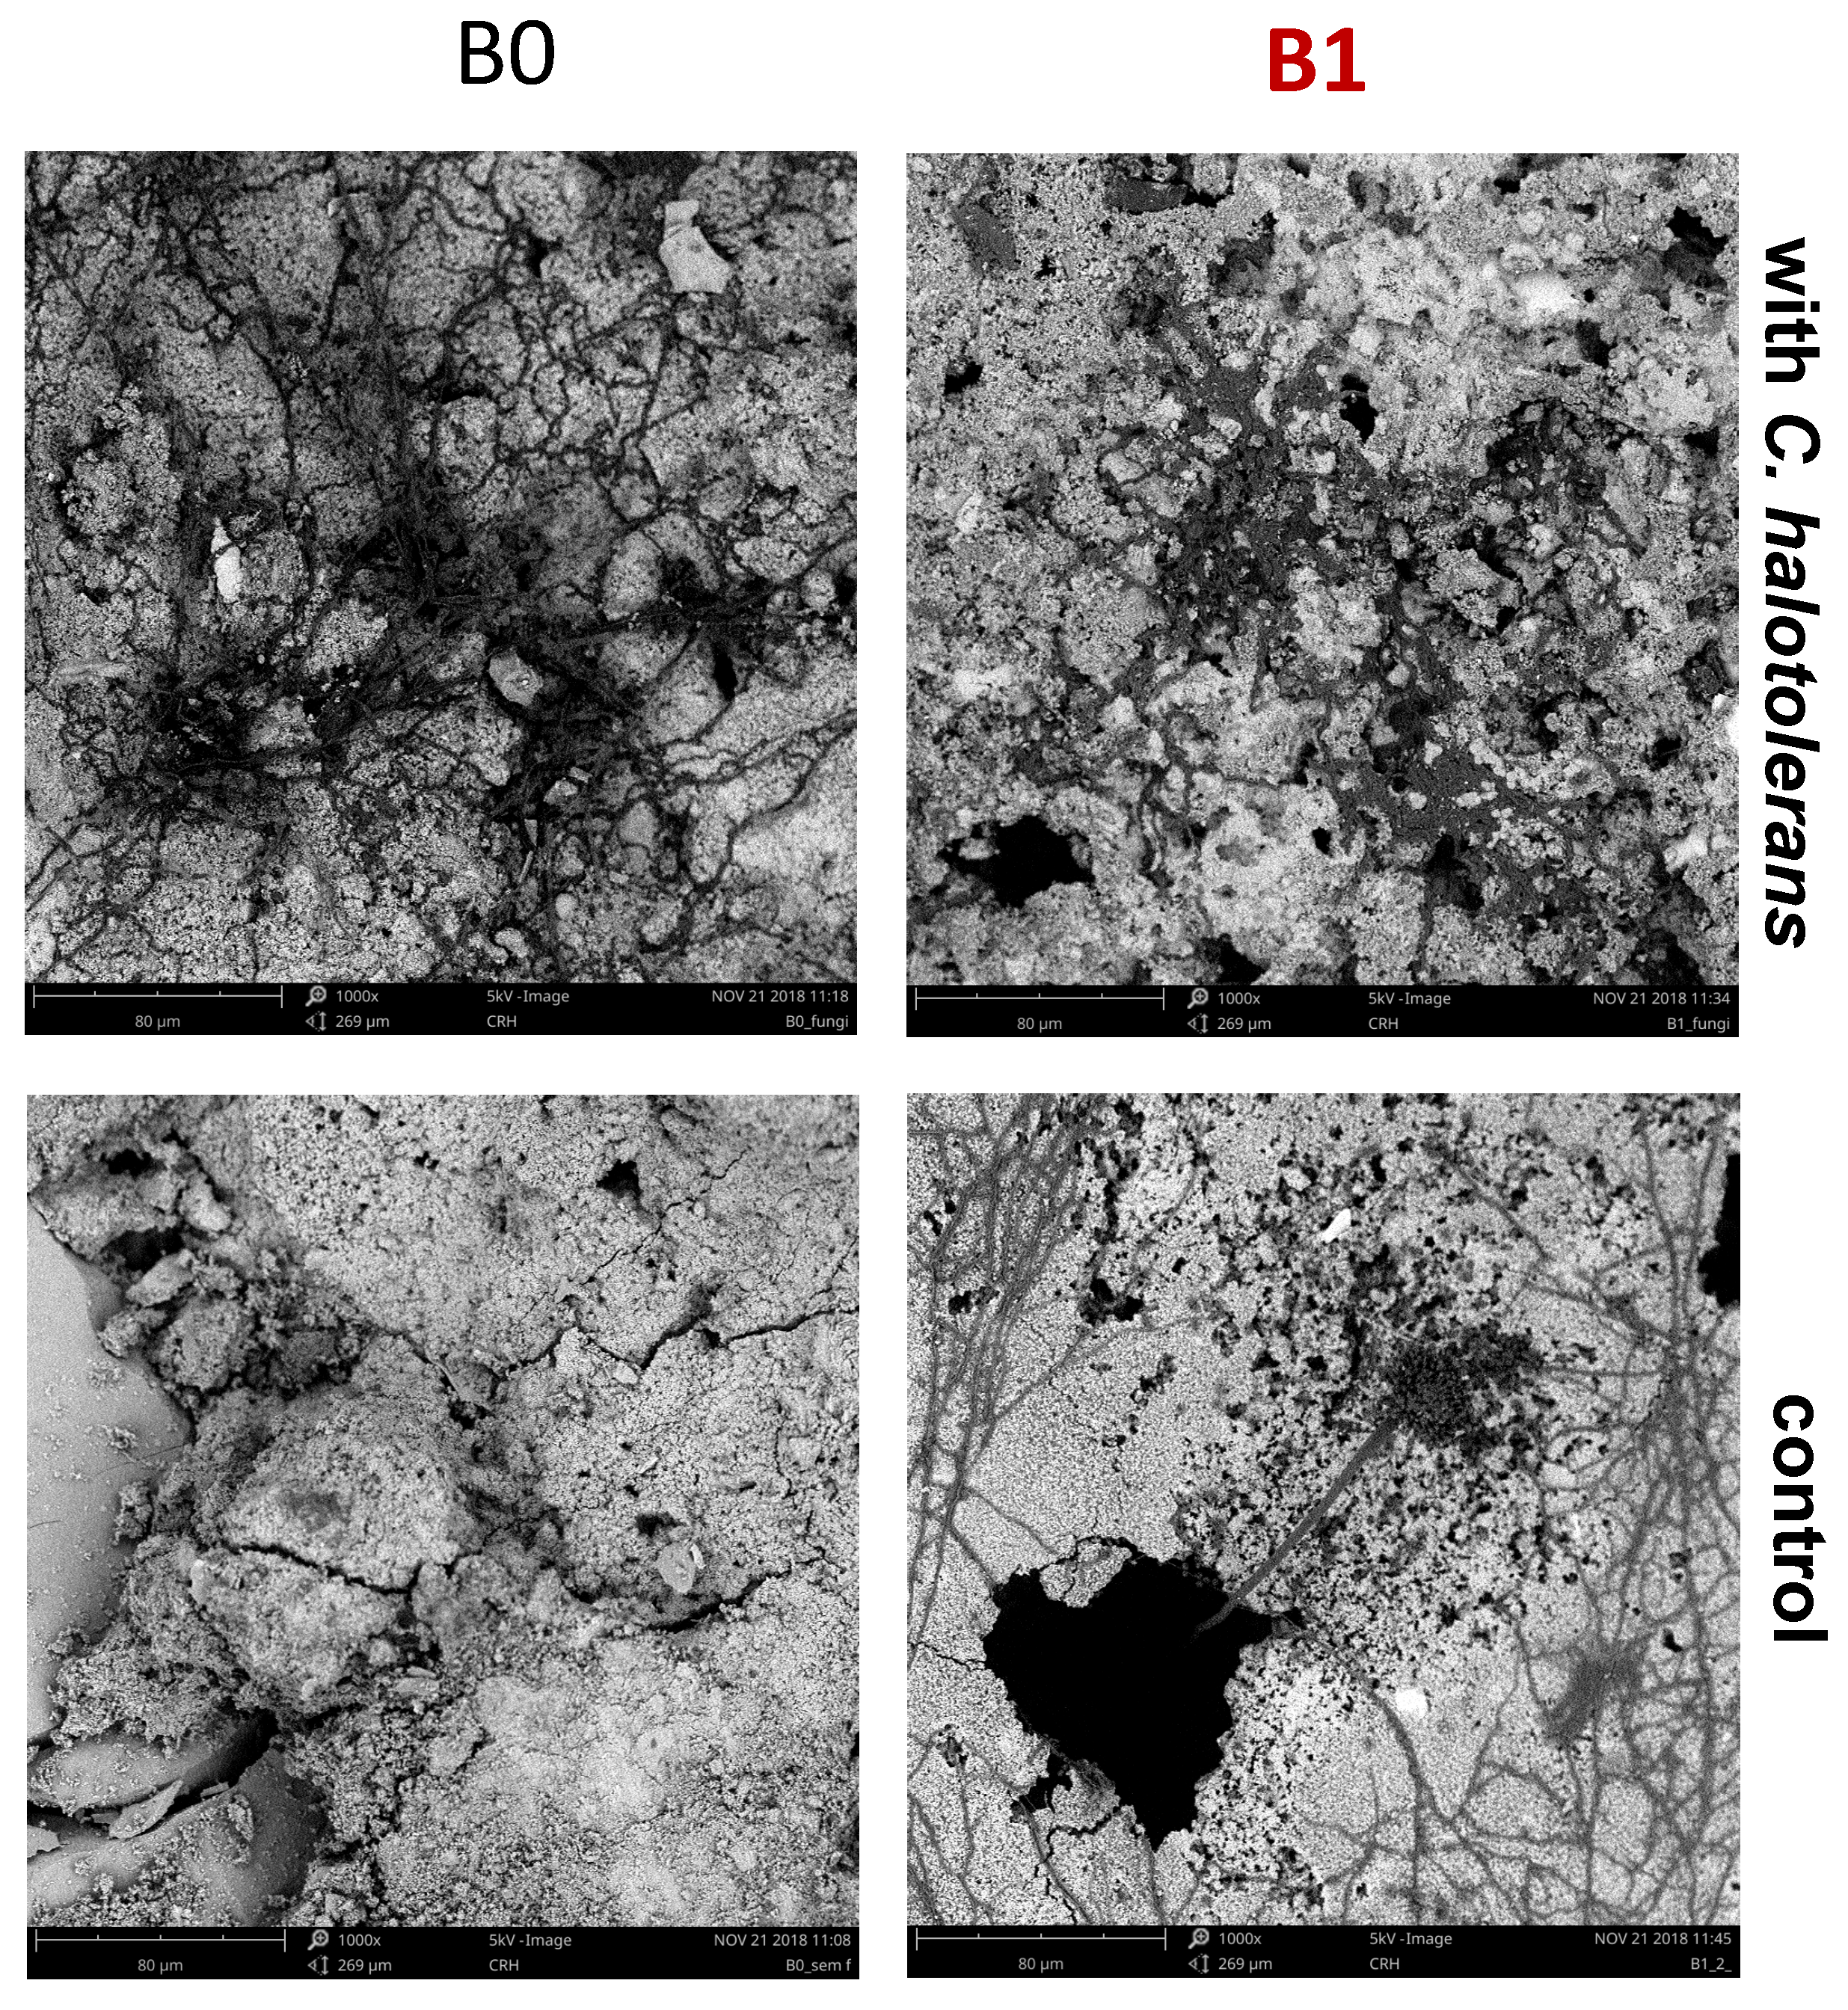
In the control mortar, the development of the fungus was about 70% higher than in the A2 TiO2 + C. halotolerans sample with nano-TiO2 additive (Figure 3). In sample B1 CORK + C. halotolerans, (Figure 4), the development of the fungus was about 50% lower than in the sample without microgranulated cork [18].
These results are outlined in Table 2, for which we compared the development of C. halotolerans on samples’ surfaces at 118 days when using mortars A2 and B1.
Based on Figure 5 and Table 2, we verified the development of the fungus C.halotolerans in samples A2 and B1. We compared this development in the two samples and found that the area of development of the fungus in sample A2 was about 60% smaller than the development in sample B1.

4. Methodology

The novelty of this study is investigating the life cycle analysis (LCA) of nano- and micro-additive mortars in which good antifungal properties have been verified [17,18], and to observe if these can help to reduce the ecological footprint in buildings.
To be able to use foreign methodologies for decision-making support and sustainability assessment, it is necessary to make prior adjustments to the parameters, weights, and references. These modifications are indispensable due to the difference that exists in the construction technology and quality standards of the interior environment between Portugal and most European countries.
The methodology for assessing the relative sustainability of construction technologies (MARS-SC) [22,23] was used in this study, as it adapts better to the construction method and Portuguese culture. The sustainability categories of environmental, functional, and economic features are the basis of this methodology [23]. It is a methodology that allows simplifying the analysis and verifying the sustainability of alternative solutions (in this study, mortars with additives) in relation to existing solutions (in this study, mortars without additives).

4.1. Functional Units and System Limits

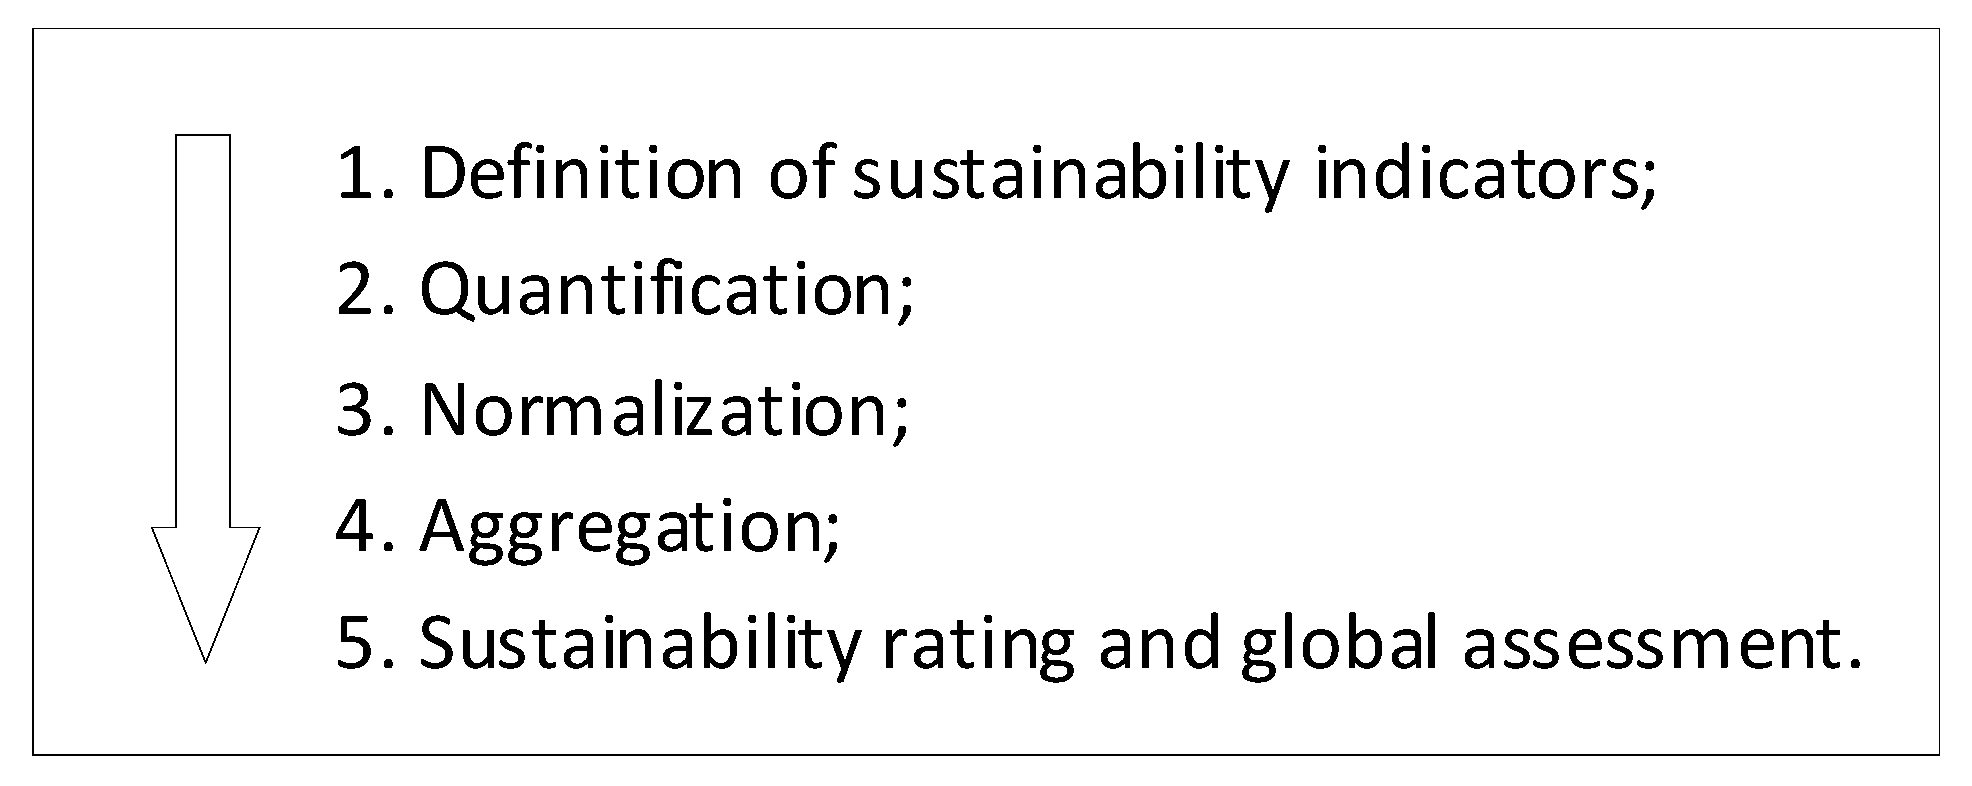
The object of analysis in this study was a hydraulic, lime-based mortar used as an internal coating material. The chosen methodology was MARS-SC because it permits the assessment of different phases of the mortar sample’s life cycle [22,23]. As a cradle-to-grave study of mortars has considerable limitations, since the use, recycling, and disposal of mortar result in identical environmental impacts, it was decided to limit this study to the incorporated environmental impacts (cradle to gate) and those arising from transport to the site and its mixture. We used 1 m3 of mortar as a functional unit. The MARS-SC methodology was processed in five steps (Figure 6). Figure 7 displays, in a simplified way, the processes that were included in the LCA analysis and the boundaries of the study. Additionally, we adapted the system to the investigated mortar compositions.

4.2. Inventory Analysis

In this phase, data collection and calculation procedures occurred to quantify system inputs and outputs, which is called the inventory phase. To complete an inventory, it is essential to quantify the emissions associated with the different stages of the life cycle, the raw materials, and energy consumption for the product.
To quantify the sustainability indicators, it is first necessary to develop an inventory analysis [23]. To quantify inputs (materials, energy, and chemicals) and outputs (e.g., waste) from the adopted product system, an inventory was used according to [25]. Table 3 shows the data obtained for the material inventory and transport phases considered for the formulation of each mortar.

4.3. Environmental Impact Assessment

With life cycle impact assessment (LCIA) methods, we converted inventory data into environmental impact data.
The MARS-SC method subdivides environmental performance into six categories: (i) global warming; (ii) destruction of the ozone layer; (iii) acidification; (iv) eutrophication; (v) tropospheric ozone; (vi) abiotic depletion of fossil resources (Table 4). The type of product or construction element and the objectives of the study affect the definition of sustainability indicators.
The lifecycle impact methods available in the bibliography and in the open LCA software were used in this study and are described as follows:
(a)
The method used in CML2 baseline 2000 V3.2 is problem oriented (midpoint in the environmental mechanism). For each problem, there are quantified characterisation factors. An emission identified in the life cycle impact is converted into a contribution to the effect of an environmental problem by multiplying it by an equivalent factor.
(b)
The cumulative energy demand V1.08 method is a widely used indicator with energy efficiency parameters and screening for the environmental impacts of processes and is used to compare the primary energy demand (energy that has not undergone a transformation process).

4.3.1. Normalisation

To avoid scaling effects in the junction of parameters within each indicator, and to solve the problem of some parameters becoming ‘bigger-is-better’ types, while others ‘smaller-is-better’ types, the parameters were normalised. Normalisation was carried out using [26] Equation (1).
P i ¯ = P i P * i P i * P * i   Δ i
where P i   is the ith parameter value. P i * and P * i are the best and worst value of the sustainability parameter i among the analysed products. Therefore, the normalisation transforms the values to a reduced scale between 0 (worst value) and 1 (best value), leaving dimensionless indicators [23].

4.3.2. Aggregation and Global Assessment

Equation (2) allows us to calculate the aggregation of each environmental variable of the indicator and transform it into a general indicator that describes the environmental performance (NDA).
N D A = i = 1 n w i . P i ¯
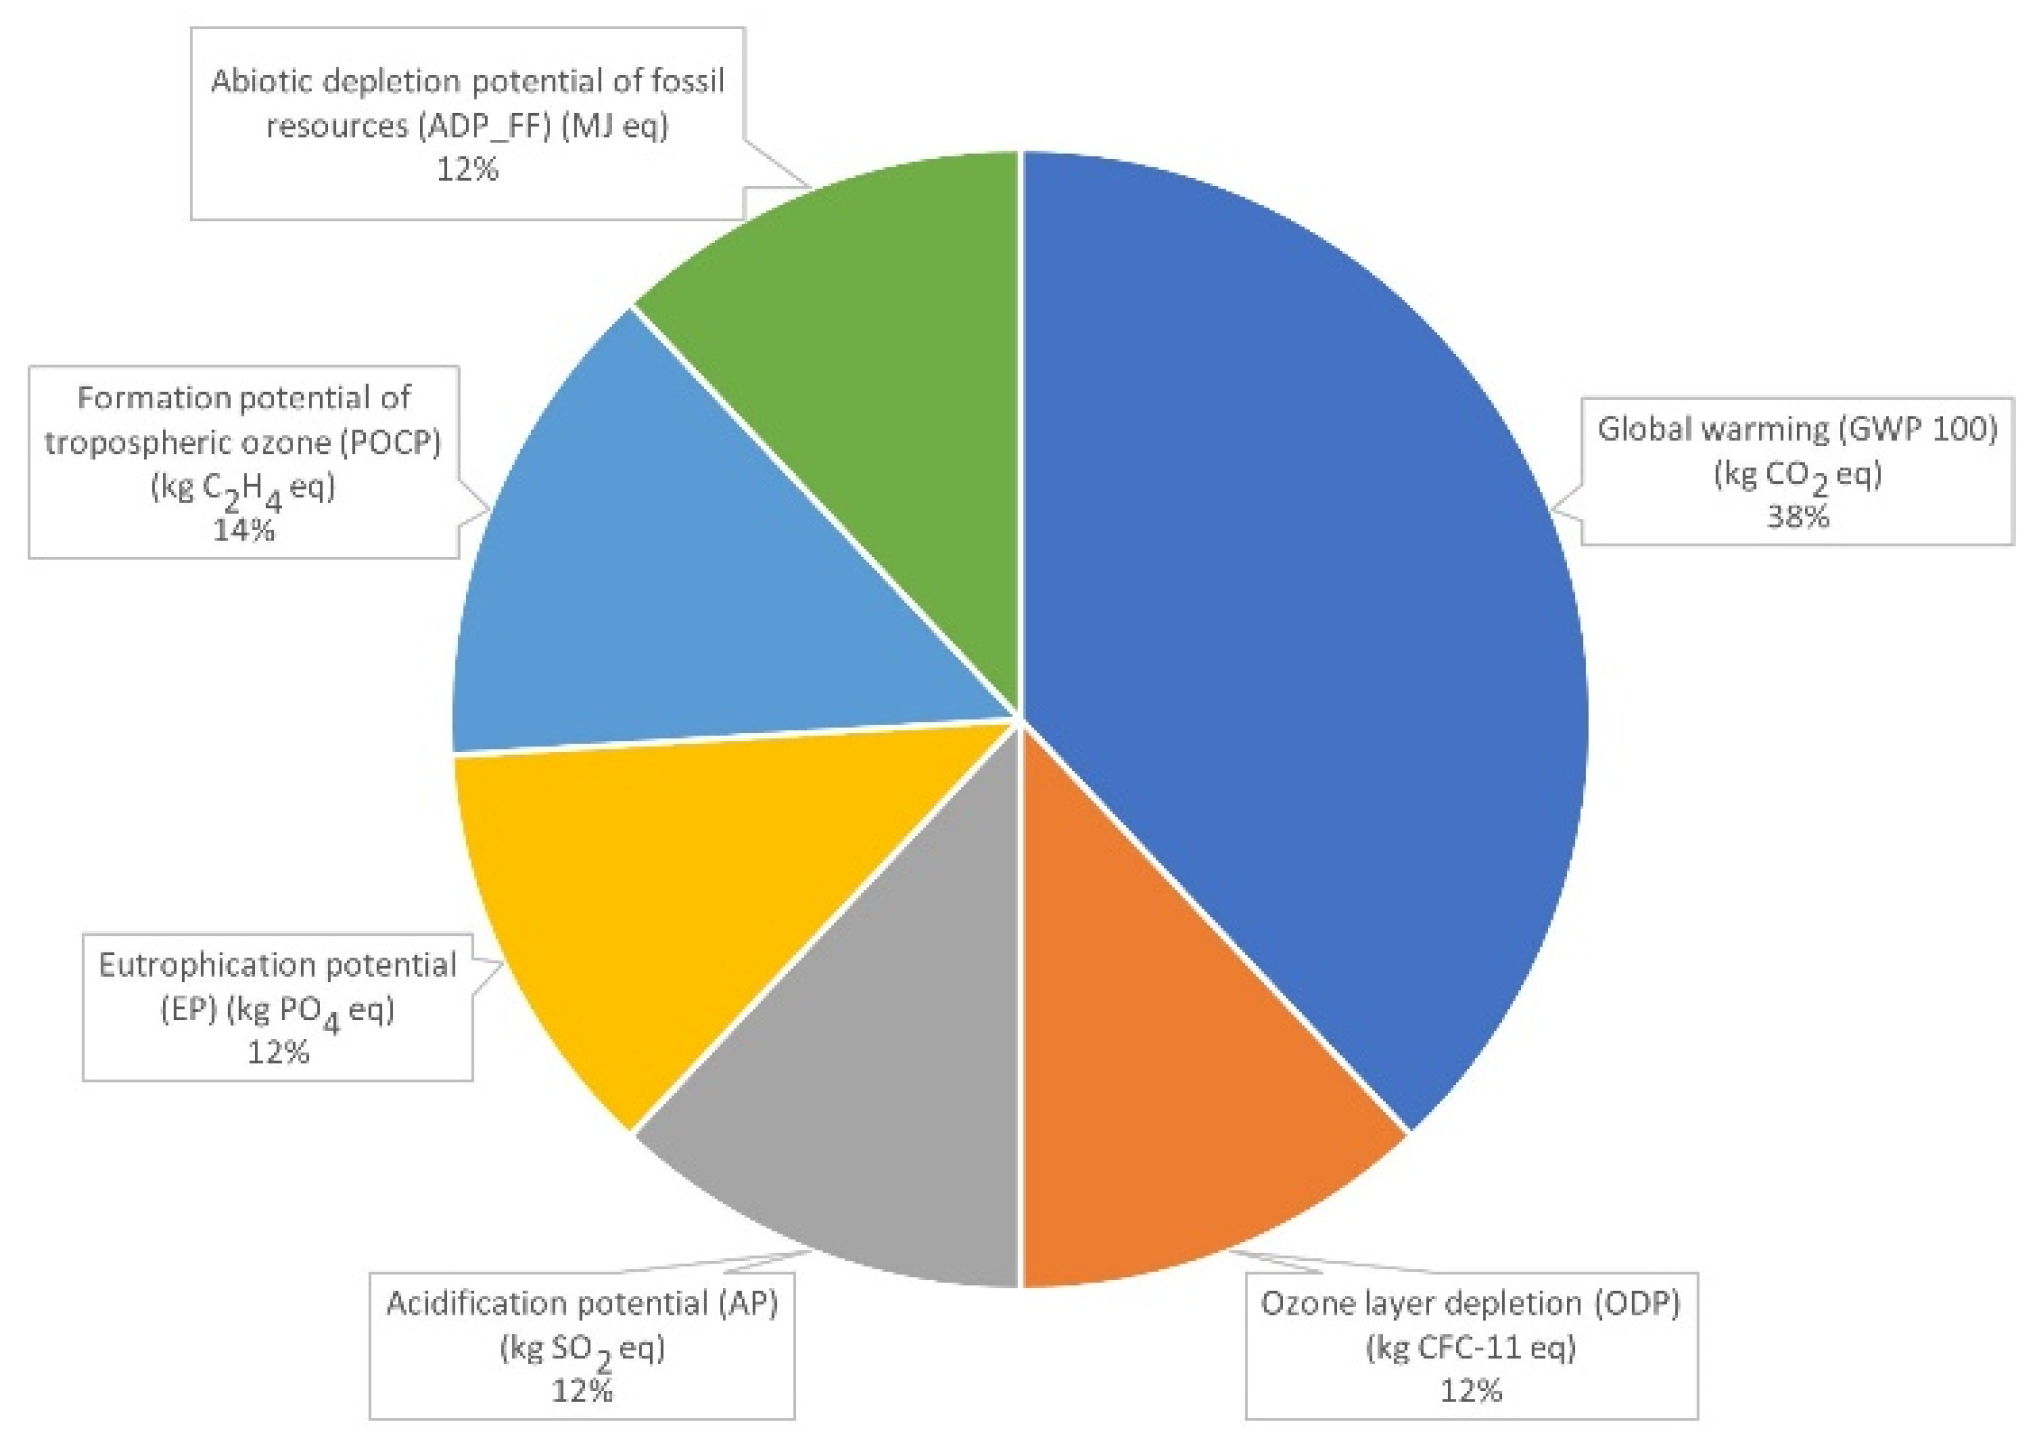
where P i ¯ is the normalised indicator within the sustainability for the environmental performance, wi the weight of the ith indicator, and NDA is the result of aggregation of the environmental performance. The sum of all weights must equal 1 [23]. For aggregation, this study considered the weights in Figure 8. The MARS-SC indicates this approach for the Portuguese context, which the large part of the international scientific community in the area follows [22]. As specific weights are used in the assessment of overall environmental performance, this methodology can be applied in other contexts.
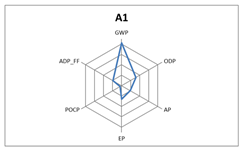
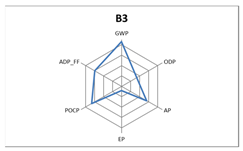
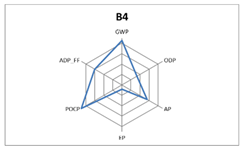
Additionally, known as a sustainable profile, the results are presented on a ‘radar’ diagram. In the ‘radar’ diagram, the number of rays is equal to the number of indicators analysed. The overall performance of each mortar, in each sustainable profile, was monitored and compared with that of the reference mortar.

5. Results and Discussion

5.1. Sensitivity Analysis

As the above-mentioned analysis contains several uncertain parameters, it is necessary to develop a sensitivity analysis, which allows the verification of the most significant variations of these parameters. As is clearly evident, mainly in Table 5 and Table 6, the production phase has a greater environmental impact, visible mainly in the categories of acidification potential (AP), and eutrophication potential (EP). Obtaining resources such as binders also have a significant environmental impact.
Here, the data that allowed us to perform the sensitivity analysis are listed in Table 5, Table 6, Table 7 and Table 8; the results discussed in the next section allowed us to maintain the sequence of the presented methodology.

5.2. Environmental Impact Assessment

Table 5 presents the results of quantification of the environmental impact categories related to the production of 1 kg of mortar in the Portuguese context.
Table 6 summarises the values obtained for the different environmental impacts, for the different categories, depending on the different mortars. Values were obtained using an open-access LCA software program. Analysing the results, we can observe that the mortars with added microgranulated cork have better environmental performance than those with nano-TiO2 additives, even though the effect is not significant. The results of the normalisation of values obtained for each environmental category are presented in Table 7, allowing a better perception of which mortar has a better environmental performance. It is observed that, among all the analysed mortar formulations, B1 mortar has the best environmental performance.

5.3. Sustainability Analysis

Table 8 presents the sustainability profiles, and the environmental performances are represented in the profiles. At the level of each impact category, the best mortar is the one that has a value closest to one. It is verified that B1 has the best environmental performance (NDA = 1.00), and the normal mortar A/B_0 has the worst performance (NDA = 0.00). Therefore, these results allow the conclusion that the use of nano-TiO2 or microgranulated cork additives slightly enhances the environmental performance of mortar production, since the overall environmental performance of mortar is improved. Furthermore, the use of these materials contributes to better compatibility between the construction sector and the goals of sustainable development.

6. Conclusions

In this study, seven mortars with different dosages of nano-TiO2 and microgranulated cork additives were studied and compared with a simple mortar.
The results displayed that the potential environmental impact of mortar, especially in terms of CO2 emissions, is due to its lime content. Although the results are limited, we can conclude that as these mortars have antifungal properties, their durability will be higher, and therefore, their environmental impact will be much lower than that of a simple mortar. Further, we found that the mortar with the best antifungal performance is A2, and this sample also obtained a good environmental performance.
The best environmental performance is obtained with B1 mortar.
By analysing the mechanical results, we verified that A2 and B1 mortars have good performances and have applicability in construction.
Through this study, we can conclude that nano- and micro-additive mortars with TiO2 and cork obtain better environmental performance than currently used mortars.
Author Contributions

Conceptualization, A.J. and L.B.; methodology, A.J.; software, A.J.; validation, L.B. and B.A.; formal analysis, B.A.; investigation, A.J.; resources, A.J.; data curation, A.J.; writing—original draft preparation, A.J.; writing—review and editing, A.J.; visualization, B.A.; supervision, B.A.; project administration, B.A.; funding acquisition, B.A. All authors have read and agreed to the published version of the manuscript.

Funding

This research received no external funding.

Data Availability Statement

The data presented in this study are available on request from the corresponding author. The data are not publicly available due to privacy.

Conflicts of Interest

The authors declare no conflict of interest.

References

  1. Alavarez, J.; Sequeira, C.; Costa, M. Ensinamentos a Retirar do Passado Histórico das Argamassas. In Proceedings of the Em 1º Congresso Nacional de Argamassas de Construção—APFAC, Lisboa, Portugal, 24–25 November 2005. (In Portuguese). [Google Scholar]
  2. Lanas, J.; Pérez Bernal, J.; Bello, M.A.; Alavarez Galindo, J.I. Mechanical properties of natural hydraulic lime-based mortars. Cem. Concr. Res. 2004, 34, 2191–2201. [Google Scholar] [CrossRef] [Green Version]
  3. Callebaut, K.; Elsen, J.; Van Balen, K.; Viaene, W. Nineteenth century hydraulic restoration mortars in the Saint Michael’s Church (Leuven, Belgium) Natural hydraulic lime or. Cem. Concr. Res. 2001, 31, 397–403. [Google Scholar] [CrossRef]
  4. Veiga, M.R.; Aguiar, J.; Silva, A.S.; Carvalho, F. Conservação e Renovação de Revestimentos de Paredes de Edifícios Antigos (In Portuguese); LNEC: Lisboa, Portugal, 2014. [Google Scholar]
  5. Conde, J.P. Nanomateriais. In Revista Sociedade Portuguesa de Quimica, Número 97 (In Portuguese), Lisboa; 2005; pp. 57–59. Available online: https://www.spq.pt/magazines/BSPQuimica/622/article/30001252/pdf (accessed on 21 January 2022).
  6. Broeckhuizen, F.v.; Broeckhuizen, P.v. Nanotechnology in the European Construction Industry; European Federation of Building and Woodworkers: Amesterdam, The Netherlands, 2009. [Google Scholar]
  7. Mathiazhagan, A.; Rani, J. Nanotechnology-A New Prospective in Organic Coating—Review. Int. J. Chem. Eng. Appl. 2011, 2, 225–237. [Google Scholar] [CrossRef]
  8. Rácová, Z.; Wasserbauer, R.; Ryparová, P. Microscopic filamentous fungi in buildings, preventing their occurrence and their remediation using nanofibers. Adv. Mater. Res. 2013, 649, 89–92. [Google Scholar] [CrossRef]
  9. Gaylarde, C.C.; Morton, L.H.; Loh, K.; Shirakawa, M.A.; Gaylarde, C.C.; Morton, L.H.G.; Loh, K.; Shirakawa, M.A. Biodeterioration of external architectural paint films—A review. Int. Biodeterior. Biodegrad. 2011, 65, 1189–1198. [Google Scholar] [CrossRef]
  10. Sterflinger, K. Fungi: Their role in deterioration of cultural heritage. Fungal Biol. Rev. 2010, 24, 47–55. [Google Scholar] [CrossRef]
  11. Hallmann, C.; Rüdrich, J.; Enseleit, M.; Friedl, T.; Hoppert, M. Microbial diversity on a marble monument: A case study. Environ. Earth Sci. 2010, 63, 1701–1711. [Google Scholar] [CrossRef] [Green Version]
  12. Arthur, R.A.; Gregory, C.J.; Matthews, I.P. The Amount of Surface Mould Contamination in Homes in South Wales and the Prevalence and Relative Abundance of Differing Mould Genera. In Proceedings of the 8th International Conference and Exhibition on Healthy Buildings, Lisbon, Portugal, 4–8 June 2006; International Society of Indoor Air Quality and Climate (ISIAQ): Santa Cruz, CA, USA. [Google Scholar]
  13. Shirakawa, M.A. Biodeterioração de Argamassas por Fungos: Desenvolvimento de Teste Acelerado Para Avaliação da Bio-Receptividade (In Portuguese); Instituto de Ciências Biomédicas da Universidade de São Paulo: São Paulo, Brazil, 1999. [Google Scholar]
  14. Machado, B.C.C.A. Caracterização das Litogias e Patologias da Sé de Lamego (In Portuguese). Ph.D. Thesis, University of Trás-os-Montes e Alto Douro, Vila Real, Portugal, 2012. [Google Scholar]
  15. Jerónimo, A.; Barroso, A.; Lima, N.; Eires, R. Prevenção de Fungos em Paredes e Tetos. In Proceedings of the 3º Congresso Luso-Brasileiro de Materiais de Construção Sustentáveis, Coimbra, Portugal, 14–16 February 2018. (In Portuguese). [Google Scholar]
  16. Kibert, C.J. Deconstruction: The start of a sustainable materials strategy for the built environment. Ind. Environ. 2003, 26, 84–88. [Google Scholar]
  17. Jerónimo, A.; Camões, A.; Aguiar, B.; Lima, N. Hydraulic lime mortars with antifungal properties. Appl. Surf. Sci. 2019, 483, 1192–1198. [Google Scholar] [CrossRef] [Green Version]
  18. Jerónimo, A. Uso de Nanomateriais na Prevenção de Fungos em Paredes e Tetos (In Portuguese); Universidade do Minho—Tese de Doutoramento: Guimarães, Portugal, 2020. [Google Scholar]
  19. CEN. EN 1015-11; Methods of Test for Masonry—Part 11: Determination of flexural and compressive strength of hardened mortar. European Committee for Standardization: Brussels, Belgium, 1999.
  20. CEN. EN 998-1; Specification for Mortar for Masonry Part 1: Rendering and Plastering Mortar. European Committee for Standardization: Brussels, Belgium, 2016.
  21. Jerónimo, A.; Soares, C.; Aguiar, B.; Lima, N. Hydraulic lime mortars incorporating micro cork granules with. Constr. Build. Mater. 2020, 255, 119368. [Google Scholar] [CrossRef]
  22. Mateus, R.; Bragança, L. Tecnologias Construtivas Para a Sustentabilidade da Construção; (In Portuguese). Edições Ecopy: Ermesinde, Portugal, 2006. [Google Scholar]
  23. Mateus, R.; Neiva, S.; Bragança, L.; Mendonça, P.; Macieira, M. Sustainability assessment of an innovative lightweigtht building technology for partition walls—Comparison with conventional technologies. Build. Environ. 2013, 67, 147–159. [Google Scholar] [CrossRef]
  24. Teixeira, E.; Mateus, R.; Camões, A.; Bragança, L. Comparative environmental life-cycle analysis of concretes using biomass and coal fly ashes as partial cement replacement material. J. Clean. Prod. 2016, 112, 2221–2230. [Google Scholar] [CrossRef] [Green Version]
  25. Li, X.; Zhang, Z. An LCA-based environmental impact assessment model for construction processes. Build. Environ. 2010, 45, 766–775. [Google Scholar] [CrossRef]
  26. Díaz-Balteiro, L.; Romero, C. In search of a natural systems sustainability index. Ecol. Econ. 2004, 49, 401–405. [Google Scholar] [CrossRef]
Figure 1. Compressive behaviour of mortars at 28 days.
Constrmater 02 00003 g001
Figure 2. Flexural behaviour of mortars at 28 days.
Constrmater 02 00003 g002
Figure 3. Sample A contamination images viewed under the electron microscope at 118 days (1000×).
Constrmater 02 00003 g003
Figure 4. Sample B contamination images viewed under the electron microscope at 118 days (1000×).
Constrmater 02 00003 g004
Figure 5. Samples A and B contaminations viewed under the electron microscope at 118 days (1000×).
Constrmater 02 00003 g005
Figure 6. Structure of the MARS-SC methodology for environmental sustainability indicators, adapted from [22].
Constrmater 02 00003 g006
Figure 7. Processes considered in the environmental analysis for the different mortars, adapted from [24].
Constrmater 02 00003 g007
Figure 8. Weights for each environmental indicator [22].
Constrmater 02 00003 g008
Table 1. Mortars formulations.
SampleCompositionBinder (kg)Sand (kg)Super Plasticiser (kg)TiO2/Cork (kg)Water (kg)
A0/B00% TiO2500.002197.431.000.00292.56
A12% TiO2500.002189.041.5010.00292.56
A24% TiO2500.002180.652.0020.00292.56
A36% TiO2500.002172.262.5030.00292.56
B12% cork500.001316.241.5010.00292.56
B24% cork500.001224.952.0020.00292.56
B36% cork500.001133.672.5030.00292.56
B48% cork500.001042.383.0040.00292.56
Table 2. Area where the fungus developed (%), adapted from [21].
SamplesArea Where the Fungus Developed (%)
A080%
A2 TiO2 + C.halotolerans30%
A2 contol15%
B080%
B1 cork + C.halotolerans50%
B1 contol25%
Table 3. Inventory of materials and transport for each mortar (per m3 of mortar produced).
Impact CategoryUnitA/B_0A1A2A3B1B2B3B4
Material input
Limekg500500500500500500500500
Sandkg14071399139013821316122511341042
Waterkg293293293293293293293293
Superplasticiserkg11.522.51.522.53
TiO2kg-102030----
Corkkg----10203040
Transportation
Limetkm245245245245245245245245
Sandtkm5049.649.449.146.843.540.337
Superplasticisertkm5582.5110137.582.5110137.5165
TiO2tkm-111022203330----
Corktkm- -- - 85170255340
Table 4. Indicators, units, and evaluation methods.
Environmental IndicatorsUnits LCIA Methods
Global warming (GWP 100)[kg CO2 eq]CML2 baseline 2000 V3.2
Ozone layer depletion (ODP)[kg CFC-11 eq]CML2 baseline 2000 V3.2
Acidification potential (AP)[kg SO2 eq]CML2 baseline 2000 V3.2
Eutrophication potential (EP)[kg PO4 eq]CML2 baseline 2000 V3.2
Formation potential of tropospheric ozone (POCP)[kg C2H4 eq]CML2 baseline 2000 V3.2
Abiotic depletion potential of fossil resources (ADP_FF)[MJ eq]Cumulative energy demand V1.08
Table 5. Quantification of the environmental impact categories related to the production of 1 kg of mortar (specific values for Portugal).
Impact CategoryUnitLimeNano TiO2Micro-Cork
Global warming (GWP 100) (kg CO2 eq)kg CO2 eq7.40 × 10−19.00 × 10−38.00 × 10−3
Ozone layer depletion (ODP) (kg CFC-11 eq)kg CFC-11 eq1.90 × 10−87.40 × 10−115.10 × 10⁻¹²
Acidification potential (AP) (kg SO2 eq)kg SO2 eq8.90 × 10−032.55 × 10−54.50 × 10−4
Eutrophication potential (EP) (kg PO4 eq)kg PO4 eq2.00 × 10−32.98 × 10−54.50 × 10−5
Formation potential of tropospheric ozone (POCP) (kg C2H4 eq)kg C2H4 eq1.87 × 10−49.90 × 10−76.40 × 10−8
Abiotic depletion potential of fossil resources (ADP_FF) (MJ eq)MJ eq4.97 × 10+02.30 × 10−23.70 × 10−2
Table 6. Values obtained for the different environmental impacts of each mortar.
Impact CategoryUnitAB_0A1A2A3B1B2B3B4
Global warming (GWP 100) (kg CO2 eq)kg7.63 × 10+39.78 × 10+29.58 × 10+28.45 × 10+24.15 × 10+25.03 × 10+27.00 × 10+27.39 × 10+2
Ozone layer depletion (ODP) (kg CFC-11 eq)kg3.23 × 10−53.01 × 10−53.00 × 10−53.00 × 10−52.70 × 10−53.00 × 10−53.00 × 10−53.00 × 10⁻⁵
Acidification potential (AP) (kg SO2 eq)kg3.99 × 10+03.46 × 10+02.80 × 10+02.80 × 10+02.18 × 10+02.80 × 10+02.80 × 10+02.80 × 10+0
Eutrophication potential (EP) (kg PO4 eq)kg9.09 × 10−17.80 × 10−17.50 × 10−15.50 × 10−18.60 × 10−18.80 × 10−17.80 × 10−19.00 × 10⁻¹
Formation potential of tropospheric ozone (POCP) (kg C2H4 eq)kg9.08 × 10−28.63 × 10−26.50 × 10−28.60 × 10−25.69 × 10−26.50 × 10−26.50 × 10−25.70 × 10⁻²
Abiotic depletion potential of fossil resources (ADP_FF) (MJ eq)MJ5.01 × 10+34.58 × 10+33.87 × 10+34.02 × 10+33.53 × 10+34.00 × 10+33.98 × 10+33.97 × 10+3
Table 7. Normalised values of the study environmental impact of each mortar.
Impact CategoryA/B_0A1A2A3B1B2B3B4
Global warming (GWP 100) (kg CO2 eq)0.000.920.920.941.000.990.960.96
Ozone layer depletion (ODP) (kg CFC-11 eq)0.000.420.430.431.000.430.430.43
Acidification potential (AP) (kg SO2 eq)0.000.290.660.661.000.660.660.66
Eutrophication potential (EP) (kg PO4 eq)0.000.360.441.001.000.590.180.18
Formation potential of tropospheric ozone (POCP) (kg C2H4 eq)0.000.130.760.141.000.760.761.00
Abiotic depletion potential of fossil resources (ADP_FF) (MJ eq)0.000.290.770.671.000.680.700.70
Table 8. Environmental performance (NDA) of each mortar.
NDAAB_0A1A2A3B1B2B3B4
0.000.530.730.711.000.770.710.74
Constrmater 02 00003 i001 Constrmater 02 00003 i002 Constrmater 02 00003 i003
Constrmater 02 00003 i004 Constrmater 02 00003 i005 Constrmater 02 00003 i006
Publisher’s Note: MDPI stays neutral with regard to jurisdictional claims in published maps and institutional affiliations.