Comparative Analysis of Recycled Plaster Composition Determined by X-ray Powder Diffraction and Thermogravimetric Analyses


Abstract
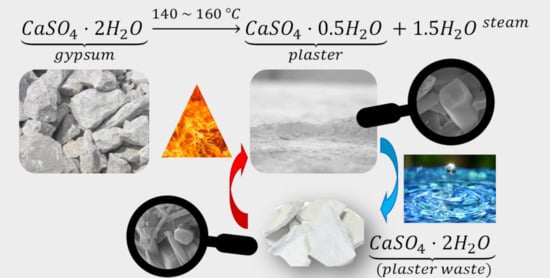
1. Introduction
2. Material and Methods
3. Results and Discussion
3.1. Bulk Density, Density, and Compactness
3.2. Particle Size Distribution
3.3. Specific Surface Area (BET)
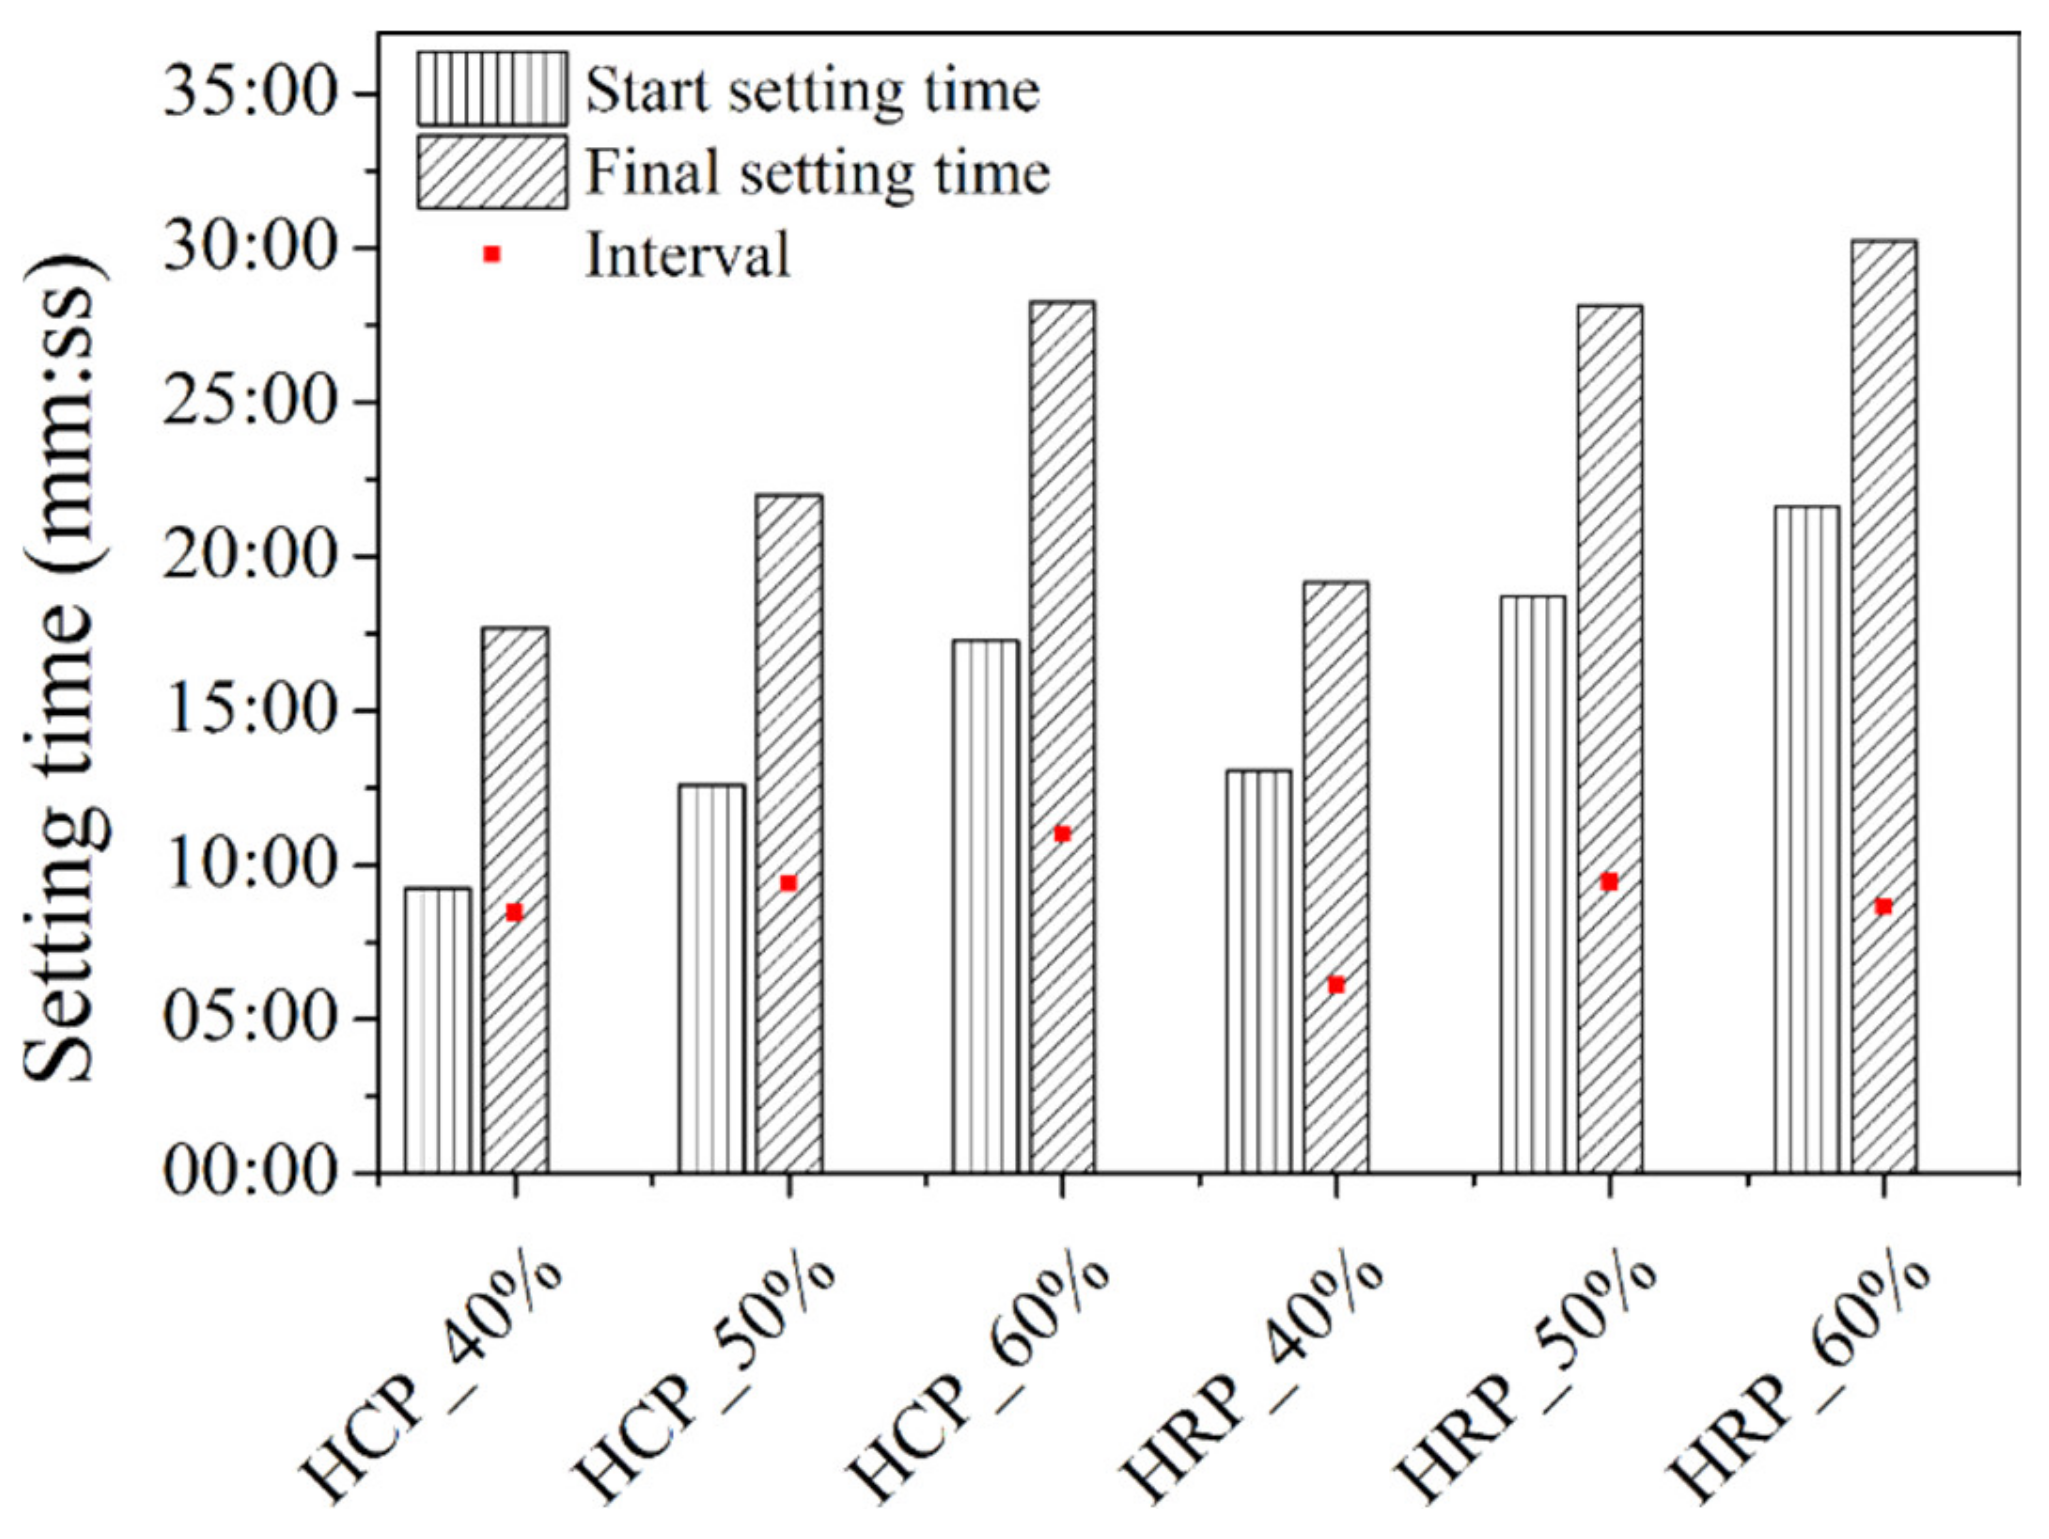
3.4. Setting Time
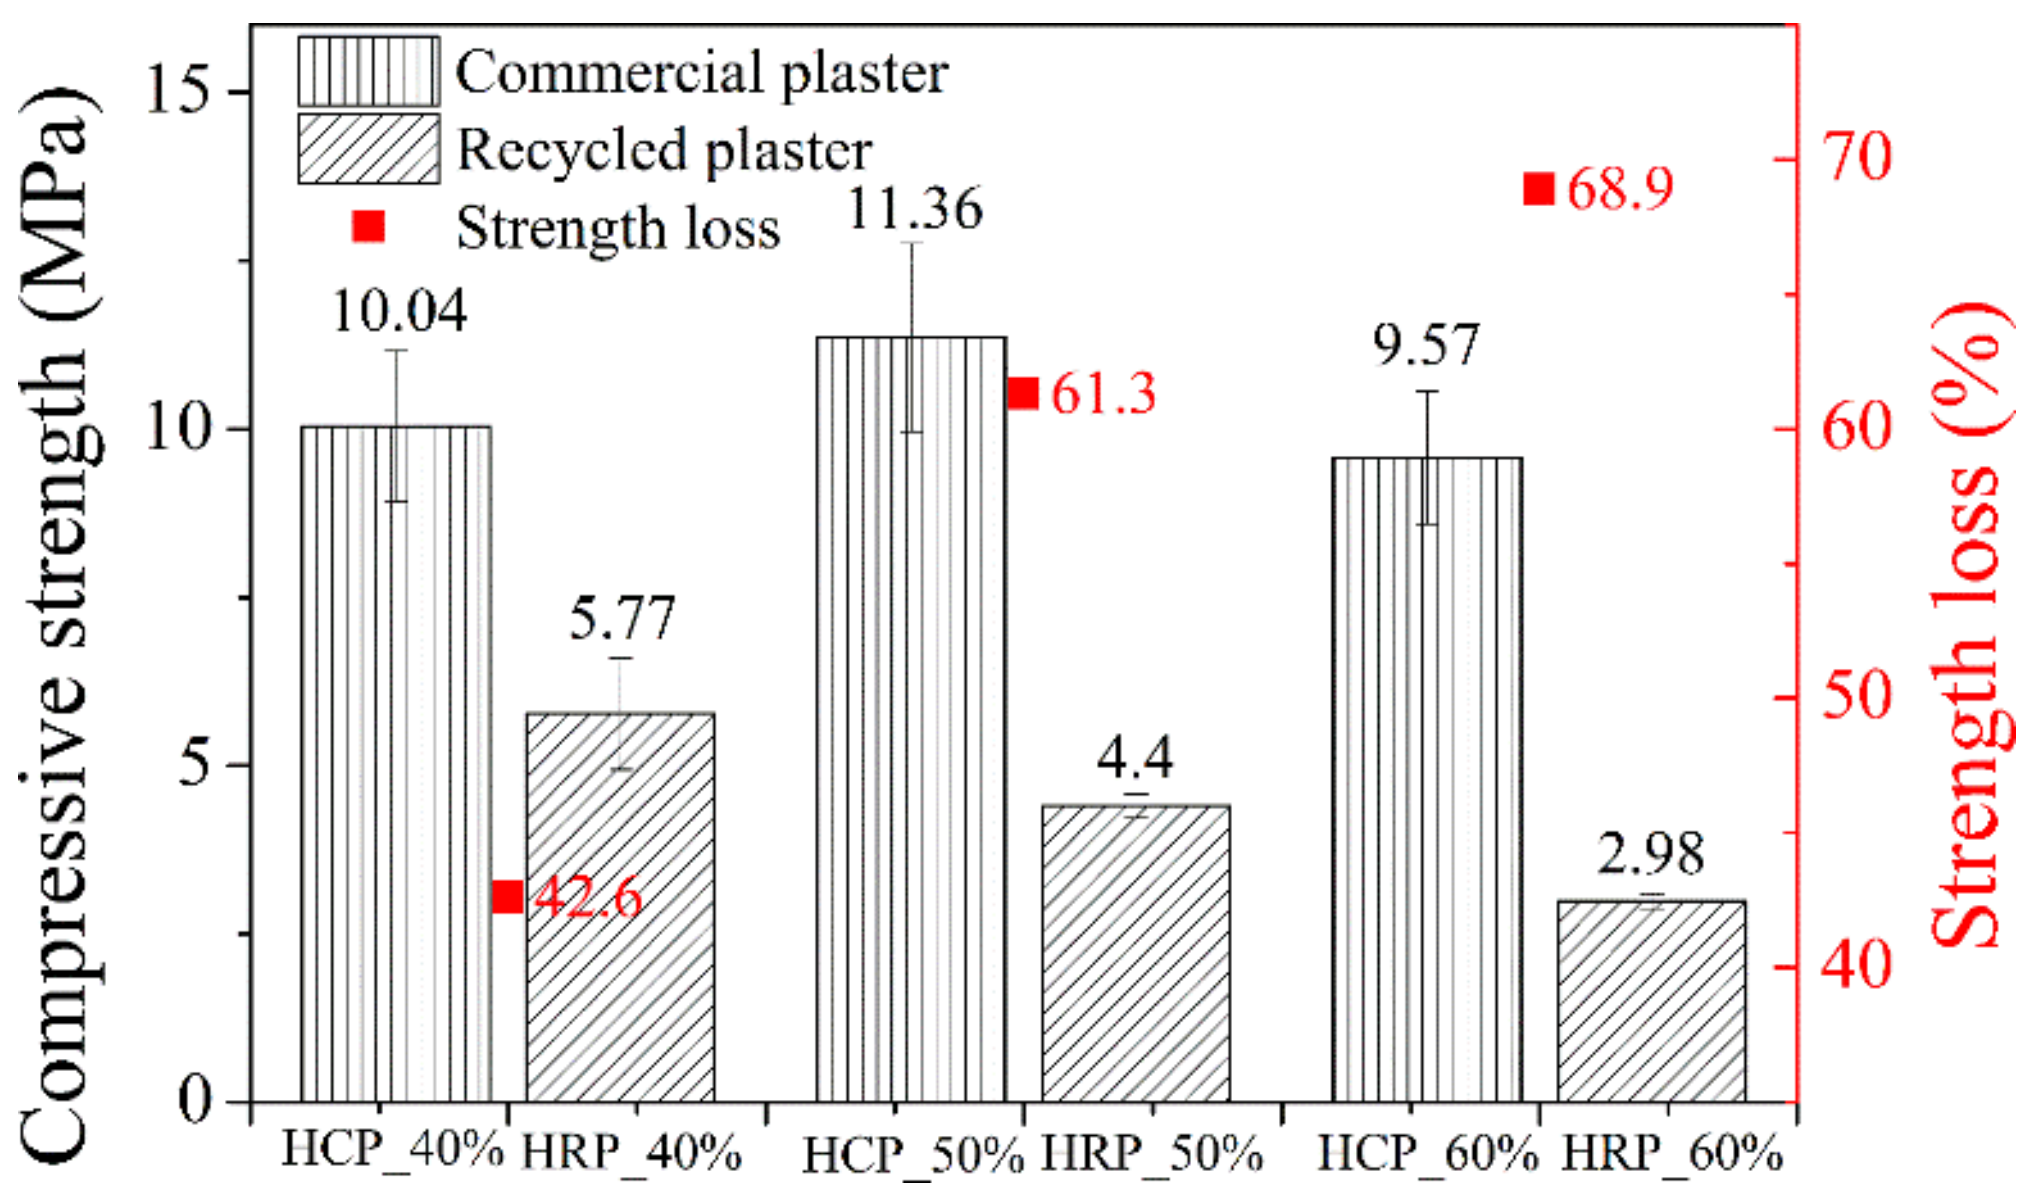
3.5. Compressive Strength
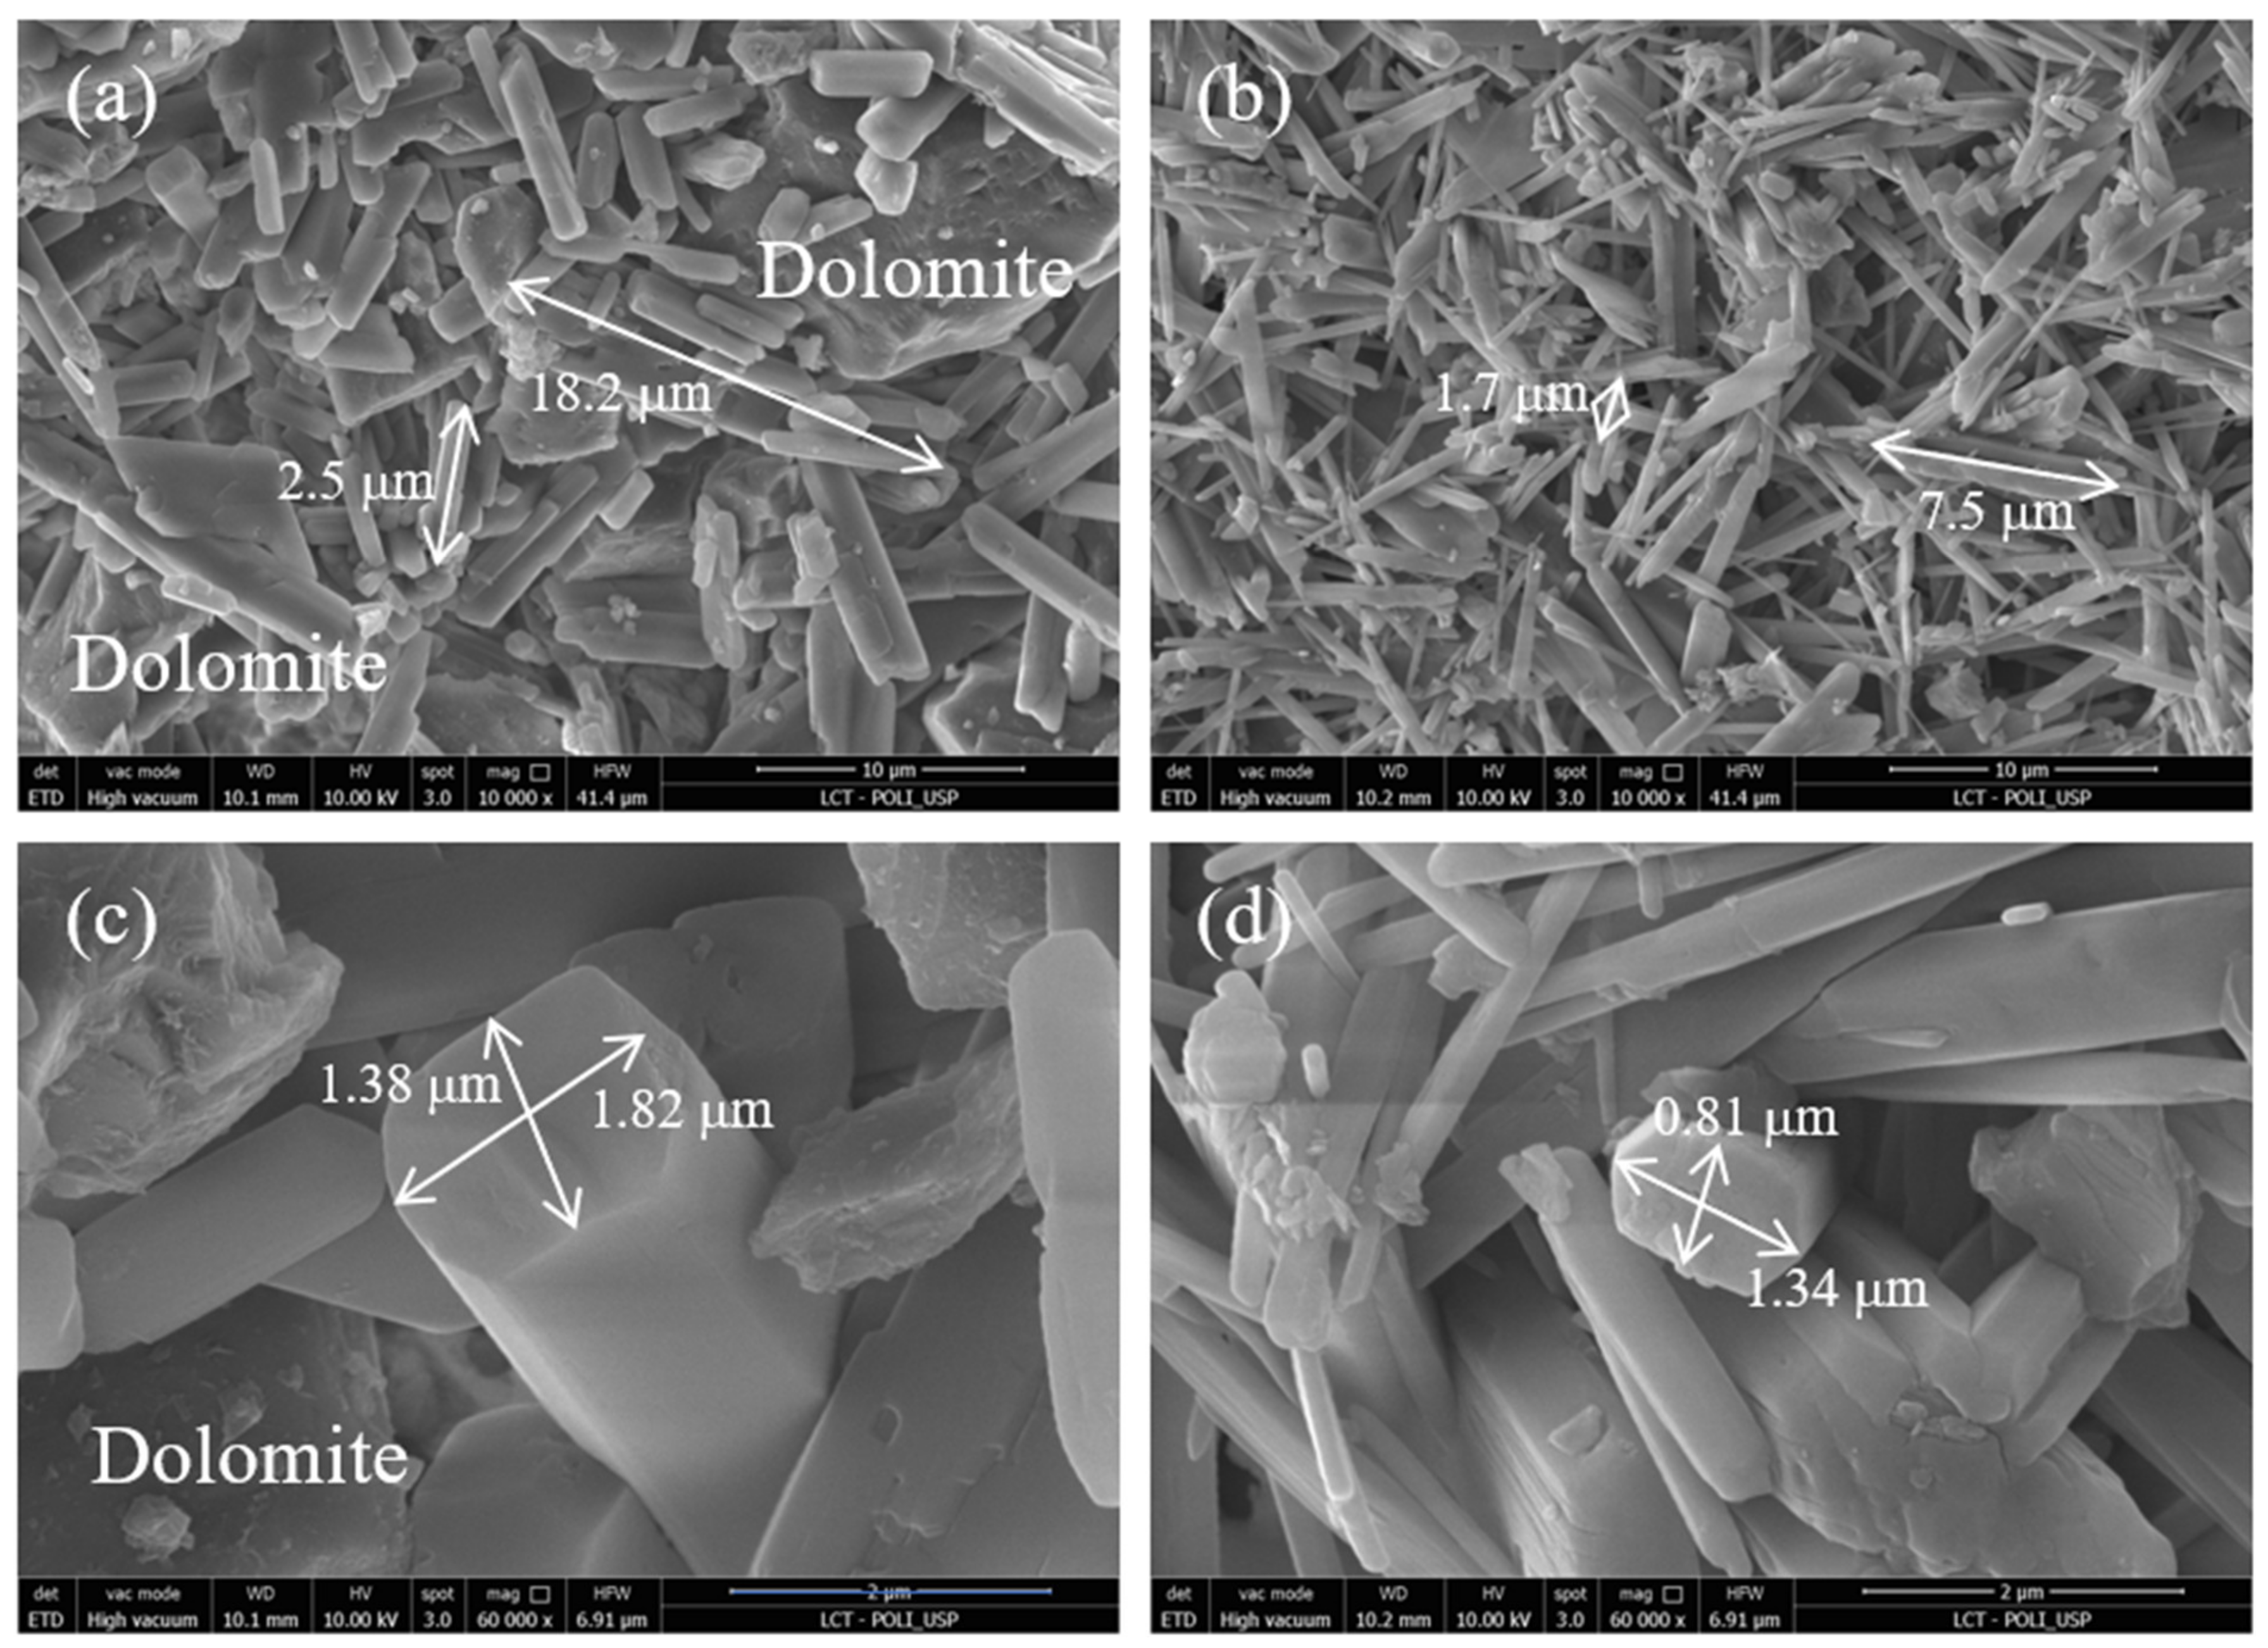
3.6. Scanning Electron Microscopy (SEM)
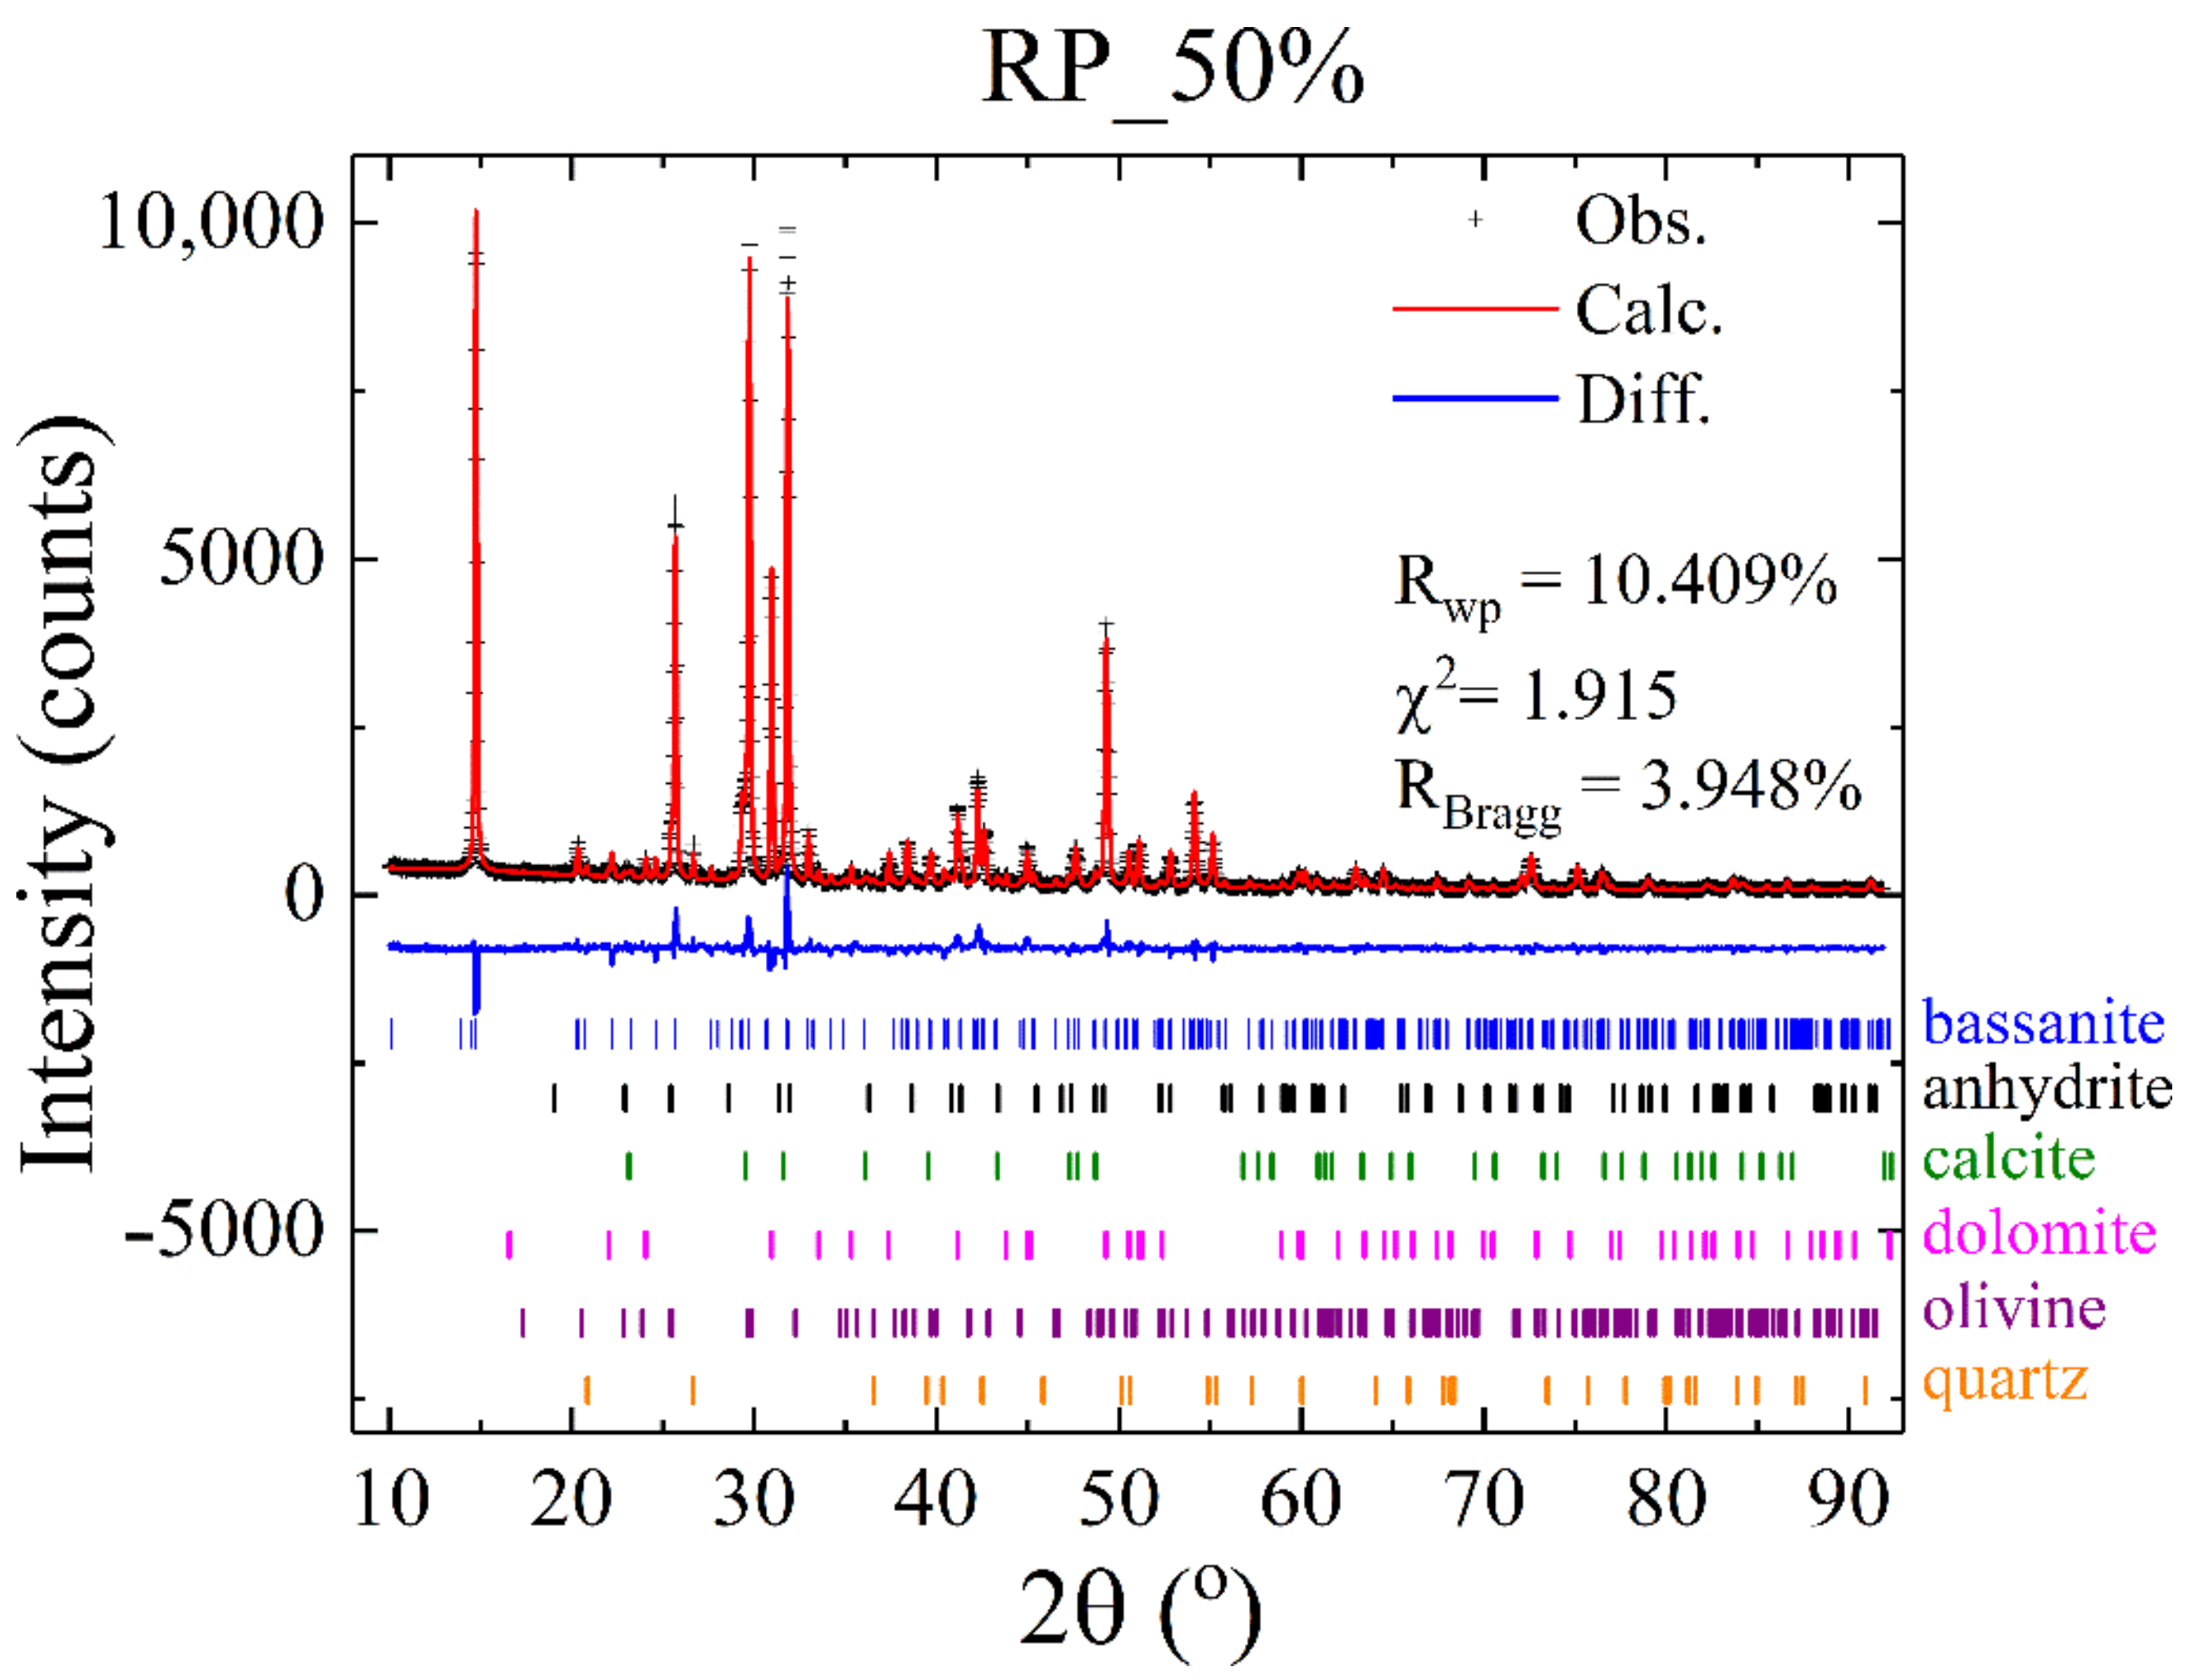
3.7. X-ray Powder Diffraction
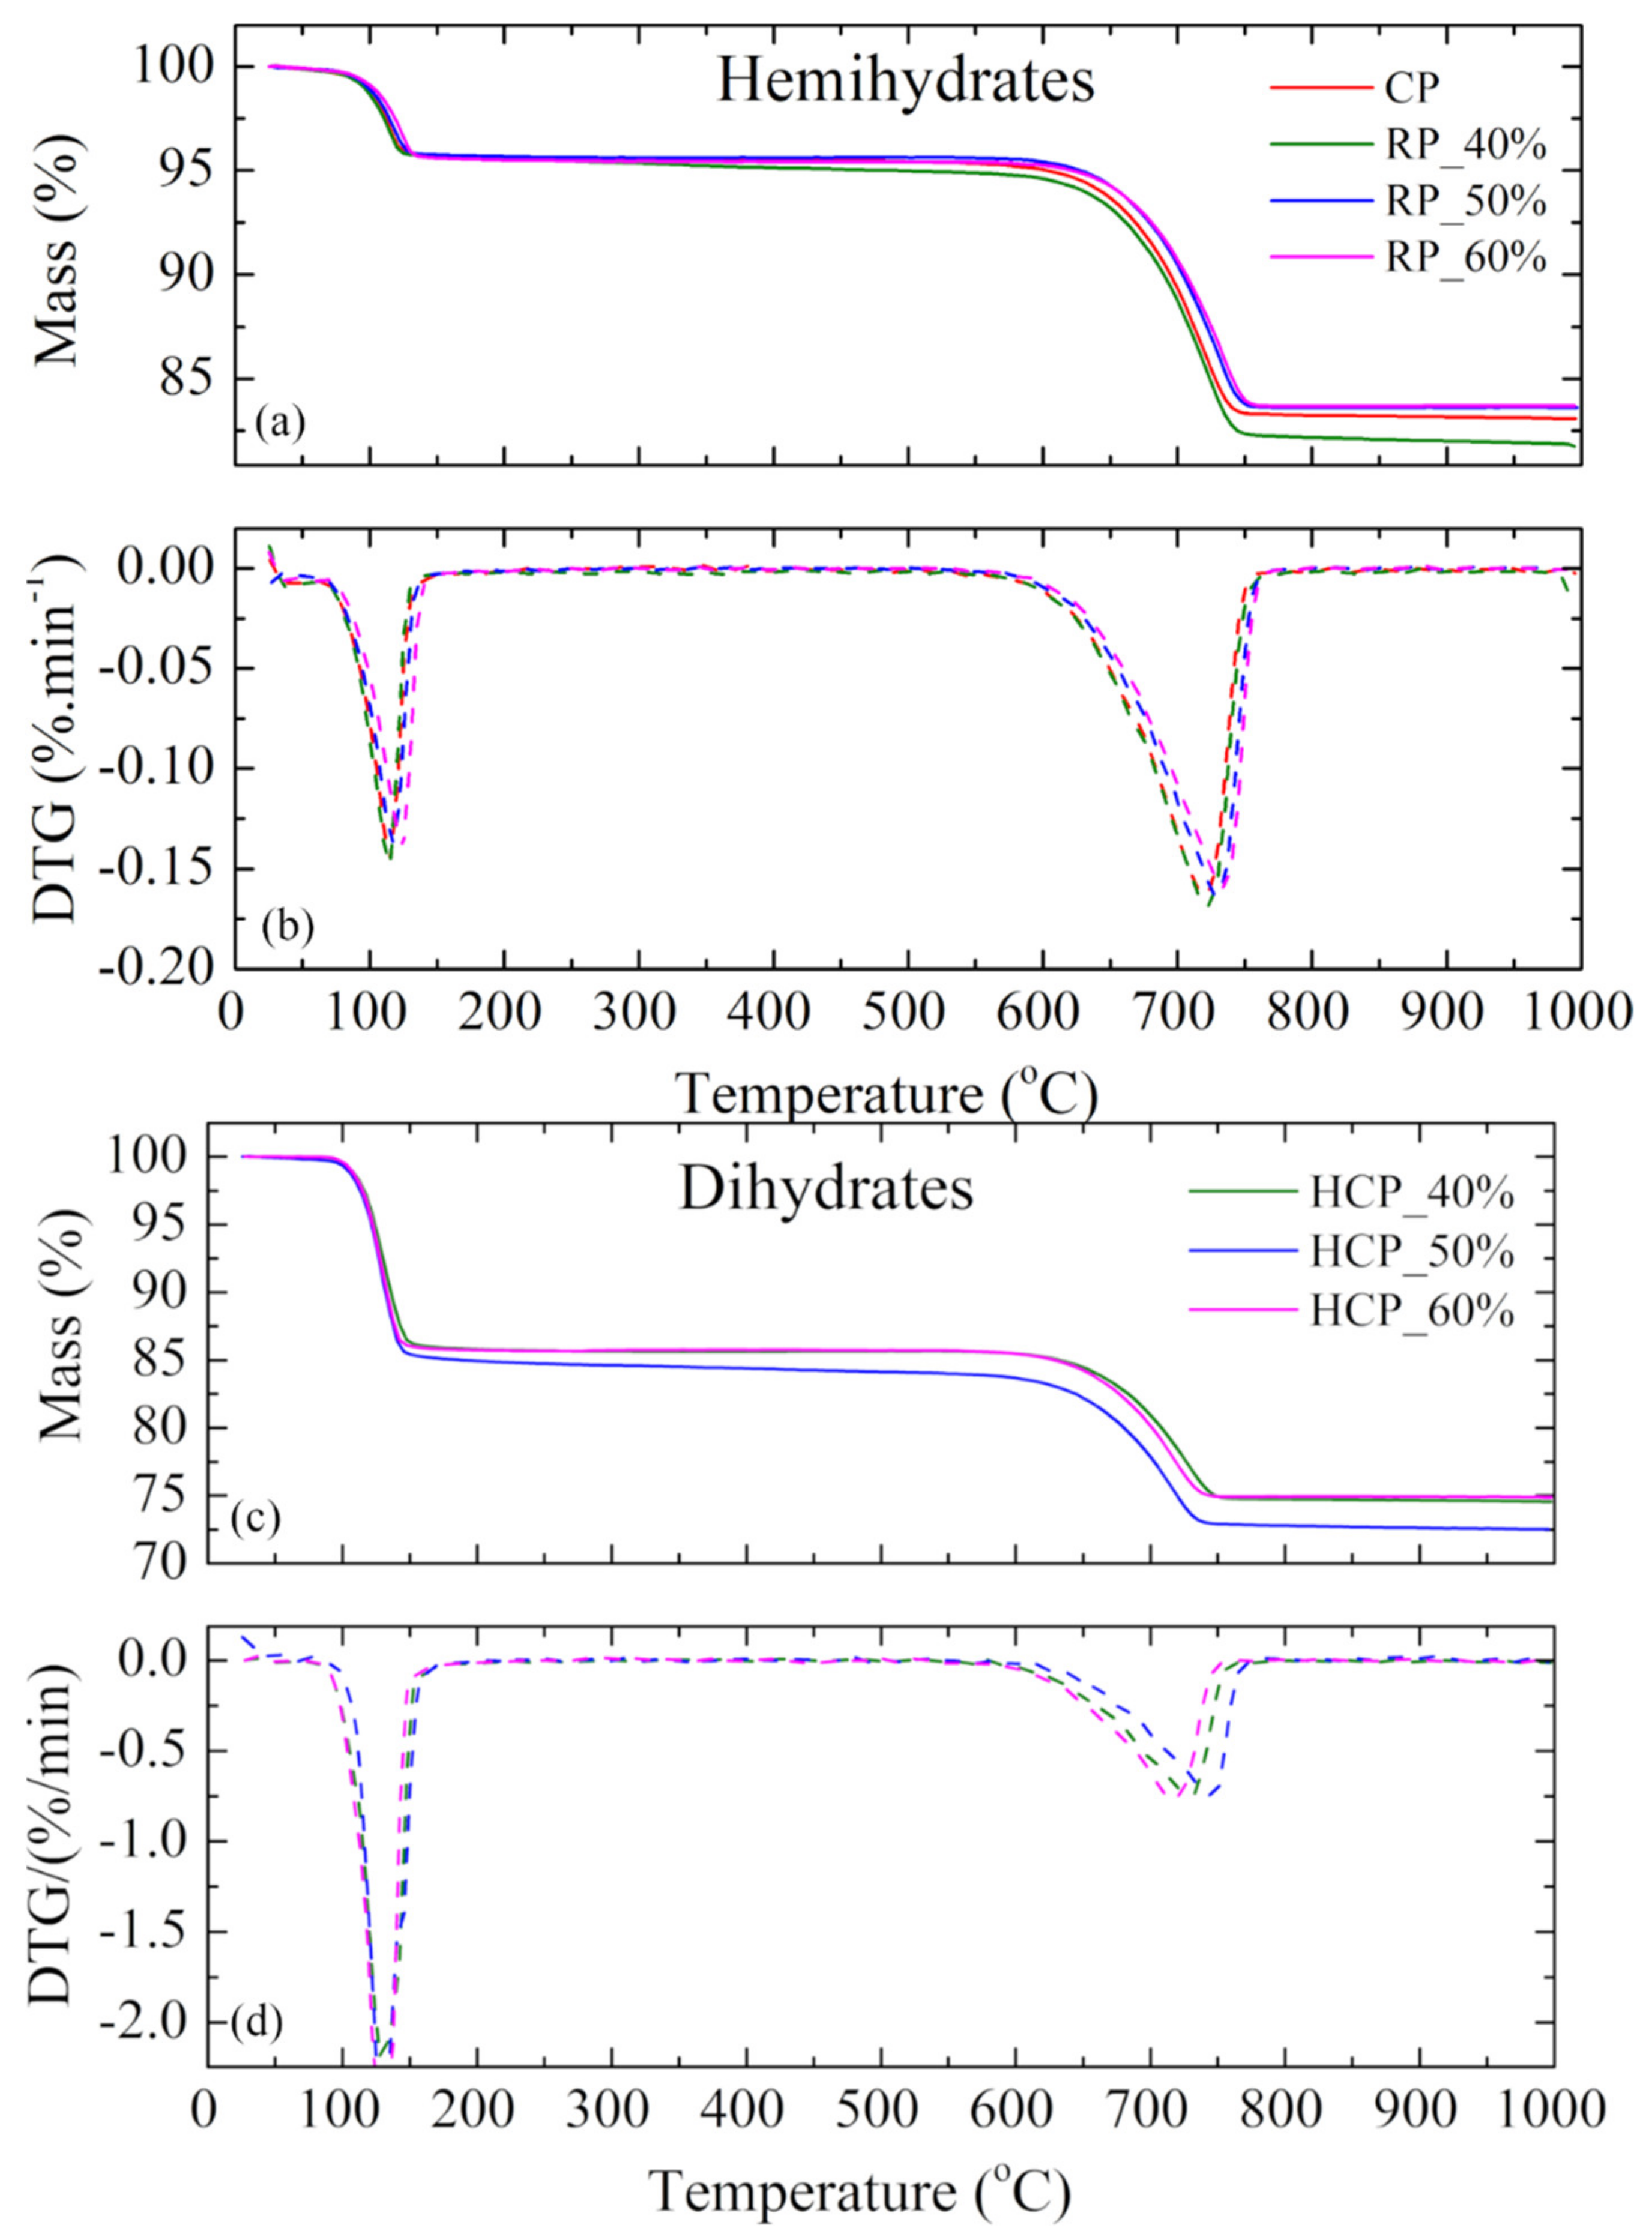
3.8. Thermogravimetric Analysis (TGA)
3.9. Comparison between TGA and XRPD
4. Conclusions
Author Contributions
Funding
Data Availability Statement
Conflicts of Interest
References
- Pinheiro, S.M.M.; Camarini, G. Characteristics of Gypsum Recycling in Different Cycles. Int. J. Eng. Technol. 2015, 7, 215–218. [Google Scholar] [CrossRef]
- Pedreño-Rojas, M.A.; De Brito, J.; Flores-Colen, I.; Pereira, M.F.C.; Rubio-de-Hita, P. Influence of gypsum wastes on the workability of plasters: Heating process and microstructural analysis. J. Build. Eng. 2020, 29, 101143. [Google Scholar] [CrossRef]
- Camarini, G.; Pimentel, L.L.; De Sá, N.H.R. Assessment of the material loss in walls renderings with β-hemihydrate paste. Appl. Mech. Mater. 2011, 71–78, 1242–1245. [Google Scholar] [CrossRef]
- Cañadas, E.M.; Ballesteros, M.; Foronda, A.; Navarro, F.B.; Jiménez, M.N.; Lorite, J. Enhancing seedling production of native species to restore gypsum habitats. J. Environ. Manag. 2015, 163, 109–114. [Google Scholar] [CrossRef] [PubMed][Green Version]
- Ahmed, A.; Ugai, K.; Kamei, T. Investigation of recycled gypsum in conjunction with waste plastic trays for ground improvement. Constr. Build. Mater. 2011, 25, 208–217. [Google Scholar] [CrossRef]
- Resolução n 431, de 24 de Maio de 2011; Ministério do Meio Ambiente: Brasília, Brazil, 2011; p. 2.
- Resolução n 307, de 05 de Julho de 2002; Ministério do Meio Ambiente: Brasília, Brazil, 2002; pp. 95–96.
- Cordon, H.C.F.; Cagnoni, F.C.; Ferreira, F.F. Comparison of physical and mechanical properties of civil construction plaster and recycled waste gypsum from São Paulo, Brazil. J. Build. Eng. 2019, 22, 504–512. [Google Scholar] [CrossRef]
- Geraldo, R.H.; Souza, J.D.; Campos, S.C.; Fernandes, L.F.R.; Camarini, G. Pressured recycled gypsum plaster and wastes: Characteristics of eco-friendly building components. Constr. Build. Mater. 2018, 191, 136–144. [Google Scholar] [CrossRef]
- Kuryatnyk, T.; Chabannet, M.; Ambroise, J.; Pera, J. Improvement of calcium sulfate water resistance by addition of calcium sulphoaluminate clinker. Mater. Lett. 2008, 62, 21–22. [Google Scholar] [CrossRef]
- Camarini, G.; Pinheiro, S.M.M.; Tannous, K. Thermal analysis of recycled gypsum from construction and demolition waste. Appl. Mech. Mater. 2012, 260–261, 977–980. [Google Scholar] [CrossRef]
- Dweck, J.; Lasota, E.I.P. Quality control of commercial plasters by thermogravimetry. Thermochim. Acta 1998, 318, 137–142. [Google Scholar] [CrossRef]
- Ghazi Wakili, K.; Koebel, M.; Kaufmann, J.; Derluyn, H.; Hofer, M.; Glaettli, T.; Modregger, P. Thermal conductivity of gypsum plasterboard beyond dehydration and its correlation with the pore structure. In Proceedings of the 9th International Conference on Heat Transfer, Fluid Mechanics and Thermodynamics, St Julian’s, Malta, 16–18 July 2012; pp. 892–895. [Google Scholar]
- Chandara, C.; Azizli, K.A.M.; Ahmad, Z.A.; Sakai, E. Use of waste gypsum to replace natural gypsum as set retarders in portland cement. Waste Manag. 2009, 29, 1675–1679. [Google Scholar] [CrossRef] [PubMed]
- Geraldo, R.H.; Pinheiro, S.M.; Silva, J.S.; Andrade, H.M.; Dweck, J.; Gonçalves, J.P.; Camarini, G. Gypsum plaster waste recycling: A potential environmental and industrial solution. J. Clean. Prod. 2017, 164, 288–300. [Google Scholar] [CrossRef]
- Flores Medina, N.; Hernández-Olivares, F.; Arroyo, X.; Aguilera, A.; Fernandez, F. Characterization of a more sustainable cement produced with recycled drywall and plasterboards as set retarders. Constr. Build. Mater. 2016, 124, 982–991. [Google Scholar] [CrossRef]
- Rietveld, H.M. Line profiles of neutron powder-diffraction peaks for structure refinement. Acta Crystallogr. 1967, 22, 151–152. [Google Scholar] [CrossRef]
- Rietveld, H.M. A profile refinement method for nuclear and magnetic structures. J. Appl. Crystallogr. 1969, 2, 65–71. [Google Scholar] [CrossRef]
- Scarlett, N.V.Y.; Madsen, I.C.; Manias, C.; Retallack, D. On-line X-ray diffraction for quantitative phase analysis: Application in the Portland cement industry. Powder Differ. 2001, 16, 71–80. [Google Scholar] [CrossRef]
- De la Torre, A.G.; Aranda, M.A.G.; De Torre, A.G.; Aranda, M.A.G. Accuracy in Rietveld quantitative phase analysis of Portland cements. J. Appl. Crystallogr. 2003, 36, 1169–1176. [Google Scholar] [CrossRef]
- Scrivener, K.L.; Füllmann, T.; Gallucci, E.; Walenta, G.; Bermejo, E. Quantitative study of Portland cement hydration by X-ray diffraction/Rietveld analysis and independent methods. Cem. Concr. Res. 2004, 34, 1541–1547. [Google Scholar] [CrossRef]
- Pinheiro, S.M.M. Gesso Reciclado: Avaliação de Propriedades Para uso em Componentes; Universidade Estadual de Campinas: Campinas, Brazil, 2011. [Google Scholar]
- Barbosa, A.A.; Ferraz, A.V.; Santos, G.A.; Juazeiro, C. Caracterização química, mecânica e morfológica do gesso β obtido do pólo do Araripe. Cerâmica 2014, 60, 501–508. [Google Scholar] [CrossRef]
- Lanzón, M.; García-Ruiz, P.A. Effect of citric acid on setting inhibition and mechanical properties of gypsum building plasters. Constr. Build. Mater. 2012, 28, 506–511. [Google Scholar] [CrossRef]
- Seufert, S.; Hesse, C.; Neubauer, J. Quantitative determination of anhydrite III from dehydrated gypsum by XRD. Cem. Concr. Res. 2009, 39, 936–941. [Google Scholar] [CrossRef]
- Bezou, C.; Nonat, A.; Mutin, J.-C.; Christensen, A.N.; Lehmann, M.S. Investigation of the Crystal Structure of γ-CaSO4, CaSO4·0.5 H2O, and CaSO4·0.6H2O by Powder Diffraction Methods. J. Solid State Chem. 1995, 117, 165–176. [Google Scholar] [CrossRef]
- ABNT—Associação Brasileira de Normas Técnicas. ABNT NBR 12128—Gesso Para Construção Civil—Determinação das Propriedades Físicas da Pasta de Gesso; ABNT: Rio de Janeiro, Brazil, 2017; p. 5. [Google Scholar]
- ABNT—Associação Brasileira de Normas Técnicas. ABNT NBR 12127—Gesso Para Construção Civil—Determinação das Propriedades Físicas do pó; ABNT: Rio de Janeiro, Brazil, 2017; p. 6. [Google Scholar]
- ABNT—Associação Brasileira de Normas Técnicas. ABNT NBR NM 23:2000—Cimento Portland e Outros Materiais em pó—Determinação da Massa Específica; ABNT: Rio de Janeiro, Brazil, 2015; p. 11. [Google Scholar]
- Hunger, M.; Brouwers, H.J.H. Flow analysis of water-powder mixtures: Application to specific surface area and shape factor. Cem. Concr. Compos. 2009, 31, 39–59. [Google Scholar] [CrossRef]
- Mantellato, S.; Palacios, M.; Flatt, R.J. Reliable specific surface area measurements on anhydrous cements. Cem. Concr. Res. 2015, 67, 286–291. [Google Scholar] [CrossRef]
- ABNT—Associação Brasileira de Normas Técnicas. ABNT NBR 12129—Gesso Para Construção Civil—Determinação das Propriedades Mecânicas; ABNT: Rio de Janeiro, Brazil, 2017; p. 6. [Google Scholar]
- De Oliveira, I.R.; Studart, A.R.; Pileggi, R.G.; Pandolfelli, V.C. Dispersão e Empacotamento de Partículas—Princípios e Aplicações em Processamento Cerâmico, 18th ed.; Fazendo Arte Editorial: São Paulo, Brazil, 2000. [Google Scholar]
- Brunauer, S.; Emmett, P.H.; Teller, E. Adsorption of Gases in Multimolecular Layers. J. Am. Chem. Soc. 1938, 60, 309–319. [Google Scholar] [CrossRef]
- Lewry, A.J.; Williamson, J. The setting of gypsum plaster—Part I The hydration of calcium sulphate hemihydrate. J. Mater. Sci. 1994, 29, 5279–5284. [Google Scholar] [CrossRef]
- Camarini, G.; De Milito, J.A. Gypsum hemihydrate-cement blends to improve renderings durability. Constr. Build. Mater. 2011, 25, 4121–4125. [Google Scholar] [CrossRef]
- ABNT—Associação Brasileira de Normas Técnicas. ABNT NBR 13207—Gesso Para Construção Civil—Requisitos; ABNT: Rio de Janeiro, Brazil, 2017; p. 3. [Google Scholar]
- Altomare, A.; Corriero, N.; Cuocci, C.; Falcicchio, A.; Moliterni, A.; Rizzi, R. QUALX2.0: A qualitative phase analysis software using the freely available database POW_COD. J. Appl. Crystallogr. 2015, 48, 598–603. [Google Scholar] [CrossRef]
- Gražulis, S.; Daškevič, A.; Merkys, A.; Chateigner, D.; Lutterotti, L.; Quiros, M.; Serebryanaya, N.R.; Moeck, P.; Downs, R.T.; Le Bail, A. Crystallography Open Database (COD): An open-access collection of crystal structures and platform for world-wide collaboration. Nucleic Acids Res. 2012, 40, D420–D427. [Google Scholar] [CrossRef]
- Comodi, P.; Nazzareni, S.; Zanazzi, P.F.; Speziale, S. High-pressure behavior of gypsum: A single-crystal X-ray study. Am. Miner. 2008, 93, 1530–1537. [Google Scholar] [CrossRef]
- Schmidt, H.; Paschke, I.; Freyer, D.; Voigt, W. Water channel structure of bassanite at high air humidity: Crystal structure of CaSO4·0.625H2O. Acta Crystallogr. Sect. B Struct. Sci. 2011, 67, 467–475. [Google Scholar] [CrossRef]
- Höhne, E. A more accurate determination of the crystal structure of anhydrite, CaSO4. Sov. Phys. Crystallogr. 1963, 7, 559–569. [Google Scholar]
- Antao, S.; Hassan, I. Temperature dependence of the structural parameters in the transformation of aragonite to calcite, as determined from in situ synchrotron powder X-ray diffraction data. Can. Mineral. 2010, 48, 1225–1236. [Google Scholar] [CrossRef]
- Antao, S.M.; Mulder, W.H.; Hassan, I.; Crichton, W.A.; Parise, J.B. Cation disorder in dolomite, CaMg(CO3)2, and its influence on the aragonite + magnesite ⟷ dolomite reaction boundary. Am. Mineral. 2004, 89, 1142–1147. [Google Scholar] [CrossRef]
- Müller-Sommer, M.; Hock, R.; Kirfel, A. Rietveld refinement study of the cation distribution in (Co, Mg)-olivine solid solution. Phys. Chem. Miner. 1997, 24, 17–23. [Google Scholar] [CrossRef]
- Le Page, Y.; Donnay, G. Refinement of the crystal structure of low-quartz. Acta Crystallogr. Sect. B 1976, 32, 2456–2459. [Google Scholar] [CrossRef]
- Bish, D.L.; Howard, S.A. Quantitative phase analysis using the Rietveld method. J. Appl. Crystallogr. 1988, 21, 86–91. [Google Scholar] [CrossRef]
- Coelho, A.A. TOPAS and TOPAS-Academic: An optimization program integrating computer algebra and crystallographic objects written in C++. J. Appl. Crystallogr. 2018, 51, 210–218. [Google Scholar] [CrossRef]
- Järvinen, M.; Jarvinen, M. Application of symmetrized harmonics expansion to correction of the preferred orientation effect. J. Appl. Crystallogr. 1993, 26, 525–531. [Google Scholar] [CrossRef]
- Boisvert, J.P.; Domenech, M.; Foissy, A.; Persello, J.; Mutin, J.C. Hydration of calcium sulfate hemihydrate (CaSO4·12H2O) into gypsum (CaSO4·2H2O). The influence of the sodium poly(acrylate)/surface interaction and molecular weight. J. Cryst. Growth 2000, 220, 579–591. [Google Scholar] [CrossRef]
- Pundir, A.; Garg, M.; Singh, R. Evaluation of properties of gypsum plaster-superplasticizer blends of improved performance. J. Build. Eng. 2015, 4, 223–230. [Google Scholar] [CrossRef]
- Borrachero, J.; Payá, M.; Bonilla, J.; Monzó, M. The use of thermogravimetric analysis technique for the characterization of construction materials: The gypsum case. J. Therm. Anal. Calorim. 2008, 91, 503–509. [Google Scholar] [CrossRef]
- Peres, L.; Benachour, M.; Santos, V.A. O Gesso—Produção e Utilização na Construção Civil; Bagaço: Recife, Brazil, 2001. [Google Scholar]


| Sample | CP | RP_40% | RP_50% | RP_60% |
|---|---|---|---|---|
| Bulk density (kg·m−3) | 899 (12) | 631 (10) | 561 (3) | 449 (5) |
| Density (kg·m−3) | 2796 (59) | 2462 (97) | 2514 (59) | 2517 (60) |
| Compactness (%) | 32.1 | 25.6 | 22.3 | 17.8 |
| Sample | d50 (10−3 mm) | d10 (10−3 mm) | d90 (10−3 mm) | d90–d10 | VSA (m2·cm−3) |
|---|---|---|---|---|---|
| CP | 8.02 | 1.71 | 30.62 | 28.91 | 1.44 |
| RP_40% | 3.86 | 1.36 | 11.08 | 9.72 | 2.15 |
| RP_50% | 5.35 | 1.59 | 9.31 | 7.72 | 1.7 |
| RP_60% | 6.06 | 1.83 | 20.14 | 18.31 | 1.52 |
| Sample | Specific Surface Area (m2·g−1) |
|---|---|
| CP | 1.79 |
| RP_40% | 2.2 |
| RP_50% | 2.04 |
| RP_60% | 1.9 |
| Samples | CP | RP_40% | RP_50% | RP_60% | HCP_40% | HCP_50% | HCP_60% | |||||||
|---|---|---|---|---|---|---|---|---|---|---|---|---|---|---|
| Compounds (wt%) | TGA | XRPD | TGA | XRPD | TGA | XRPD | TGA | XRPD | TGA | XRPD | TGA | XRPD | TGA | XRPD |
| Gypsum (CaSO4·2H2O) | - | - | - | - | - | - | - | - | 68.1 | 61.6 (17) | 74.2 | 72.5 (13) | 72.4 | 69.2 (13) |
| Bassanite (CaSO4·0.5H2O) | 66.3 | 64.2 (14) | 74.3 | 69.7 (17) | 76.9 | 71.6 (19) | 77.6 | 70.5 (18) | - | 3.9 (3) | - | 1.0 (1) | - | 1.0 (1) |
| Anhydrite (CaSO4) | - | 4.1 (2) | - | 3.1 (2) | - | 1.9 (2) | - | 1.7 (2) | - | 2.4 (2) | - | 2.0 (1) | - | 2.1 (1) |
| Calcite (CaCO3) | - | 5.1 (3) | - | 4.1 (4) | - | 3.9 (4) | - | 3.8 (4) | - | 5.3 (4) | - | 4.3 (3) | - | 4.8 (3) |
| Dolomite (MgCaC2O6) | 22.1 | 25.7 (13) | 19.9 | 22.1 (14) | 21.7 | 21.7 (16) | 22.4 | 22.6 (16) | 22.8 | 26.0 (14) | 18.2 | 19.8 (11) | 19.2 | 22.6 (11) |
| Olivine (Mg2∙SiO4) | - | 0.7 (1) | - | 0.6 (1) | - | 0.6 (2) | - | 1.0 (1) | - | 0.5 (1) | - | 0.3 (1) | - | - |
| Quartz (SiO2) | - | 0.2 (0) | - | 0.4 (1) | - | 0.3 (0) | - | 0.4 (1) | - | 0.3 (0) | - | 0.1 (0) | - | 0.3 (0) |
| Impurities | 11.6 | - | 5.8 | - | 1.4 | - | 0 | - | 9.1 | - | 7.6 | - | 8.4 | - |
| Total | 100 | 100 | 100 | 100 | 100 | 100 | 100 | 100 | 100 | 100 | 100 | 100 | 100 | 100 |
| Sulfate phases | 66.3 | 68.3 | 74.3 | 72.8 | 76.9 | 73.5 | 77.6 | 72.2 | 68.1 | 67.9 | 74.2 | 75.5 | 72.4 | 72.3 |
| Sulfate phasesTGA–sulfate phasesXRPD | −2 | 1.5 | 3.4 | 5.4 | 0.2 | −1.3 | 0.1 | |||||||
| Carbonate phases | 22.1 | 30.8 | 19.9 | 26.9 | 21.7 | 25.6 | 22.5 | 26.4 | 22.8 | 31.3 | 18.2 | 24.1 | 19.2 | 27.4 |
| Carbonate phasesTGA–carbonate phasesXRPD | −8.7 | −7 | −3.9 | −3.9 | −8.5 | −5.9 | −8.2 | |||||||
Publisher’s Note: MDPI stays neutral with regard to jurisdictional claims in published maps and institutional affiliations. |
© 2021 by the authors. Licensee MDPI, Basel, Switzerland. This article is an open access article distributed under the terms and conditions of the Creative Commons Attribution (CC BY) license (https://creativecommons.org/licenses/by/4.0/).
Share and Cite
Cordon, H.C.F.; Ferreira, M.S.; Ferreira, F.F. Comparative Analysis of Recycled Plaster Composition Determined by X-ray Powder Diffraction and Thermogravimetric Analyses. Constr. Mater. 2021, 1, 105-121. https://doi.org/10.3390/constrmater1020008
Cordon HCF, Ferreira MS, Ferreira FF. Comparative Analysis of Recycled Plaster Composition Determined by X-ray Powder Diffraction and Thermogravimetric Analyses. Construction Materials. 2021; 1(2):105-121. https://doi.org/10.3390/constrmater1020008
Chicago/Turabian StyleCordon, Heloísa Cristina Fernandes, Mariana Silva Ferreira, and Fabio Furlan Ferreira. 2021. "Comparative Analysis of Recycled Plaster Composition Determined by X-ray Powder Diffraction and Thermogravimetric Analyses" Construction Materials 1, no. 2: 105-121. https://doi.org/10.3390/constrmater1020008
APA StyleCordon, H. C. F., Ferreira, M. S., & Ferreira, F. F. (2021). Comparative Analysis of Recycled Plaster Composition Determined by X-ray Powder Diffraction and Thermogravimetric Analyses. Construction Materials, 1(2), 105-121. https://doi.org/10.3390/constrmater1020008