Article

Comparative Analysis of Recycled Plaster Composition Determined by X-ray Powder Diffraction and Thermogravimetric Analyses

by
Heloísa Cristina Fernandes Cordon
1,*,
Mariana Silva Ferreira
1,2 and
Fabio Furlan Ferreira
2
1
Department of Civil Engineering, Mauá Engineering School, Mauá Institute of Technology (EEM/CEUN-IMT), São Caetano do Sul 09580-900, SP, Brazil
2
Centre for Natural and Human Sciences (CCNH), Federal University of ABC (UFABC), Santo André 09210-580, SP, Brazil
*
Author to whom correspondence should be addressed.
Constr. Mater. 2021, 1(2), 105-121; https://doi.org/10.3390/constrmater1020008
Submission received: 28 April 2021 / Revised: 29 June 2021 / Accepted: 2 July 2021 / Published: 12 July 2021

Abstract

:
Plaster is primarily used as a building material obtained by the calcination of gypsum. Its rapid setting time (time for the mixture to solidify) and the low quality of labor generate a large amount of nonused material. Due to its solubility in water, wasted gypsum cannot be disposed of in the environment, and its recycling process is encouraged. In this work, quantitative phase analyses (QPA) using X-ray powder diffraction (XRPD) data and the Rietveld method were carried out to determine the amounts of each compound present in commercial, hydrated, and laboratory-recycled plasters, and the results compared with those obtained by thermogravimetric analysis (TGA). It was inferred that the Rietveld method associated with XRPD data is quite efficient since it identifies compounds not seen in the TGA. Furthermore, the amount of water used in the preparation of hydrated samples influences the proper hydration of the material and, consequently, the recycled composition of the samples.

Graphical Abstract

1. Introduction

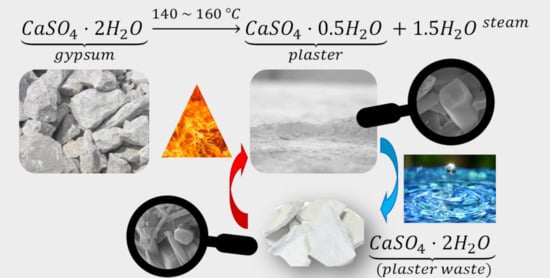
Plaster, in the form of hemihydrate (CaSO4∙0.5H2O), undergoes an exothermic reaction when hydrated and returns to its natural chemical formula (gypsum, CaSO4∙2H2O), thus forming a plaster paste commonly used in construction as internal coatings, decorative elements, and plasterboards [1], constituting the construction sector responsible for the consumption of 95% of the total production of gypsum [2]. This paste remains in the viscous state for a period called “setting time”, and after that, it reaches the solid state, making it impossible to model.
Concomitant to the plaster use growth, the waste of this material grows due to both its low handling time and the low-quality workmanship used in its handling. According to Camarini et al. [3], gypsum plaster waste ranges from 4% to 15% of the Brazilian construction and demolition waste. Additionally, gypsum cannot be discarded in ordinary landfills due to its solubility in water, leading to soil leaching, and in contact with moisture, sulfate-reducing bacteria act on the gypsum, causing the release of hydrogen sulfide gas (H2S) [3,4,5]. In Brazil, National Environment Council Resolution (CONAMA) No. 431/2011 [6] amended Resolution No. 307/2002 [7] by allocating plaster, which previously belonged to Class C (wastes for which economically viable technologies or applications were not recycled or recovered), to Class B (recyclable waste for other destinations).
The recycling process for this material is straightforward and demands low energy consumption, requiring only new calcination of the hydrated gypsum to form the hemihydrate plaster again, which can be rehydrated and then reused since it is endlessly recyclable [8,9]. Several studies have evaluated the microstructure of recycled gypsum using chemical analysis [10]; thermal analyses such as TGA, DTGA, and DTA [8,11,12,13]; X-ray fluorescence [8,14]; and/or grain morphology by SEM [1,15,16]. The X-ray powder diffraction (XRPD) technique associated with the Rietveld method for the refinement of crystal structures [17,18] is already widely described in the literature for phase quantification of Portland cement [19,20,21]. However, in plaster studies, this technique is used, in most cases, to qualitatively determine the phases present in the material [2,9,14,22,23,24], but few studies use the Rietveld method with the intention of performing a quantitative phase analysis (QPA), such as Ahmed et al. [5], who used QPA with XRPD data to determine a 99.8% bassanite content in a plasterboard recycled plaster, and Seufert [25], who performed XRPD measurements on plasters subjected to different calcination temperatures (85, 120, 180, 250, 380, and 550 °C), which were then packed in moisture-protected containers up to the time of the tests, and applied the Rietveld method for the determination of the mass fraction of gypsum, bassanite, and anhydrite. Bezou et al. [26] used synchrotron and neutron diffraction data and the Rietveld method to determine the fractional coordinates of water molecules within the soluble anhydrite structure and two forms of subhydrated calcium hydroxide (CaSO4·0.5H2O and CaSO4·0.6H2O); however, they did not present results regarding the quantitative phase analyses of the materials.
Thus, the present work brings the main contribution of using X-ray powder diffraction data and the Rietveld method to perform a microstructural study of plaster to analyze eventual phase changes generated by the recycling process by comparing the results obtained with a commercial plaster after hydration and after calcination. A correlation was also made between the results and those obtained by using thermogravimetric analysis.

2. Material and Methods

The plaster sample was obtained from the commercial sector and named in this work as commercial plaster (CP). To analyze the behavior of the recycled material, CP was hydrated with three water/plaster ratios (40%, 50%, and 60% in mass) following the Brazilian standard NBR 12128 [27], originating the hydrated samples HCP_40%, HCP_50%, and HCP_60%. After being thoroughly dried, the hydrated plasters were ground in an electric hammer mill. Each sample was submitted to kiln calcination at 160 °C for 2.5 h, resulting in a mass loss of approximately 16%, and the generated recycled plaster samples were named RP_40%, RP_50%, and RP_60%.
The bulk density was determined according to NBR 12127 [28], and the density determination was carried out according to the NBR standard NM 23 [29].
The particle size distribution was obtained using a HELOS/BR laser diffraction sensor (Sympatec GmbH, Clausthal-Zellerfeld, Germany), equipped with a Sucell automatic wet dispersion unit (Sympatec GmbH, Clausthal-Zellerfeld, Germany). An amount of 0.15 g of plaster in hemihydrate form was mechanically dispersed at 1000 rpm for 60 s in 50 mL of anhydrous ethyl alcohol to prevent the dissolution of small particles during measurement. The solution was then maintained for 120 s in an ultrasonic bath before measurement to avoid particle agglomeration and sedimentation, as indicated by Hunger and Brouwers [30].
The specific surface area tests of plasters were performed on a Belsorp Max equipment (MicrotracBEL, Osaka, Japan) based on N2 adsorption on the sample solid surface. All samples were pretreated for 16 h at a temperature of 40 °C in a Belprep-vacII equipment (MicrotracBEL, Osaka, Japan) under a vacuum of 10−2 kPa, which were necessary conditions to prevent dehydration of the gypsum [31]. To determine the setting time, defined as the time the material takes to solidify after coming into contact with water, a plaster paste was produced with the amount of water encountered in the normal consistency test. The starting setting time is defined as the moment the needle of the Vicat apparatus, with a diameter of 1.13 ± 0.02 mm, stops 1 mm from the base, while the final setting time is defined as the moment the needle leaves only a print on the surface, no longer able to enter into the paste, as recommended by NBR 12128 [27].
Compressive strength (R, in MPa), described in NBR 12129 [32], is calculated by the relation between the rupture load (P, in N) and the effort application area (S, in mm²): R = P/S. The rehydrated specimens were produced for these tests by mixing the recycled plasters with the same water/plaster ratios (40%, 50%, and 60% in mass) used in the first hydration. The hydrated samples were named HRP_40%, HRP_50%, and HRP_60%, and a mold with the capacity to produce three cubic samples with a 50.0 mm edge each was used to shape the samples.
A scanning electron microscope (SEM, Thermo Fisher Scientific, Waltham, MA, USA), operating at 10 kV and using a 10 mm working distance, model Quanta 650 FEG from FEI®, was used to acquire scanning electron microscopy images. Backscattered electron images and EDS chemical analyses were obtained with a voltage of 20 kV and a working distance of 13.5 mm. The studied samples HCP_60% and HRP_60% were prepared in a ceramic vessel, and they stood on a laboratory bench until complete drying (at least 24 h). Then, the hardened pastes were fractured with the aid of a spatula to form small fragments. The fragments were fixed in a stub with double-sided carbon tape and covered with a fine platinum coverage (Bal-tec coater, model MED-020).
X-ray powder diffraction (XRPD, Stoe, Darmstadt, Germany) data were collected at room temperature on a Stoe® STADI-P powder diffractometer with monochromatic radiation λ = 1.54056 Å (CuKα1) operating at 40 kV and 40 mA, in transmission geometry, with the samples loaded between two cellulose acetate foils, kept in rotation during data collection. A silicon microstrip detector, Mythen 1K (Dectris®), recorded the diffracted intensities in the range of 10° to 90°, with step sizes of 0.015° and 150 s of integration time at each 1.05°.
The thermogravimetric analyses were performed in a Netzsch STA 409 PC equipment (NETZSCH-Gerätebau GmbH, Selb, Germany) from 30 to 1000 °C in an open alumina pan using a heating rate of 5 °C min−1 under an inert atmosphere (N2 flux = 20 mL·min−1).

3. Results and Discussion

3.1. Bulk Density, Density, and Compactness

Table 1 presents the average results and the standard deviation of the three determinations of bulk density, density, and compactness (ratio between bulk density and density averages) of the hemihydrate samples.
The samples CP and RP_40% complied with the required standard NBR 12127 [28], in which the bulk density minimum value should be 600 kg·m−3, but in comparison with the commercial plaster, the recycled plasters presented a significant reduction in bulk density (29.8% for RP_40%, 37.5% for RP_50%, and 50% for RP_60%) and compactness (20.3% for RP_40%, 30.5% for RP_50%, and 44.5% for RP_60%). These parameters were strongly influenced by the amount of water used in the production of the residue: the higher the water content, the more porous the resulting material, and the higher the material volume used by the same mass. The increasing porosity of the recycled material in relation to the material coming from the calcination of the gypsum may be related to the fact that the particles of the mineral (gypsum) were more compact than those of the hydrated gypsum residue that would undergo calcination, thus making the resulting hemihydrate a more porous material. The construction plaster density result was compatible with the value found by Hunger and Brouwers [30], which was 2720 kg·m−3. The recycled plasters displayed lower density values than the commercial one with an average reduction of 11%; the water content did not influence this characteristic.

3.2. Particle Size Distribution

Figure 1 presents the particle size distribution of the hemihydrate samples (commercial and recycled), and Table 2 the results for medium diameter (d50), distribution amplitude (d90–d10), and theoretical volumetric surface area (VSA) calculated from the product between the theoretical specific surface area and particle density [1,33].
As can be seen in Figure 1, all the samples present a monomodal distribution, and the particles in the recycled samples are smaller when compared with the commercial sample (red curves were dislocated to the left), which can be confirmed by the decrease in medium particle size (d50) shown in Table 2. Figure 1 shows that 46% of the commercial plaster particles have a diameter less than 0.01 mm, and all the recycled samples have at least 60% of the particles finer than 0.01 mm, indicating that the milling process of the recycled material was efficient in inducing a narrower size distribution. The sample produced with the lowest water content (RP_40%) showed the highest fineness, with 77% of the volume of the particles with a diameter smaller than 0.01 mm. The samples RP_50% and RP_60% presented similar behaviors in relation to the particle size distribution: around 62% of particles smaller than 0.01 mm (cumulative volume), but in the RP_50% sample, there was a higher concentration of particles with an average diameter of 0.030 mm when compared with RP_60%.
The decrease in particle size after recycling can also be confirmed by reducing the values of distribution amplitude and the increase in the VSA results, indicating an increase in the fineness of the material.

3.3. Specific Surface Area (BET)

Table 3 shows the specific surface area results of the hemihydrate samples (CP, RP_40%, RP_50%, and RP_60%). These tests are based on the BET method [34], which describes the particular adsorption of a gas on the particulate material, allowing the measurement of both the external and internal surface areas if the material has open pores on its surface.
As can be observed, the specific surface area increased after the recycling process, corroborating the VSA results shown previously, and RP_40% presented the major specific surface area, whereas the commercial plaster (CP) the minor one. This can indicate that the recycling process produces a finer and maybe more porous material, becoming even more reactive.

3.4. Setting Time

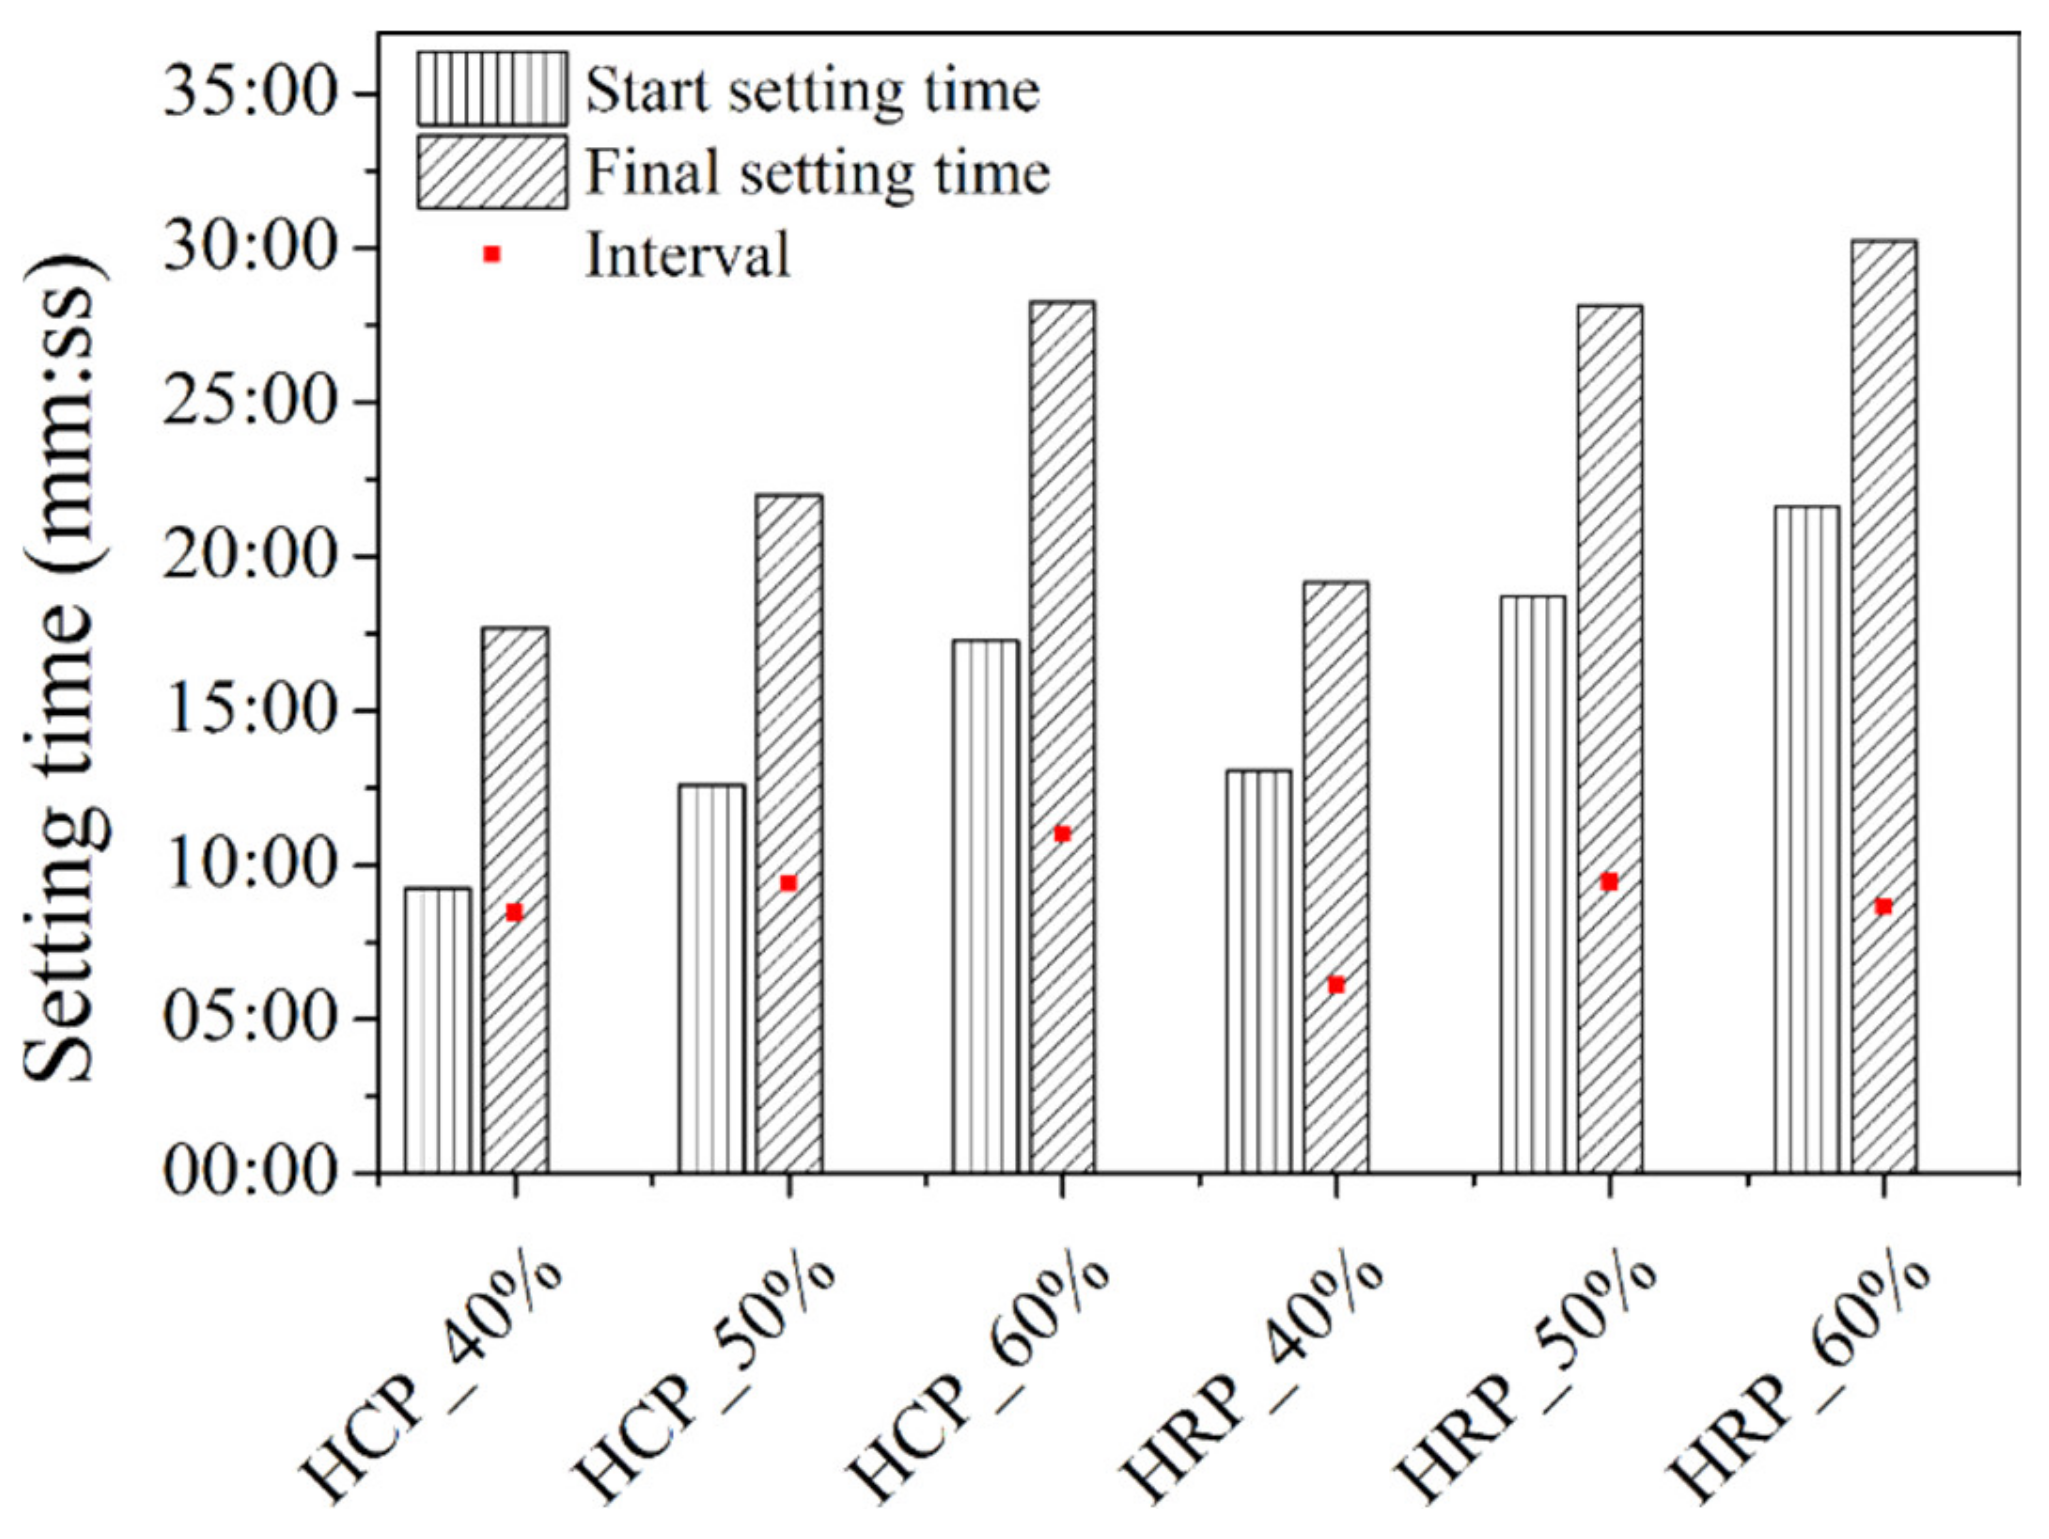
Figure 2 shows the start and final setting times of the samples and the interval between them.
As can be seen in Figure 2, both the start and final setting times, as well as the interval between them, increase with the water addition in the mixture because the more water there is, the more slowly the hydration reactions occur, as recommended in the literature and reported by Lewry and Williamson [35]. However, the start and final setting time interval decreased for the recycled plasters HCP_40% and HCP_60% but remained constant for HCP_50%.
A construction plaster paste prepared with a water/plaster ratio of 0.52 by Camarini and Milito [36] presented start and final setting times of 8 and 18 min, respectively, like those presented by the studied plaster (commercial sample).

3.5. Compressive Strength

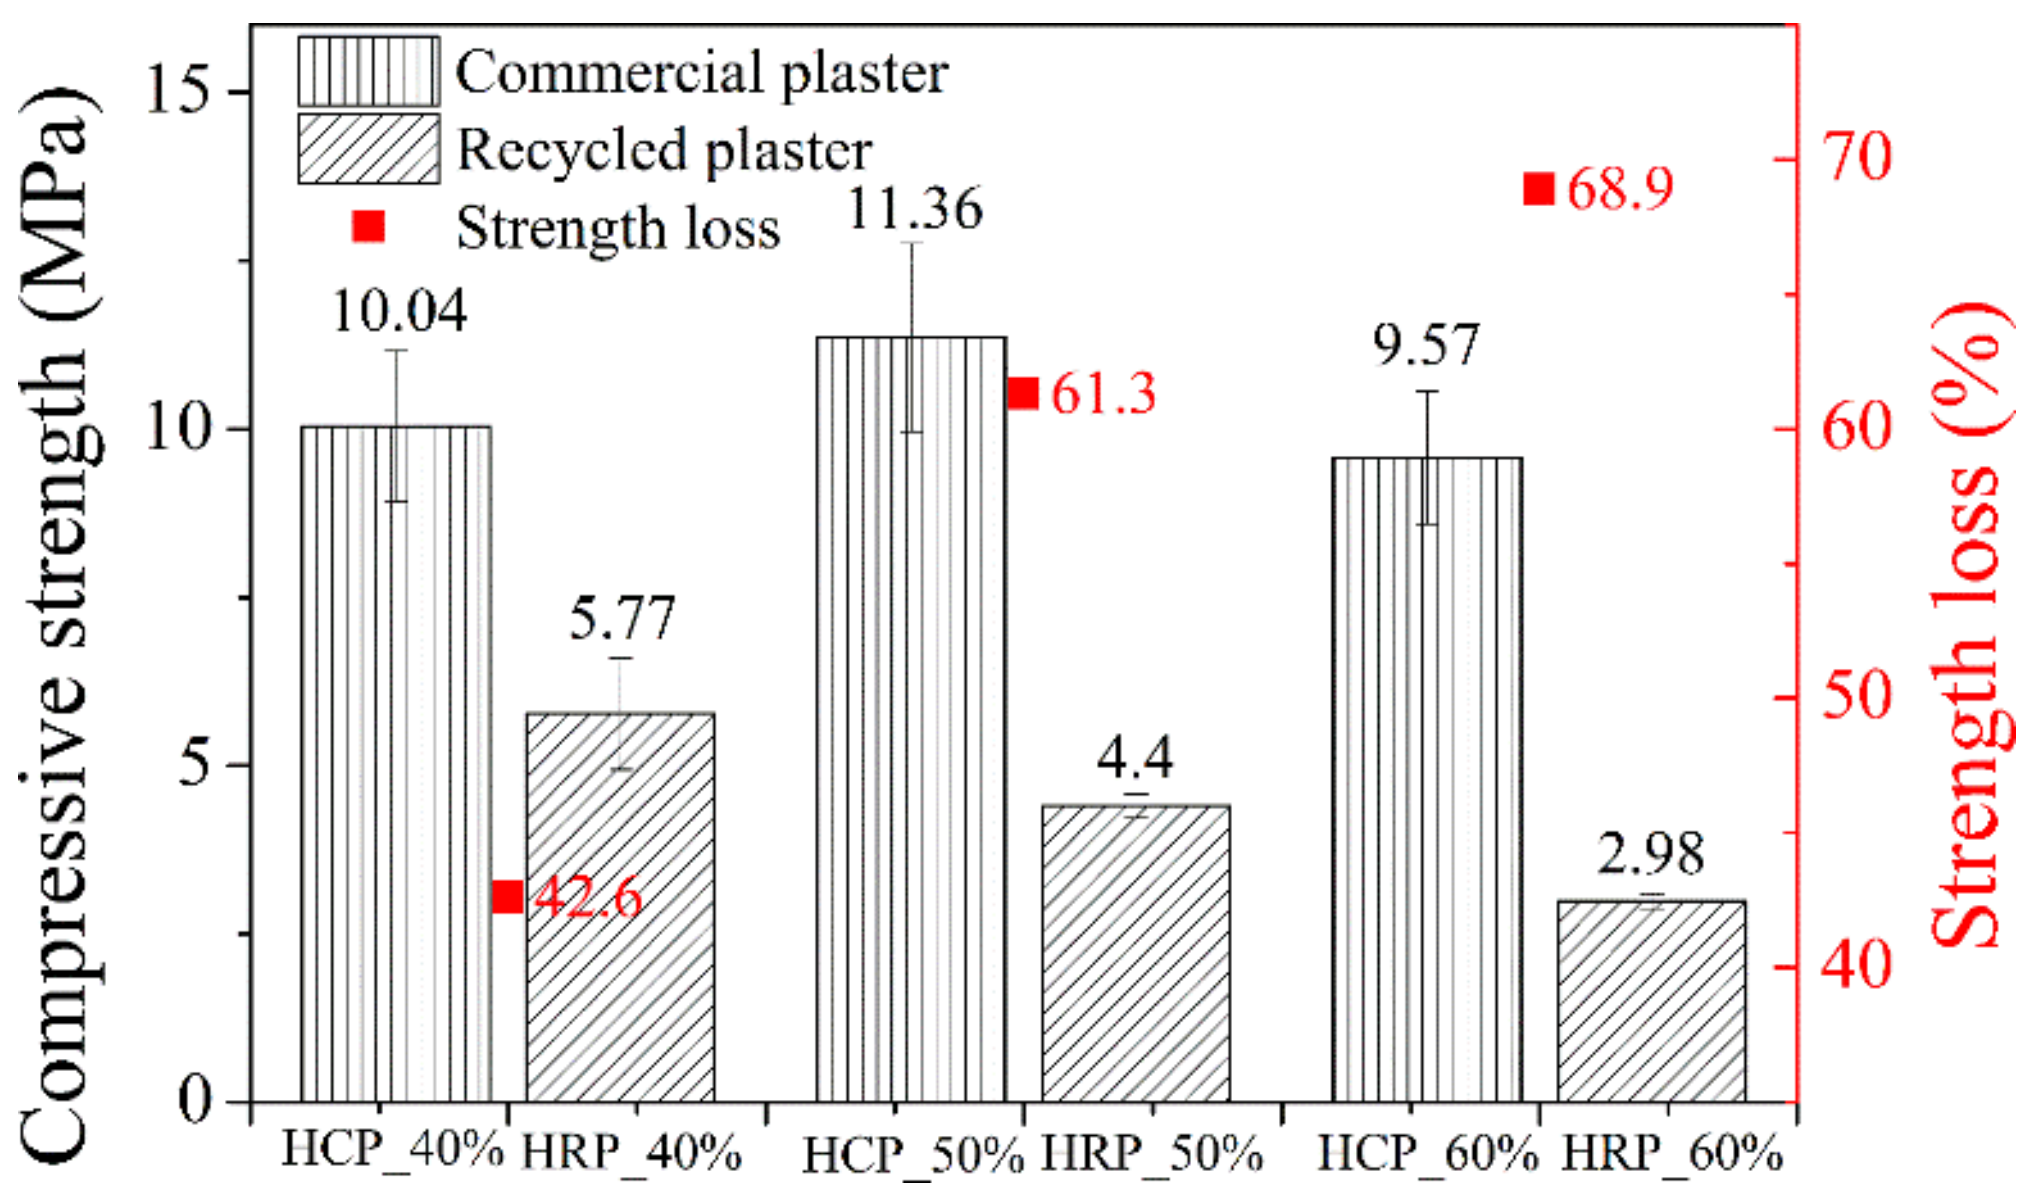
Figure 3 shows the average results of the compressive strength of three specimens for each sample.
The commercial plaster showed a compressive strength above the minimum value (8.40 MPa) specified in the Brazilian standard NBR 13207 [37] for all water contents used. Although it was expected that the compressive strength would decrease with increasing water content, the paste prepared with 50% water (HCP_50%) showed the highest value among the analyzed samples. This fact can be explained both by the higher dihydrate content present, verified by the characterization techniques already discussed, and by the viscosity of the paste, which allowed a better filling of the form. The HCP_40% sample was less fluid, making it difficult to mold the specimen, generating defects that reduced the compressive strength of the material.
After recycling, the material showed a reduction in compressive strength for all the samples, varying linearly with the water content of the paste: 42.6% for the sample HRP_40%, 61.3% for the sample HRP_50%, and 68.9% for the sample HRP_60%. One of the reasons for the reducing compressive strength may be the difficulty in molding the specimens since the pastes produced with recycled plaster were less fluid than the commercial one, probably generated by the increase in the specific surface area.

3.6. Scanning Electron Microscopy (SEM)

Figure 4 shows scanning electron microscopy images (SEM) of the hydrated samples with magnifications of 10,000 × and 60,000 ×. The images on the left panel (Figure 4a,c) correspond to the samples hydrated from the commercial plasters, and the images on the right (Figure 4b,d) are the samples hydrated from the recycled plasters.
As can be seen in Figure 4, the gypsum crystals are thinner, shorter, and not so well formed in the recycled sample, like in the commercial plaster. Gypsum crystals originated by the commercial plaster presented lengths of 2.5 to 18.7 μm (Figure 4a), while for the recycled sample, the length of the crystals varied from 1.7 to 7.5 μm (Figure 4b). The cross-section measures of the hydrated commercial crystal were 1.38 × 1.82 mm (Figure 4c), and for the hydrated recycled sample, they were 0.81 × 1.34 mm, confirming that the recycling process had an impact on the physical properties of the material. However, in Figure 5, it can be observed that the presence of impurities, such as dolomite, was verified by the EDS chemical analysis, confirming the phases found in the XRPD tests.

3.7. X-ray Powder Diffraction

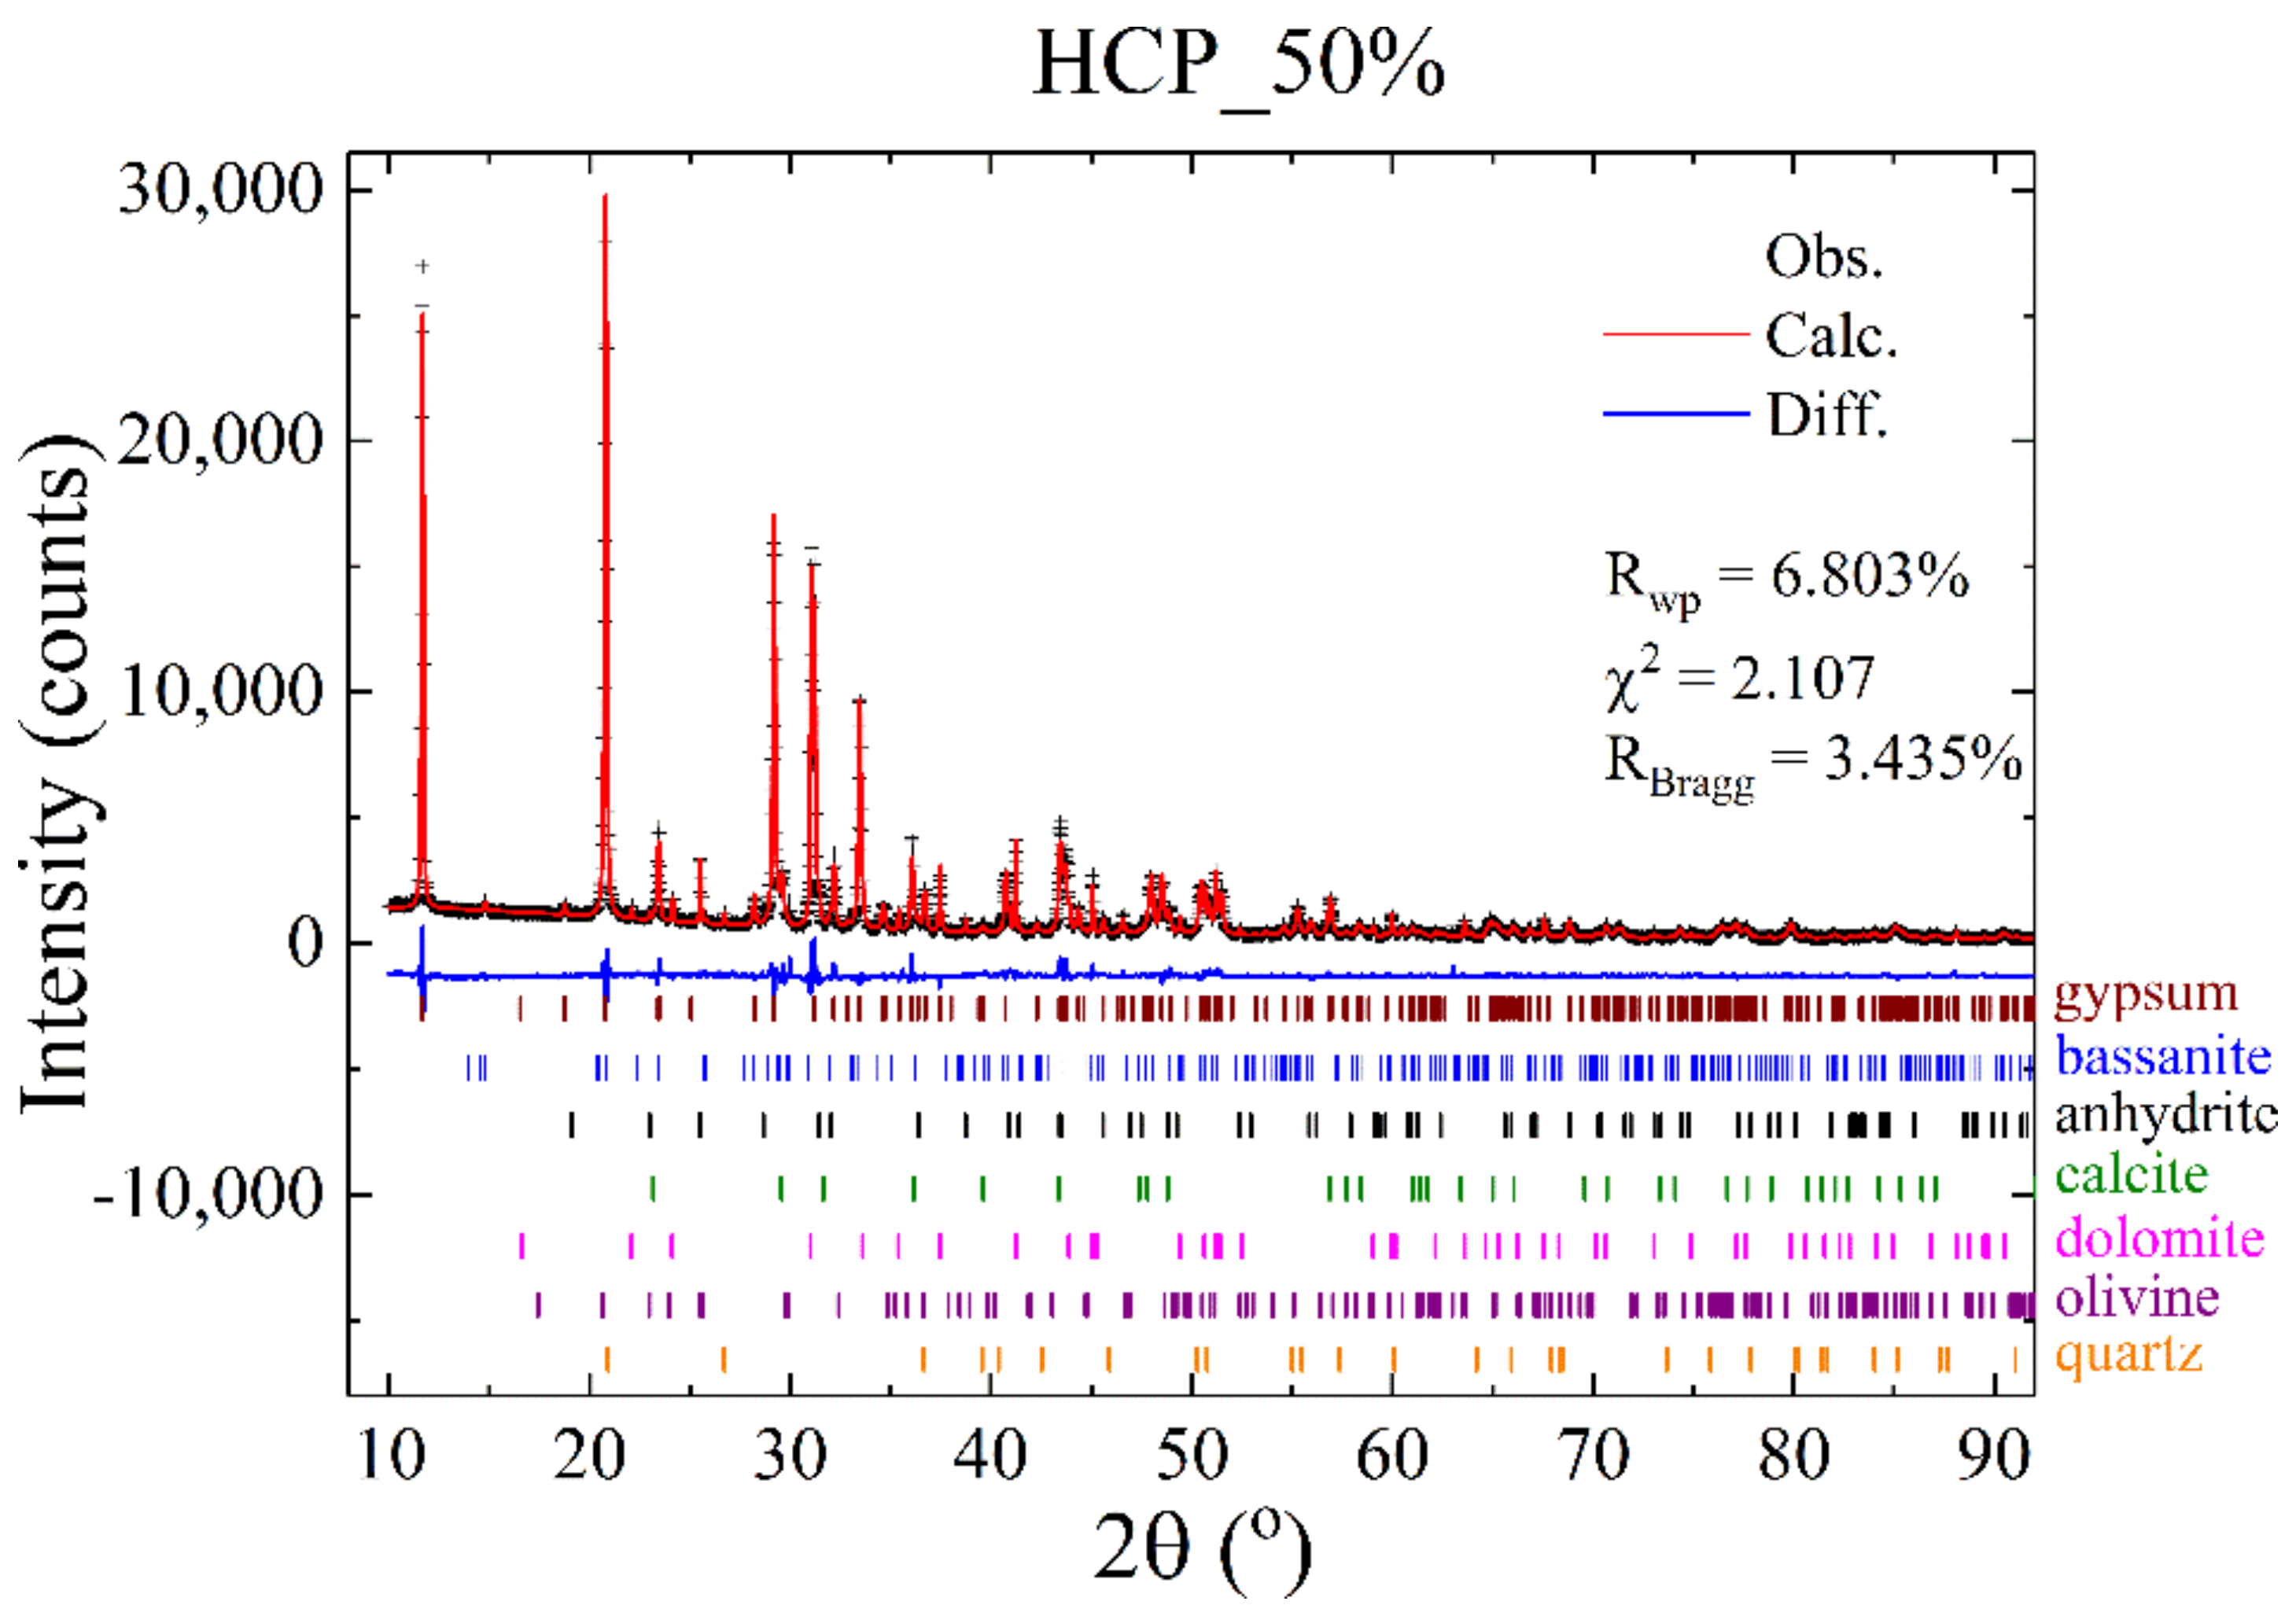
First, a qualitative phase analysis of the samples was carried out using the QualX2 software [38] implemented with an internal version (PowCod 1906) of the Crystallography Open Database (COD) [39] available at http://crystallography.net (accessed on 29 October 2020). The compounds found were gypsum (dihydrate—COD number 9013164 [40]), bassanite (hemihydrate—COD numbers 2105042 [41] and 9012211 [26]), anhydrite (ICSD number 28546 [42]), calcite (COD number 9015460 [43]), dolomite (COD number 9003508 [44]), olivine (COD number 9006398 [45]), and quartz (ICSD number 174 [46]). To determine the phase contents, quantitative phase analyses (QPA) [47] were carried out utilizing Rietveld refinements using the software TOPAS-Academic v. 6 [48]. The refinements of all the samples followed the strategies and parameters adopted by Cordon et al. [8].
Figure 6, Figure 7, Figure 8 and Figure 9 show the Rietveld plots of the hemihydrate samples. As previously described [8], the bassanite file 2105042 [41] was used for the Rietveld refinement of the commercial plaster (CP sample), and the bassanite file 9012211 [40] for the recycled samples (RP_40%, RP_50%, and RP_60%). The criterion for assessing the refinement quality was the same used by Cordon et al. [8] to verify the joint impact of some correction parameters (preferred orientation of the crystallites [49] or isotropic microstrain, for example) in the RWP, χ2, and RBragg factors of major phases, whose results are presented in the Rietveld plots (Figure 6, Figure 7, Figure 8 and Figure 9).
Commercial plaster commonly presents impurities such as clay, chalk, dolomite, silica, and iron compounds and may also occur in different colors. Boisvert et al. [50] used in their work an industrial plaster with 3% of anhydrite, 2% of CaCO3, 0.5% of MgCO3, and 0.5% of SiO2 determined by elemental analysis—values very different from those found herein. Chandara et al. [14] verified the presence of SiO2 in gypsum samples. The contents, determined by X-ray fluorescence, were 1.90 and 0.93 wt% for natural gypsum and wasted gypsum from the ceramic industry, values higher than those found in the present work (0.1% to 0.4%) for quartz.
The Rietveld plots of the dihydrate samples are shown in Figure 10, Figure 11 and Figure 12.
The hydrated plasters presented the expected gypsum phase, all the other compounds found in the hemihydrate samples, and a residual bassanite content, as also found by Pundir et al. [51]. The contents for all the phases will be presented in Section 3.9, with a subsequent comparison with TGA results.

3.8. Thermogravimetric Analysis (TGA)

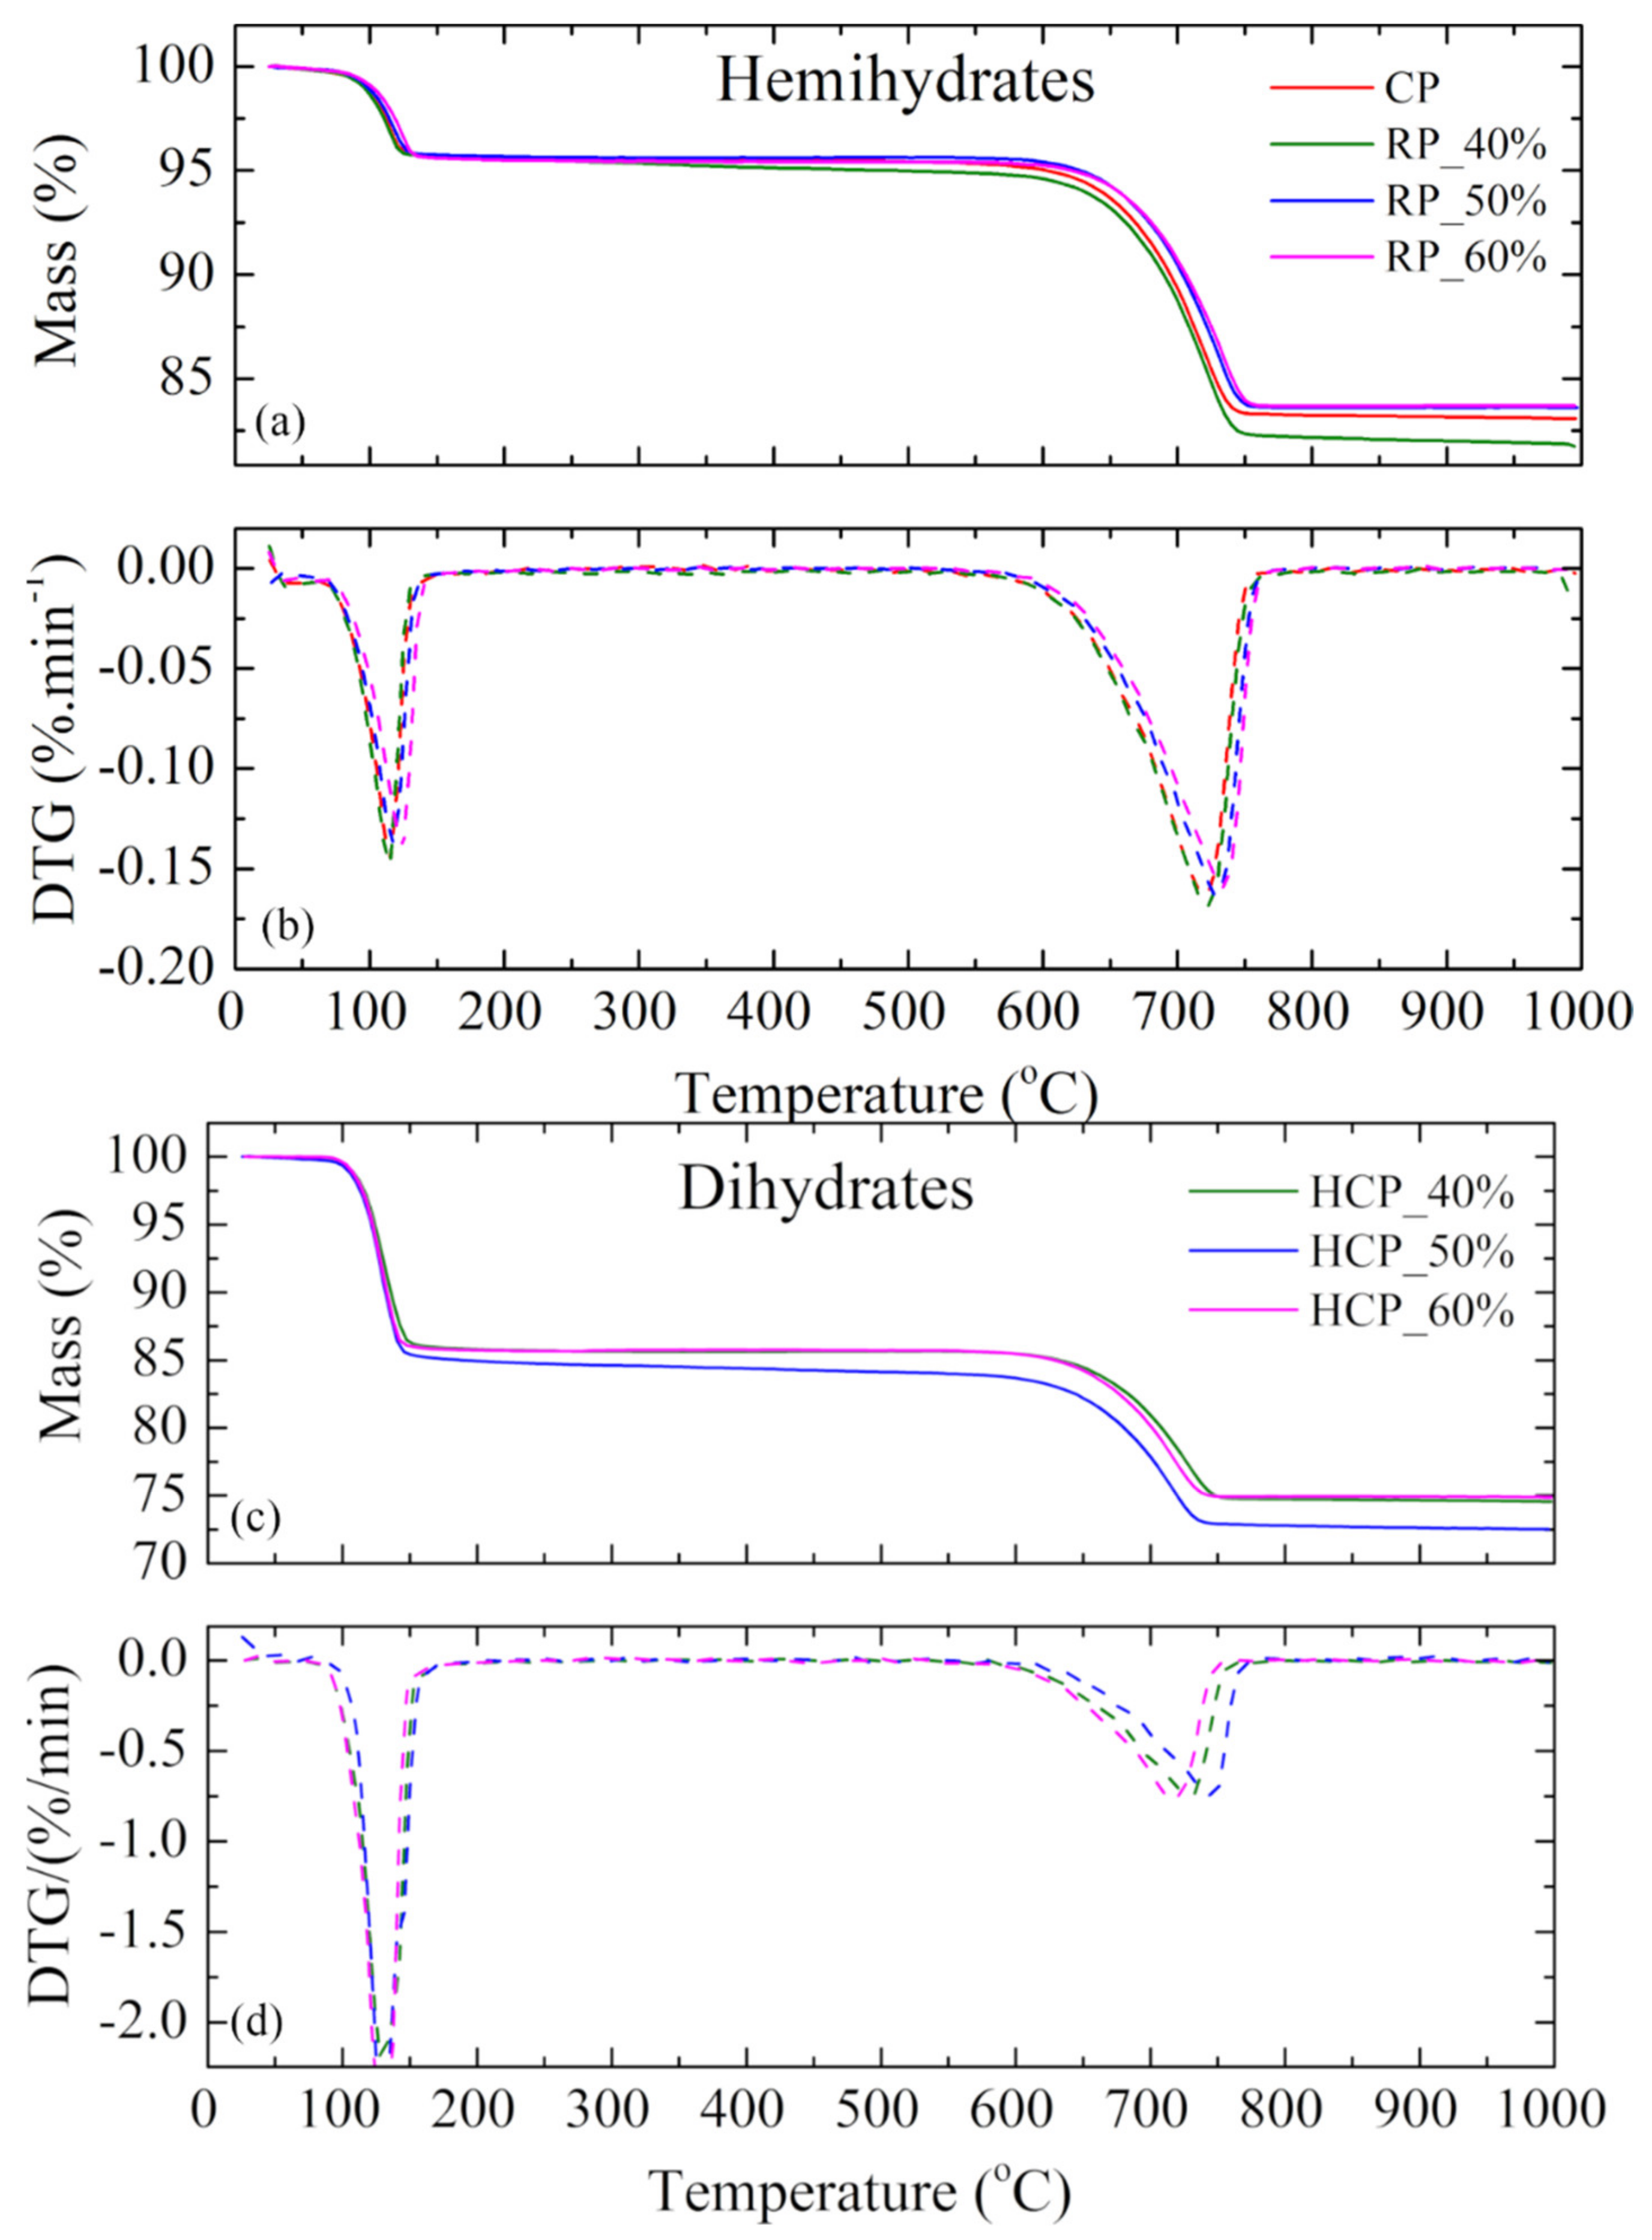
As shown in Figure 13a,b, the hemihydrate samples (commercial and recycled plasters) are similar for all TGA curves, although a nonlinear behavior in relation to the reaction temperature is observed. The first peak registered in TGA occurred between 114 and 118 °C with a mass loss of 5%, showing that the hemihydrate reaction temperature was practically constant for all the samples. The second peak, which stands for the dolomite decomposition, occurred between 688 and 714 °C with a mass loss of 10%. As shown in Figure 13c,d, the behavior of the dihydrate samples was also similar for the TGA tests. The first peak observed in TGA occurred at approximately 130 °C with a mass loss of 15%, and the second peak at 690 °C with a mass loss of 9%. The mass loss registered in the calcination of gypsum (16%) to generate the recycled plaster was consistent with that observed in the first peak of the TGA tests (15%).
Each of the contents of the compounds was estimated following the methodology proposed by Dweck and Lasota [12]; the mass loss was correlated with the chemical reaction occurring in dehydration or decomposition. Thus, it is possible to calculate the contents of dihydrate ( D = Δ M 1 / 0.2093 ), hemihydrate ( H = Δ M 2 0.062 · D / 0.062 ), dolomite ( D o l o m i t e = Δ M 3 / 0.477 ), and anhydrite ( A = 100 D + H + D o l o m i t e ). As the thermogravimetric tests were conducted with an opened pan, it was impossible to observe different peaks in dihydrate and hemihydrate reactions [52]. Thus, it was considered that both the commercial sample and the calcined gypsum only presented hemihydrate in their composition, while the hydrated samples showed only the dihydrate phase. Thus, the second peak corresponded to the reaction of the dolomite.

3.9. Comparison between TGA and XRPD

Since the composition of the studied plasters was determined by TGA and XRPD analyses, it is interesting to compare the results shown in Table 4. The XRPD results are presented with the estimated standard deviations (esds) between parentheses. For the TGA results, it was not possible to calculate the esds since only one data collection was carried out for each sample.
The CP sample had a high content of inert materials (more than 30%), 2/3 of them corresponding to the presence of dolomite, an amount much higher than the 2% impurity content found by Peres et al. [53]. As the recycled and hydrated samples were obtained from the commercial material, the dolomite values followed the same order of magnitude, as expected.
Among the plasters in hemihydrate form, the anhydrite levels tended to decrease as the water content in the sample preparation increased, showing that the hydration was more efficient when 60% of water was used in the paste preparation. Consequently, the hemihydrate content tended to increase with increasing water ratio.
CP was the sample that showed the lowest bassanite content variation (2.1%) between the two techniques (TGA and XRPD). The recycled samples presented higher variation in bassanite contents between the techniques: 4.6% for RP_40%, 5.3% for RP_50%, and 7.1% for RP_60%, but the values were consistent for the same technique. However, when analyzing the total sulfate content, where the values of bassanite and anhydrite were added, the difference between the techniques was reduced since, in TGA, it was not possible to determine the anhydrite content. When analyzing the results obtained with the TGA and XRPD techniques, the bassanite content slightly increased after recycling, as the anhydrite content was reduced with the increase in water amount (4.1% for CP, 3.1% for RP_40%, 1.9% for RP_50%, and 1.7% for RP_60%), indicating adequate material hydration.
For the hydrated samples (HCP_40%, HCP_50%, and HCP_60%), the gypsum content was almost constant among the techniques, except for the HCP_40% sample, with a difference of 6.5%. These samples also presented a residual bassanite content only identified by the XRPD technique, which reduced with the increase of water ratio, confirming the previous assumption that the amount of water was not sufficient for the total hydration of the commercial plaster. The anhydrite content did not vary among the hydrated samples for XRPD. However, the total value of the calcium sulfate compounds showed low variation among the techniques only between the samples, as observed for the gypsum phase.
The dolomite content, which varied from 18.2% to 26.0%, presented low variation for all the samples (for TGA and XRPD); however, it presented differences between the techniques, as observed by the carbonate values phasesTGA–carbonate phasesXRPD in Table 3. One of the main reasons was the presence of calcite detected by the XRPD analyses, which was not detected in the TGA curves, where only the presence of dolomite as carbonate was assumed for calculation purposes. However, the minority phases (calcite, olivine, and quartz) identified by XRPD showed small variations among the samples, which can be absorbed by the refinement errors.
The sum of the differences between the sulfate content (sulfate phasesTGA–sulfate phasesXRPD) and the carbonate content (carbonate phasesTGA—carbonate phasesXRPD) for the two techniques was practically equal to the number of impurities determined in TGA. This difference may be because only the presences of hemihydrate and dolomite were considered in the TGA analyses, whereas anhydrite, calcite, olivine, and quartz were detected in the XRPD data.
Chandara et al. [14] performed thermogravimetric tests to quantify the compounds present in two gypsum samples in the form of dihydrate—one natural and one wasted from ceramic molds—and XRD tests for phase identification. They found 91.28% of dihydrate, 1.61% of hemihydrate, 4.32% of anhydrite, and 2.79% of impurities in natural gypsum and 80.90% of dihydrate, 12.45% of hemihydrate, 4.34% of anhydrite, and 2.30% of impurities in wasted gypsum. These contents are very different from those found in this paper, representing 30% of dolomite. Probably, this difference arises from the quality of the pristine material.
The presence of bassanite was only identified by the XRPD technique, and content decreased with increased water quantity, indicating improved material hydration. The anhydrite content did not vary among the samples for XRPD. However, the calcium sulfate compounds’ total value showed low variation among the techniques only among the samples, as observed for the gypsum.

4. Conclusions

After the recycling process, the plaster became finer and less compact, generating consequences such as a decrease in setting time and compressive strength, besides presenting less workability.
The QPA results determined by the Rietveld refinements were consistent with those obtained by the mass losses analyzed in the TGA tests for the commercial plaster and the hydrated samples, especially in the gypsum and dolomite phases. The calcined gypsum presented different amounts of hemihydrate for each technique. The amount of bassanite, the main compound of commercial plaster, did not change after recycling, justifying its viability, which is related to the efficiency of the chemical reversibility of the process. An unexpected finding was the high concentration of impurities in the commercial gypsum acquired, around 20% of dolomite and 10% of other materials, which may influence the recycling process.
In addition to the phases identified by thermogravimetric analysis (dihydrate—gypsum, hemihydrate—bassanite, and dolomite), XRPD revealed a complete characterization by the identification and quantification of other phases present in the material, such as anhydrite, calcite, olivine, and quartz.
The amount of water used in the production of pastes influenced the hydration of the material since, with more water, part of anhydrite was hydrated, and the recycled plaster showed higher hemihydrate levels than the commercial sample.

Author Contributions

Conceptualization, H.C.F.C., M.S.F. and F.F.F.; methodology, H.C.F.C., M.S.F. and F.F.F.; formal analysis, H.C.F.C.; investigation, H.C.F.C.; resources, H.C.F.C. and F.F.F.; data curation, H.C.F.C., M.S.F. and F.F.F.; writing—original draft preparation, H.C.F.C. and M.S.F.; writing—review and editing, H.C.F.C. and F.F.F.; visualization, F.F.F.; supervision, F.F.F.; project administration, F.F.F.; funding acquisition, F.F.F. All authors have read and agreed to the published version of the manuscript.

Funding

This research was funded by CNPq, grant number 305601/2019-9. We also acknowledge the Instituto Mauá de Tecnologia (IMT), the Laboratory of Crystallography and Structural Characterization of Materials (LCCEM) of the Federal University of ABC (UFABC), and the Laboratory of Microstructure and Eco-efficiency of Materials (LME) for their facilities.

Data Availability Statement

The data presented in this study are available on request from the corresponding author.

Conflicts of Interest

The authors declare no conflict of interest.

References

  1. Pinheiro, S.M.M.; Camarini, G. Characteristics of Gypsum Recycling in Different Cycles. Int. J. Eng. Technol. 2015, 7, 215–218. [Google Scholar] [CrossRef] [Green Version]
  2. Pedreño-Rojas, M.A.; De Brito, J.; Flores-Colen, I.; Pereira, M.F.C.; Rubio-de-Hita, P. Influence of gypsum wastes on the workability of plasters: Heating process and microstructural analysis. J. Build. Eng. 2020, 29, 101143. [Google Scholar] [CrossRef]
  3. Camarini, G.; Pimentel, L.L.; De Sá, N.H.R. Assessment of the material loss in walls renderings with β-hemihydrate paste. Appl. Mech. Mater. 2011, 71–78, 1242–1245. [Google Scholar] [CrossRef]
  4. Cañadas, E.M.; Ballesteros, M.; Foronda, A.; Navarro, F.B.; Jiménez, M.N.; Lorite, J. Enhancing seedling production of native species to restore gypsum habitats. J. Environ. Manag. 2015, 163, 109–114. [Google Scholar] [CrossRef] [PubMed] [Green Version]
  5. Ahmed, A.; Ugai, K.; Kamei, T. Investigation of recycled gypsum in conjunction with waste plastic trays for ground improvement. Constr. Build. Mater. 2011, 25, 208–217. [Google Scholar] [CrossRef]
  6. Resolução n 431, de 24 de Maio de 2011; Ministério do Meio Ambiente: Brasília, Brazil, 2011; p. 2.
  7. Resolução n 307, de 05 de Julho de 2002; Ministério do Meio Ambiente: Brasília, Brazil, 2002; pp. 95–96.
  8. Cordon, H.C.F.; Cagnoni, F.C.; Ferreira, F.F. Comparison of physical and mechanical properties of civil construction plaster and recycled waste gypsum from São Paulo, Brazil. J. Build. Eng. 2019, 22, 504–512. [Google Scholar] [CrossRef]
  9. Geraldo, R.H.; Souza, J.D.; Campos, S.C.; Fernandes, L.F.R.; Camarini, G. Pressured recycled gypsum plaster and wastes: Characteristics of eco-friendly building components. Constr. Build. Mater. 2018, 191, 136–144. [Google Scholar] [CrossRef]
  10. Kuryatnyk, T.; Chabannet, M.; Ambroise, J.; Pera, J. Improvement of calcium sulfate water resistance by addition of calcium sulphoaluminate clinker. Mater. Lett. 2008, 62, 21–22. [Google Scholar] [CrossRef]
  11. Camarini, G.; Pinheiro, S.M.M.; Tannous, K. Thermal analysis of recycled gypsum from construction and demolition waste. Appl. Mech. Mater. 2012, 260–261, 977–980. [Google Scholar] [CrossRef]
  12. Dweck, J.; Lasota, E.I.P. Quality control of commercial plasters by thermogravimetry. Thermochim. Acta 1998, 318, 137–142. [Google Scholar] [CrossRef]
  13. Ghazi Wakili, K.; Koebel, M.; Kaufmann, J.; Derluyn, H.; Hofer, M.; Glaettli, T.; Modregger, P. Thermal conductivity of gypsum plasterboard beyond dehydration and its correlation with the pore structure. In Proceedings of the 9th International Conference on Heat Transfer, Fluid Mechanics and Thermodynamics, St Julian’s, Malta, 16–18 July 2012; pp. 892–895. [Google Scholar]
  14. Chandara, C.; Azizli, K.A.M.; Ahmad, Z.A.; Sakai, E. Use of waste gypsum to replace natural gypsum as set retarders in portland cement. Waste Manag. 2009, 29, 1675–1679. [Google Scholar] [CrossRef] [PubMed]
  15. Geraldo, R.H.; Pinheiro, S.M.; Silva, J.S.; Andrade, H.M.; Dweck, J.; Gonçalves, J.P.; Camarini, G. Gypsum plaster waste recycling: A potential environmental and industrial solution. J. Clean. Prod. 2017, 164, 288–300. [Google Scholar] [CrossRef]
  16. Flores Medina, N.; Hernández-Olivares, F.; Arroyo, X.; Aguilera, A.; Fernandez, F. Characterization of a more sustainable cement produced with recycled drywall and plasterboards as set retarders. Constr. Build. Mater. 2016, 124, 982–991. [Google Scholar] [CrossRef]
  17. Rietveld, H.M. Line profiles of neutron powder-diffraction peaks for structure refinement. Acta Crystallogr. 1967, 22, 151–152. [Google Scholar] [CrossRef]
  18. Rietveld, H.M. A profile refinement method for nuclear and magnetic structures. J. Appl. Crystallogr. 1969, 2, 65–71. [Google Scholar] [CrossRef]
  19. Scarlett, N.V.Y.; Madsen, I.C.; Manias, C.; Retallack, D. On-line X-ray diffraction for quantitative phase analysis: Application in the Portland cement industry. Powder Differ. 2001, 16, 71–80. [Google Scholar] [CrossRef]
  20. De la Torre, A.G.; Aranda, M.A.G.; De Torre, A.G.; Aranda, M.A.G. Accuracy in Rietveld quantitative phase analysis of Portland cements. J. Appl. Crystallogr. 2003, 36, 1169–1176. [Google Scholar] [CrossRef]
  21. Scrivener, K.L.; Füllmann, T.; Gallucci, E.; Walenta, G.; Bermejo, E. Quantitative study of Portland cement hydration by X-ray diffraction/Rietveld analysis and independent methods. Cem. Concr. Res. 2004, 34, 1541–1547. [Google Scholar] [CrossRef]
  22. Pinheiro, S.M.M. Gesso Reciclado: Avaliação de Propriedades Para uso em Componentes; Universidade Estadual de Campinas: Campinas, Brazil, 2011. [Google Scholar]
  23. Barbosa, A.A.; Ferraz, A.V.; Santos, G.A.; Juazeiro, C. Caracterização química, mecânica e morfológica do gesso β obtido do pólo do Araripe. Cerâmica 2014, 60, 501–508. [Google Scholar] [CrossRef] [Green Version]
  24. Lanzón, M.; García-Ruiz, P.A. Effect of citric acid on setting inhibition and mechanical properties of gypsum building plasters. Constr. Build. Mater. 2012, 28, 506–511. [Google Scholar] [CrossRef]
  25. Seufert, S.; Hesse, C.; Neubauer, J. Quantitative determination of anhydrite III from dehydrated gypsum by XRD. Cem. Concr. Res. 2009, 39, 936–941. [Google Scholar] [CrossRef]
  26. Bezou, C.; Nonat, A.; Mutin, J.-C.; Christensen, A.N.; Lehmann, M.S. Investigation of the Crystal Structure of γ-CaSO4, CaSO4·0.5 H2O, and CaSO4·0.6H2O by Powder Diffraction Methods. J. Solid State Chem. 1995, 117, 165–176. [Google Scholar] [CrossRef]
  27. ABNT—Associação Brasileira de Normas Técnicas. ABNT NBR 12128—Gesso Para Construção Civil—Determinação das Propriedades Físicas da Pasta de Gesso; ABNT: Rio de Janeiro, Brazil, 2017; p. 5. [Google Scholar]
  28. ABNT—Associação Brasileira de Normas Técnicas. ABNT NBR 12127—Gesso Para Construção Civil—Determinação das Propriedades Físicas do pó; ABNT: Rio de Janeiro, Brazil, 2017; p. 6. [Google Scholar]
  29. ABNT—Associação Brasileira de Normas Técnicas. ABNT NBR NM 23:2000—Cimento Portland e Outros Materiais em pó—Determinação da Massa Específica; ABNT: Rio de Janeiro, Brazil, 2015; p. 11. [Google Scholar]
  30. Hunger, M.; Brouwers, H.J.H. Flow analysis of water-powder mixtures: Application to specific surface area and shape factor. Cem. Concr. Compos. 2009, 31, 39–59. [Google Scholar] [CrossRef]
  31. Mantellato, S.; Palacios, M.; Flatt, R.J. Reliable specific surface area measurements on anhydrous cements. Cem. Concr. Res. 2015, 67, 286–291. [Google Scholar] [CrossRef]
  32. ABNT—Associação Brasileira de Normas Técnicas. ABNT NBR 12129—Gesso Para Construção Civil—Determinação das Propriedades Mecânicas; ABNT: Rio de Janeiro, Brazil, 2017; p. 6. [Google Scholar]
  33. De Oliveira, I.R.; Studart, A.R.; Pileggi, R.G.; Pandolfelli, V.C. Dispersão e Empacotamento de Partículas—Princípios e Aplicações em Processamento Cerâmico, 18th ed.; Fazendo Arte Editorial: São Paulo, Brazil, 2000. [Google Scholar]
  34. Brunauer, S.; Emmett, P.H.; Teller, E. Adsorption of Gases in Multimolecular Layers. J. Am. Chem. Soc. 1938, 60, 309–319. [Google Scholar] [CrossRef]
  35. Lewry, A.J.; Williamson, J. The setting of gypsum plaster—Part I The hydration of calcium sulphate hemihydrate. J. Mater. Sci. 1994, 29, 5279–5284. [Google Scholar] [CrossRef]
  36. Camarini, G.; De Milito, J.A. Gypsum hemihydrate-cement blends to improve renderings durability. Constr. Build. Mater. 2011, 25, 4121–4125. [Google Scholar] [CrossRef]
  37. ABNT—Associação Brasileira de Normas Técnicas. ABNT NBR 13207—Gesso Para Construção Civil—Requisitos; ABNT: Rio de Janeiro, Brazil, 2017; p. 3. [Google Scholar]
  38. Altomare, A.; Corriero, N.; Cuocci, C.; Falcicchio, A.; Moliterni, A.; Rizzi, R. QUALX2.0: A qualitative phase analysis software using the freely available database POW_COD. J. Appl. Crystallogr. 2015, 48, 598–603. [Google Scholar] [CrossRef]
  39. Gražulis, S.; Daškevič, A.; Merkys, A.; Chateigner, D.; Lutterotti, L.; Quiros, M.; Serebryanaya, N.R.; Moeck, P.; Downs, R.T.; Le Bail, A. Crystallography Open Database (COD): An open-access collection of crystal structures and platform for world-wide collaboration. Nucleic Acids Res. 2012, 40, D420–D427. [Google Scholar] [CrossRef]
  40. Comodi, P.; Nazzareni, S.; Zanazzi, P.F.; Speziale, S. High-pressure behavior of gypsum: A single-crystal X-ray study. Am. Miner. 2008, 93, 1530–1537. [Google Scholar] [CrossRef]
  41. Schmidt, H.; Paschke, I.; Freyer, D.; Voigt, W. Water channel structure of bassanite at high air humidity: Crystal structure of CaSO4·0.625H2O. Acta Crystallogr. Sect. B Struct. Sci. 2011, 67, 467–475. [Google Scholar] [CrossRef]
  42. Höhne, E. A more accurate determination of the crystal structure of anhydrite, CaSO4. Sov. Phys. Crystallogr. 1963, 7, 559–569. [Google Scholar]
  43. Antao, S.; Hassan, I. Temperature dependence of the structural parameters in the transformation of aragonite to calcite, as determined from in situ synchrotron powder X-ray diffraction data. Can. Mineral. 2010, 48, 1225–1236. [Google Scholar] [CrossRef] [Green Version]
  44. Antao, S.M.; Mulder, W.H.; Hassan, I.; Crichton, W.A.; Parise, J.B. Cation disorder in dolomite, CaMg(CO3)2, and its influence on the aragonite + magnesite ⟷ dolomite reaction boundary. Am. Mineral. 2004, 89, 1142–1147. [Google Scholar] [CrossRef]
  45. Müller-Sommer, M.; Hock, R.; Kirfel, A. Rietveld refinement study of the cation distribution in (Co, Mg)-olivine solid solution. Phys. Chem. Miner. 1997, 24, 17–23. [Google Scholar] [CrossRef]
  46. Le Page, Y.; Donnay, G. Refinement of the crystal structure of low-quartz. Acta Crystallogr. Sect. B 1976, 32, 2456–2459. [Google Scholar] [CrossRef]
  47. Bish, D.L.; Howard, S.A. Quantitative phase analysis using the Rietveld method. J. Appl. Crystallogr. 1988, 21, 86–91. [Google Scholar] [CrossRef]
  48. Coelho, A.A. TOPAS and TOPAS-Academic: An optimization program integrating computer algebra and crystallographic objects written in C++. J. Appl. Crystallogr. 2018, 51, 210–218. [Google Scholar] [CrossRef] [Green Version]
  49. Järvinen, M.; Jarvinen, M. Application of symmetrized harmonics expansion to correction of the preferred orientation effect. J. Appl. Crystallogr. 1993, 26, 525–531. [Google Scholar] [CrossRef]
  50. Boisvert, J.P.; Domenech, M.; Foissy, A.; Persello, J.; Mutin, J.C. Hydration of calcium sulfate hemihydrate (CaSO4·12H2O) into gypsum (CaSO4·2H2O). The influence of the sodium poly(acrylate)/surface interaction and molecular weight. J. Cryst. Growth 2000, 220, 579–591. [Google Scholar] [CrossRef]
  51. Pundir, A.; Garg, M.; Singh, R. Evaluation of properties of gypsum plaster-superplasticizer blends of improved performance. J. Build. Eng. 2015, 4, 223–230. [Google Scholar] [CrossRef]
  52. Borrachero, J.; Payá, M.; Bonilla, J.; Monzó, M. The use of thermogravimetric analysis technique for the characterization of construction materials: The gypsum case. J. Therm. Anal. Calorim. 2008, 91, 503–509. [Google Scholar] [CrossRef]
  53. Peres, L.; Benachour, M.; Santos, V.A. O Gesso—Produção e Utilização na Construção Civil; Bagaço: Recife, Brazil, 2001. [Google Scholar]
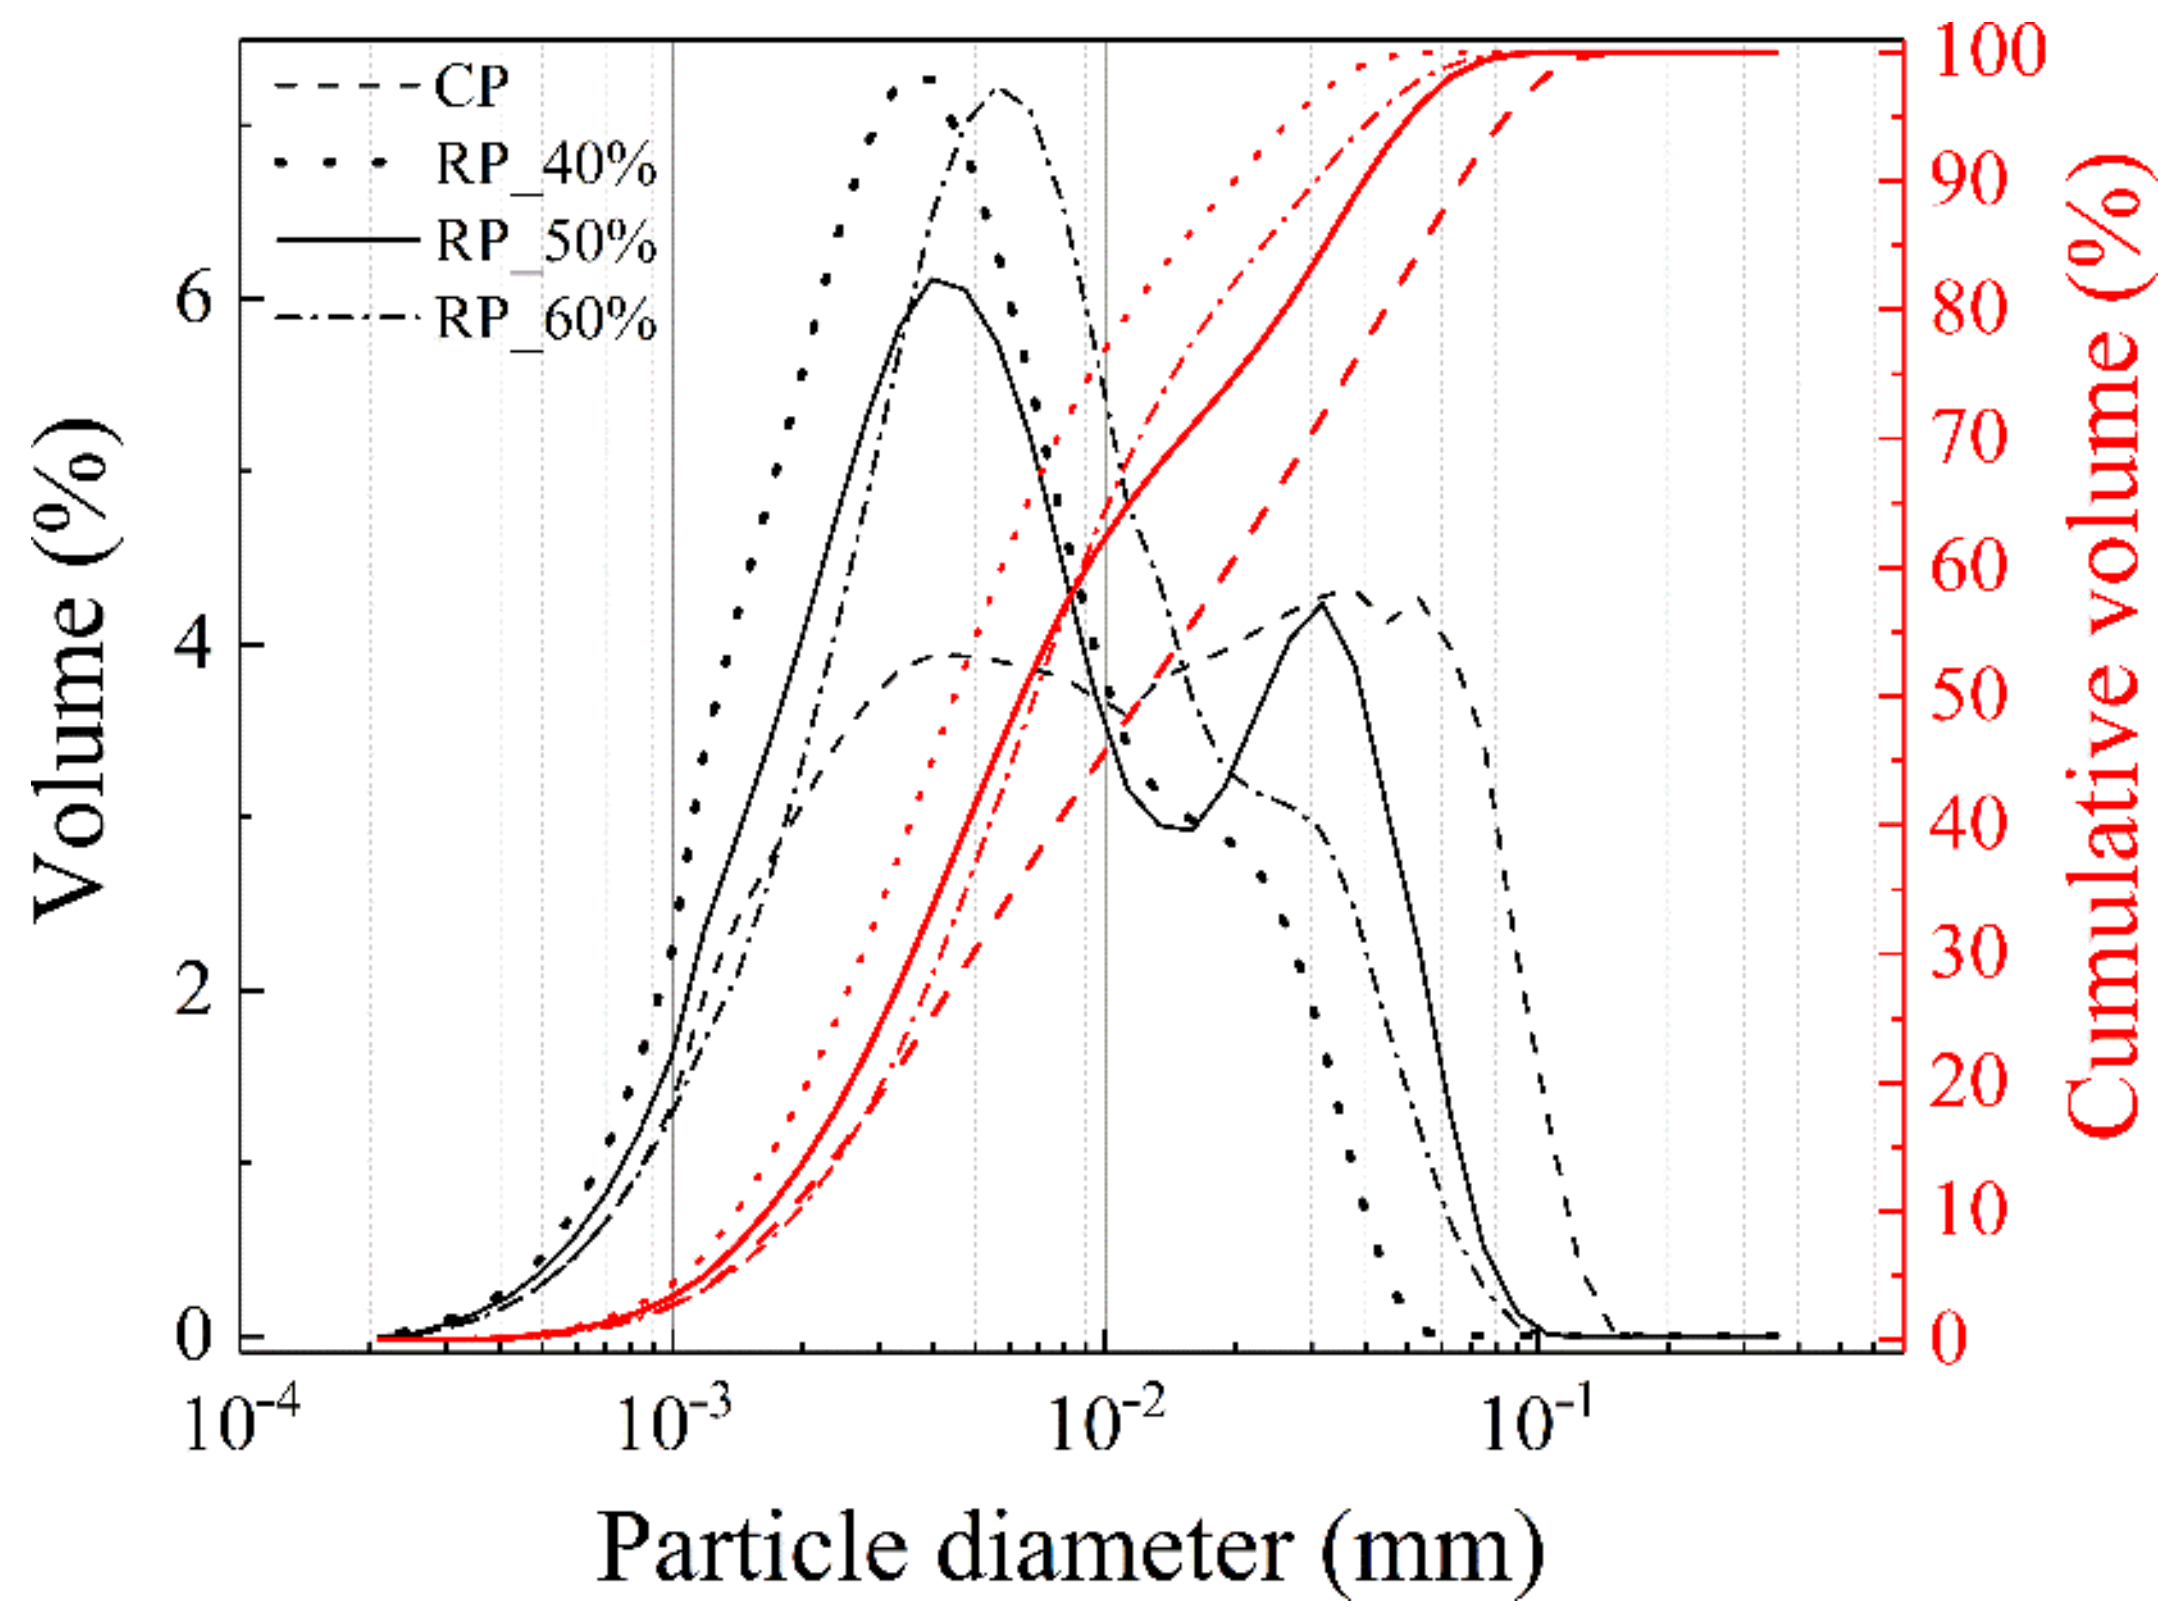
Figure 1. Particle size distribution of hemihydrate samples (commercial and recycled).
Constrmater 01 00008 g001
Figure 2. Setting time of commercial and recycled plaster samples (start setting time—vertical stripes, final setting time—diagonal stripes, and interval—red squares).
Constrmater 01 00008 g002
Figure 3. Compressive strength of the plaster: the bars with vertical stripes represent the results of the commercial plaster, the bars with diagonal stripes the results of the recycled materials, and the red squares indicate the strength loss after recycling (red axis on the right).
Constrmater 01 00008 g003
Figure 4. SEM images of the commercial and recycled samples (w/g ratio of 60%) in the hardened state (HCP_60% on the left and HRP_60% on the right): (a) and (b), 10,000 times magnification; (c) and (d), 60,000 times magnification.
Constrmater 01 00008 g004
Figure 5. SEM images of the hardened plaster HCP_60% (a) and EDS diagram (b).
Constrmater 01 00008 g005
Figure 6. Rietveld plot for the hemihydrate sample CP. The open circles represent the observed data, the red line represents the calculated pattern, and the blue line is the difference between the calculated and observed data. The vertical bars represent the positions of the peaks of each phase present in the sample.
Constrmater 01 00008 g006
Figure 7. Rietveld plot for the hemihydrate sample RP_40%. The open circles represent the observed data, the red line represents the calculated pattern, and the blue line is the difference between the calculated and observed data. The vertical bars represent the positions of the peaks of each phase present in the sample.
Constrmater 01 00008 g007
Figure 8. Rietveld plot for the hemihydrate sample RP_50%. The open circles represent the observed data, the red line represents the calculated pattern, and the blue line is the difference between the calculated and observed data. The vertical bars represent the positions of the peaks of each phase present in the sample.
Constrmater 01 00008 g008
Figure 9. Rietveld plot for the hemihydrate sample RP_60%. The open circles represent the observed data, the red line represents the calculated pattern, and the blue line is the difference between the calculated and observed data. The vertical bars represent the positions of the peaks of each phase present in the sample.
Constrmater 01 00008 g009
Figure 10. Rietveld plot for the dihydrate sample HCP_40%. The open circles represent the observed data, the red line represents the calculated pattern, and the blue line is the difference between the calculated and observed data. The vertical bars represent the positions of the peaks of each phase present in the sample.
Constrmater 01 00008 g010
Figure 11. Rietveld plot for the dihydrate sample HCP_50%. The open circles represent the observed data, the red line represents the calculated pattern, and the blue line is the difference between the calculated and observed data. The vertical bars represent the positions of the peaks of each phase present in the sample.
Constrmater 01 00008 g011
Figure 12. Rietveld plot for the dihydrate sample HCP_60%. The open circles represent the observed data, the red line represents the calculated pattern, and the blue line is the difference between the calculated and observed data. The vertical bars represent the positions of the peaks of each phase present in the sample.
Constrmater 01 00008 g012
Figure 13. Thermogravimetric analysis for (a,b) the hemihydrate and (c,d) dihydrate samples.
Constrmater 01 00008 g013
Table 1. Bulk density, density, and compactness for hemihydrate samples.
SampleCPRP_40%RP_50%RP_60%
Bulk density (kg·m−3)899 (12)631 (10)561 (3)449 (5)
Density (kg·m−3)2796 (59)2462 (97)2514 (59)2517 (60)
Compactness (%)32.125.622.317.8
Table 2. Results of medium diameter (d50), distribution amplitude (d90–d10), and theoretical volumetric surface area (VSA) of the samples.
Sampled50 (10−3 mm)d10 (10−3 mm)d90 (10−3 mm)d90–d10VSA (m2·cm−3)
CP8.021.7130.6228.911.44
RP_40%3.861.3611.089.722.15
RP_50%5.351.599.317.721.7
RP_60%6.061.8320.1418.311.52
Table 3. Specific surface area of the samples by the BET method.
SampleSpecific Surface Area (m2·g−1)
CP1.79
RP_40%2.2
RP_50%2.04
RP_60%1.9
Table 4. Compound contents in the samples determined by TGA and XRPD.
SamplesCPRP_40%RP_50%RP_60%HCP_40%HCP_50%HCP_60%
Compounds (wt%)TGAXRPDTGAXRPDTGAXRPDTGAXRPDTGAXRPDTGAXRPDTGAXRPD
Gypsum (CaSO4·2H2O)--------68.161.6 (17)74.272.5 (13)72.469.2 (13)
Bassanite (CaSO4·0.5H2O)66.364.2 (14)74.369.7 (17)76.971.6 (19)77.670.5 (18)-3.9 (3)-1.0 (1)-1.0 (1)
Anhydrite (CaSO4)-4.1 (2)-3.1 (2)-1.9 (2)-1.7 (2)-2.4 (2)-2.0 (1)-2.1 (1)
Calcite (CaCO3)-5.1 (3)-4.1 (4)-3.9 (4)-3.8 (4)-5.3 (4)-4.3 (3)-4.8 (3)
Dolomite (MgCaC2O6)22.125.7 (13)19.922.1 (14)21.721.7 (16)22.422.6 (16)22.826.0 (14)18.219.8 (11)19.222.6 (11)
Olivine (Mg2∙SiO4)-0.7 (1)-0.6 (1)-0.6 (2)-1.0 (1)-0.5 (1)-0.3 (1)--
Quartz (SiO2)-0.2 (0)-0.4 (1)-0.3 (0)-0.4 (1)-0.3 (0)-0.1 (0)-0.3 (0)
Impurities11.6-5.8-1.4-0-9.1-7.6-8.4-
Total100100100100100100100100100100100100100100
Sulfate phases66.368.374.372.876.973.577.672.268.167.974.275.572.472.3
Sulfate phasesTGA–sulfate phasesXRPD−21.53.45.40.2−1.30.1
Carbonate phases22.130.819.926.921.725.622.526.422.831.318.224.119.227.4
Carbonate phasesTGA–carbonate phasesXRPD−8.7−7−3.9−3.9−8.5−5.9−8.2
Publisher’s Note: MDPI stays neutral with regard to jurisdictional claims in published maps and institutional affiliations.