Article

Image-Based Quantification of Soil Disturbance in Vane Shear Tests on Reconstituted Kaolinitic Clayey Soil

by
Juan Carlos Ruge
1,
Diego Caballero-Rojas
1,
Fausto Molina-Gómez
2,*,
Renato Pinto da Cunha
3 and
Diego Meléndez-Suarez
1
1
Maestría en Ingeniería Civil, Universidad Militar Nueva Granada, Bogotá 110111, Colombia
2
Department of Structures and Building Physics, Universidad Politécnica de Madrid, 28040 Madrid, Spain
3
Department of Civil and Environmental Engineering, University of Brasilia, Brasilia 70910-900, Brazil
*
Author to whom correspondence should be addressed.
Geotechnics 2025, 5(3), 66; https://doi.org/10.3390/geotechnics5030066
Submission received: 23 July 2025 / Revised: 8 September 2025 / Accepted: 12 September 2025 / Published: 17 September 2025
(This article belongs to the Special Issue Recent Advances in Geotechnical Engineering (3rd Edition))

Abstract

The insertion into the soil stratum to be evaluated is the factor that most affects the results obtained by the vane shear test (VST). According to the literature, it has been identified that there is a disturbance in the fabric and even in the movement of soil particles around the probe. The current study allowed the VST to be carried out on kaolinitic clayey soils reconstituted in the laboratory at different historical preconsolidation artificial stresses. The influence of the disturbance on the alteration of the soil analysed is directly linked to the thickness of the vane blades and their corresponding vane area ratio (VA). For this reason, a digital image correlation (DIC) technique was proposed to analyse images taken during the test’s development. The alteration produced by the disturbance was recorded, and the result obtained was compared with previous studies. This analysis established the effect on the reconstituted samples by employing a disturbance parameter specific to this study.

1. Introduction

The behaviour and characteristics of soils depend on many variables, which can drastically change the results of the laboratory tests customarily used. The vane shear test (VST) indirectly determines the undrained shear strength of cohesive soils. This test is not applicable for sands because they allow drainage during the development of the test, impeding the measurement of undrained shear strength. The undrained shear strength is the resistance when the soil is loaded to failure under undrained conditions [1]. In the VST procedure, inserting the vane, which consists of a probe with four blades, is necessary [2]. These vanes are typically made of steel, and local standards in each country control the dimensions. The vane insertion generates a disturbance in the soil, altering the soil structure (bonds between particles) and displacements within the sample. This disturbance can affect the undrained strength of the soil to some extent [3].
According to Chandler [3], specific physical effects are considered to exist after the vane is inserted. Due to this action, a modification of binding bridges between the particles of the material can be generated. It is presumed that in sensitive clays, the value of the undrained strength of the soil may be reduced, especially in the material surrounding the vane. Likewise, the displacement of the soil and the increase in pore pressure induced by the entry of the external element and the subsequent dissipation of this pressure will result in an increase in the effective stresses of the material at that point. The above characteristics have been studied, and it has been concluded that their effects depend primarily on the sensitivity of the soil. Evidence from the field suggests that these effects are significant when the sensitivity is higher than 15.
Industrial kaolinitic clay was used in the present analysis because the research was conducted under laboratory conditions. This clay mineral was reconstituted in the laboratory to prepare the samples on which the study of vane insertion disturbance caused by the usage of the apparatus was carried out. For the reconstitution process, dry kaolin was used, and then water was added until the moisture corresponding to the liquid limit of the material was reached. At this water content, the clay theoretically reaches a point where it is assumed that the soil loses much of its shear strength and must behave as a fluid. After this stage, the reconstitution process begins [4]. Once the samples were obtained, they were subjected to different consolidation stresses. This procedure allowed for a comparison of the effect of the consolidation using various stresses induced when reconstituting the specimens.
With the reconstituted kaolinite samples placed under different consolidation stresses in the laboratory, three shear vane configurations with varying thicknesses of the blade were designed, verifying the disturbance ratio once each of the vanes was inserted into the samples. The generated disturbance is analysed through the digital photographs taken of the samples once the vanes are inserted, elaborating an image analysis of the phenomenon. Finally, the disturbance ratio can be compared with the deformations produced in the models. The digital image correlation (DIC) method will determine the deformations, a full-field optical technique that measures displacements and deformations. The process consists of taking digital images during the test of a specimen from its initial state (considered the reference state) to its final (deformed) state [5].

2. Background

2.1. Vane Shear Test (VST)

The VST arose from the difficulties encountered by geotechnical engineers in determining the shear strength of very soft and sensitive clays by laboratory testing because of the disturbance caused by their poor quality. The test equipment made it possible to determine the in situ undrained shear strength and sensitivity of soft clay for the first time. The first vane model was designed by John Olsson in 1928 to avoid disturbances associated with the sampling of sensitive marine clays found in Scandinavian countries [6]. This tool soon became a major attraction because of its ability to measure undrained shear strength in the field. However, it was not until 1947 that the Swedish Geotechnical Institute began an extensive study that culminated in 1950 with a comprehensive report called “The Vane Borer” [7], which established a procedure to standardise the test. This procedure was adopted throughout the region and eventually in other parts of the world. Consequently, in 1987, the shear vane test in laboratory conditions was standardised by ASTM in D 4648 [2]. Table 1 shows the various standards governing VST around the world.
The internationally recognised reference standard for the vane shear test (VST) is ASTM D2573 [10]. However, in this study, the standard used for testing activities is INVIAS INV E-170 [11]. In an analysis of the two standards, it was concluded that they coincide in most aspects. Table 1 shows the different parameters considered, both in the probe and in the procedure, to ensure the test’s success. It is recommended that the vane height be 1 to 2.5 times the diameter D, which should be between 35 and 100 mm. The thickness of the vanes can fluctuate between 1.52 and 3.18 mm. At the same time, the vane shaft can have a diameter of 12.5 to 16.5 mm. These dimensions are detailed in Figure 1.

2.2. Soil Disturbance Due to Vane Shear Tests

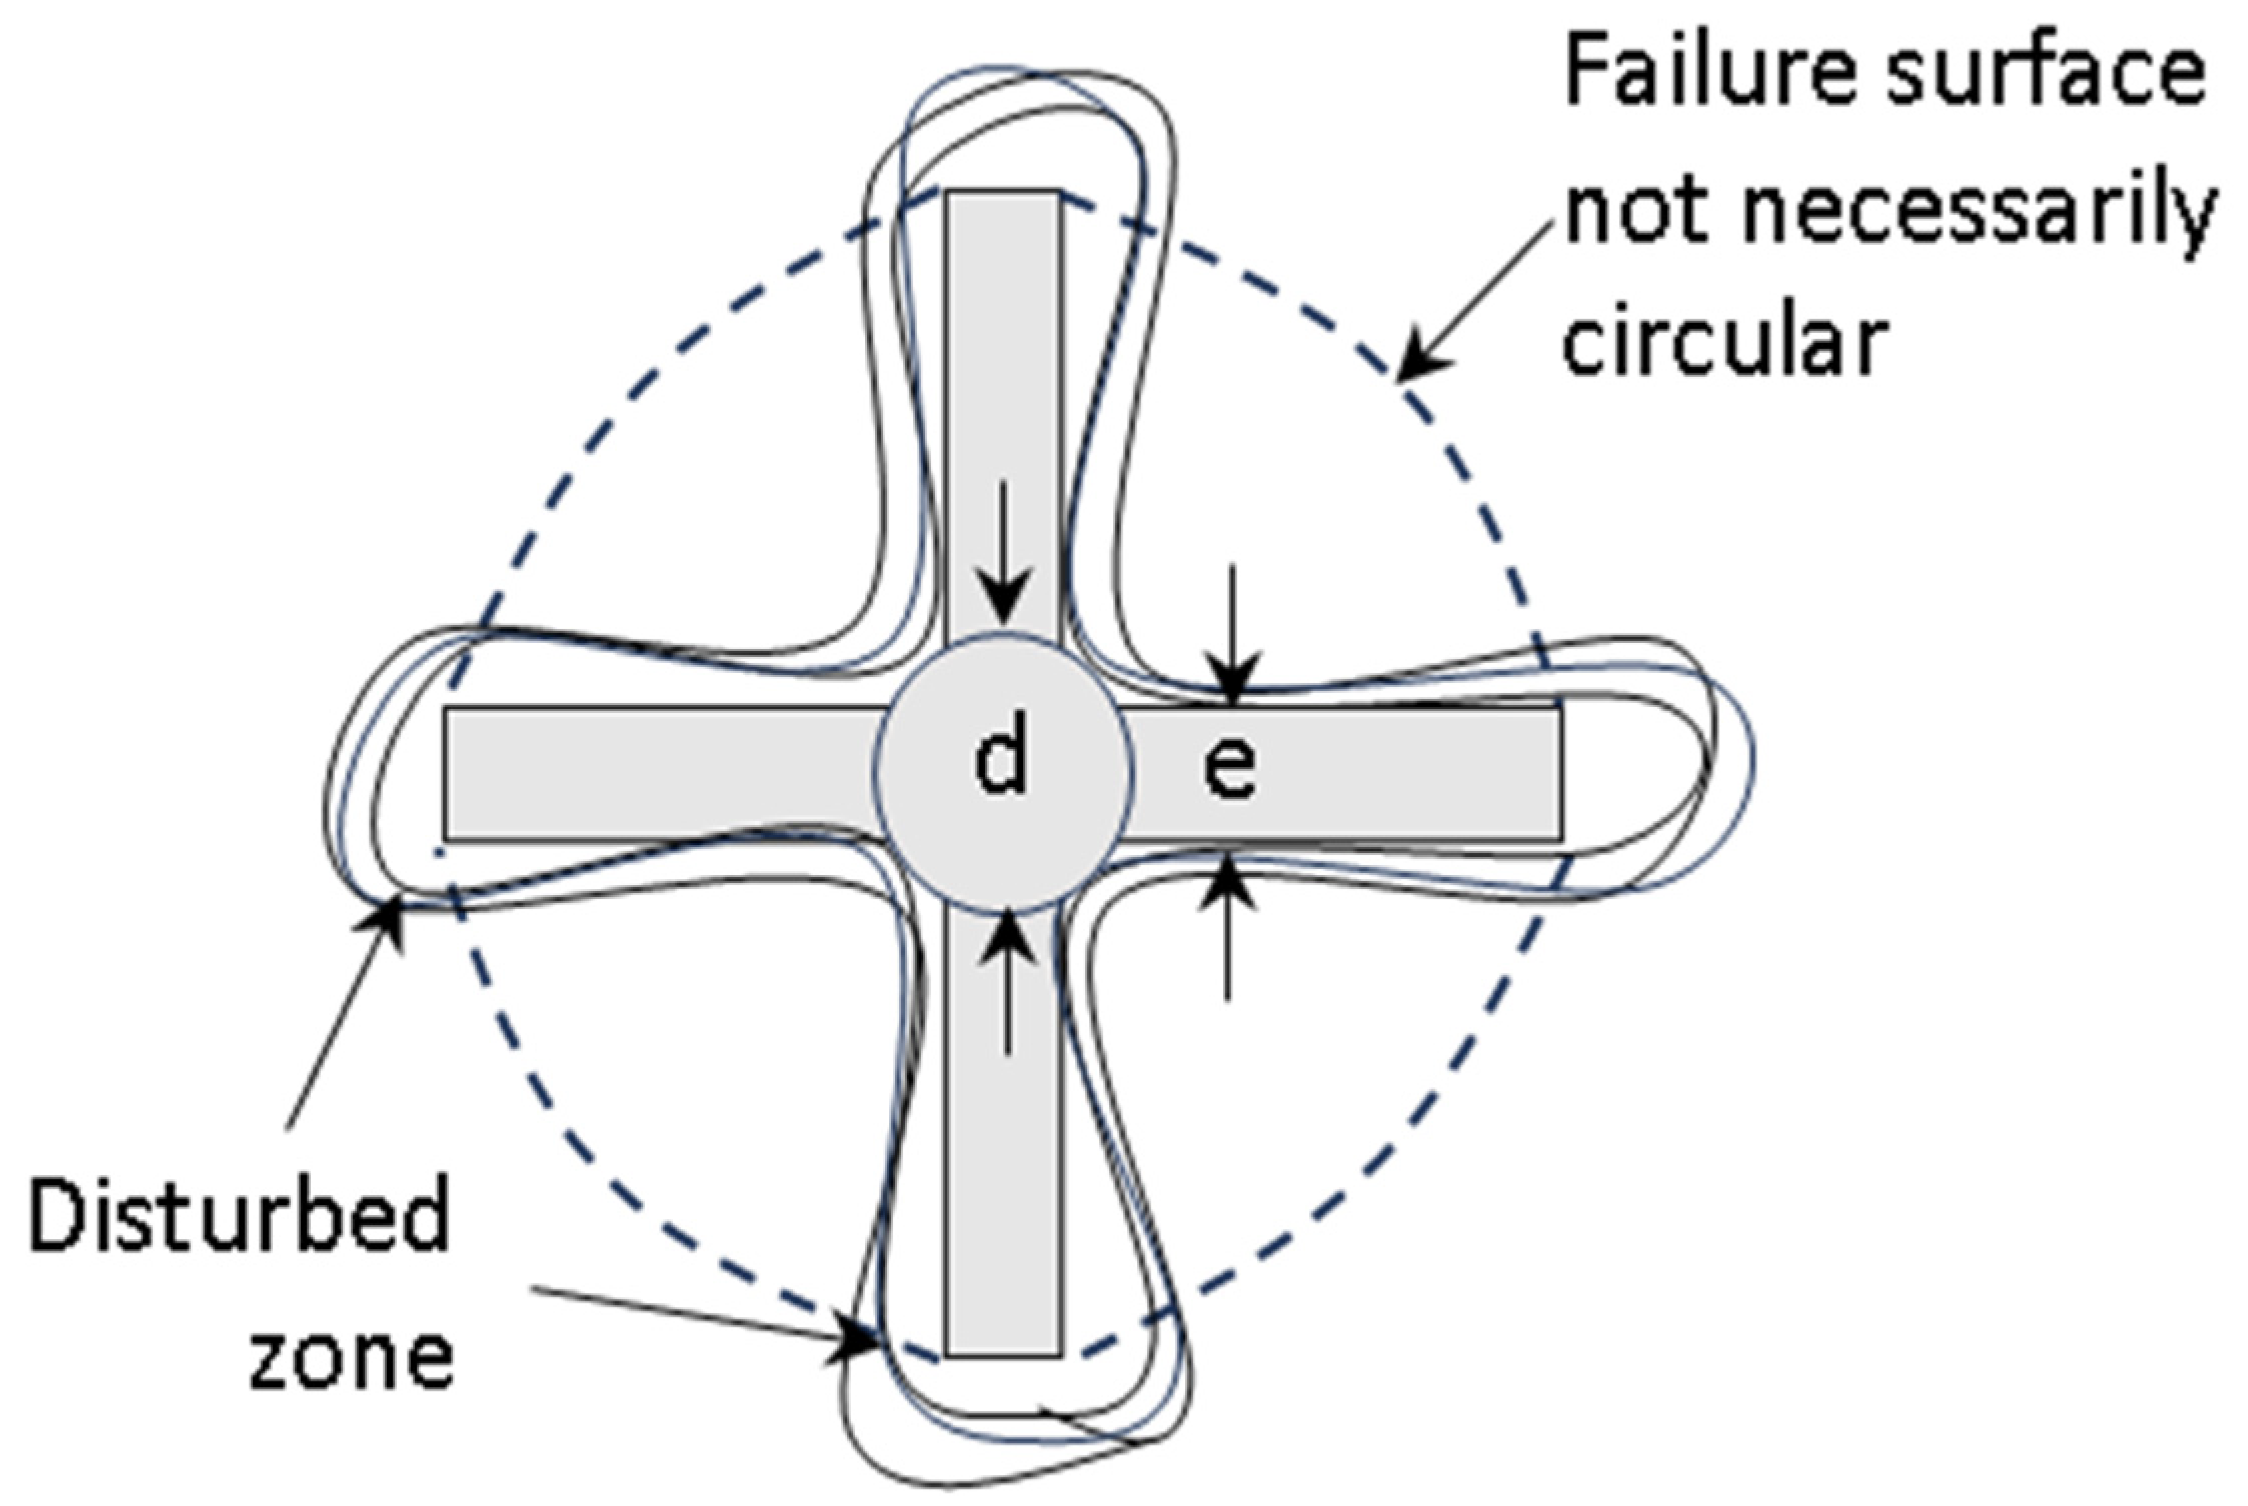
Several proposals on how the material is disturbed when the vane is penetrated have been advanced to date [7,12,13,14,15,16,17,18]. Cadling & Odenstad [7] presented the perimeter ratio concept (Figure 2) as an alternative to the vane area ratio parameter. This variable relates the vane thickness to the perimeter length covering the vane in the test. The authors pointed out that the disturbance ratio around the blades that compose the vane can be evaluated through the following expression.
α = 4e/πD
where α (%) is the perimeter ratio relative to the thickness of the blade (e) on the circumferential edge of the vane cylindrical blades of diameter (D). This parameter will be vital in the current study. It is essential to acknowledge that the disturbance is defined by Equation (2), which expresses its value as a percentage.
VA = (4(R − r)e + πr2)/(πR2)
VA is the vane area ratio, R is the failure cylinder radius, r is the vane shaft radius, and e is the vane blade thickness [10]. VST also suffers from interference when measuring undrained shear strength. The first is the disturbance of the vane, which produces a remoulded zone around the vane blades, resulting from inserting the vane into the specimen. These displacements can be significant and should not exceed 15% of the area ratio of the vane (Figure 2).
Similar studies have suggested that by utilising image analysis, as Chandler [3] did, it is possible to observe some spots around the insertion that may be related to local ground disturbance. In situ investigations have been carried out in contiguous boreholes where vanes with different blade thicknesses were used [14]. It was utimately shown that there is a dependence between the undrained resistance of the material and the parameter alpha, which was already discussed above. As the perimeter ratio increases, the undrained resistance decreases. The authors projected the values up to α = 0 to observe hypothetical values of the undrained resistance related to a theoretical zero perturbation. The analyses determined that sensitivity is an aspect to be anticipated in the disturbance in the vane driving process and, consequently, in the undrained resistance of the soil.
Regarding disturbance by vane insertion, other authors, such as Matsui & Abe [15], proposed an interesting idea by installing pore-pressure measuring cells on the vane blade. Measurements were conducted on both the insertion and rotation of the probe. Pore-pressure increases were partially measured during insertion, gradually dissipating by four hours. Pore pressures were also recorded during vane rotation, which showed very low values, which was not expected by the authors, as described in their study. Other effects include vane rotation rate, stress state at failure, anisotropy in undrained strength, and failure progression. They can also provide a strong dependence on the alteration of the shear vane test. Further details in [6,15,16,19,20,21,22,23,24].
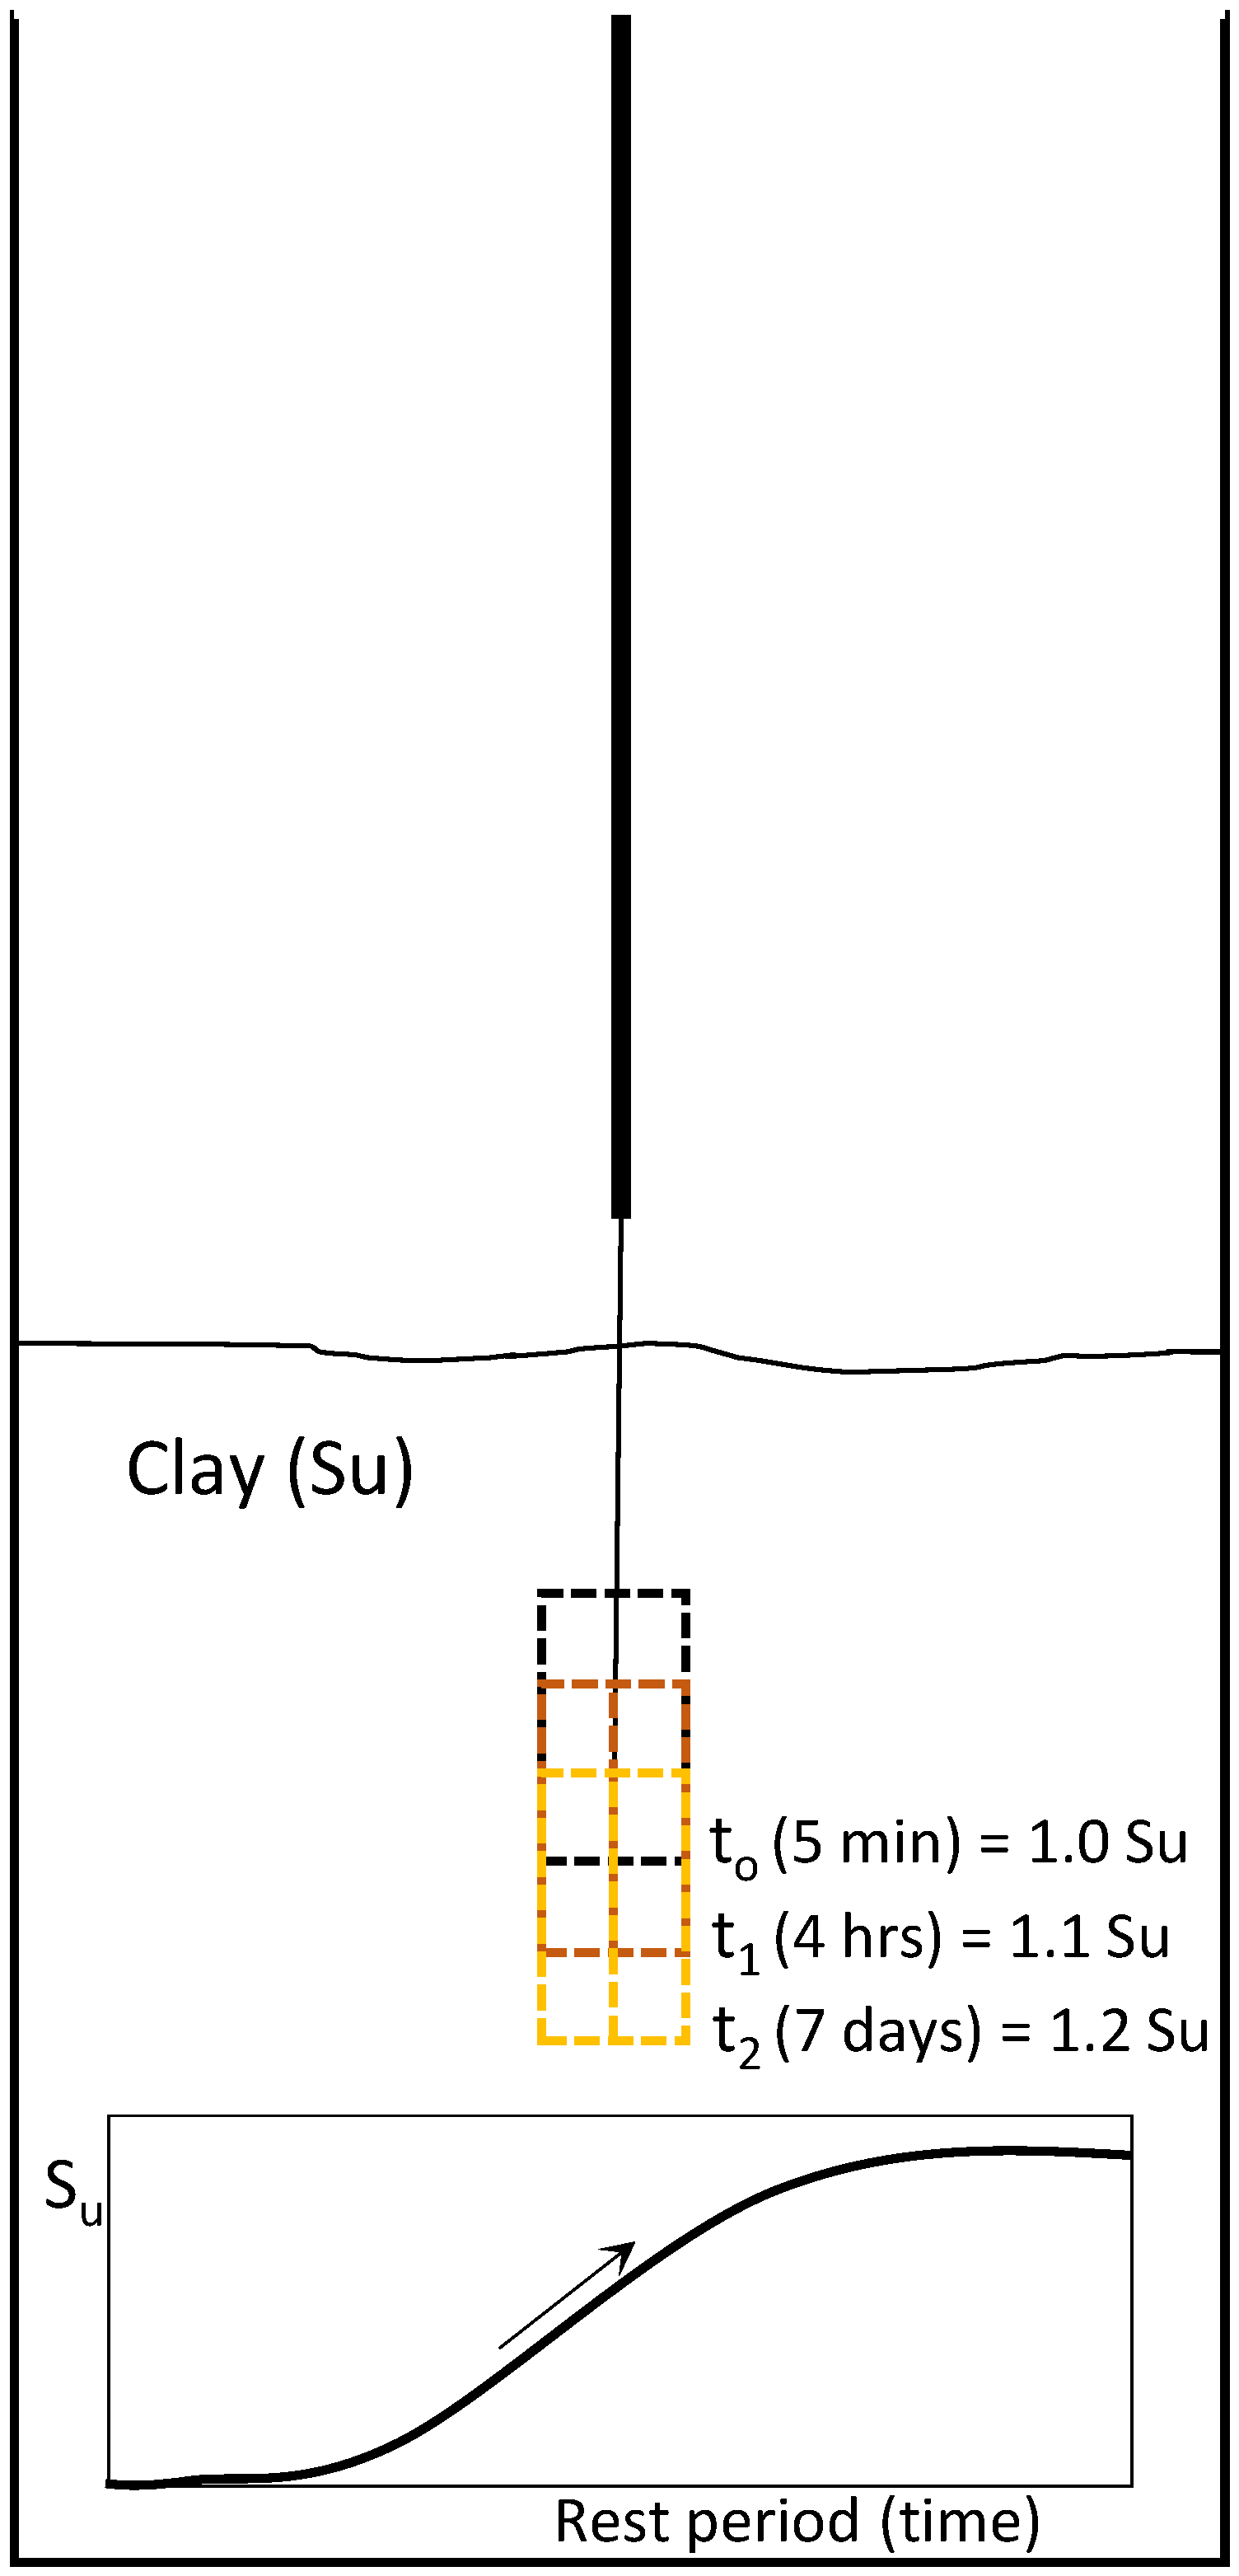
The insertion phenomenon has an influence related to the concept that experts call a pause period, given between the moment of insertion of the vane and the imposition of the torque (max. 5 min, according to most standards). The weight of the pipe scaffolding plus the vane generates a consolidation effect (reduction in pore pressure) in the soil, increasing the undrained strength [13,19]. Due to this aspect, resistance can grow when the pause is extended; tests carried out report increased undrained strength even after a seven-day pause (see Figure 3).
In summary, this study seeks to advance the understanding of the VST (vane shear test) through a comprehensive investigation of the geometric modifications induced in vanes, the application of torque across samples subjected to varying levels of consolidation stress, and the deployment of contemporary imaging techniques to precisely evaluate the extent of soil alteration. It is important to acknowledge that further extensive research is necessary to substantiate the hypothesised relationship between soil alteration and effective stress, akin to observations made in other standardised field tests, such as the Standard Penetration Test (SPT). A preliminary objective of this investigation may involve the development of a corrective parameter that addresses the phenomena examined herein.

3. Materials and Methods

3.1. Tested Soil Descriptions

The material used in the study was laboratory-reconstituted kaolinitic clay. Ruge et al. [25] extensively analysed this same material, where more details on mineralogy and microstructure can be found. Figure 4 shows the soil composition used for the number of minerals found.
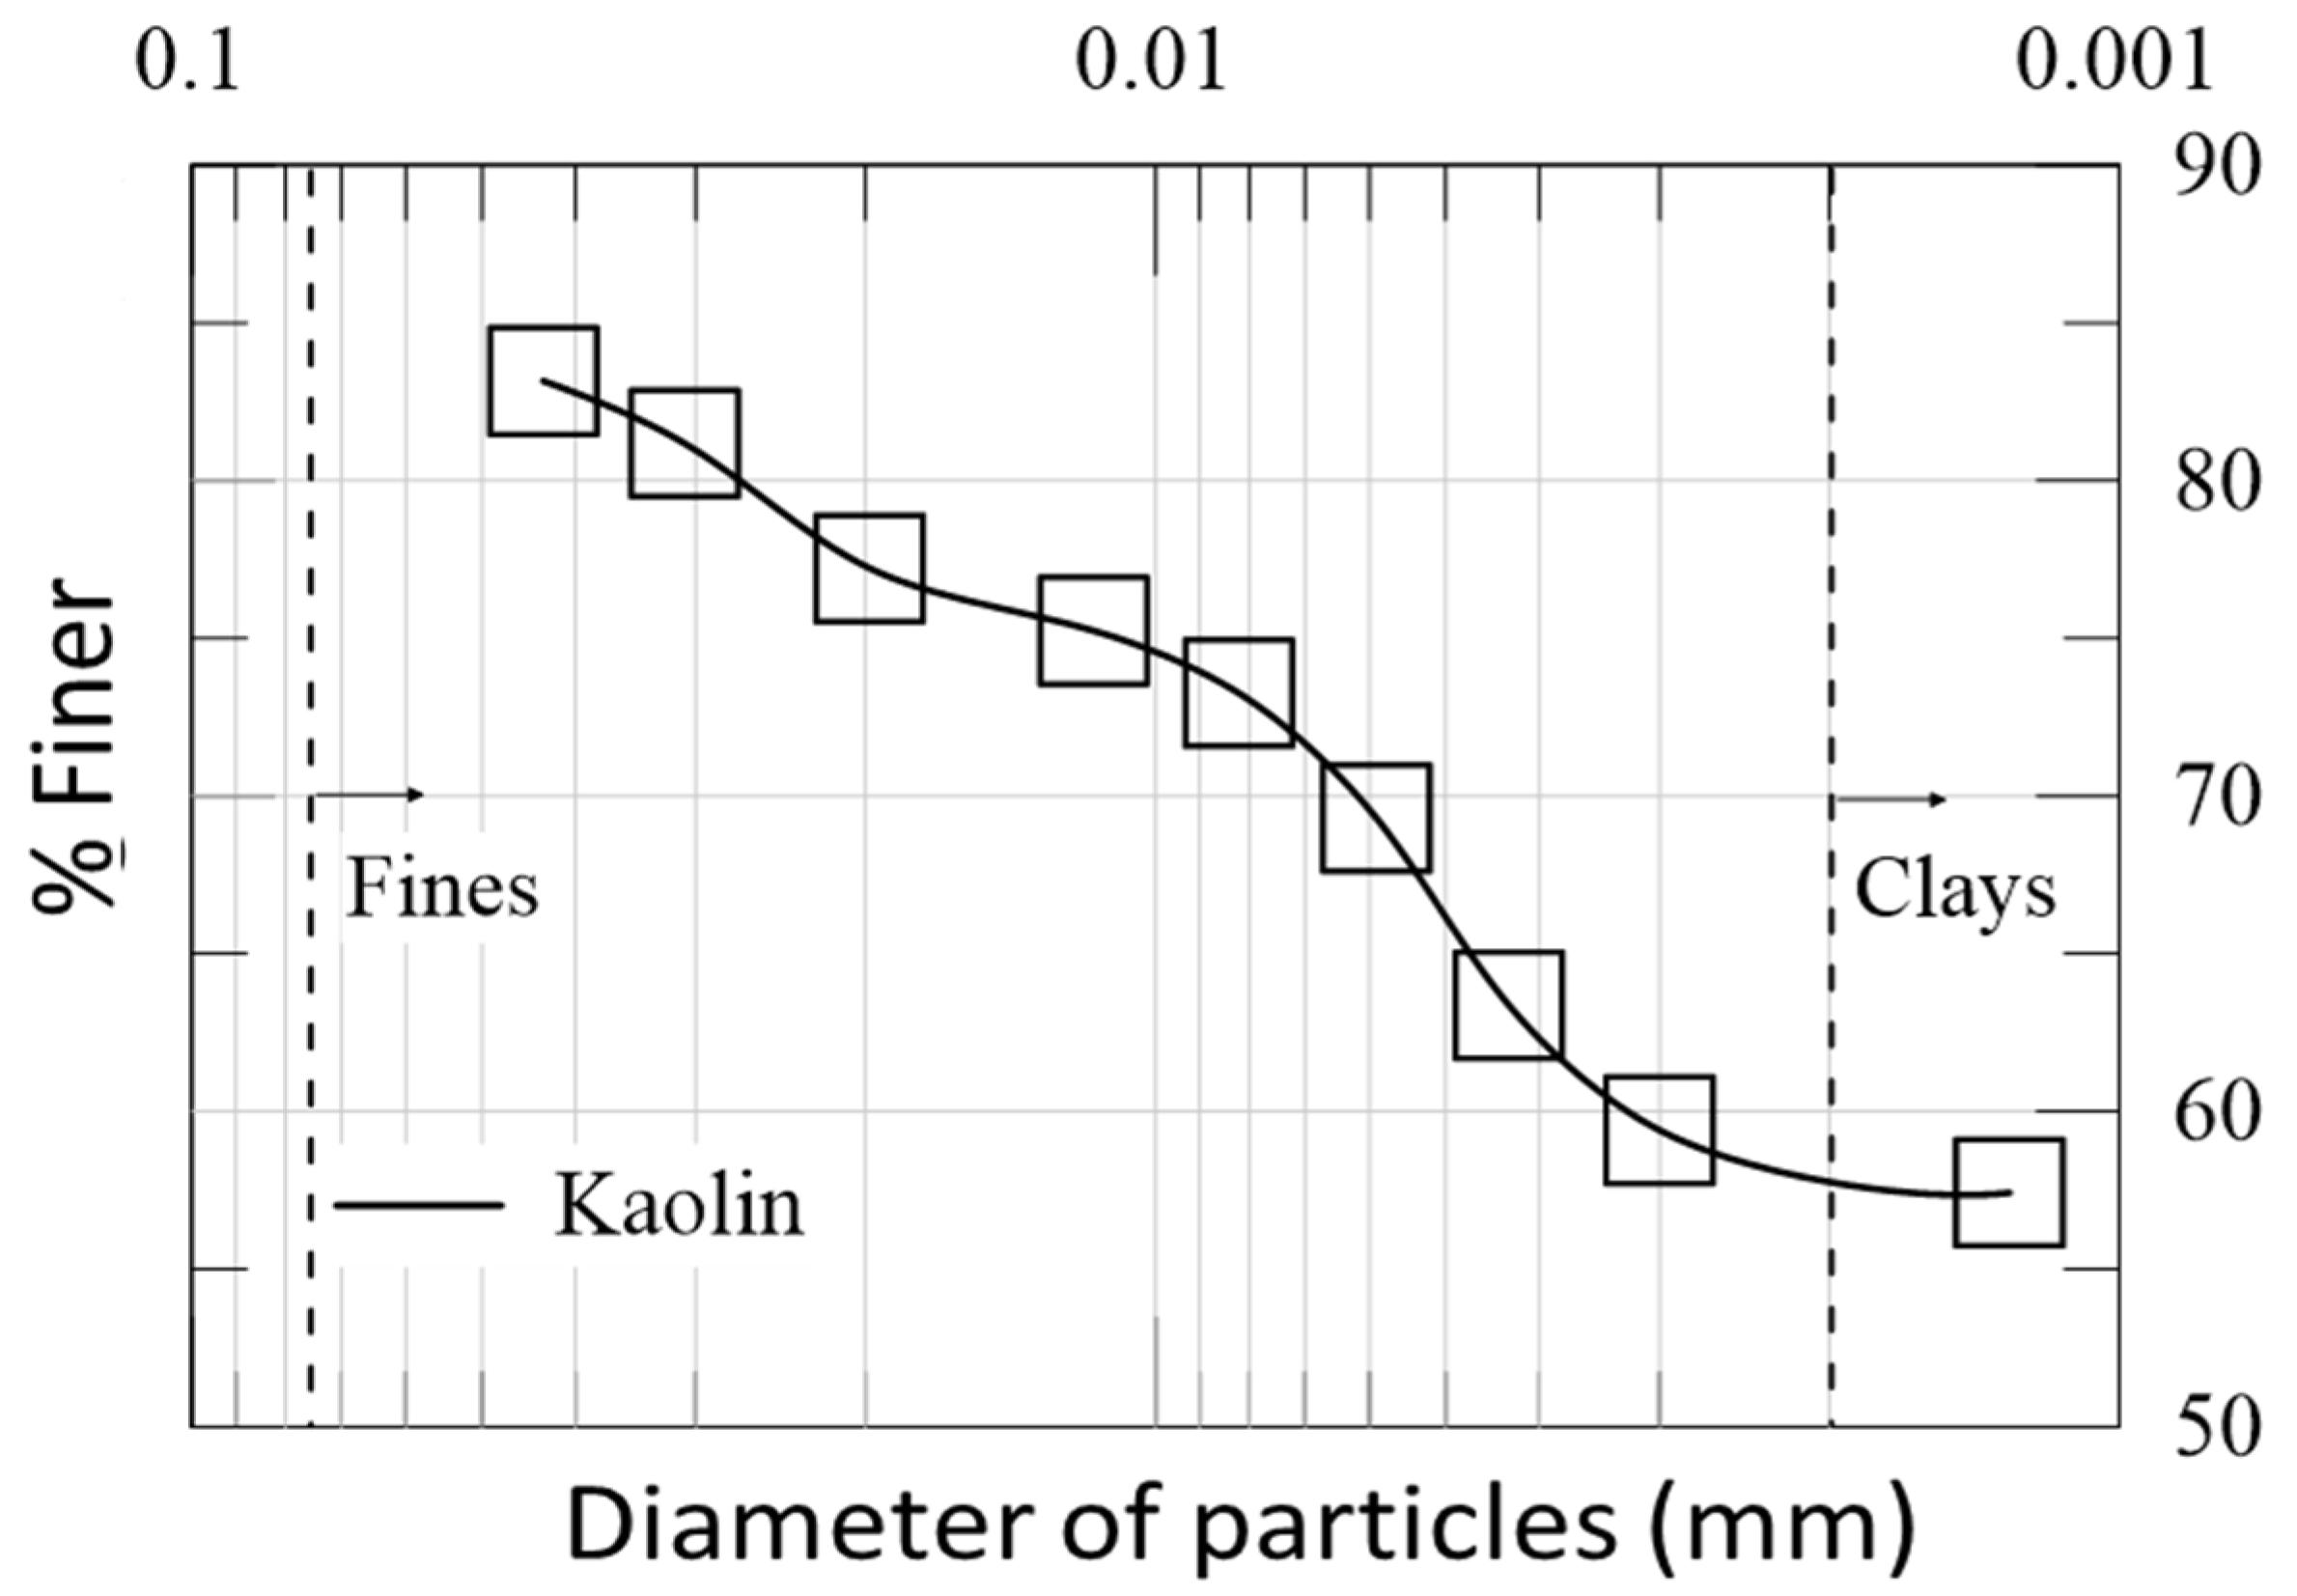
Regarding the index parameters of this material, it is a soil that is well-known in the local environment, where multiple investigations have been conducted using this type of clay. The liquid limit of kaolin is 52%, while the plasticity index is 19%. This parameter classifies the material as a high-plasticity silt according to the Unified Soil Classification System (USCS). For the fine fraction in the kaolin, a hydrometric analysis corroborates what was obtained in the plasticity chart, where a significant content of the material that passed the 200 sieve—particle size lower than 200 μm—was of silt size (Figure 5). The specific gravity of the material is 2.56.
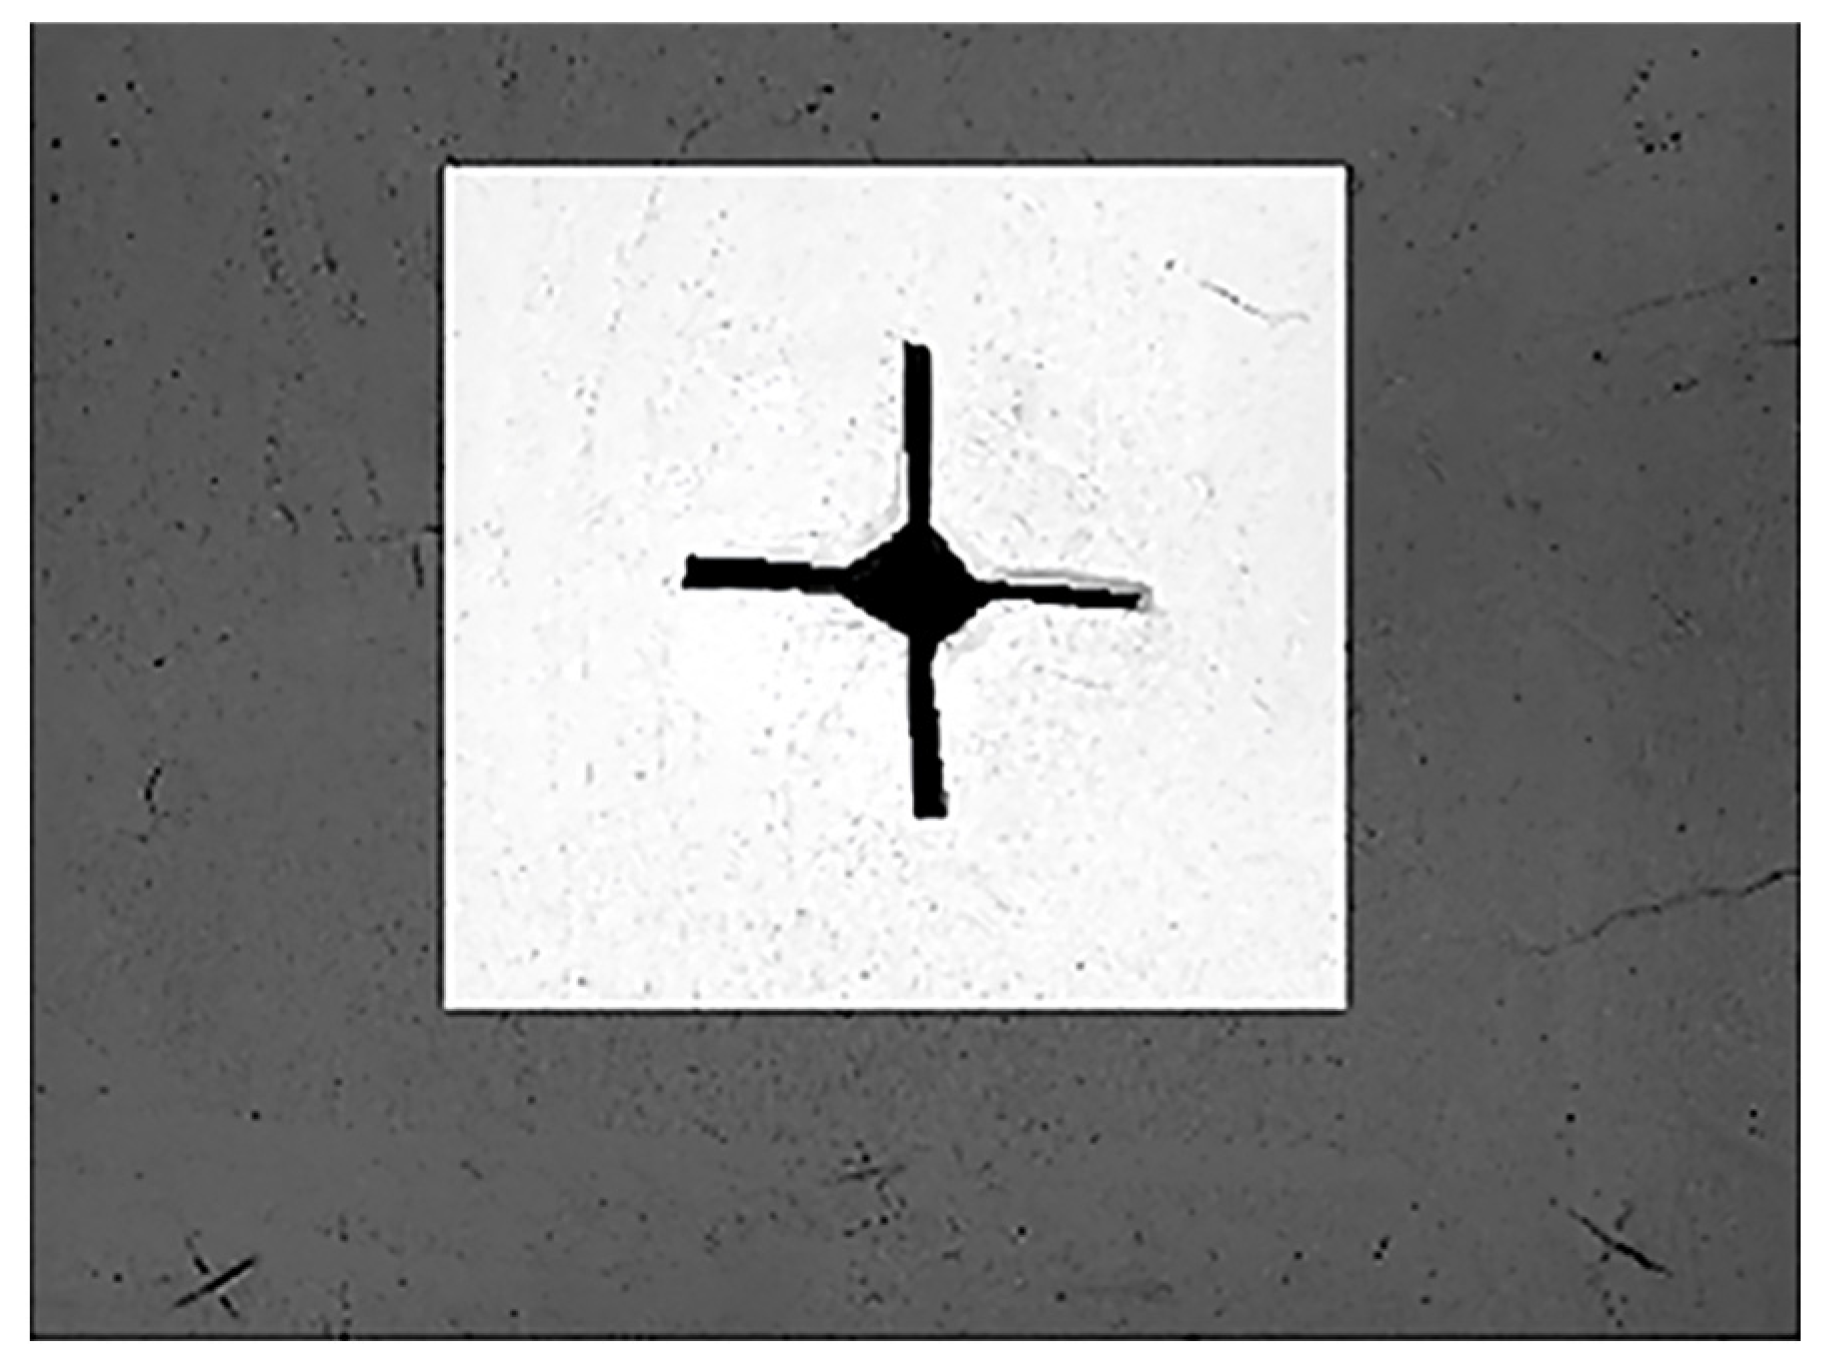
The clay specimens were subjected to different consolidation stresses and tested with a shear vane. Photographs were taken during the insertion to aid in analysing both the insertion process and the resulting disturbances in the samples. The samples were prepared near their liquid limit, where the soil loses shear strength. The mixture was placed in a container to achieve the desired consistency while minimising voids. They were then tested under consolidation stresses of 25 kPa, 50 kPa, and 100 kPa using specialised equipment from the Soil Mechanics Laboratory at the Universidad Militar Nueva Granada in Bogotá. After preparation, the shear vane was inserted, and photographs were taken from the same vantage point for each sample at different stresses. To ensure accurate image analysis, the previous and subsequent photographs must maintain a consistent pixel aspect ratio.

3.2. Shear Vane Configuration Used in This Research

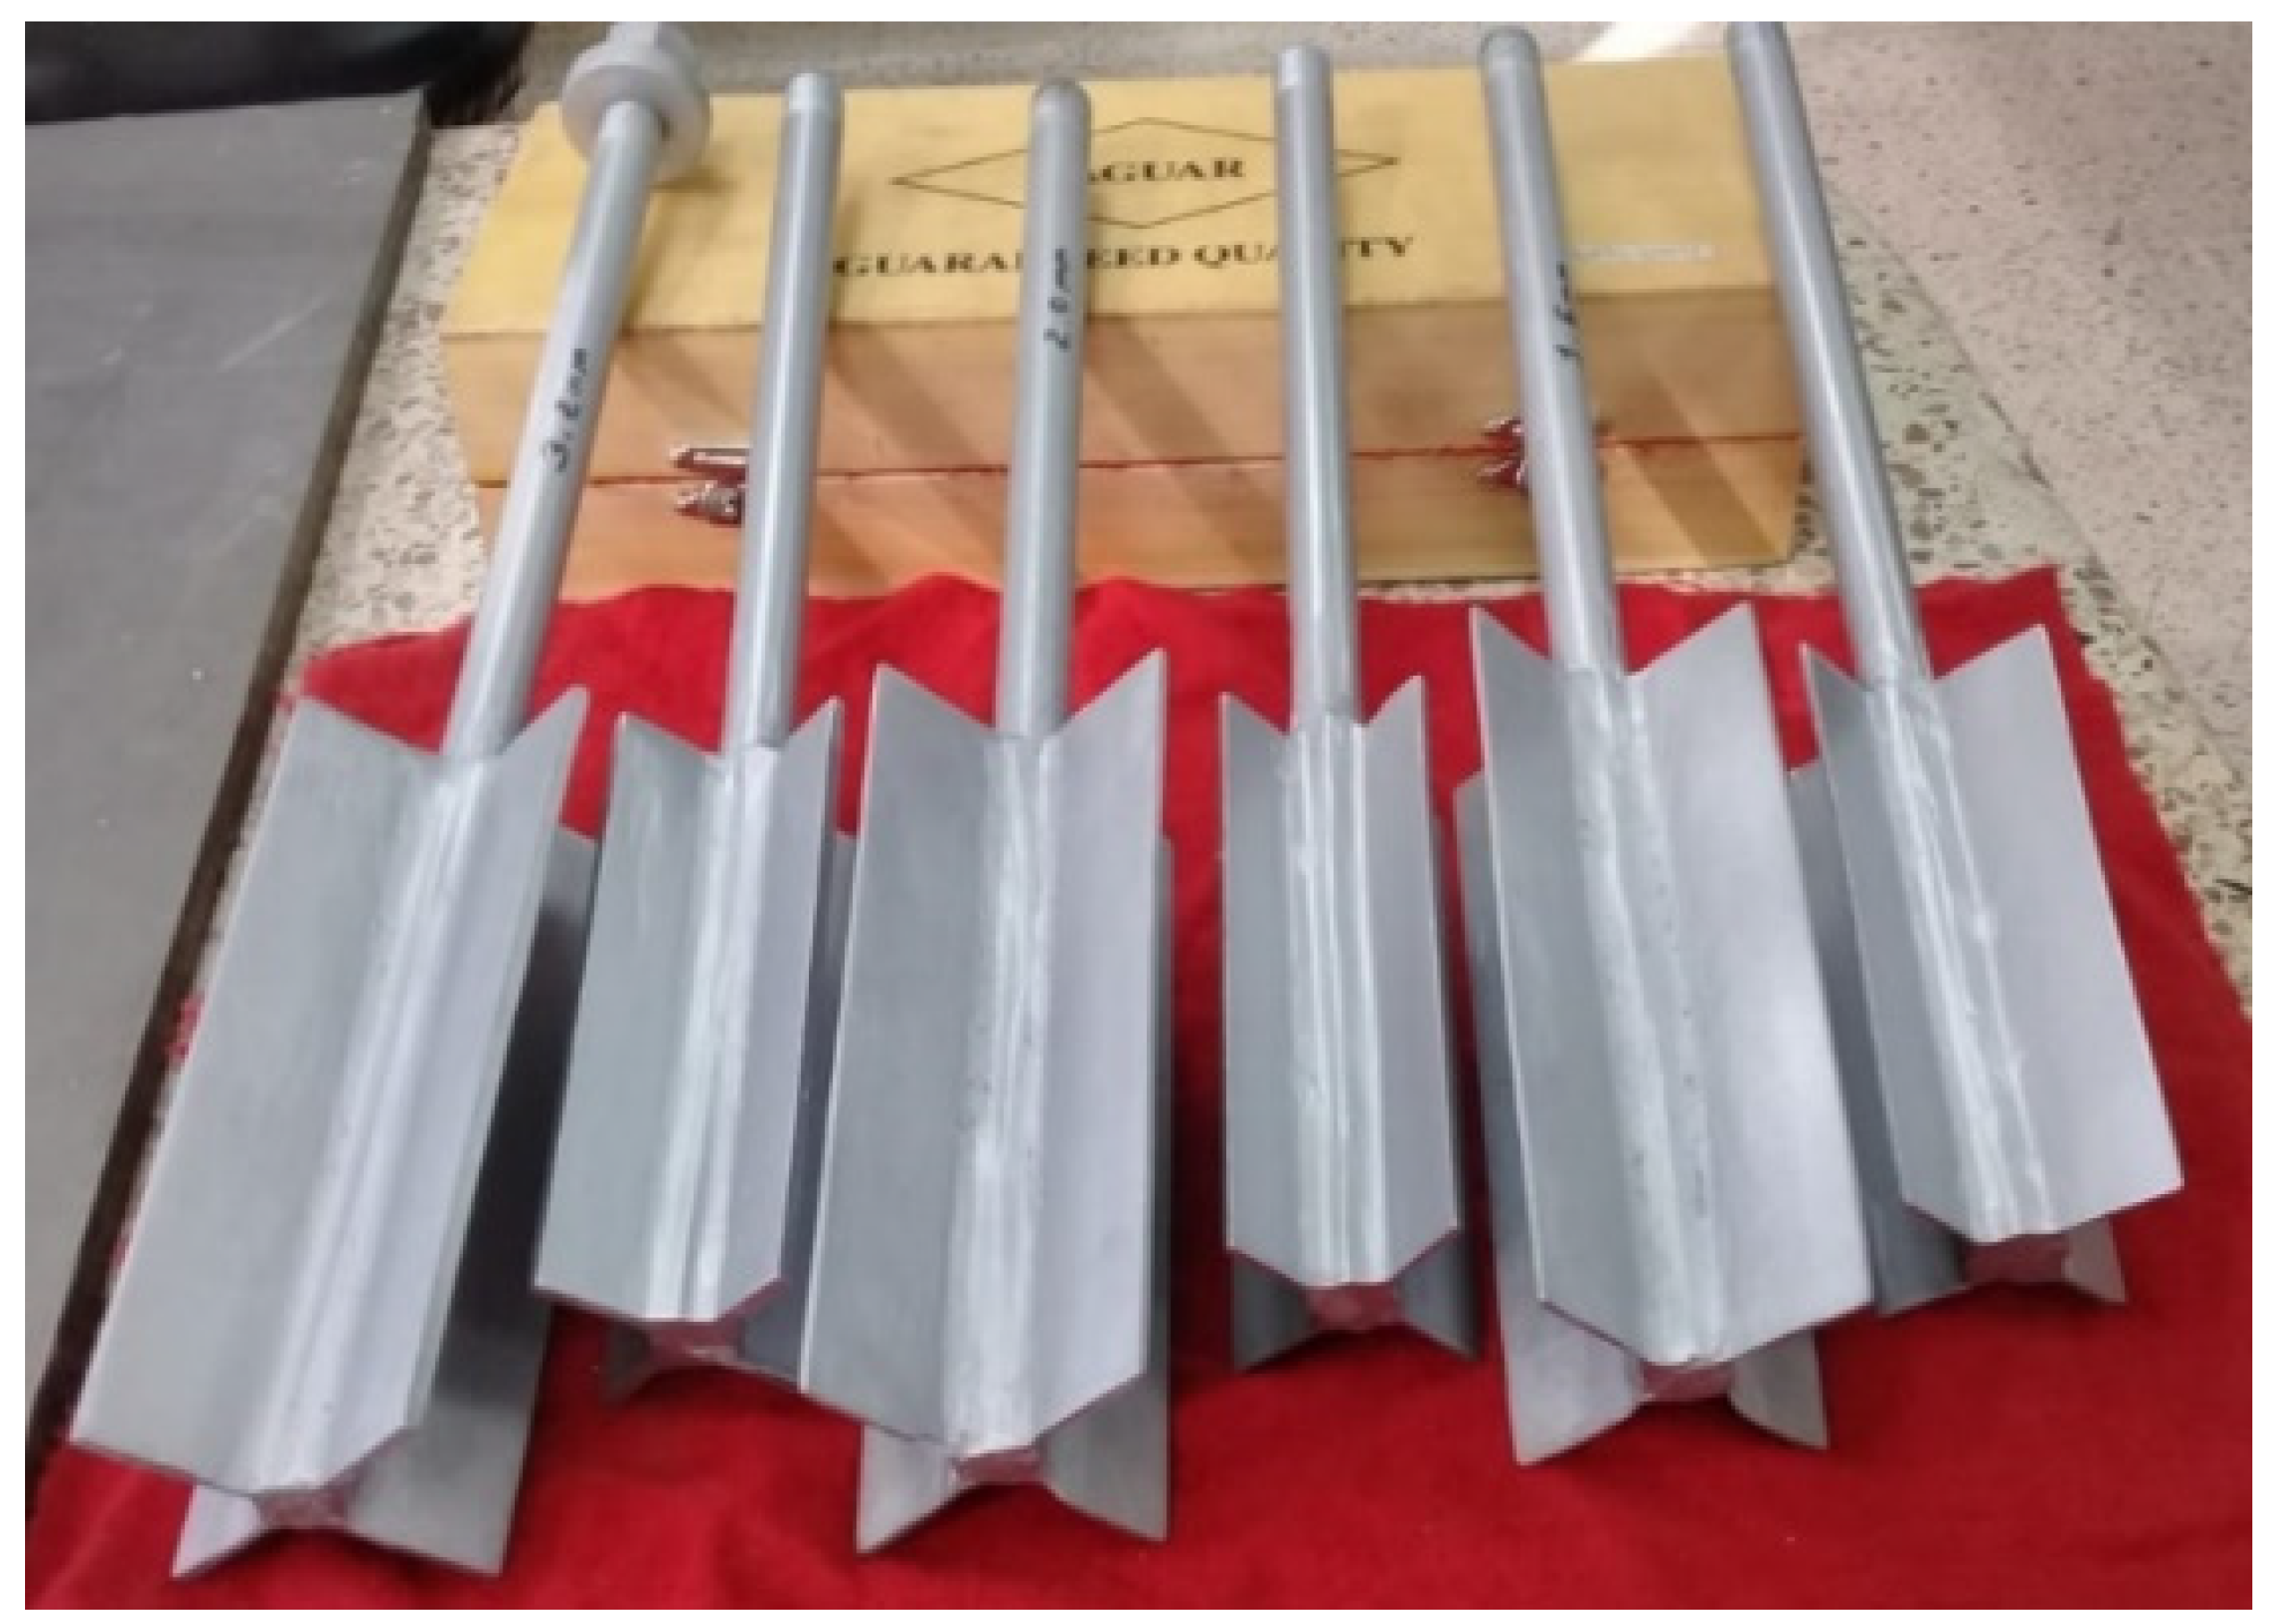
The objective of this study is to analyse the changes that occur during insertion. To achieve this, blades of varying thicknesses and diameters were constructed, resulting in some not accurately matching the recommended vane area ratio (VA) of less than 12%, as specified in standard D2573 [10]. Figure 6 shows a photograph of the shear vanes used in this research. Table 2 summarises the dimensions and configuration of these instruments.
The values of the dimensions in Table 2 indicate that the edges of the vane blades should be small enough to minimise soil disturbance during insertion. Therefore, the vane area ratio (VA) should be less than 12%. The weathervanes were constructed in aluminium and coated with an antioxidant to guarantee their quality and durability during the execution of the tests.

3.3. Digital Image Correlation (DIC)

Digital image processing then manipulates the matrices of numbers that digitally represent the images. There are different processing applications: image enhancement, image restoration, image analysis, and image compression. Image analysis techniques such as DIC allow for the image to be processed automatically to extract the information of interest. In the current context, this technique allows for the measurement of the deformations in the soil, particularly those caused by the insertion of the vane on the surface of the sample using a non-invasive methodology [25].
Its procedure then consists of taking photographs during the development of the test from its initial state to its final state [26]. The image processing toolbox will be used to perform the DIC. The code allows deformations from the VST images to be calculated regardless of the sample size. The code enables both vertical and horizontal displacements to be calculated.
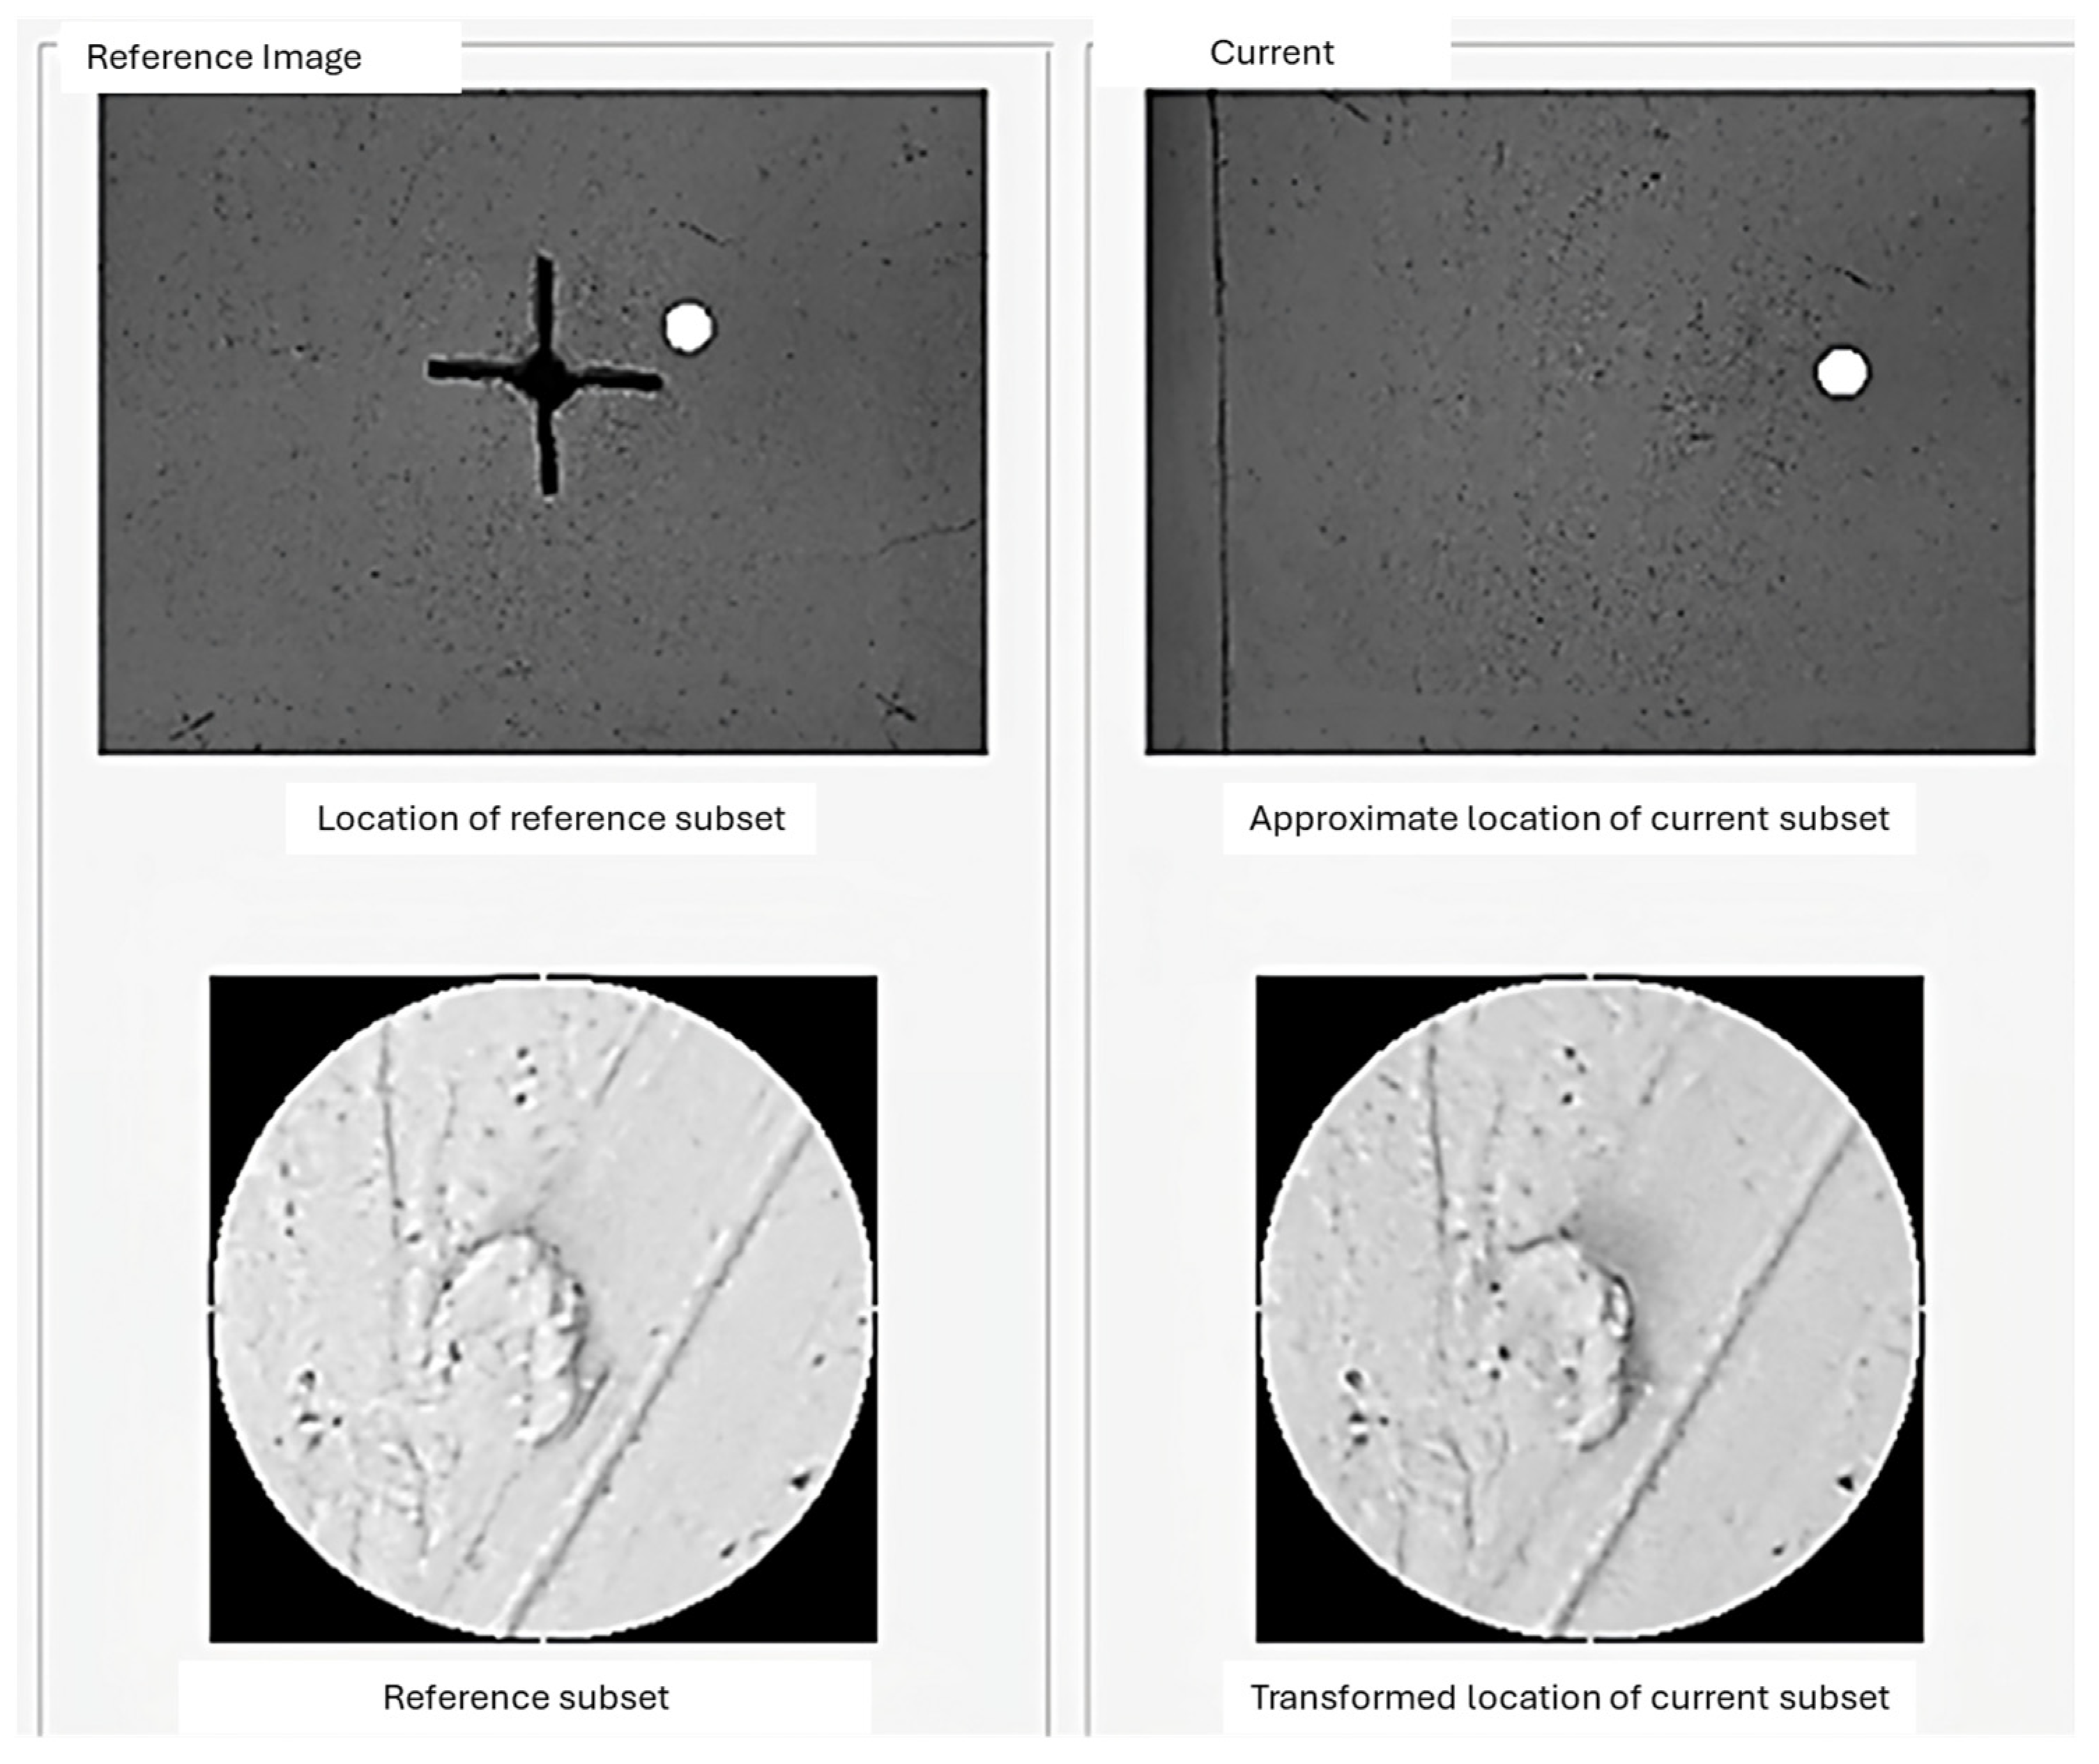
For image analysis, a software known as Ncorr (version 1.2) was used. Ncorr is an open-source software programme designed for two-dimensional digital image correlation, developed within the MATLAB R2024a environment. This programme encompasses a suite of algorithms that facilitate advanced image analysis, all of which are integrated within the MATLAB framework. The computationally intensive algorithms have been optimised using C++/MEX, enhancing processing efficiency and performance. This combination of high-performance algorithms and a user-friendly interface makes Ncorr a valuable tool for researchers and practitioners engaged in the field of image correlation and analysis. The 2D digital image correlation is performed using the studies of [27,28,29] as a reference, employing free license software. To start the analysis, the image must be loaded to serve as a reference for calculating changes in the pixels, equivalent to before the insertion. Then, it will be necessary to load the current image, comparable to after the insertion of the vane; this will allow us to move to the next step, defining the region of interest, as shown in Figure 7.
The region of interest allows us to define the area of the image that will be the basis of the correlation (Figure 8). For the insertion analysis, it is necessary to define two points: a positive rectangular polygon and a negative polygon in the area showing the space left by the vane after the insertion. This procedure permits the change in pixels.
From this point, the Ncorr programme will establish a “seed” in the region of interest, serving as a reference point for pixel detection (Figure 9). If there are problems with high correlation coefficients, the loaded images do not have the same number of pixels, both in the reference and current images. It may also indicate the poor quality of the image to be analysed, which would require a new acquisition of the photographs.
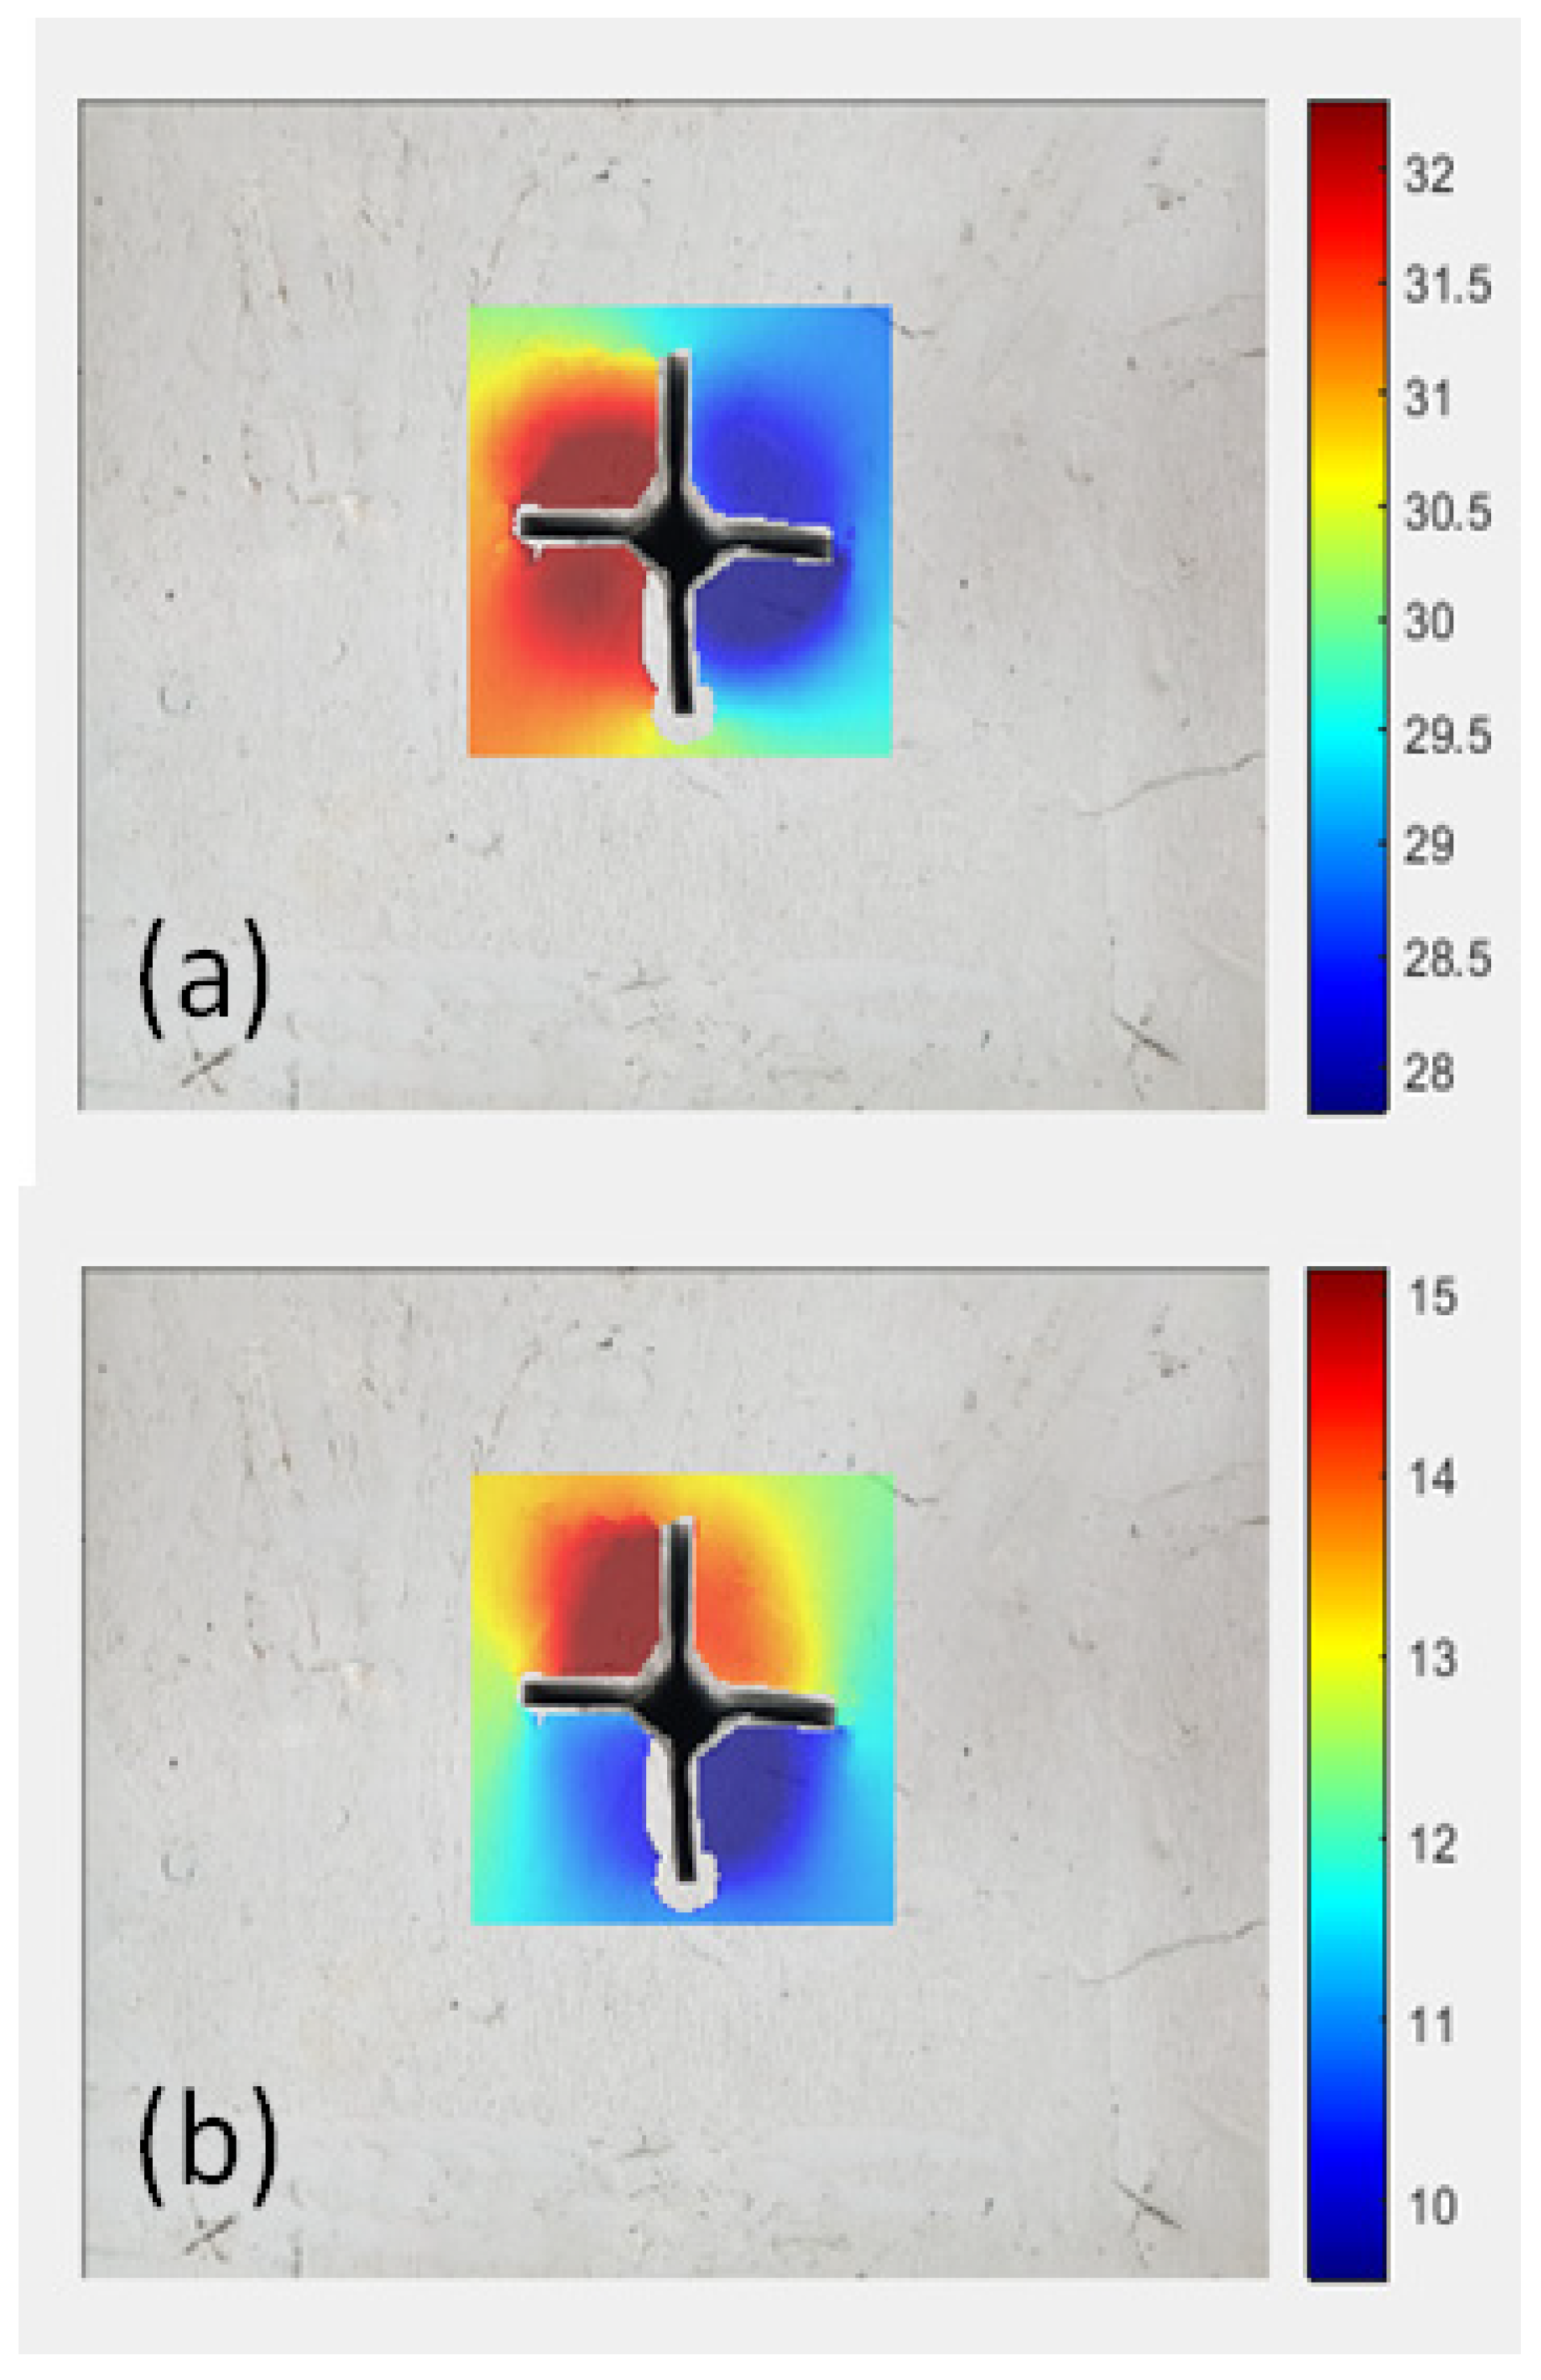
After executing the previous step, the analysis process takes approximately 90 to 150 min for each image. In total, 18 analyses were conducted. Once the analysis is complete, the programme displays displacement detection through a graphical representation on a colour scale. At this stage, users can define conversion units from a reference image, transforming pixels into centimetres or any preferred unit (see Figure 10).
Once all the previous steps are completed, the programme enables the plotting of each image to initiate deformation analysis for each vane. The data obtained regarding displacements and images allows for the processing and analysis of the area near the blades. This region is the focal point of the research, specifically the alteration zone proposed by Cadling & Odenstad [7].

4. Results

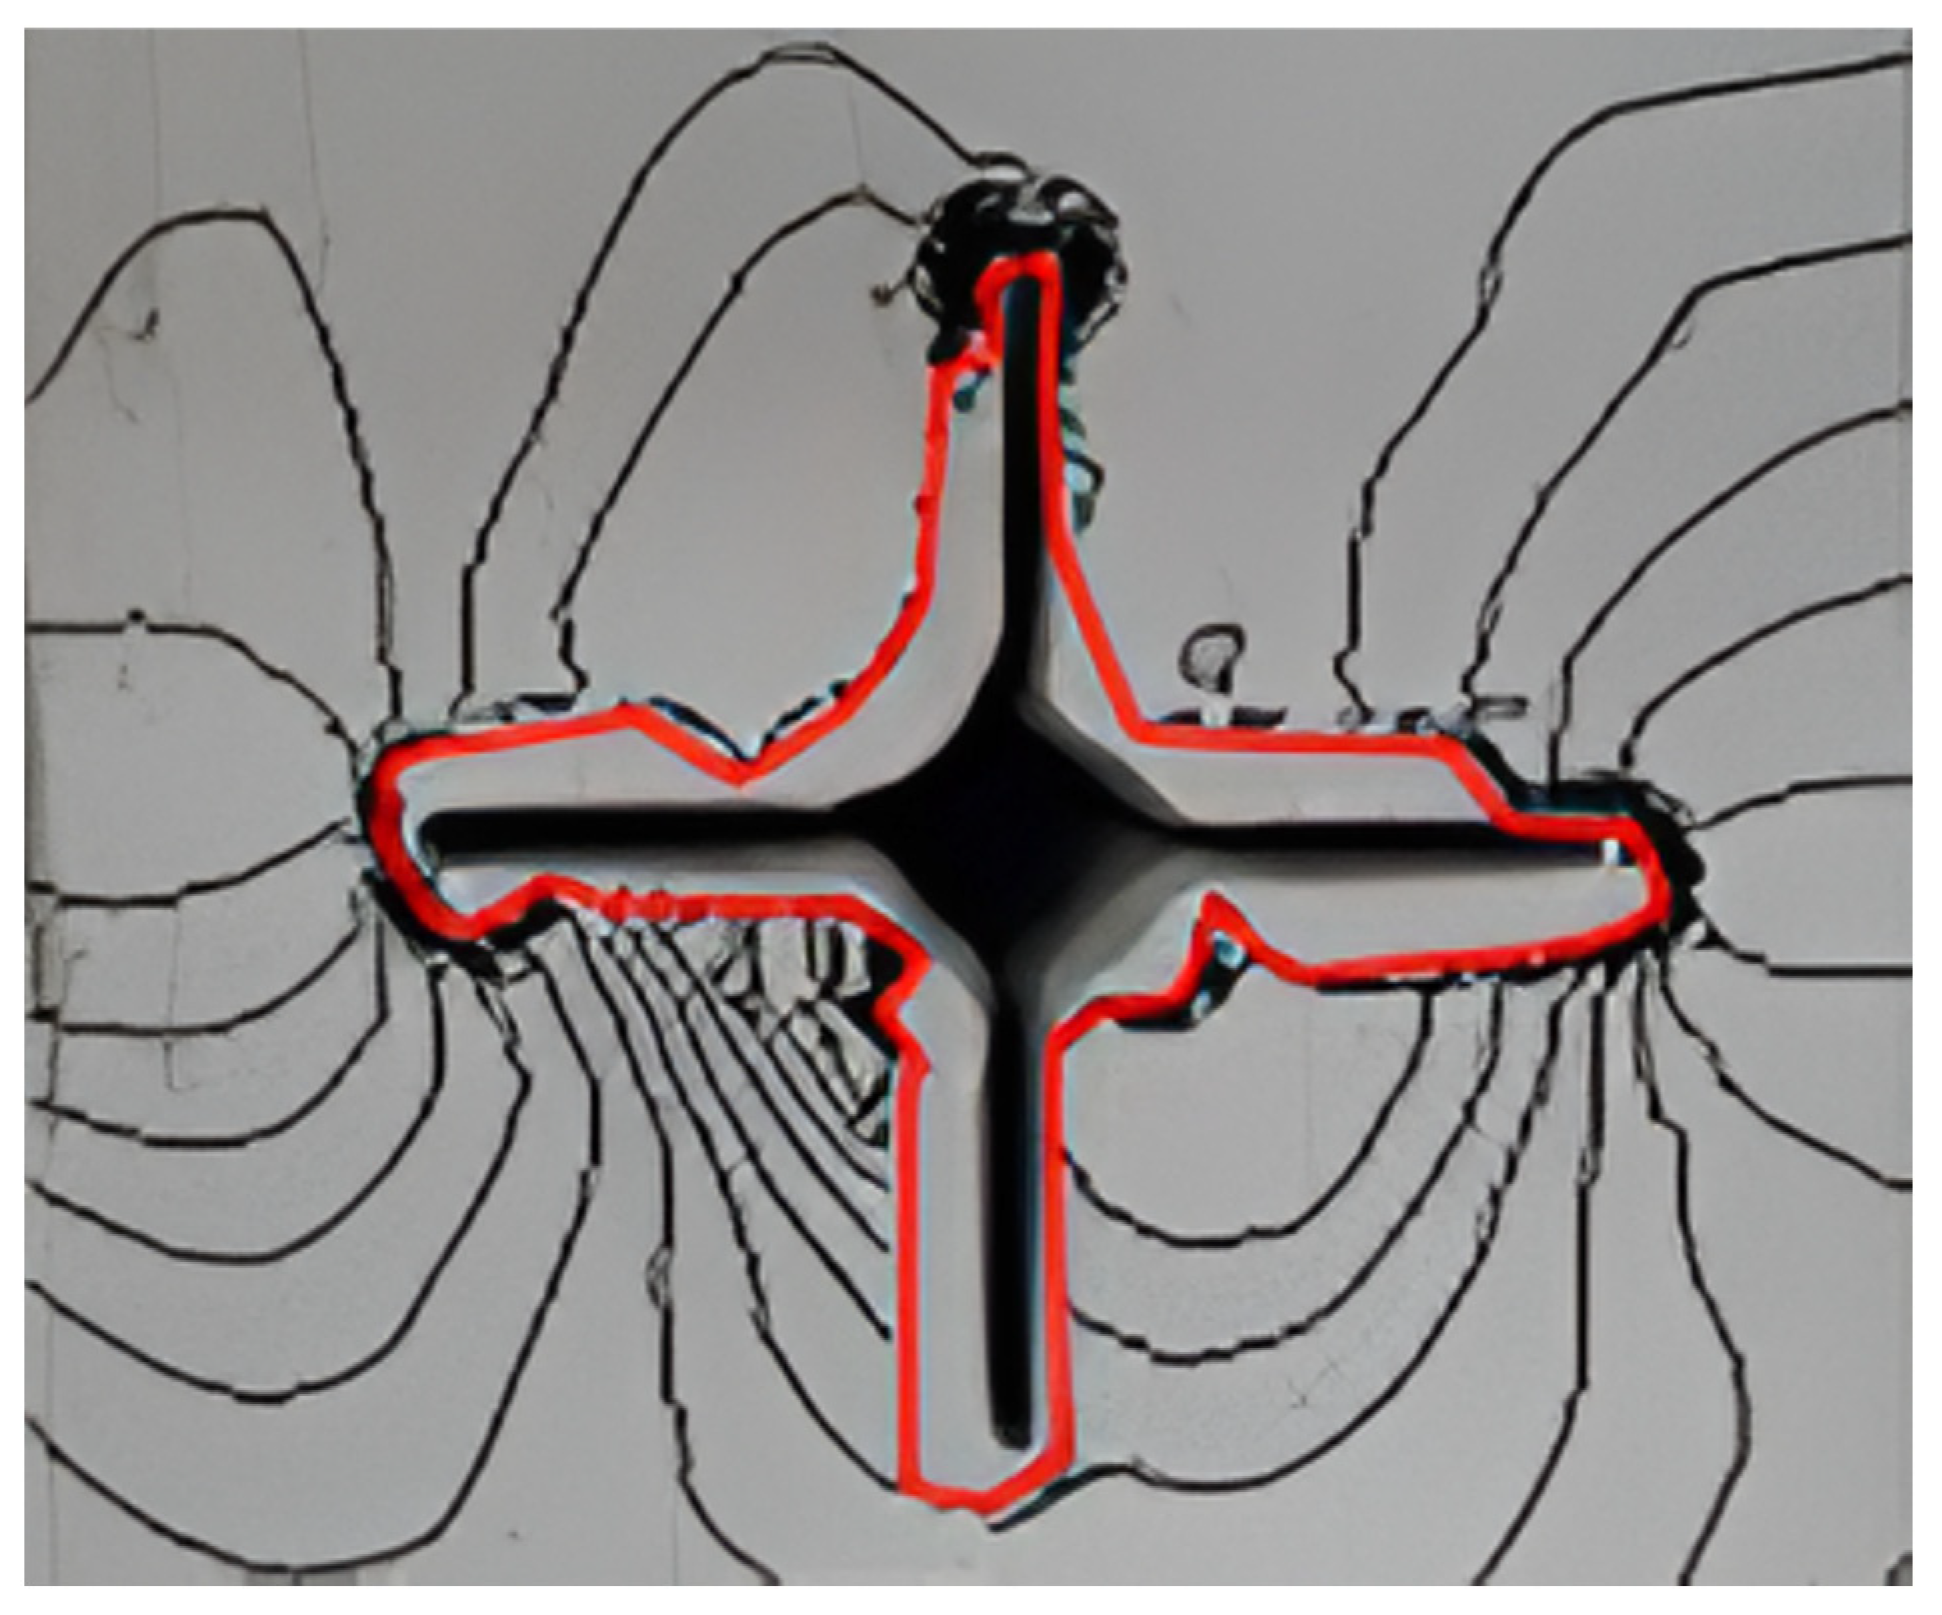
After the Ncorr programme completed the image analysis, all necessary data regarding deformation due to alteration were obtained. This included both horizontal and vertical displacements for each impression. The specific areas of disturbance identified through the imaging analysis using digital image correlation (DIC) were calculated with Ncorr software (version 1.2). Figure 11 provides an example of the alteration area obtained, which considers the area occupied by the vane during insertion. This analysis pertains to a vane with a diameter of 50.8 mm and a blade thickness of 1.6 mm, tested on a sample preconsolidated at 25 kPa.
The area obtained under the design software was converted to known units in cm2 or mm2 for their respective analysis. At this stage, the scale’s usefulness is established during the displacement parameters step in the Ncorr software. The area ratio (AR) can be measured for a given space in the image, as shown in Figure 11. Based on the above, the necessary calculations are made for each consolidation stress with the different combinations of the vanes. Based on the data obtained for the disturbance in each of the scenarios previously presented, the analysis of the percentage of disturbance measured was obtained, which is presented for each of the consolidation stresses.
The data presented in Table 3 pertains to the imaging analysis conducted for each insertion using vanes with diameters of 50.8 mm and 63.5 mm on samples subjected to varying preconsolidation stresses (σc). The alteration was measured on the vane against a reference area known as the failure surface area, which has an approximate constant value of 2026.83 mm2. This value represents the total area of the vane’s intervention in the sample. To facilitate a comparison between the two types of alterations expressed as percentage values—one was derived from the imaging analysis, and the other was based on the equation proposed by Cadling & Odenstad [7]—the values were plotted, and trend lines were established to derive the equation that describes their behaviour.
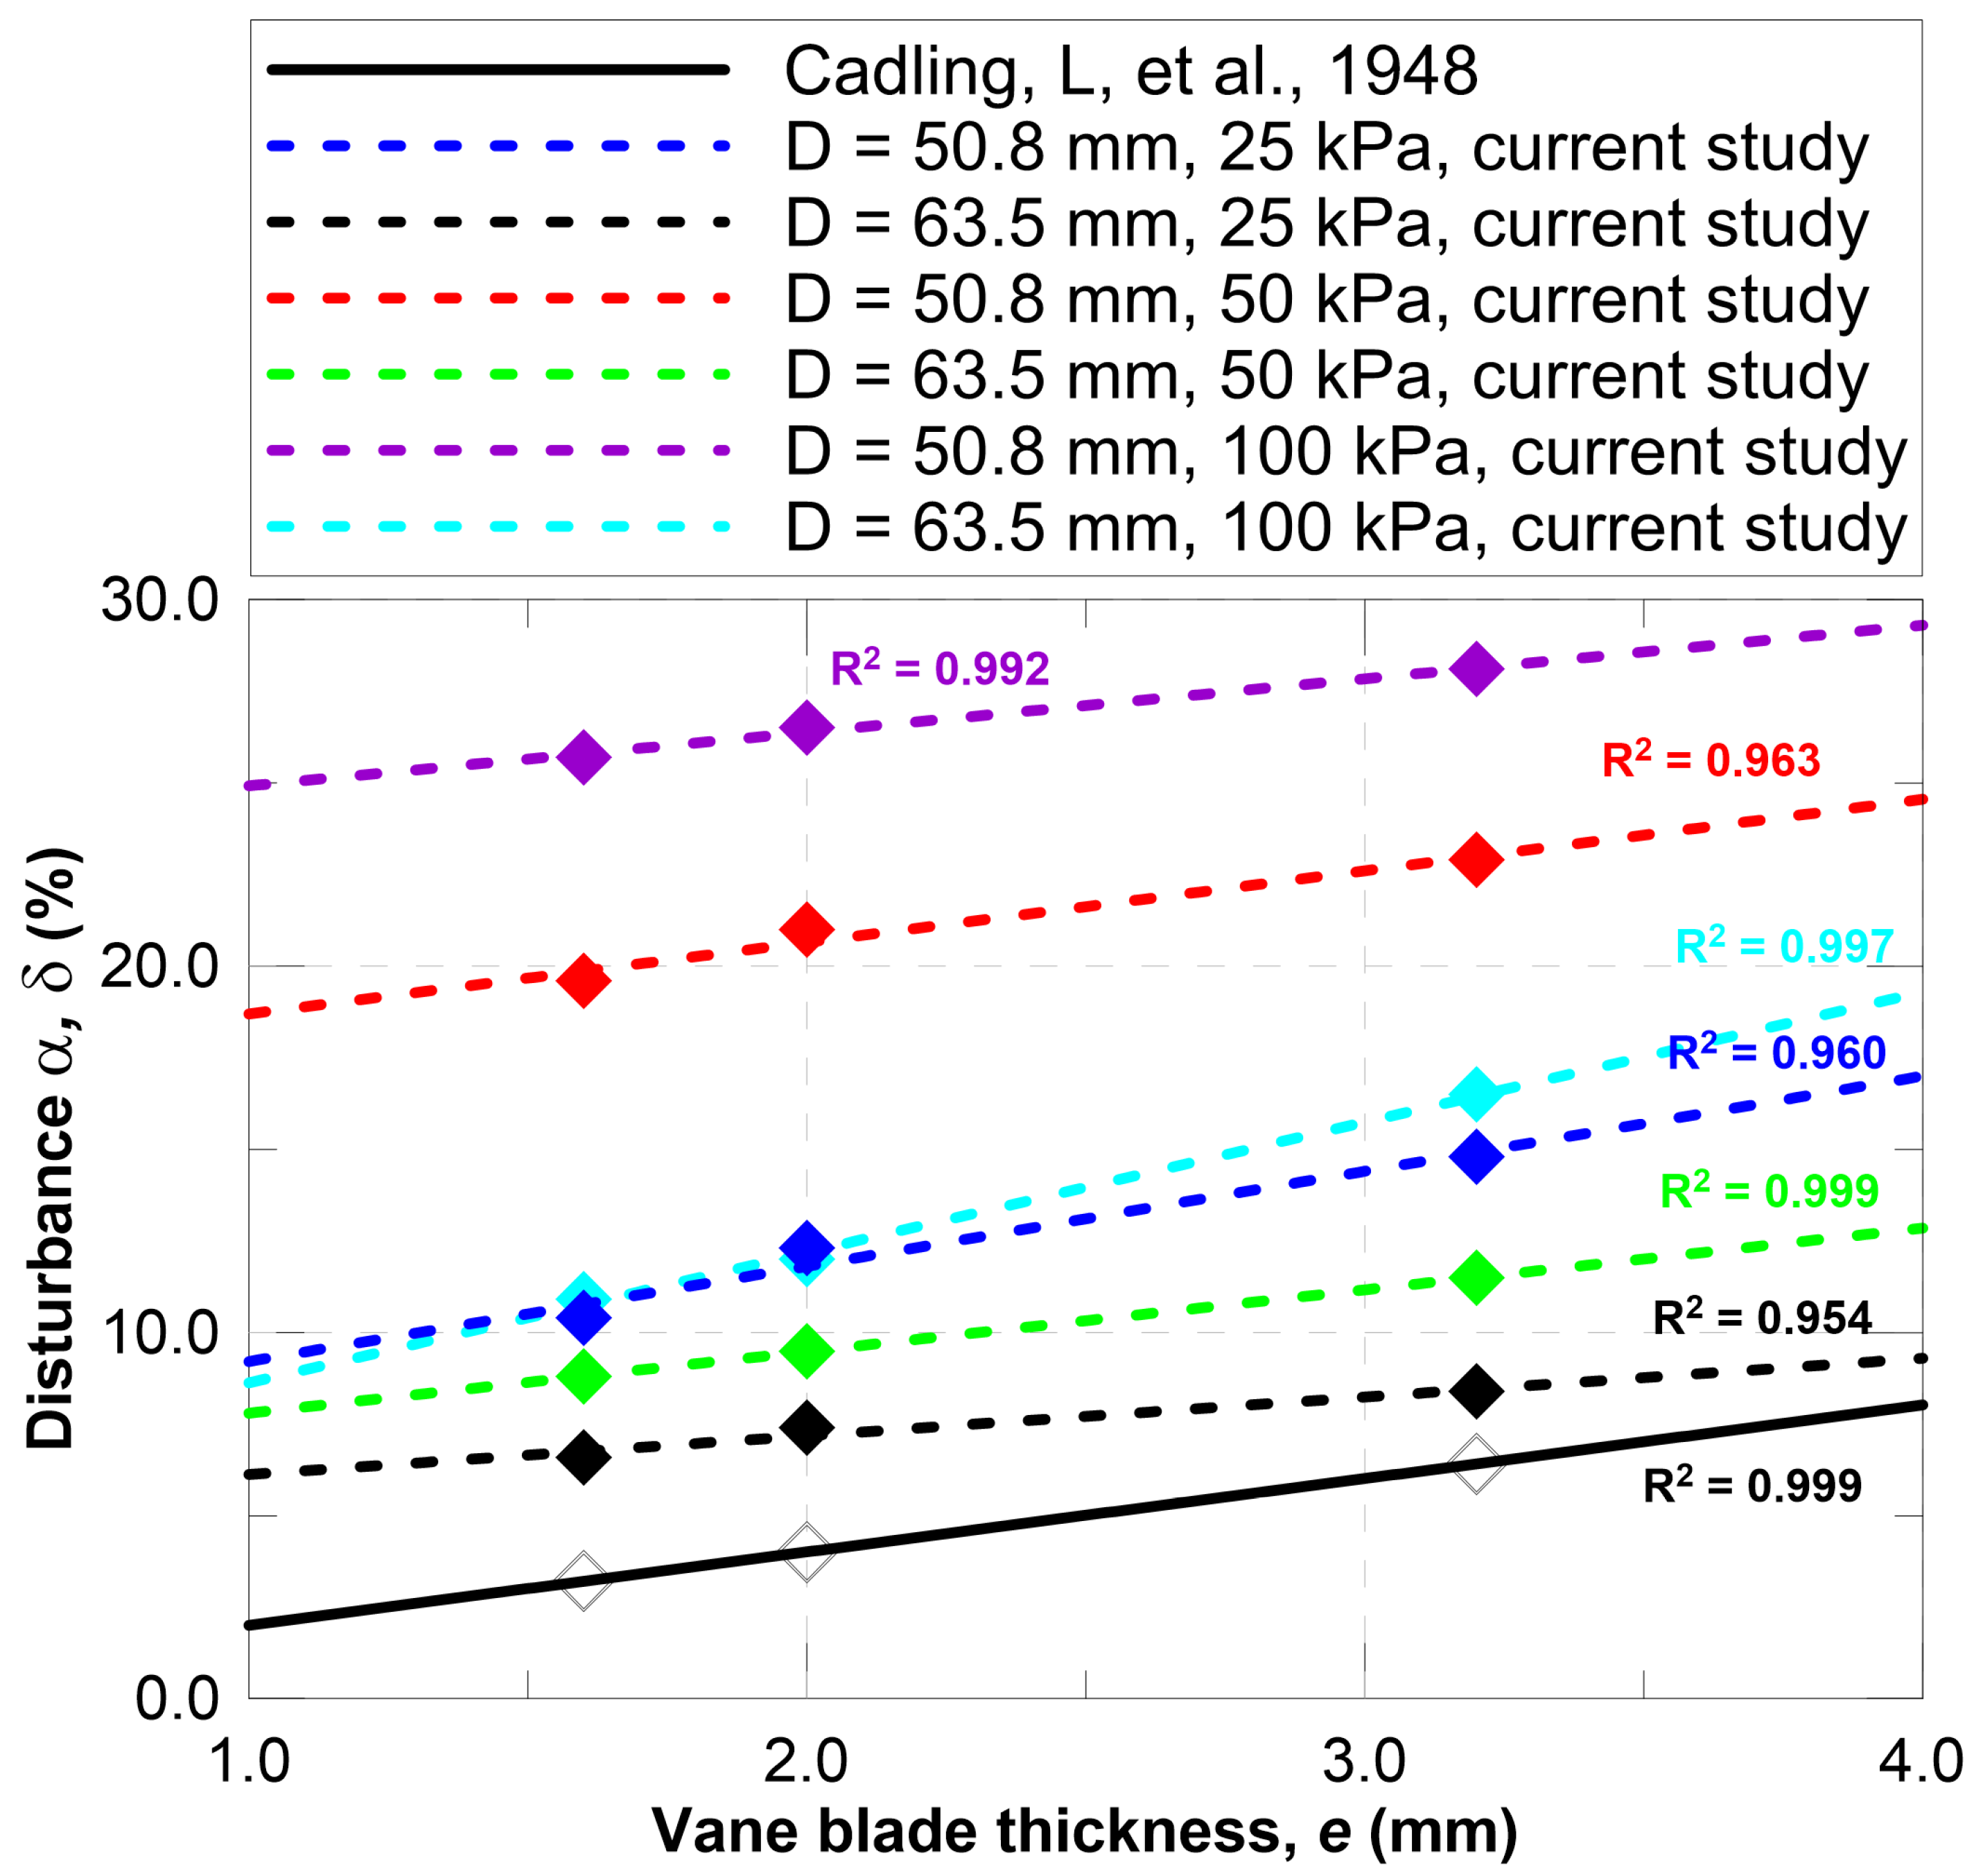
Table 3 shows that preconsolidation stress is a factor that enhances the disturbance δ, at least in the current study, where the imaging analysis detects the influence of stress history on vane insertion. Using digital image correlation (DIC), the algorithm identified and quantified the disturbance by tracking deformation fields and identifying the affected zone around the vane by monitoring the area change. This is performed by comparing the area identified (through image analysis) as having undergone significant disturbance, expressed as a fraction of the total vane device area. Thresholds for disturbance can be set using strain magnitude, displacement gradients, or texture/fabric change detected in the images. Meanwhile, in the theoretical value α [7], the disturbance remains the same since the expression only includes parameters related to vane dimensions. This aspect is interesting in this study because it shows that the initial soil condition is also related to the disturbance produced at the vane insertion, as illustrated in Figure 12.
It is also essential to observe the evolution of the disturbance of the sample related to the preconsolidation stress imposed on the specimens. As it had already been mentioned in the analysis of Table 3, the disturbance shows a frank increase with increasing stress history. Physically, this can be explained by the fact that for the vane to penetrate a stiffer clay, a higher stress must be made, which can be translated into a more significant displacement of the vane vicinity in the area of the blades, as can also be seen in Table 3 in parameter DA, which is the area of disturbance in the vicinity of the blades (Figure 13).
Cadling & Odenstad [7] studies do not report differences in disturbance as the preconsolidation stress in the sample changes. For this reason, the alternative degrees were graphed horizontally in Figure 13. One of the key contributions of the current study is its examination of the dependence of disturbance on the stress to which the material is subjected, a finding that holds significant implications for the field.
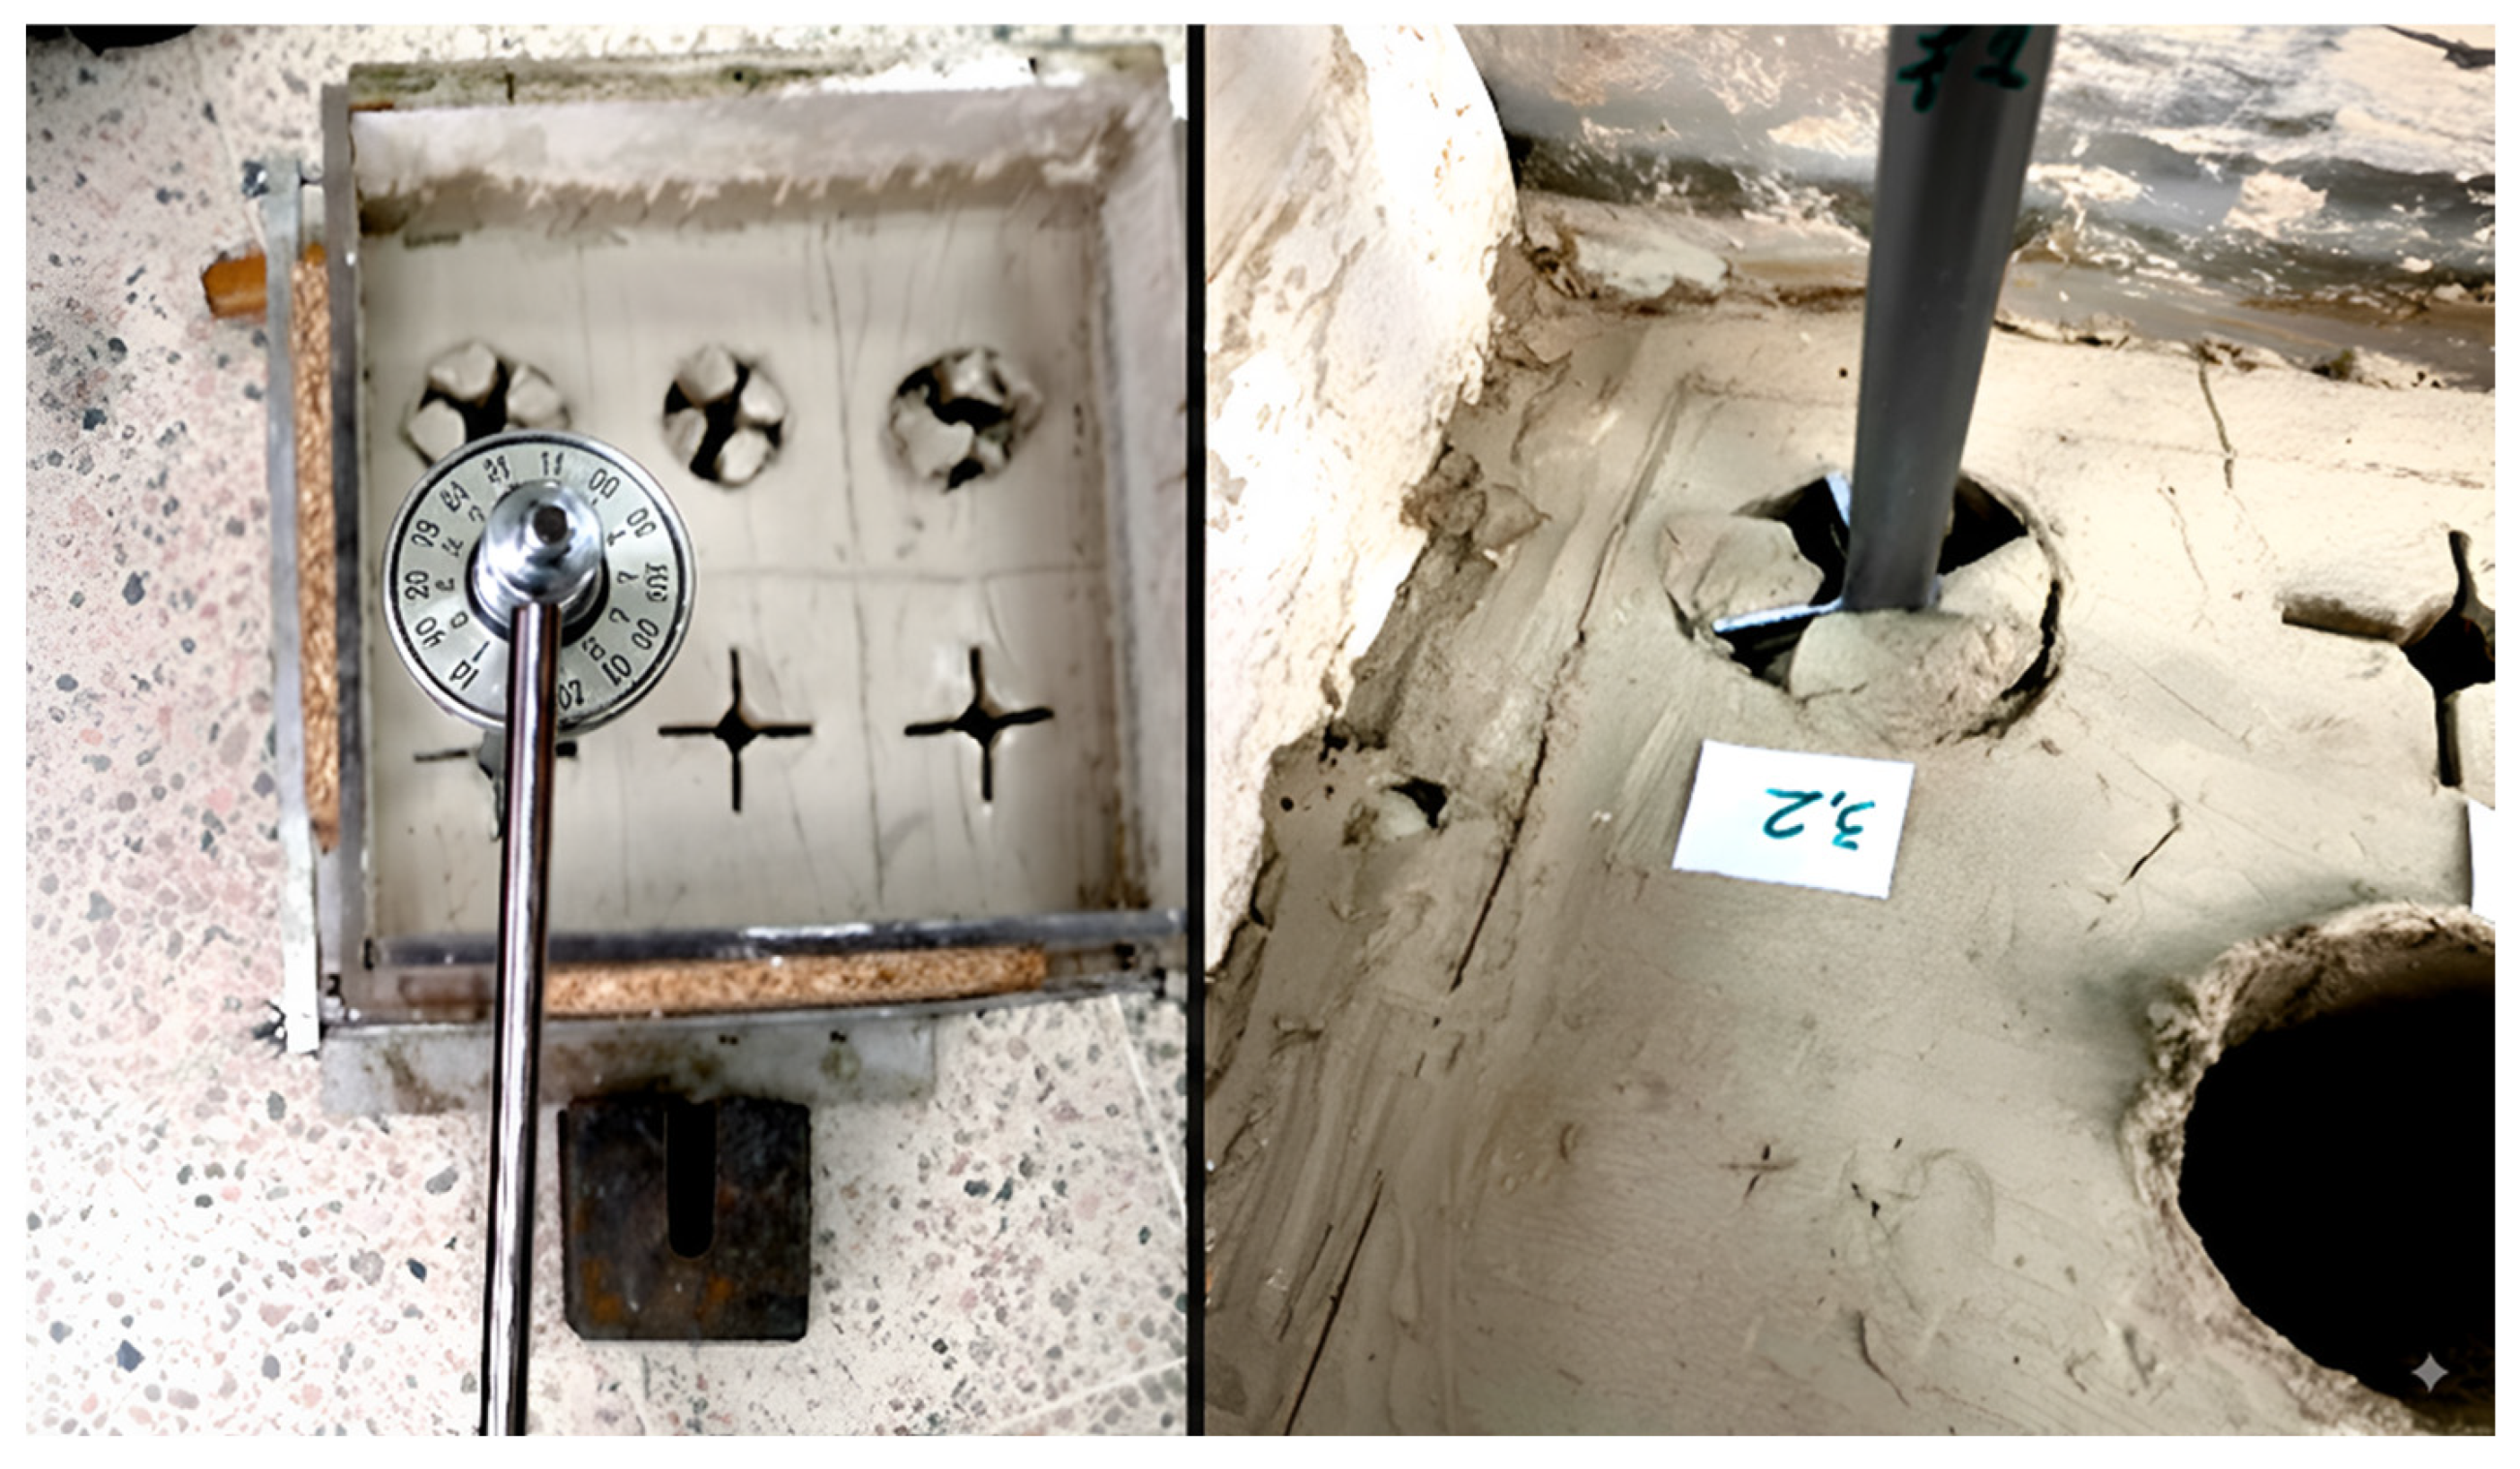
After inserting the vane for the disturbance analysis in the preconsolidated specimens, it was decided to complement the test information by applying the torque on the specimens for each vane, thus measuring the moment exerted to bring them to failure (Figure 14). The degree of disturbance affecting the blades’ neighbouring zones and the area of influence around the vane, which may also affect the torque measured in the samples, may depend on the results when performing the VST. This effect of disturbance on the measurement of undrained shear strength was reported by [3,14,15,30,31].
As the magnitude of the preconsolidation stress increases, the soil typically exhibits a denser and more structured fabric. This stronger interparticle arrangement, while beneficial in terms of higher stiffness and strength, also renders the soil more susceptible to structural disturbance. In practical terms, a soil with a high preconsolidation stress tends to lose a greater proportion of its original fabric and bonding when subjected to disturbance, compared with a normally consolidated soil. The relative loss of mechanical properties, such as stiffness, strength, and resistance to deformation, is higher. This effect can be attributed to the fact that highly overconsolidated soils rely heavily on their stress history and structure for their mechanical response.
Disturbance during the VST is a consequence of disrupting these microstructural features. Consequently, as preconsolidation stress increases, the measured soil properties deviate more significantly from the true field behaviour, compromising the reliability of test results (Figure 14). This complementary procedure provided further insight into the effects of disturbance on the soil response. The extent of disturbance in the immediate vicinity of the vane blades, as well as the size of the influence zone, may significantly affect the torque required to induce failure and, consequently, the measured undrained shear strength.
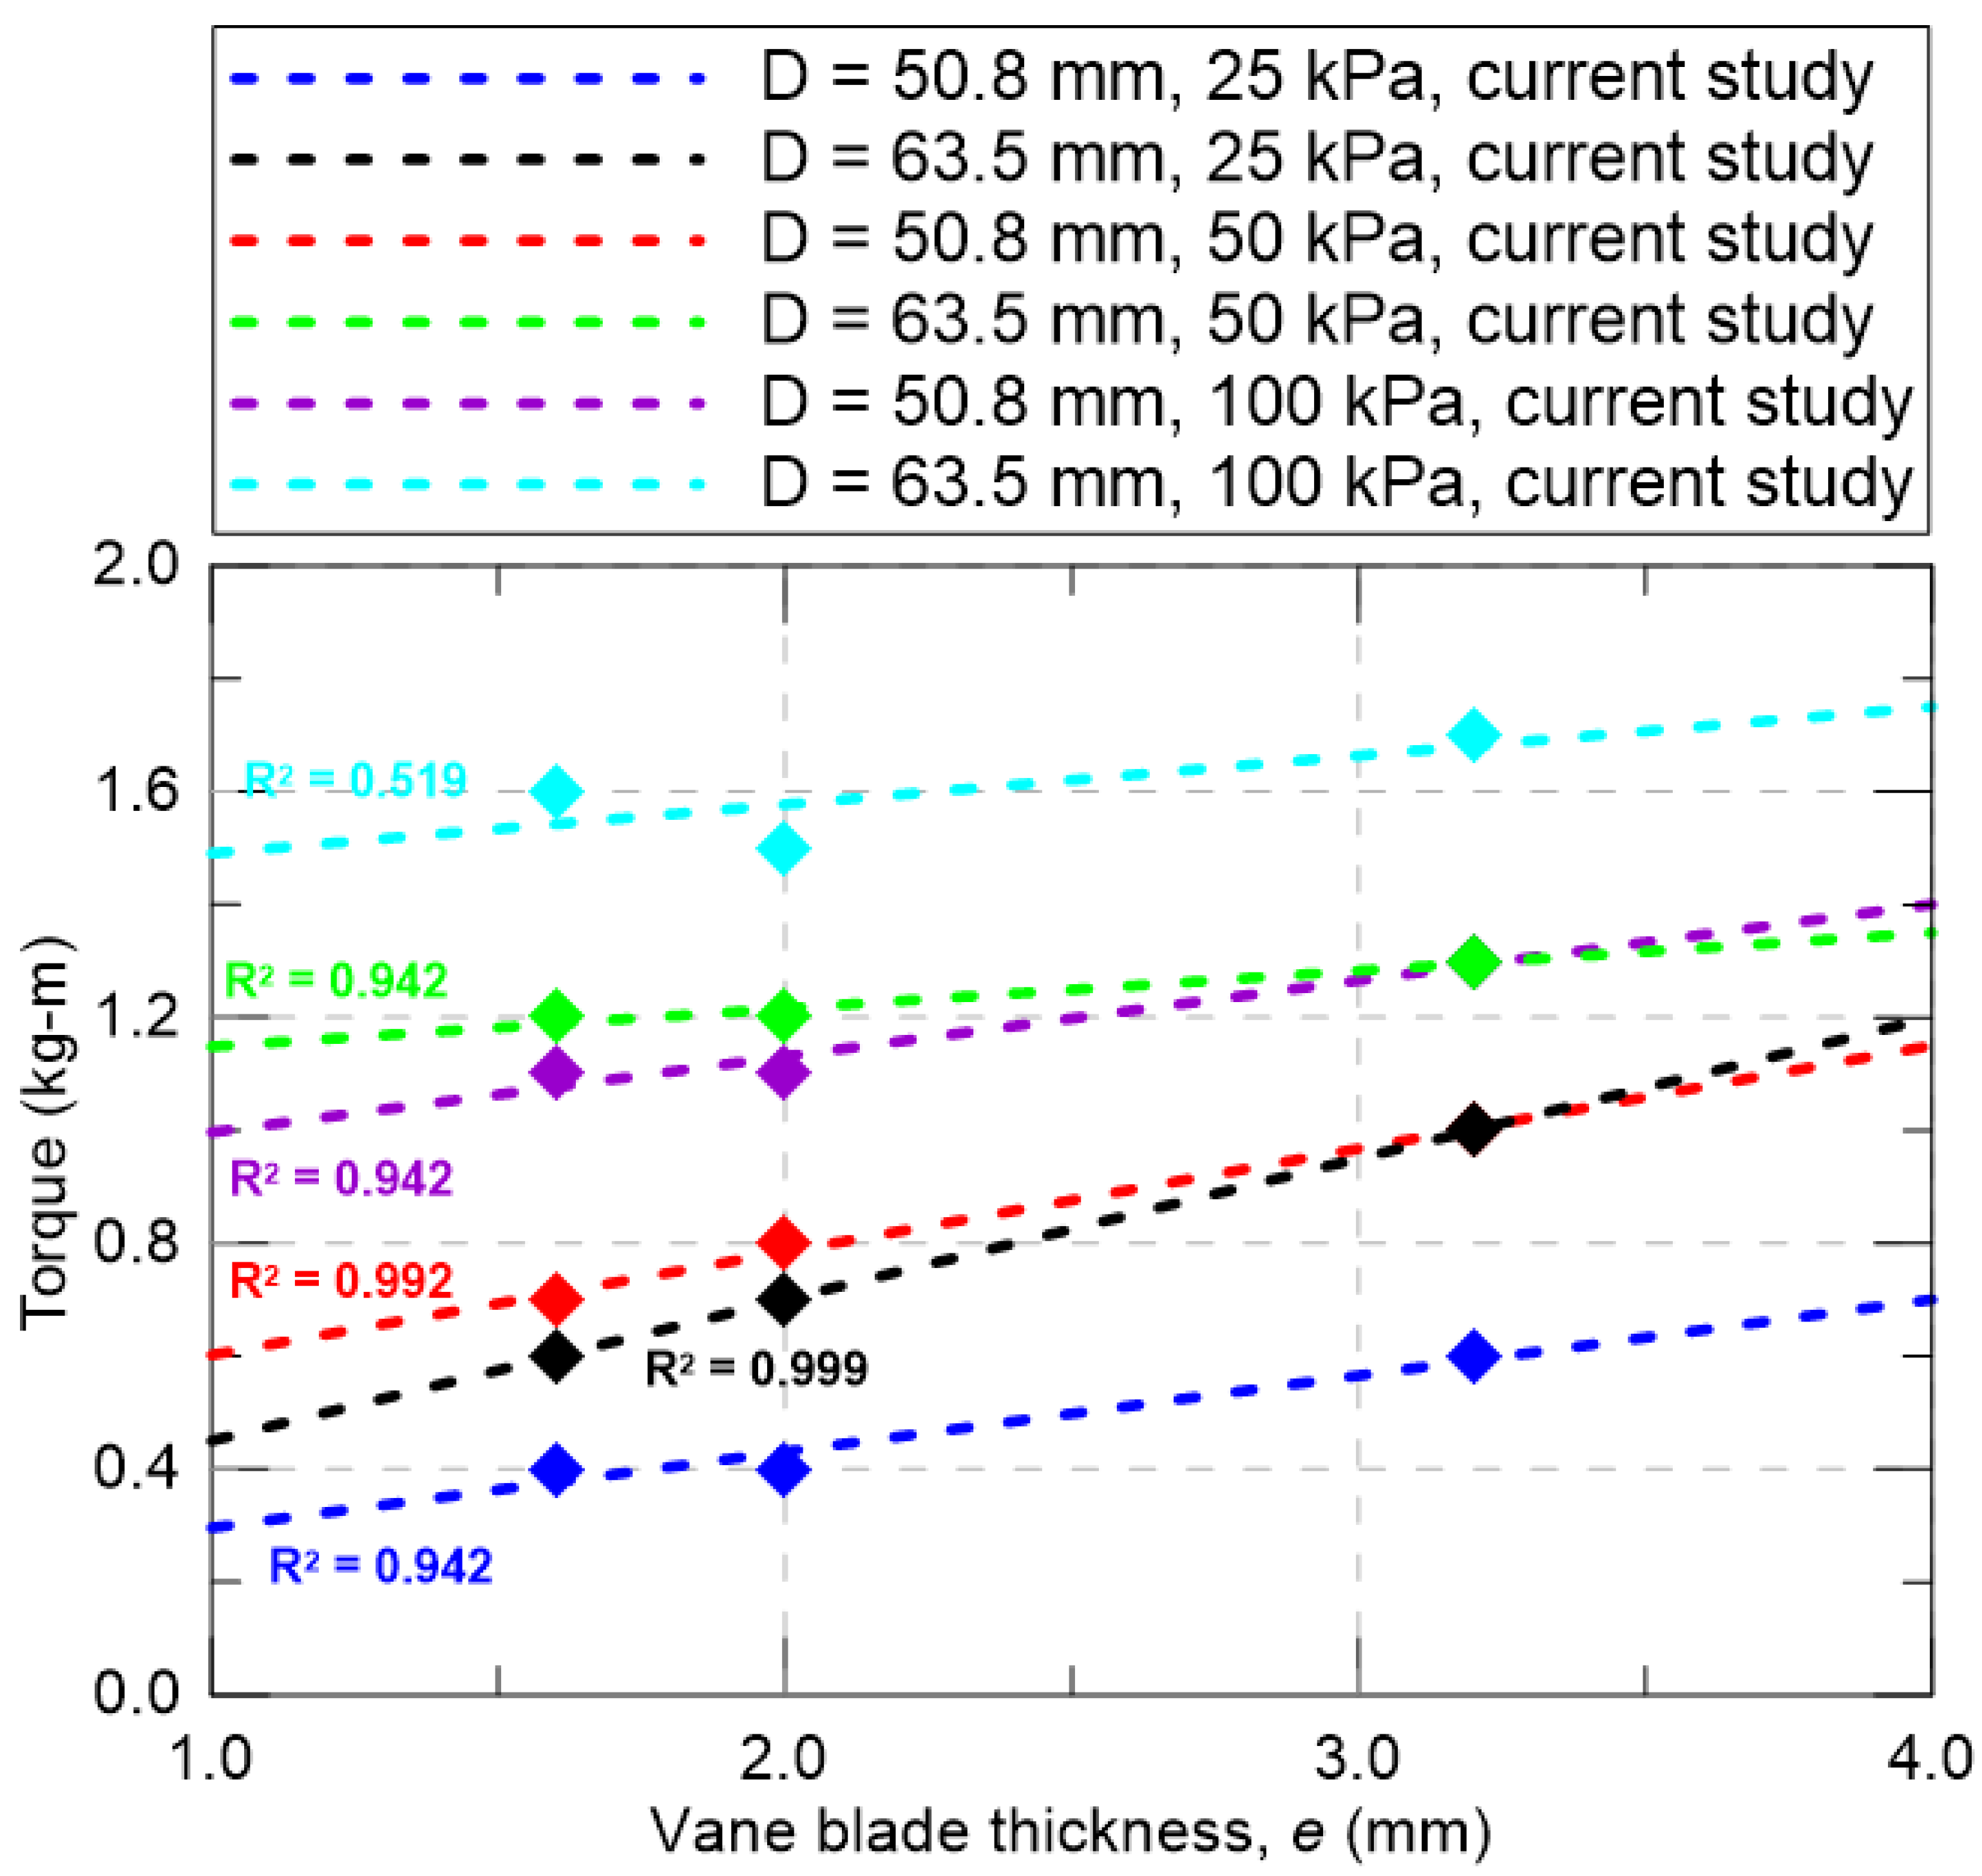
It is logical to expect that the relationship between torque and vane blade thickness will be examined, as previous studies have shown that disturbances can affect torque measurements and, consequently, the undrained shear strength. As illustrated in Figure 15, an increase in vane thickness, which represents the disturbance, correlates with an increase in torque. However, a comprehensive analysis should consider all factors involved in the investigation, including disturbance, torque, and preconsolidation stress.
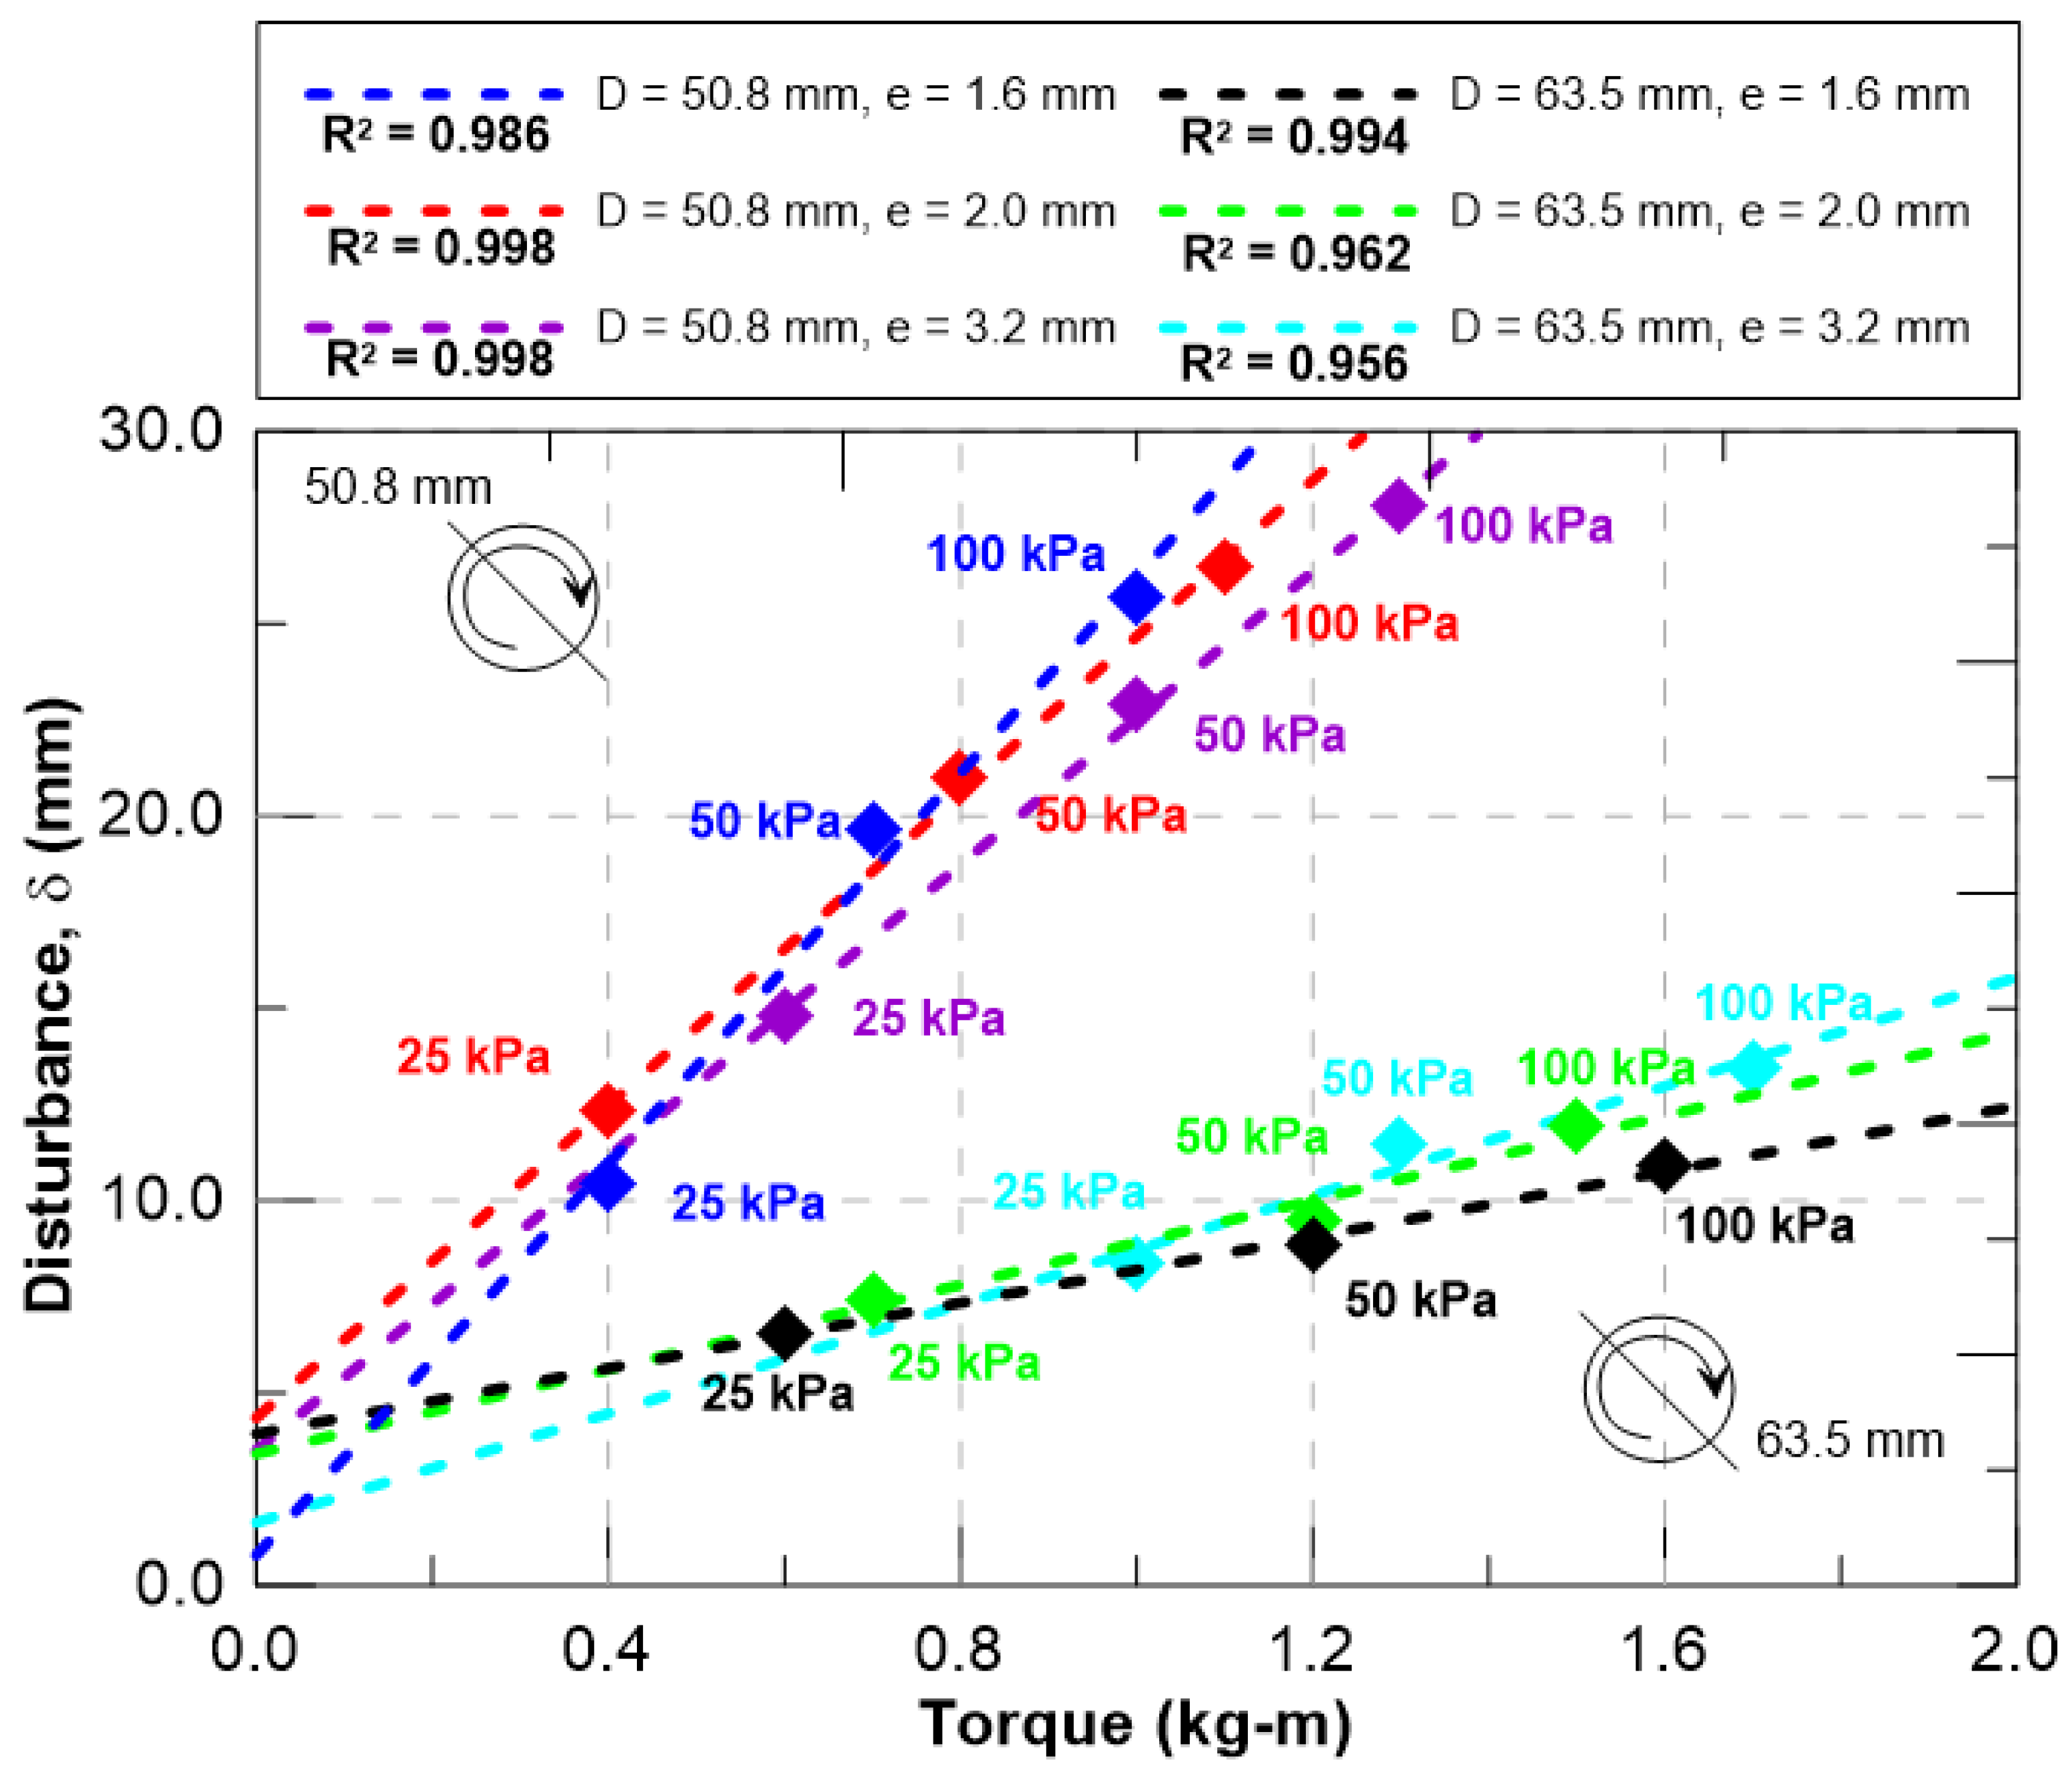
The tests were performed by manual methodology, following, in any case, the indications of [10]. Emphasis was placed on maintaining the rotational speed recommended by the reference standard. A torquemeter with an accuracy of +/− 1.0 kPa was used. The key focus of the research is to examine the relationship between torque and disturbance, while also considering two additional factors: the preconsolidation stress of the samples and the thickness of the blades. Figure 16 illustrates how disturbance varies as a function of torque. The results indicate a proportional increase in correlation between the two variables. Additionally, the increase in preconsolidation stress plays a significant role in this phenomenon. It was also observed that the smaller diameter vane, as expected, exhibits a lower response to torque.
Now, it is necessary to compare the results of the material’s undrained resistance, obtained by the correlation suggested by the standard D2573 [10], as can be seen in the following equation.
Su = (6Tmax) (7π D3)
Tmax is the torque obtained in the reconstituted samples at different preconsolidation stresses, since some blocks were built to perform the vane tests and others for sampling with thin-walled Shelby-type tubes that comply with less than 10% area ratio. Table 4 shows the undrained shear strength results from the VST’s correlation and the unconfined compression test (UC).
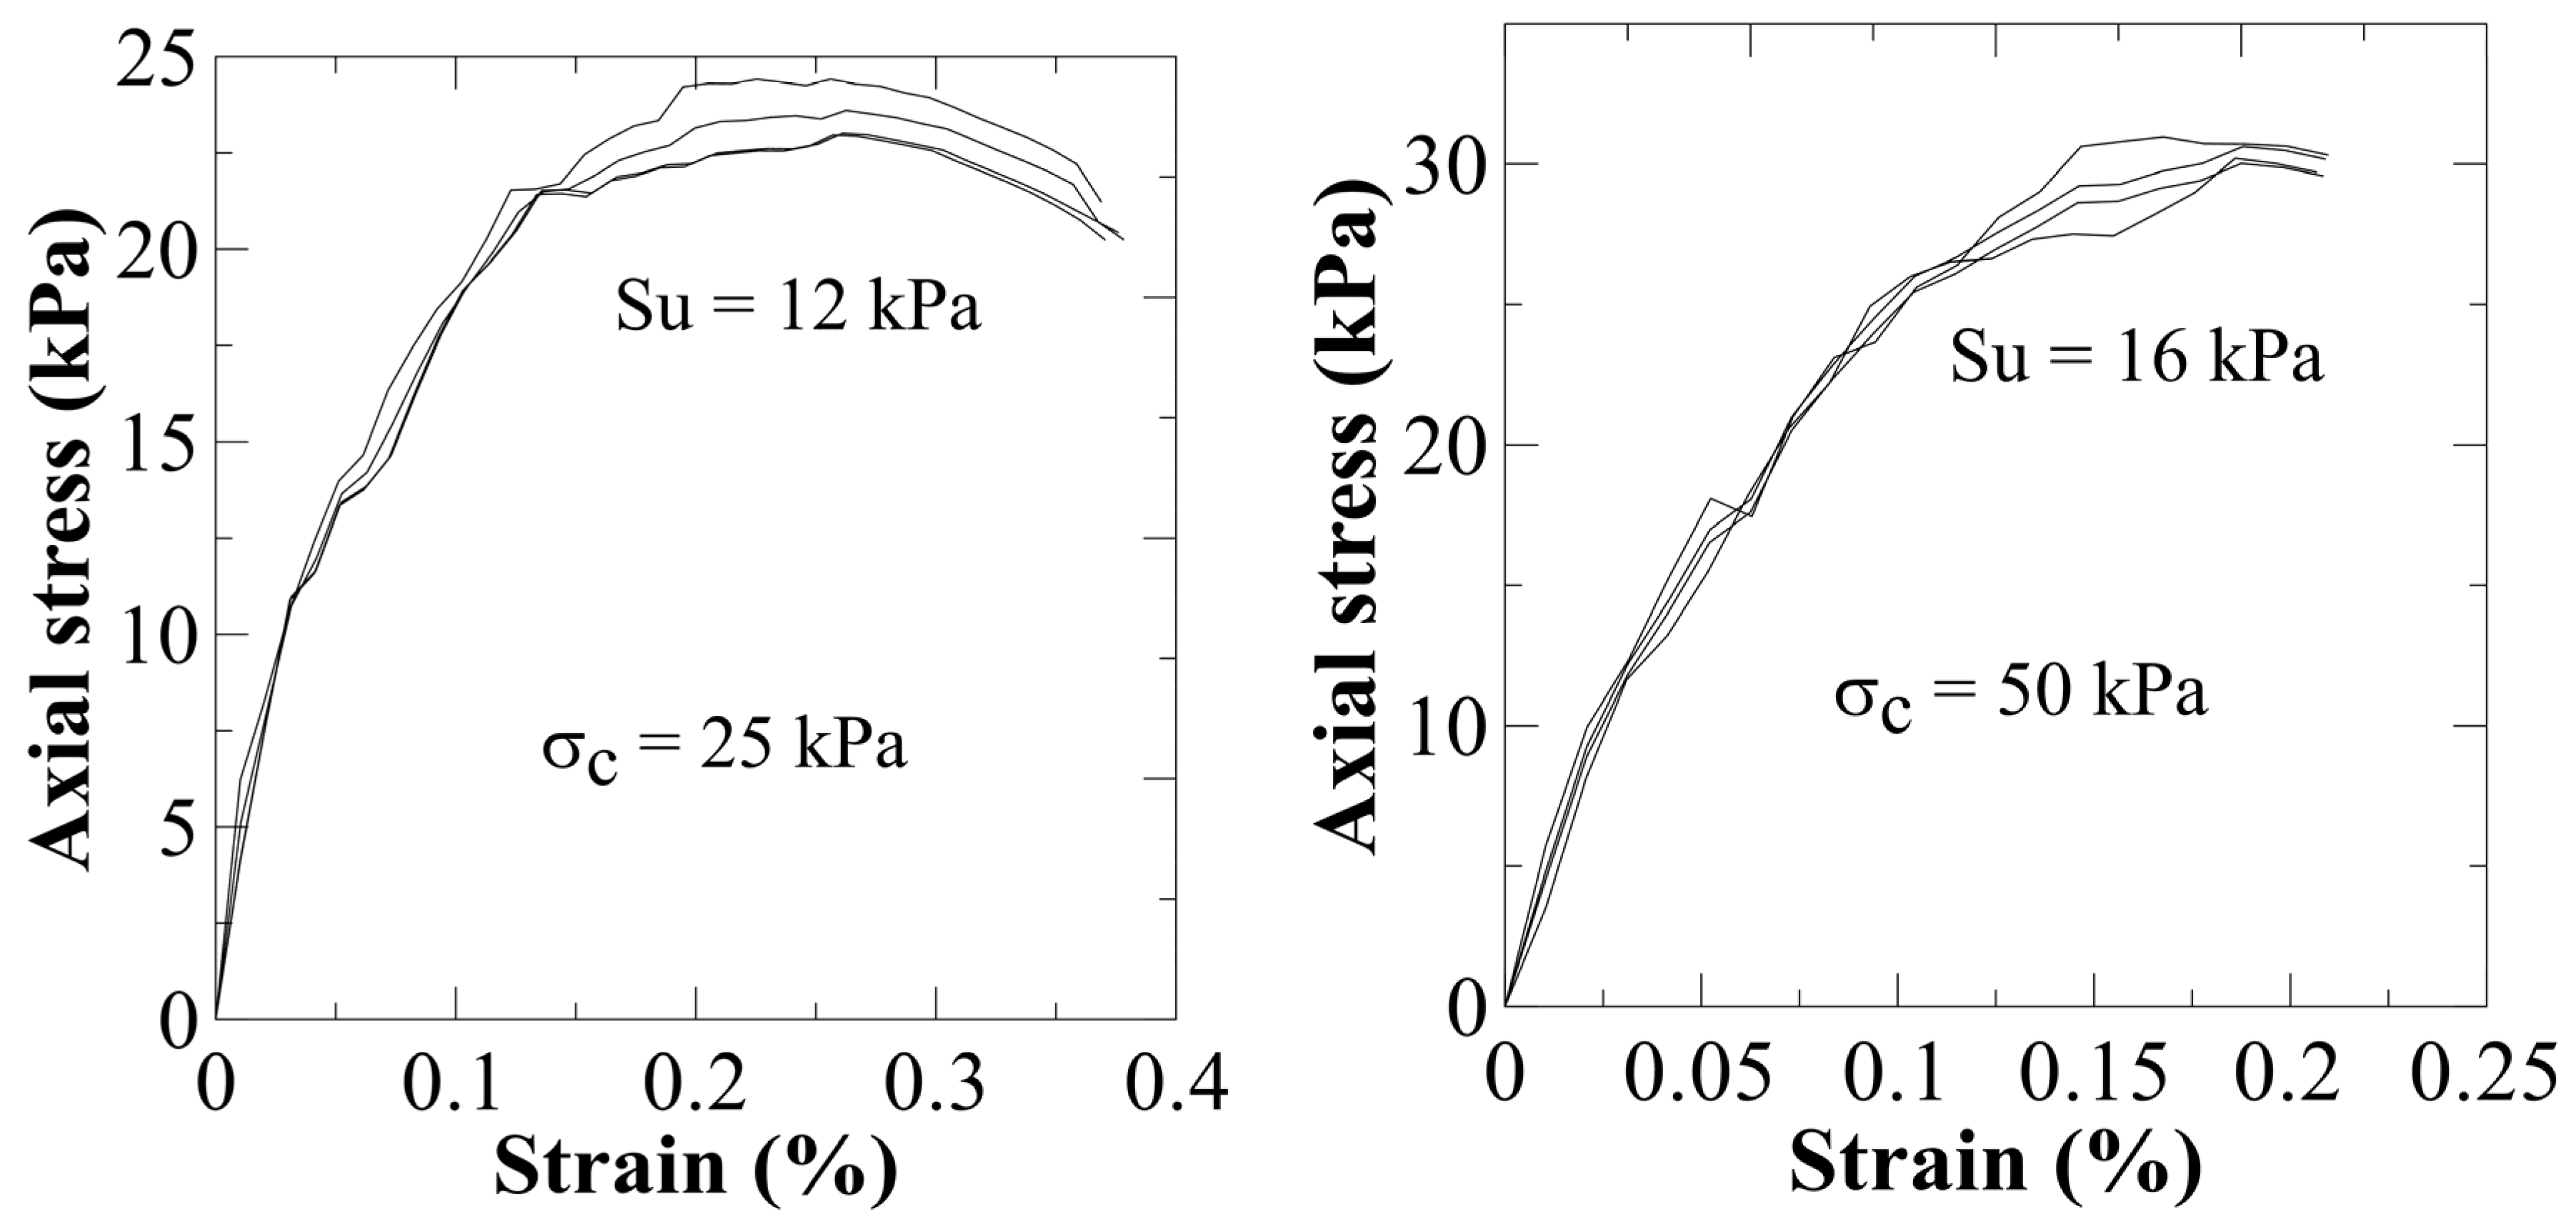
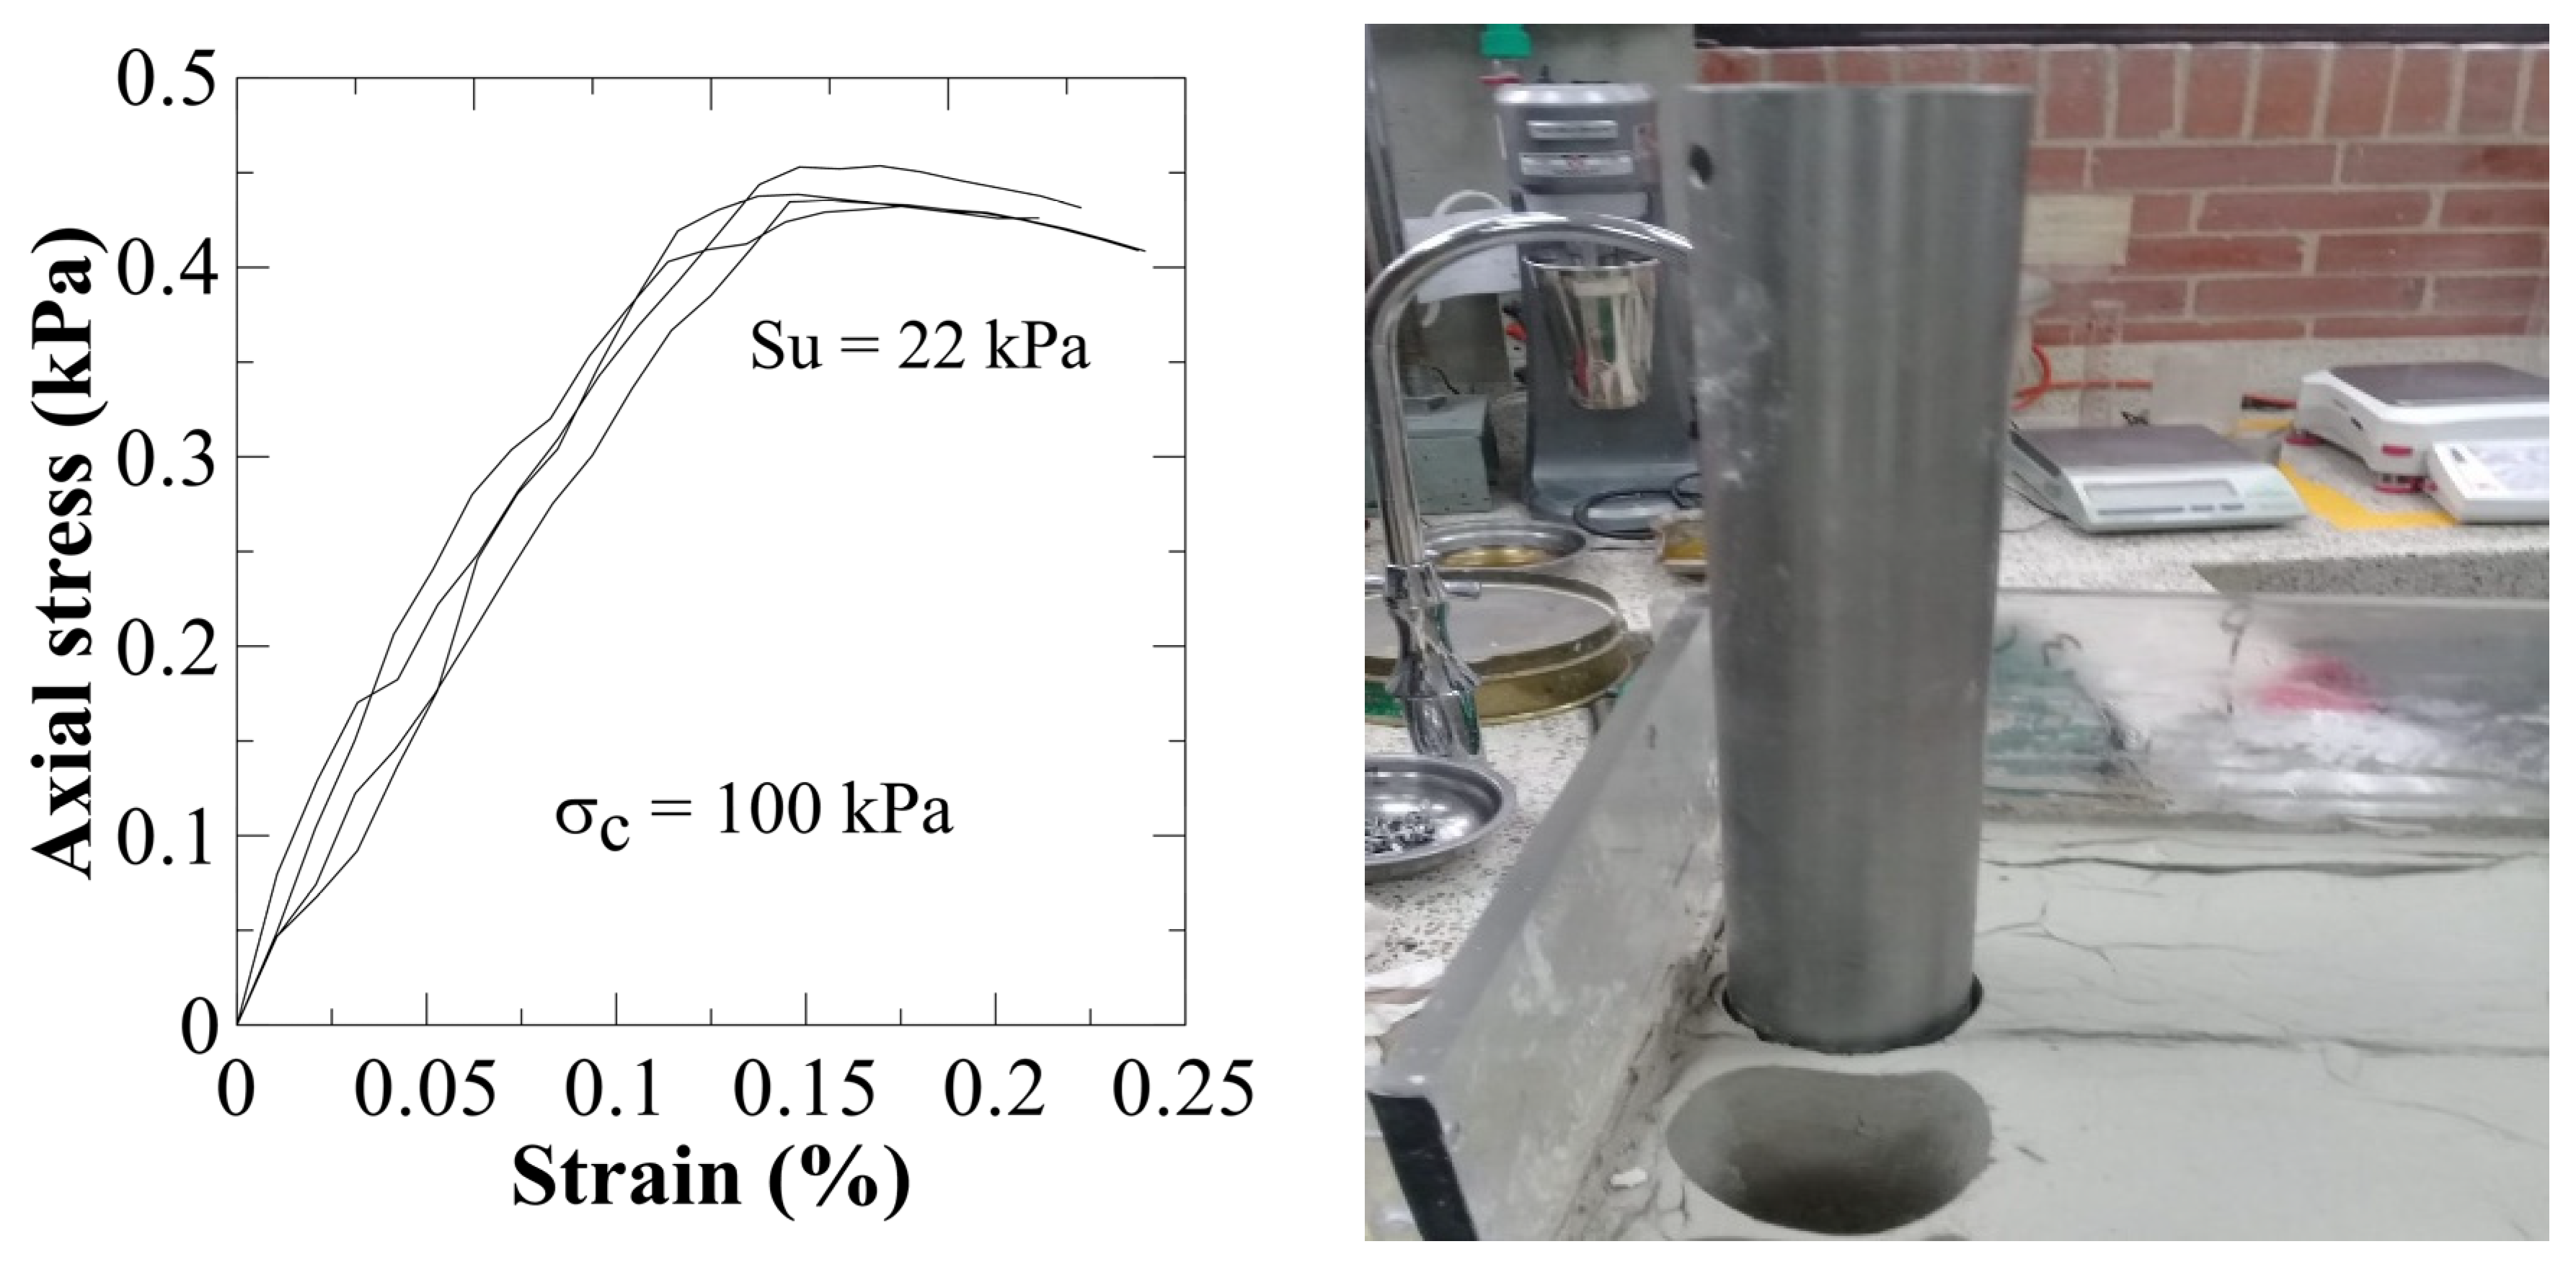
As for the specimens obtained under different preconsolidation stresses, Figure 17 shows the plots of the unconfined compression results for reconstituted block specimens at preconsolidation stresses under the same conditions as the built specimens where the VSTs were executed. The undrained strength averaged for the specimens with preconsolidation stresses of 25, 50, and 100 kN/m2 yielded Su values of 12, 16, and 22 kN/m2, respectively.
In general, it can be noted that the conducted VST tends to underestimate the undrained strength, particularly for samples preconsolidated at 25 kPa. This discrepancy is likely due to the softness of samples consolidated at such a low pressure, which makes it challenging to obtain reliable torque measurements. In contrast, the remaining results show that the correlated values align more closely with the measured values; this is attributable to the greater reliability of torque measurements in stiffer samples.
Initially, it appears that disturbances do not significantly impact torque measurement. Although a slight increase in touch effort is theoretically observed, this observation is not definitive. More comprehensive studies involving a variety of materials and different types of disturbances are necessary to draw a conclusive understanding of this issue.
Our study, in line with the findings of Cerato & Lutteneger [18], establishes a direct relationship between Su and vane thickness, with perimeter ratios falling within the 3% to 12% range. The data reveal that the maximum resistances measured are inversely proportional to the vane perimeter ratio, a key insight that has practical implications. This aspect was also observed in our study, where vanes with greater vane thickness were found to generate higher torques and undrained strength values, highlighting the practical relevance of our research.

5. Conclusions

By inducing blade thicknesses that do not comply with the vane area ratio (VA) and using reconstituted samples at various stress levels, this paper effectively analysed the potential relationship between disturbance, stress history, and undrained strength measured from the vane torque.
Initially, a correlation was observed that supports the hypothesis put forth by Cadling & Odenstad [7]. This conclusion indicates that greater vane blade thickness results in increased soil disturbance. Conversely, as the diameter of the vanes increases, the level of disturbance decreases, as illustrated in Figure 13. Notably, the theoretical disturbance (α) does not account for the variations in disturbance that depend on soil consolidation. This has been investigated in reconstituted clayey samples, providing relevant insights into the testing performance.
The examination of different consolidation stresses in the kaolin samples led to a clear conclusion: higher consolidation stress correlates with greater disturbance caused by vane insertion (Figure 14). This increase likely results from the force required to drive the vane into the soil; as the soil becomes more compact, more force is needed. This hypothesis, emerging from this research, could be explored in greater detail in future studies that address the evaluation of a wider range of preconsolidation pressures and the proposed procedure in natural clayey soil deposits, including sensitive and structured clays.
Another noteworthy aspect uncovered in this research pertains to the torques that the samples can resist after blade insertion, prior to shear failure. These data are summarised in Figure 16 and Table 3. A direct relationship can be established between disturbance and torque: greater disturbance in the sample corresponds to higher torque values. However, this relationship may also be influenced by the expansion of the vane blade. Interestingly, while the 63.5 mm vane exhibits lower disturbance values, it shows higher torque readings than the 50.8 mm vane. This discrepancy may be attributed to the vane’s geometry and the increased blade thickness, which generates significant torque moments.
Additional findings from the imaging analysis may also be relevant to this investigation. During the evaluation of images taken after vane insertion, we were able to observe the deformations and displacements caused by the vane. By analysing these displacements through contour description, we could appreciate a graphic representation of the failure zone, which will later be evident when calculating the undrained shear strength of the soil. Notably, this failure zone is apparent before torque application, indicating that the insertion of the vane into the soil brings it to stiffness values very close to failure.

Author Contributions

Conceptualization, J.C.R. and D.C.-R.; methodology, J.C.R., D.C.-R. and F.M.-G.; validation, J.C.R., D.C.-R., F.M.-G. and R.P.d.C.; formal analysis, J.C.R., D.C.-R., F.M.-G. and R.P.d.C.; investigation, J.C.R., D.C.-R., F.M.-G. and D.M.-S.; data curation, J.C.R. and D.C.-R.; writing—original draft preparation, J.C.R., D.C.-R. and D.M.-S.; writing—review and editing, J.C.R., D.C.-R., F.M.-G. and D.M.-S.; supervision, J.C.R., D.C.-R. and F.M.-G.; project administration, J.C.R.; funding acquisition, F.M.-G. All authors have read and agreed to the published version of the manuscript.

Funding

This research received no external funding.

Institutional Review Board Statement

Not applicable.

Informed Consent Statement

Not applicable.

Data Availability Statement

Dataset available on request from the authors.

Acknowledgments

The authors would like to deeply thank engineer Eduardo Dulcey-Leal for his collaboration in the execution of the experimental plan.

Conflicts of Interest

The authors declare no conflicts of interest.

References

  1. Suárez, J. Deslizamientos Análisis Geotécnico; Universidad Industrial de Santander—UIS: Santander, Colombia, 2009; Volume 1. (In Spanish) [Google Scholar]
  2. D4648; Standard Test Methods for Laboratory Miniature Vane Shear Test for Saturated Fine-Grained Clayey Soil. ASTM International: West Conshohocken, PA, USA, 2024.
  3. Chandler, R.J. The In-Situ Measurement of the Undrained Shear Strength. In Vane Shear Strength Testing in Soils: Field and Laboratory; ASTM: West Conshohocken, PA, USA, 1988; pp. 13–44. [Google Scholar]
  4. Carreño, J. Evaluación de la Anisotropía de Materiales Arcillosos Reconstituidos en Laboratorio Mediante Parámetros Obtenidos del Ensayo de Consolidación Edométrica. Master’s Thesis, Universidad Militar Nueva Granada, Bogotá, Colombia, 2019. (In Spanish). [Google Scholar]
  5. López, E.; Lopez, G.; Dorado, R.; Diaz, F. Aplicación de correlación digital de imágenes para el análisis de problemas de contacto. An. Ing. Mecánica 2012, 11–19. (In Spanish). Available online: https://www.xixcnim.uji.es/CDActas/Documentos/ComunicacionesOrales/11-09.pdf?utm (accessed on 2 April 2025).
  6. Young, A.; McClelland, B.; Quiros, G. In-Situ Vane Shear Testing at Sea. In Vane Shear Strength Testing in Soils: Field and Laboratory; ASTM: West Conshohocken, PA, USA, 1988; pp. 46–67. [Google Scholar]
  7. Cadling, L.; Ondenstad, S. The Vane Borer. In Proceedings of the Royal Swedish Geotechnical Institute; Royal Swedish Geotechnical Institute: Stockholm, Sweden, 1948; pp. 1–87. [Google Scholar]
  8. Geise, J.M.; Hoope, J.T.; May, R.E. Design and offshore experience with an in-situ vane. In ASTM STP 104 Vane Shear Strength in Soils: Field and Laboratory Studies; Richards, A.F., Ed.; ASTM: West Conshohocken, PA, USA, 1988; pp. 318–338. [Google Scholar]
  9. Coutinho, R.Q.; Oliveira, A.T.J.; Oliveira, J.T. Palheta: Experiência, Tradição e Inovação; SEFE IV/BIC: São Paulo, Brazil, 2000; Volume 3, pp. 53–80. (In Portuguese) [Google Scholar]
  10. D2573; Standard Test Method for Field Vane Shear Test in Cohesive Soil. ASTM International: West Conshohocken, PA, USA, 2018.
  11. INV E-170; Ensayo de Corte Sobre Suelos Cohesivos. Instituto Nacional De Vias “INVIAS”: Bogotá, Colombia, 2007. (In Spanish)
  12. Skempton, A.W. The post-glacial clays of the Thames estuary at Tilbury and Shellhaven. In Proceedings of the 3rd ICSMFE, Zurich, Switzerland, 16–17 May 1953; pp. 302–308. [Google Scholar]
  13. Aas, G. A study of the effect of vane shape and rate of strain on the measured values of in-situ shear strength of clays. In Proceedings of the 6th ICSMFE, Montreal, QC, Canada, 8–15 September 1965; pp. 141–145. [Google Scholar]
  14. La Rochelle, P.; Roy, M.; Travenas, F. Field measurements of cohesion in Champlain clay. In Proceedings of the 8th International Conference on Soil Mechanics and Foundation Engineering, Moscow, Russia, 6–11 June 1973; pp. 229–236. [Google Scholar]
  15. Matsui, T.; Abe, N. Shear mechanism of vane test in soft clays. Soils Found. 1981, 21, 69–80. [Google Scholar] [CrossRef][Green Version]
  16. Roy, M.; Leblanc, A. Factors Affecting the Measurements and Interpretation of the Vane Strength in Soft Sensitive Clays. In Vane Shear Strength Testing in Soils: Field and Laboratory; ASTM International: West Conshohocken, PA, USA, 1988; pp. 117–128. [Google Scholar][Green Version]
  17. Pérez-Foguet, A.; Ledesma, A.; Huerta, A. Analysis of the vane test considering size and time effects. Int. J. Numer. Anal. Meth. Geomech. 1999, 23, 383–412. [Google Scholar] [CrossRef]
  18. Cerato, A.; Lutenegger, A. Disturbance Effects of Field Vane Tests in a Varved Clay; University of Massachusetts: Amherst, MA, USA, 2004. [Google Scholar]
  19. Torstensson, B.A. Time-Dependent Effects in the Field Vane Test. In Proceedings of the International Symposium on Soft Clay, Bangkok, Thailand, 5–7 July 1977; pp. 387–397. [Google Scholar]
  20. Morgenstern, N.R.; Tchalenko, J.S. Microscopic Structures in Kaolin Subjected to Direct Shear. Géotechnique 1967, 17, 309–328. [Google Scholar] [CrossRef]
  21. Blight, G.E. A Note on Field Vane Testing of Silty Soils. Can. Geotech. J. 1968, 5, 142–149. [Google Scholar] [CrossRef]
  22. Bjerrum, L. Problems of Soil Mechanics and Construction on Soft Clays. In Proceedings of the 8th International Conference on Soil Mechanics and Foundation Engineering, Moscow, Russia, 6–11 June 1973; pp. 111–159. [Google Scholar]
  23. Weisel, C.E. Some Factors Influencing In Situ Vane Test Results. In Proceedings of the 8th International Conference on Soil Mechanics and Foundation Engineering, Moscow, Russia, 6–11 June 1973. [Google Scholar]
  24. Silvestri, V.; Aubertin, M. Anisotropy and In-Situ Vane Tests. In Vane Shear Strength Testing in Soils: Field and Laboratory; ASTM: West Conshohocken, PA, USA, 1988; pp. 88–103. [Google Scholar]
  25. Resendiz Hernandez, J.; Palacios Pineda, L.M. Análisis de deformaciones unitarias en juntas soldadas utilizando correlación digital de imágenes. Rev. Ing. Mecánica 2017, 1, 10–19. (In Spanish) [Google Scholar]
  26. Saltos, K.G. Caracterización de Deformaciones Mecánicas Usando Correlación Digital de Imágenes; Universidad San Francisco De Quito Usfq: Quito, Ecuador, 2015. (In Spanish) [Google Scholar]
  27. Blaber, J.; Adair, B.; Antoniou, A. Ncorr: Open-source 2D digital image correlation MATLAB software. Exp. Mech. 2015, 55, 1105–1122. [Google Scholar] [CrossRef]
  28. Blaber, J.; Antoniou, A. Ncorr; Georgia Institute of Technology: Atlanta, GA, USA, 2018. [Google Scholar]
  29. Stanier, S.A.; Blaber, J.; Take, W.A.; White, D.J. Improved image-based deformation measurement for geotechnical applications. Can. Geotech. J. 2016, 53, 727–739. [Google Scholar] [CrossRef]
  30. Ruge, J.C.; Palacios, X.; Molina-Gómez, F.; Rojas Suárez, J.P. Mineralogical, Microstructural and Porosimetry Analysis in Three Different Clayey Soils. J. Phys. Conf. Ser. 2019, 1388, 012014. [Google Scholar] [CrossRef]
  31. Kimura, T.; Saitoh, K. Effect of disturbance due to insertion on vane shear strength of normally consolidated cohesive soils. Soils Found. 1983, 23, 113–124. [Google Scholar] [CrossRef] [PubMed][Green Version]
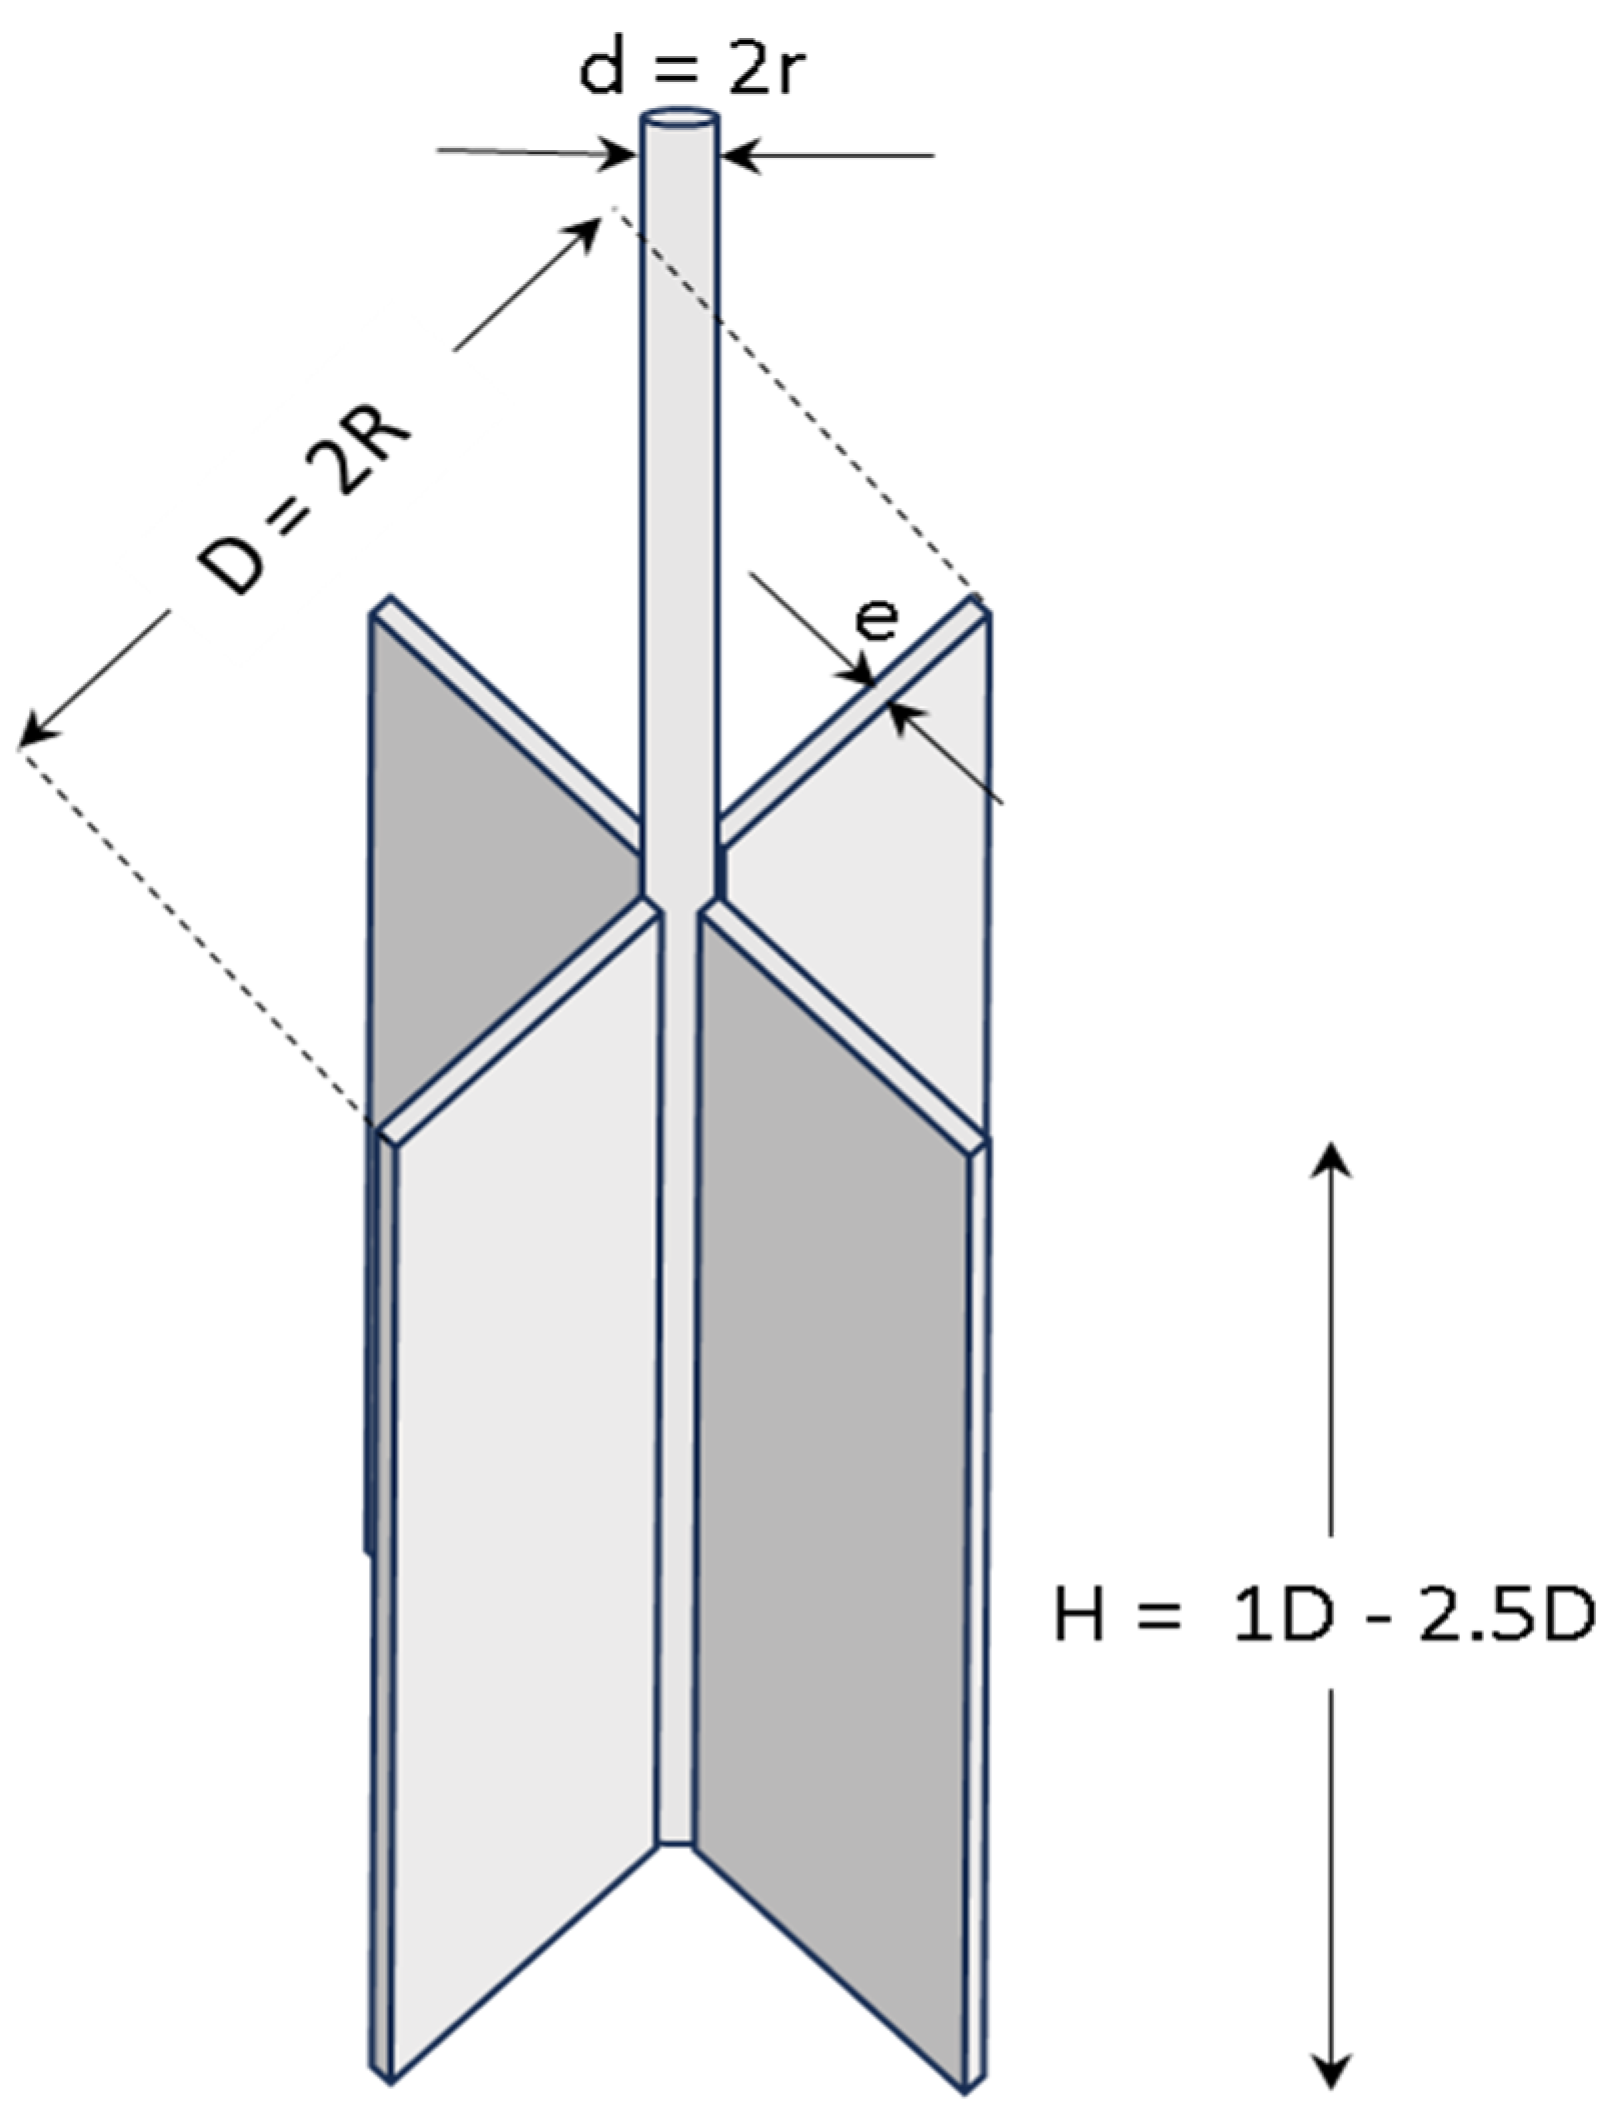
Figure 1. Vane geometry.
Geotechnics 05 00066 g001
Figure 2. Top view of a four-blade vane shear device showing disturbed soil zones around each blade; central shaft diameter marked as “d”, and blade thickness marked as “e”, with circular disturbance boundary.
Geotechnics 05 00066 g002
Figure 3. Pause effect in the VST.
Geotechnics 05 00066 g003
Figure 4. Composition of the kaolin.
Geotechnics 05 00066 g004
Figure 5. Particle size distribution of the material.
Geotechnics 05 00066 g005
Figure 6. Photograph of the shear vanes used in the study.
Geotechnics 05 00066 g006
Figure 7. Reference and current image using the open-source Ncorr.
Geotechnics 05 00066 g007
Figure 8. Selection of analysis region.
Geotechnics 05 00066 g008
Figure 9. The region of interest around the vane insertion.
Geotechnics 05 00066 g009
Figure 10. (a) Horizontal displacements. (b) Vertical displacements (cm).
Geotechnics 05 00066 g010
Figure 11. Example of disturbance area calculation.
Geotechnics 05 00066 g011
Figure 12. Disturbance (%) with respect to vane blade thickness [7].
Geotechnics 05 00066 g012
Figure 13. Percentage of disturbance with respect to preconsolidation stress of the samples [7].
Geotechnics 05 00066 g013
Figure 14. Vane shear test (VST) in the preconsolidated sample.
Geotechnics 05 00066 g014
Figure 15. Torque as a function of vane blade thickness.
Geotechnics 05 00066 g015
Figure 16. Torque as a function of disturbance (δ).
Geotechnics 05 00066 g016
Figure 17. Results of undrained shear strength by unconfined compression and sampling on the reconstituted specimen.
Geotechnics 05 00066 g017aGeotechnics 05 00066 g017b
Table 1. Internationally recognised standards for VST (modified and updated from Geise et al. [8] and Coutinho et al. [9]).
ParameterASTM
(2018)
AASHTO (2000)BS
(1990)
NGF
(1989)
SGF
(1995)
CEN
(1997)
NBR
(1989)
INVIAS (2013)
Vane geometryRectangular/taperedRectangular/taperedRectangularRectangularRectangularRectangularRectangularRectangular/tapered
H/D ratio1–2.52222221–2.5
Vane diameter, D (mm)35–10038.1/50.8/63.5/92.150/7555/6540–10040–10050/6535–100
Blade thickness, e (mm)1.52/3.181.59/2.0/3.18Not specified2.00.8–3.00.0–3.02 +/− 0.2<3.0
Vane shaft diameter, d = 2r (mm)12.5–16.511/20/12.713.012.0<14.0<16.013 +/− 112.5–16.5
Accuracy torque reading+/− 1.0 kPa (computed shear strength)+/− 1.2 kPa (computed shear strength)1% range (0–100 N-m)+/− 0.5% (scale end)+/− 0.5% (applied torque)+/− 0.5% (applied torque)2% (maximum torque in calibration)+/− 1.0 kPa (computed shear strength)
Torque impositionPreferably geared drive/acceptable by handPreferably geared drive/acceptable by handGeared drive/enginePreferably geared driveNot specifiedNot specified/slowly and continuouslyGeared drivePreferably geared drive/acceptable by hand
Vane area ratio<12%Not specified<12%<12%Not specifiedNot specified<12%<12%
Insertion depth5× diameter of the hole5× diameter of the hole3× diameter of the hole0.5 m5× diameter of the hole5× diameter of the hole/0.5 m>4× diameter of the hole/0.5 m5× diameter of the hole
Rotational rate0.1 °/s0.1 °/s6–12 °/min12 °/minNot specified6–12 °/min6 +/− 0.6 °/min<0.1 °/s
Time to failure (min)2.0–5.02.0–5.05.01.0–3.02.0–4.0Not specifiedNot specified2.0–5.0
Revolutions to remoulded strength5–101062520>10105–10
Time to remoulding process (min)<1.0<1.05.0<5.02.0–5.0Not specified<5.0<1.0
Test intervals (m)0.5–0.75Not specified0.50.5–1.0>5.0>0.5Not specified0.5–0.75
Table 2. Dimensions of shear vane instruments in Figure 6.
D (mm)H (mm)e (mm)d (mm)VA (%)Recommendation of VA < 12%
63.51271.612.79.13OK
63.51272.012.710.42OK
63.51273.212.714.27Not OK
50.81021.612.712.27Not OK
50.81022.012.713.77Not OK
50.81023.212.718.28Not OK
Table 3. Area of disturbance generated by vanes with diameters of 63.5 mm and 50.8 mm.
D (mm)e (mm)α (%) aDA (mm2) bδ (%) c
σc = 25 kPa
63.51.63.21208.206.6
63.52.04.01235.927.4
63.53.26.42265.088.4
50.81.64.01211.4810.4
50.82.05.01249.5212.3
50.83.28.02299.6414.8
σc = 50 kPa
63.51.63.21280.208.8
63.52.04.01300.929.5
63.53.26.42363.0811.5
50.81.64.01397.4819.6
50.82.05.01425.5221.0
50.83.28.02463.6422.9
σc = 100 kPa
63.51.63.21344.2010.9
63.52.04.01378.9212.0
63.53.26.42524.0816.5
50.81.64.01520.4825.7
50.82.05.01536.5226.5
50.83.28.02568.6428.1
a Disturbance from Cadling & Odenstad [7]. b Area of disturbance near to vane. c Disturbance from the current study.
Table 4. Comparison of correlated Su from the VST and Su obtained directly from the unconfined compression test.
D = 50.8 mmσc = 25 kPaσc = 50 kPaσc = 100 kPa
Blade Thickness (mm)Tmax
(kN-m)
Su (VST)
(kN/m2)
Su (UC)
(kN/m2)
Tmax
(kN-m)
Su (VST)
(kN/m2)
Su (UC)
(kN/m2)
Tmax
(kN-m)
Su (VST)
(kN/m2)
Su (UC)
(kN/m2)
1.60.0048.3212.00.00714.5716.00.01224.9722.0
2.00.0048.320.00816.650.01327.06
3.20.00612.490.0120.810.01429.14
D = 63.5 mm25 kPa50 kPa100 kPa
1.60.0066.3912.00.01212.7916.00.01617.0522.0
2.00.0077.460.01212.790.01515.98
3.20.0110.660.01313.850.01718.11
Disclaimer/Publisher’s Note: The statements, opinions and data contained in all publications are solely those of the individual author(s) and contributor(s) and not of MDPI and/or the editor(s). MDPI and/or the editor(s) disclaim responsibility for any injury to people or property resulting from any ideas, methods, instructions or products referred to in the content.