Article

Probabilistic Analysis of Soil Moisture Variability of Engineered Turf Cover Using High-Frequency Field Monitoring

by
Robi Sonkor Mozumder
1,†,
Maalvika Aggarwal
2,†,
Md Jobair Bin Alam
1,*,† and
Naima Rahman
3,†
1
Civil and Environmental Engineering, Prairie View A&M University, Prairie View, TX 77446, USA
2
Transportation Department, HNTB Corporation, Houston, TX 77002, USA
3
Engineering Division, SCS Engineers, Houston, TX 77077, USA
*
Author to whom correspondence should be addressed.
These authors contributed equally to this work.
Geotechnics 2025, 5(3), 64; https://doi.org/10.3390/geotechnics5030064 (registering DOI)
Submission received: 29 June 2025 / Revised: 19 August 2025 / Accepted: 2 September 2025 / Published: 6 September 2025

Abstract

Soil moisture is one of the key hydrologic components indicating the performance of landfill final covers. Conventional compacted clay (CC) covers and evapotranspiration (ET) covers often suffer from moisture-induced stresses, such as desiccation cracking and irreversible hydraulic conductivity. Engineered turf (EnT) cover systems have been introduced recently as an alternative; however, their field-scale moisture distribution behavior remains unexplored. This study investigates and compares the soil moisture distribution characteristics of EnT, ET, and CC landfill covers at a shallow depth using one year of field-monitored data in a humid subtropical region. Three full-scale test Sections (3 m × 3 m × 1.2 m) were constructed side by side and instrumented with moisture sensors at a depth of 0.3 m. Distributional characteristics of moisture were evaluated with descriptive statistics, goodness-of-fit tests such as Shapiro–Wilk (SW) and Anderson–Darling (AD), Gaussian probability density functions, Q–Q plots, and standard-normal transformations. Results revealed that Shapiro–Wilk (W = 0.75–0.92, p < 0.001) and Anderson–Darling ( A 2 = 1.63 × 10 3 to 6.31 × 10 3 , p < 0.001 ) tests rejected normality for every cover, while Levene’s test showed unequal variances between EnT and the other covers ( F > 5.4 × 10 4 , p < 0.001 ) but equivalence between CC and ET (F = 0.23, p = 0.628). EnT cover exhibited the narrowest moisture envelope ( 95 % range = 0.156 to 0.240 m 3 / m 3 ; CV = 10.6 % ) , whereas ET and CC covers showed markedly broader distributions (CV = 38.6 % and 33.3 %, respectively). These findings demonstrated that EnT cover maintains a more stable shallow soil moisture profile under dynamic weather conditions.

1. Introduction

The final cover of a landfill is a multi-layered system made of varied materials. To isolate solid waste from the environment, minimize precipitation infiltration, and limit fugitive gas emissions, the landfill’s final cover is built over landfills [1]. The final cover components can range from a simple single-layer system to a complicated multi-layer system, depending on the final cover’s intended use. The Resource Conservation and Recovery Act (RCRA) of 1976 typically recommends the construction of a compacted clay (CC) layer with low hydraulic conductivity (typical range between 1 × 10⁻⁵ cm/s and 1 × 10⁻⁹ cm/s depending on the material type and construction method), which serves as a barrier layer, also referred to as the resistive layer [2], to prevent the infiltration of precipitation. The most significant drawback of this type of cover is the climate-induced recurring wetting–drying of the soil, resulting in soil moisture variabilities, which leads to the formation of desiccation cracks. The development of cracks leads to uncontrolled water flux and irreversible changes in the hydraulic characteristics of compacted clay [3]. Therefore, the soil’s moisture variability because of climatic changes contributes to the compacted clay cover’s impaired performance. As a result, compacted clay covers frequently fall short of their goal of limiting precipitation infiltration. Furthermore, conventional covers are not only expensive but also challenging to construct to retain their performance standards [4].
Water balance cover, also known as evapotranspiration (ET) cover, has been an alternative to the conventional cover system due to its improved performance. The fundamental idea of the ET cover is to capture precipitation during rainfall and release it to the environment through evapotranspiration during the dry season [5,6]. It is a cost-effective solution for waste containment [7]. Most notably, the performance of ET covers improves over time [5]. However, site-specific considerations play a significant role in how well ET covers operate. The post-construction natural processes, such as freeze–thaw cycling, wet–dry cycling, plant root growth, and animal burrowing, significantly change the hydraulic properties of the soil (such as hydraulic conductivity, soil water characteristic curve), which in turn affects the cover hydrology [8,9]. As a result, the percolation rate is affected by the altered hydraulic characteristics of ET cover soils over time [10,11,12]. ET covers often fall short in terms of preventing moisture ingress and percolation.
The USEPA also permits alternative designs, such as the Capillary Barrier System (CBS), provided that they achieve equivalent levels of infiltration control and erosion protection [13]. The CBSs are two-layer engineered soils, specifically constructed to limit water infiltration into lower layers due to differences in hydraulic properties between an upper finer-grained layer and lower coarser-grained layer [14,15,16]. Water is stored in the upper layer or diverted laterally along the interface. However, once saturation is attained, water will be able to infiltrate through the barrier and move into the lower layer [14,17]. Though CBSs offer a cost-effective solution to minimize infiltration, the performance of the CBS remains dependent on site-specific factors. Engineered turf (EnT) covers have recently been introduced to address the drawbacks of existing landfill cover systems. EnT covers are becoming popular with landfill operators because they are simple to install, can be used on steep slopes, cost less to build and operate, and require little maintenance. However, thorough field investigations on its ability to retain moisture equilibrium and to validate its long-term sustainable performance are required [18].
Soil moisture is a significant link between climatic conditions and spatio-temporal fluctuations [19,20]. In the context of landfill covers, the soil moisture variability under varying climatic conditions is particularly crucial for sustainable landfill closure. For example, a high soil moisture value in the ET cover indicates that the stored water is approaching its storage capacity, thereby increasing the potential for percolation [21]. Also, for a better numerical modeling outcome of ET covers, it is crucial to know soil moisture variabilities [22]. For a compacted clay cover, the degree of moisture variability may dictate the extent of desiccation crack formation in the field. While many studies focus on the overall infiltration control of landfill covers, failures often originate from moisture-induced instability in the near-surface zone [5,23]. This critical layer is most susceptible to atmospheric fluxes, which can lead to performance degradation like desiccation cracking, saturation-induced percolation, etc. [24,25]. Therefore, understanding and characterizing the moisture dynamics within this zone is paramount for predicting long-term stability.
In landfill cover hydrology and geotechnical design, deterministic approaches are often favored for their simplicity. However, such methods may overlook the inherent natural variability and uncertainty in field conditions [26]. In contrast, probabilistic approaches explicitly incorporate uncertainty, enabling more scientifically transparent and robust analyses. By quantifying the range and likelihood of possible outcomes, they provide deeper insight into both measurement variability and model performance [27]. The dataset related to the soil moisture variability under an engineered turf at variable environmental conditions is minimal. Despite the critical need for a thorough understanding of the moisture variability of EnT cover, a limited number of systematic field studies evaluating the moisture variability have been conducted [28]. While studies have documented comparisons between CC and ET covers [29,30], the inclusion of EnT covers in the same analytical framework remains absent. However, studies evaluated the performance of the EnT cover as an alternative to traditional covers but lack direct comparisons with both the CC and ET systems [31]. To fill this gap, a field study was conducted in South Central Texas, where three side-by-side test landfill covers (CC, ET, and EnT) of dimensions 3 m × 3 m × 1.2 m were constructed. The objective of this study was to statistically characterize and compare the soil moisture distribution of these three test covers at shallow depth using yearlong of high-frequency field-monitored data. To pursue the objective, moisture sensors were installed at a depth of 0.3 m in all the test landfill covers. Data normality was assessed using the Shapiro–Wilk and Anderson–Darling tests (p < 0.001), and homogeneity of variance by Levene’s test. In addition, the normality was also assessed using descriptive statistics, histograms, and quantile–quantile plots. The Gaussian distribution theorem was then applied to the data for standardization to a standard normal distribution (SND) to establish a uniform framework for investigating data variability across covers at the same depth. The Gaussian framework was applied solely for comparative purposes, even though the data normality tests revealed the data to be non-normal.

2. Materials and Methods

The study was conducted at the Research Demonstration Farm of Prairie View A&M University, Prairie View, Texas, USA, which is climatologically a subtropical region of South Texas. The details of construction, instrumentation, and analytical procedure are presented in the following sub-sections.

2.1. Construction of Test Section

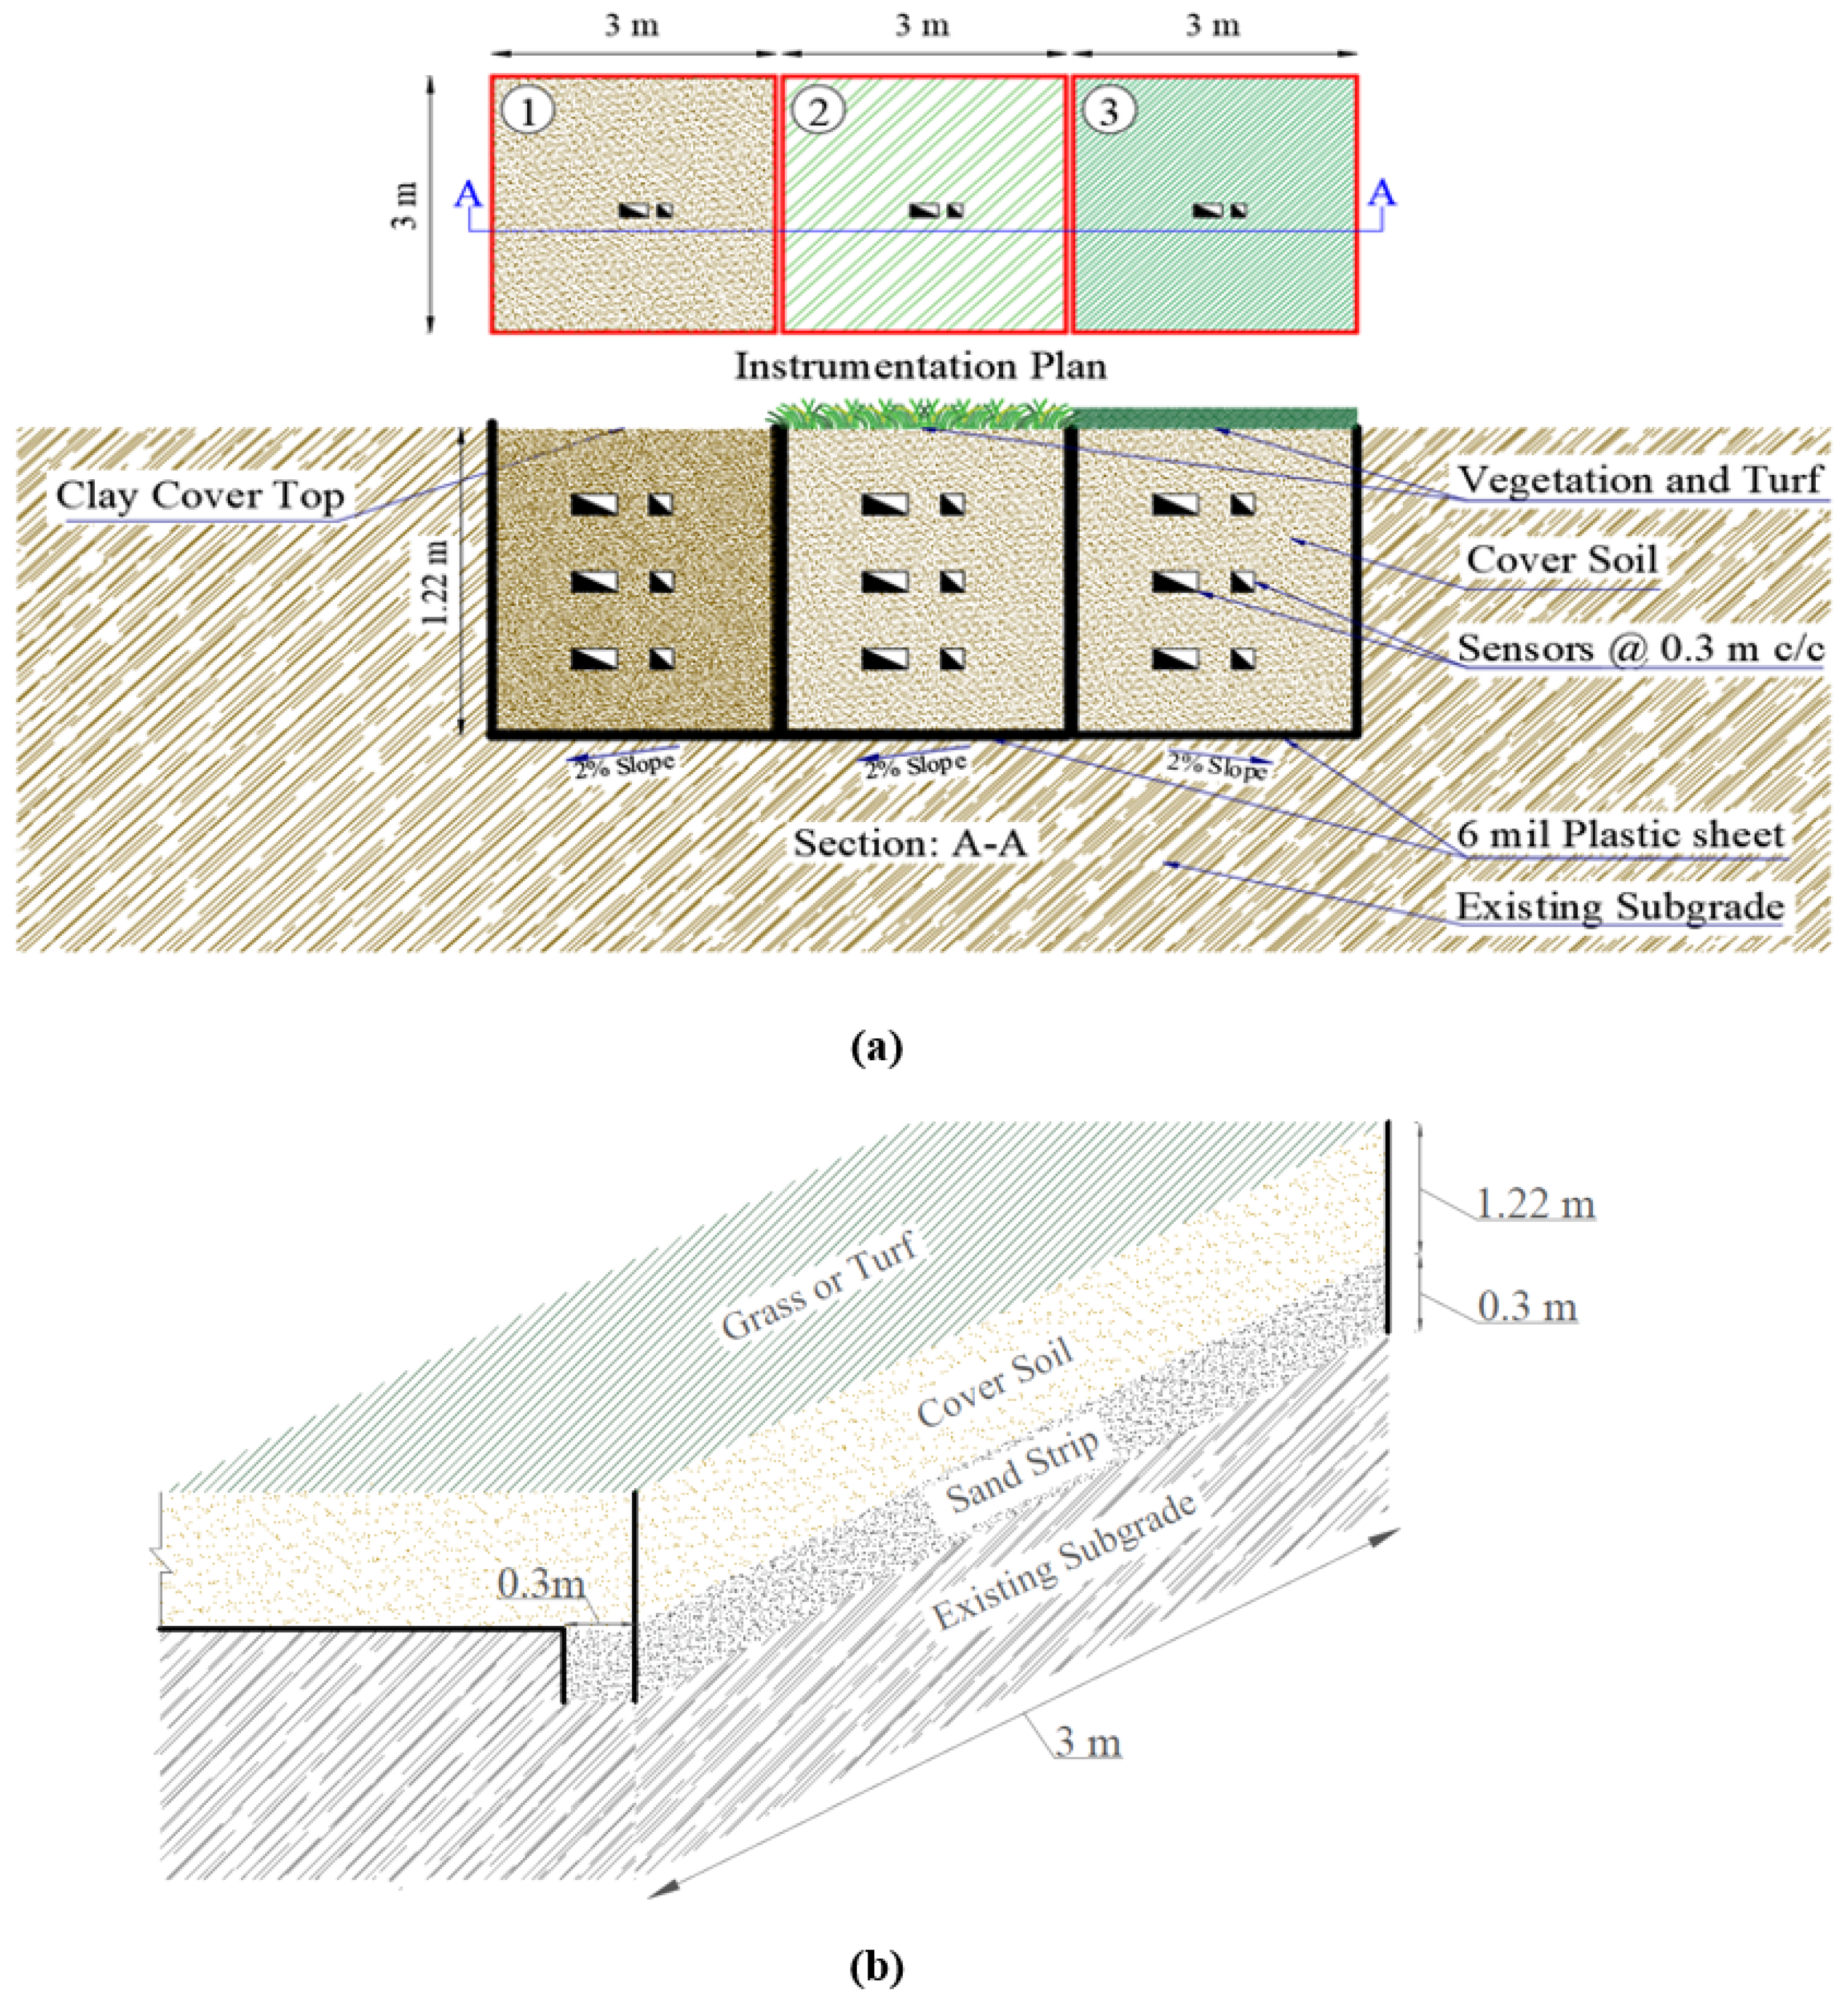
Three large-scale test sections were built by excavating the existing subgrade of the study area (Figure 1a), each measuring 3 m × 3 m (10 ft × 10 ft) and 1.22 m (4 ft) deep. One test section is the CC cover, one is the ET cover using native grass, and one is the EnT cover. The existing subgrade, where the test sections were constructed, consists of fine-grained soil. The test sections were built side by side (Figure 1a) so that each test section would experience identical weather conditions. Each test section’s subgrade was covered with a 1.524 × 10 4 m (6-mil) impermeable plastic sheet after the test pit was excavated. To prevent intrasection moisture flow, the plastic sheet was also positioned along the sidewall of the excavation and extended 0.6 m (runout length) along the top surface. A 2% slope was retained at the excavation bottom to allow water to move gravitationally toward the sloping end. A sand strip was added to the sloping end. The instrumentation section provides information about the sand strip. Field covers’ detailed configurations and sensor deployment details are provided in Table 1. The coarse sand’s hydraulic conductivity used in the sand strip, as determined by a laboratory-measured constant head permeability test, was roughly 1 × 10⁻¹ cm/s. The sand strip was necessary to stop the water from building up at the bottom of the excavation. The sharp contrast between the permeabilities of the coarse sand and the compacted backfilled fine-grained soil could divert water away from the test section after significant rainfall events.
All the test sections were backfilled with the excavated fine-grained soil (Figure 1b) and compacted after the plastic sheet and sand strip were put in place. The CC and EnT covers were compacted at 95% of the maximum dry density (MDD). However, a lower compaction effort (compared to the CC and EnT cover) was ensured for the ET cover soil to preserve its core functions: enhancing soil storage capacity, reducing the potential for desiccation cracking and freeze–thaw effects [32], and promoting efficient root growth for sufficient transpiration. During excavation, soil samples were collected from all the test sections. These samples were characterized in the laboratory following the American Society for Testing and Materials (ASTM) standard. Several days after the backfilling, all test pits were instrumented to monitor soil moisture. The details of field instrumentation are provided in the Instrumentation section. After the instrumentation of the test sections and smoothening of the top surface, a structured LLDPE geomembrane (Figure 1c) was placed over the EnT cover, which was overlain by synthetic turf. The synthetic turf (Figure 1d) contained polyethylene fibers tufted through a double layer of woven polypropylene geotextiles and sand infill.
The CC cover was left unseeded to preserve its low-permeability design function. However, incidental vegetation emergence (primarily grass) occurred several months after installation due to natural seed dispersion and germination. These plants were periodically removed as part of routine site maintenance. Although no formal root density measurements were taken, qualitative field observations indicated limited vegetation impact on the CC cover compared to the actively vegetated ET cover. The ET cover was seeded with local Bermuda grass (Cynodon dactylon), a warm-season perennial grass. Although direct root measurements were not made in this study, visual site inspection indicated root establishment within approximately six weeks after seeding.

2.2. Instrumentation

Moisture and temperature sensors (TEROS 11: Meter Group) were installed in all the test covers to monitor the changes in volumetric moisture content (VMC). To ensure the accuracy of the soil moisture data collected from the TEROS 11 sensors, a calibration curve was constructed before the installation of the sensors at the site. A standard calibration procedure [33] was adopted in this study. Initially, experimental methods were used to determine the moisture contents of different soil samples. In other words, the mass-based measurement of the moisture content was made using the weights of the soil samples both before and after oven drying. The mass-based moisture content was then converted to volumetric moisture content. The moisture contents of the same samples were recorded using TEROS 11 sensors. The calibration curve illustrated in Figure 2 was created by plotting the sensor output values against the experimental data. The calibration factor for the sensor readings was the slope of the plot. The moisture sensors were initially given approximately 10 days to acclimate to the surrounding soil environment. After this time, soil moisture data were retrieved and used for analysis and interpretation.
All the test covers were drilled using a 10.16 cm hand auger, and TEROS 11 sensors were inserted vertically at a depth of 0.3 m (from the ground surface). After installation, the holes were carefully backfilled and compacted with the excavated soil. The plan and section of the instrumentation are shown in Figure 3a. All the test sections were instrumented similarly to compare the performance of the three types of covers. The test sections’ sensors had an automatic data logging system. Every 5 min, the data loggers were set to record and store data. To assess how the site’s soil moisture changes in response to precipitation, a weather station was also installed at the site. The weather station also had an automatic data recording and storing facility. The weather station’s data logger was set up to record and store data on a similar schedule (every 5 min) as the sensors deployed in the pits. Precipitation, air temperature, relative humidity, wind speed and direction, vapor pressure, and solar radiation were recorded by the weather station. The schematic for the sand strip is shown in Figure 3b. The longitudinal sand strip was built by digging a 0.3 m × 0.3 m trench toward the sloped end (2% slope). The trench’s entire length was covered with coarse sand. After the sand placement, it facilitated the anchoring of the 1.524 × 10 4 m (6 mil) plastic sheet at the inner wall of the trench.

2.3. Soil Characteristics

Soil samples were collected from each test section during the excavation period. All samples were laboratory-characterized according to American Society for Testing and Materials (ASTM) standards. Based on the laboratory characterization of the collected samples, the fine fractions of the samples were found in the 72% to 91% range. Atterberg limits tests were conducted on the collected soil samples. The soil’s liquid limit (LL) ranged from 52% to 68%, while its plastic limit (PL) was estimated between 25% and 28%. Consequently, the plasticity index (PI) for this soil was found to be between 27% and 40%. According to the Unified Soil Classification System (USCS), the soil was classified as Fat Clay with Sand (CH) and Fat Clay (CH). Standard Compaction Tests according to ASTM D698 (or Proctor Compaction Tests) were conducted, and the optimum moisture content (OMC) and maximum dry density (MDD) were found in the ranges of 15 to 16.5% and 16.7 to 17.3 kN/m3, respectively.

2.4. Normality and Variance Testing

Before performing probabilistic comparisons and Gaussian-based analyses, we applied two goodness-of-fit tests, Shapiro–Wilk (SW) and Anderson–Darling (AD), to each cover’s 12-month VMC series ( n 56 , 000 ). For homoscedasticity, we used Levene’s test with the absolute-deviation formulation. The SW test evaluates whether a sample comes from a normally distributed population [34,35,36]. The SW test was applied to each cover’s VMC dataset to evaluate the null hypothesis that the observations arise from a normally distributed population, as evaluated using Equation (1). The test statistic, W, is defined as
W = i = 1 n a i x ( i ) 2 i = 1 n ( x i x ¯ ) 2
where x ( i ) denotes the ith order statistic (the ith smallest value of the sample), x ¯ is the sample mean, x i are the individual observations, a i are weights derived from the expected values and covariances of the order statistics under a standard normal distribution, and n is the total number of observations. Values of W close to unity indicate agreement with normality, while smaller values accompanied by p-values below the chosen significance threshold (α = 0.05) lead to the rejection of the normality assumption.
Complementing the SW test, the AD test ( A 2 ) was used to assess fit to the normal distribution using Equation (2). The AD test enhances the Kolmogorov–Smirnov framework by giving more weight to tail deviations [37,38,39,40]. Its statistic is given by
A 2 = n 1 n i = 1 n ( 2 i 1 ) ln F ( x ( i ) ) + ln 1 F ( x ( n + 1 i ) )
where F ( x ( i ) ) is the cumulative distribution function of the hypothesized normal distribution fitted to the data, x ( i ) are the ordered sample values, and n is the sample size. Larger values of the test statistics A 2 indicate greater departure from normality. Critical values or associated p-values determine whether the null hypothesis of normality should be rejected [40]. Additionally, Levene’s test was used to assess homogeneity of variance among multiple groups [41]. The test statistic for Levene’s method is an F-ratio computed from absolute deviations from group means [42]. These tests ensured rigorous statistical assessment of moisture variability prior to applying Gaussian approximation techniques. To verify whether the variances of moisture content differed significantly among the three cover types, we utilized Levene’s test using Equation (3). For k groups with sample sizes n i and total observations N = i n i , Levene’s test transforms each raw observation x i j into Z i j = | x i j x ¯ i | , the absolute deviation from its group mean x ¯ i . The test statistic W is then computed as an F-ratio:
W = N k k 1 i = 1 k n i ( Z ¯ i Z ¯ ) 2 i = 1 k j = 1 n i ( Z i j Z ¯ i ) 2
where Z ¯ i is the mean of the absolute deviations in group i and Z ¯ is the overall mean of all Z i j . A p-value below α = 0.05 leads to the rejection of the null hypothesis of equal variances (homoscedasticity).
By applying these three complementary tests, i.e., Shapiro–Wilk and Anderson–Darling for distributional shape and Levene for variance homogeneity, the foundational assumptions underlying probabilistic analyses were evaluated. Despite the strong rejection of normality in all datasets, Gaussian approximations were utilized in a limited and interpretive context. Specifically, normal-based probability density functions and standard normal transformations were employed not as literal statistical fits, but as comparative tools to standardize variability across covers. This approach enables a unified probabilistic framework (e.g., z-score-based interpretation) commonly adopted in the geotechnical literature to characterize field variability. The limitations of this assumption are acknowledged and interpreted with appropriate caution in the Discussion section. It is to be noted that while 5th–95th percentile bounds are commonly used in risk-based hydrological analyses, we did not explicitly apply these percentiles here. Instead, the PDFs and associated statistical descriptors (mean, standard deviation, skewness, kurtosis) were used to quantify variability across cover types.

2.5. Gaussian Distribution Theorem

Continuous random variables will probably take on different frequency distributions when they represent responses due to natural events, such as changes in soil parameters induced by environmental factors (like precipitation, temperature, etc.). Here, the random variable is a measurable function that transforms the measurable space, also known as the state space, from the probability space [43,44,45,46]. The normal or Gaussian distribution, also referred to as the bell-shaped distribution, is one of the distributions. Numerous probabilistic sciences, geotechnical, and geoenvironmental engineering problems have been evaluated using the normal distribution [47,48,49,50]. Equation (4) presents the probability density function (PDF) of the normal distribution for a random variable x:
f ( x ) = 1 σ 2 π e 1 2 x μ σ 2
where the mean is µ and the standard deviation of the variable is σ. The μ and σ are the scale and shape parameters of the Gaussian distribution, respectively. The bell-shaped curve flattens with increasing σ, whereas changing the µ shifts the distribution’s location, which is such a unique representation of the Gaussian distribution. Although the scale and shape parameters behave differently for each distribution, they are useful for understanding how the probability density changes with changing parameter values. A normal distribution is symmetrical around its mean, median, and mode. It is widely understood that 68.3, 95.4, and 99.7% of data from a population or sample will lie between 1, 2, and 3 standard deviations (σ) from the mean (µ), denoted as µ ± σ, µ ± 2σ, and µ ± 3σ. Alternatively, 68.3% of the data will be within 1 standard deviation of the variable’s mean (µ ± σ) if the normal distribution principle is applied to some random continuous variables. Similarly, 95.4% and 99.7% of the data will be within 2 and 3 standard deviations of the variable’s mean, (µ ± 2σ) and (µ ± 3σ), respectively. There are infinite normal distributions in probability statistics (one for each combination of μ and σ). As a result, standardizing all normal distributions to a single standard normal distribution (SND) is quite common. The SND of a random variable, z, has a mean of 0 and a standard deviation of 1: z N ( 0 , 1 ) . A critical component of engineering reliability analysis is the ability to transform any distribution (x) into the standard normal distribution (z): x z . Transformations between the original space (x) and the standard normal space (z) offer a dependable framework for analyzing data variability and interpreting the findings. For any random variable x (original space), where x N ( μ , σ ) , normal distributions can be transformed into SND (standard normal space: z) by the following formula, as presented in Equation (5).
z = x μ σ
The variable x represents a score obtained from the original normal distribution, whereas the variables μ and σ represent the mean and standard deviation of the original normal distribution of the data, respectively. The SND is also known as the z distribution. The z-score of any distribution quantifies the number of standard deviations a data point is situated above or below the mean. While any dataset can be standardized by transforming it into z-scores, this process does not inherently make the distribution normal. The standardized (z) distribution will only follow a standard normal distribution if the original data are normally distributed.

3. Results

3.1. Soil Moisture Response to Precipitation

Distinct patterns of change in soil moisture were observed in the three different cover types under identical climatic conditions. The graphical representation of the variation in VMC during varying precipitation is depicted in Figure 4a. Figure 4a shows that at the commencement of data collection for this study, the initial VMC of all covers was between 0.21 and 0.32 m 3 / m 3 . The soil under the ET cover and CC cover was highly responsive to various rainfall events. Figure 4a depicts the increase in VMC to almost 0.36 m 3 / m 3 following rainfall events ranging from 3 to 6 mm in CC cover. The VMC exhibited a gradual decrease from its highest point until the subsequent recorded rainfall event. The soil of the ET cover was initially not as responsive as the soil of the CC cover at 0.3 m depth. However, during heavy and prolonged precipitation events, the VMC increased abruptly, as observed in Figure 4a, from the end of October 2022 to early February 2023. Overall, the soil of the CC cover exhibited a faster response time than the ET cover, as shown in Figure 4a. In the summer of 2022 and subsequent periods with negligible precipitation and high temperature (Figure 4b), the VMC decreased to approximately 0.1 m 3 / m 3 . The soil of the ET cover exhibited a relatively greater degree of drying than the soil of the CC cover, indicating the impact of transpiration from the ET cover and surface evaporation.
Under the same climatic conditions, the soil at 0.3 m depth of the EnT cover exhibited a VMC profile (Figure 4a) almost unresponsive to the climatic variability, contrasting significantly with the moisture distribution observed in CC and ET covers. During the monitoring period, the VMC consistently demonstrated a steady state condition at a depth of 0.3 m of the EnT cover, achieving an average VMC of approximately 0.21 m 3 / m 3 . The VMC data of the EnT cover showed that the soil moisture gradually reduced from almost 0.26 m 3 / m 3 to 0.154 m 3 / m 3 during the summer of 2022. Therefore, the decrease in the VMC at 0.3 m depth of the EnT cover indicates that the ambient temperature may affect the soil moisture at shallow depths under engineered turf.

3.2. Descriptive Statistics and Analysis

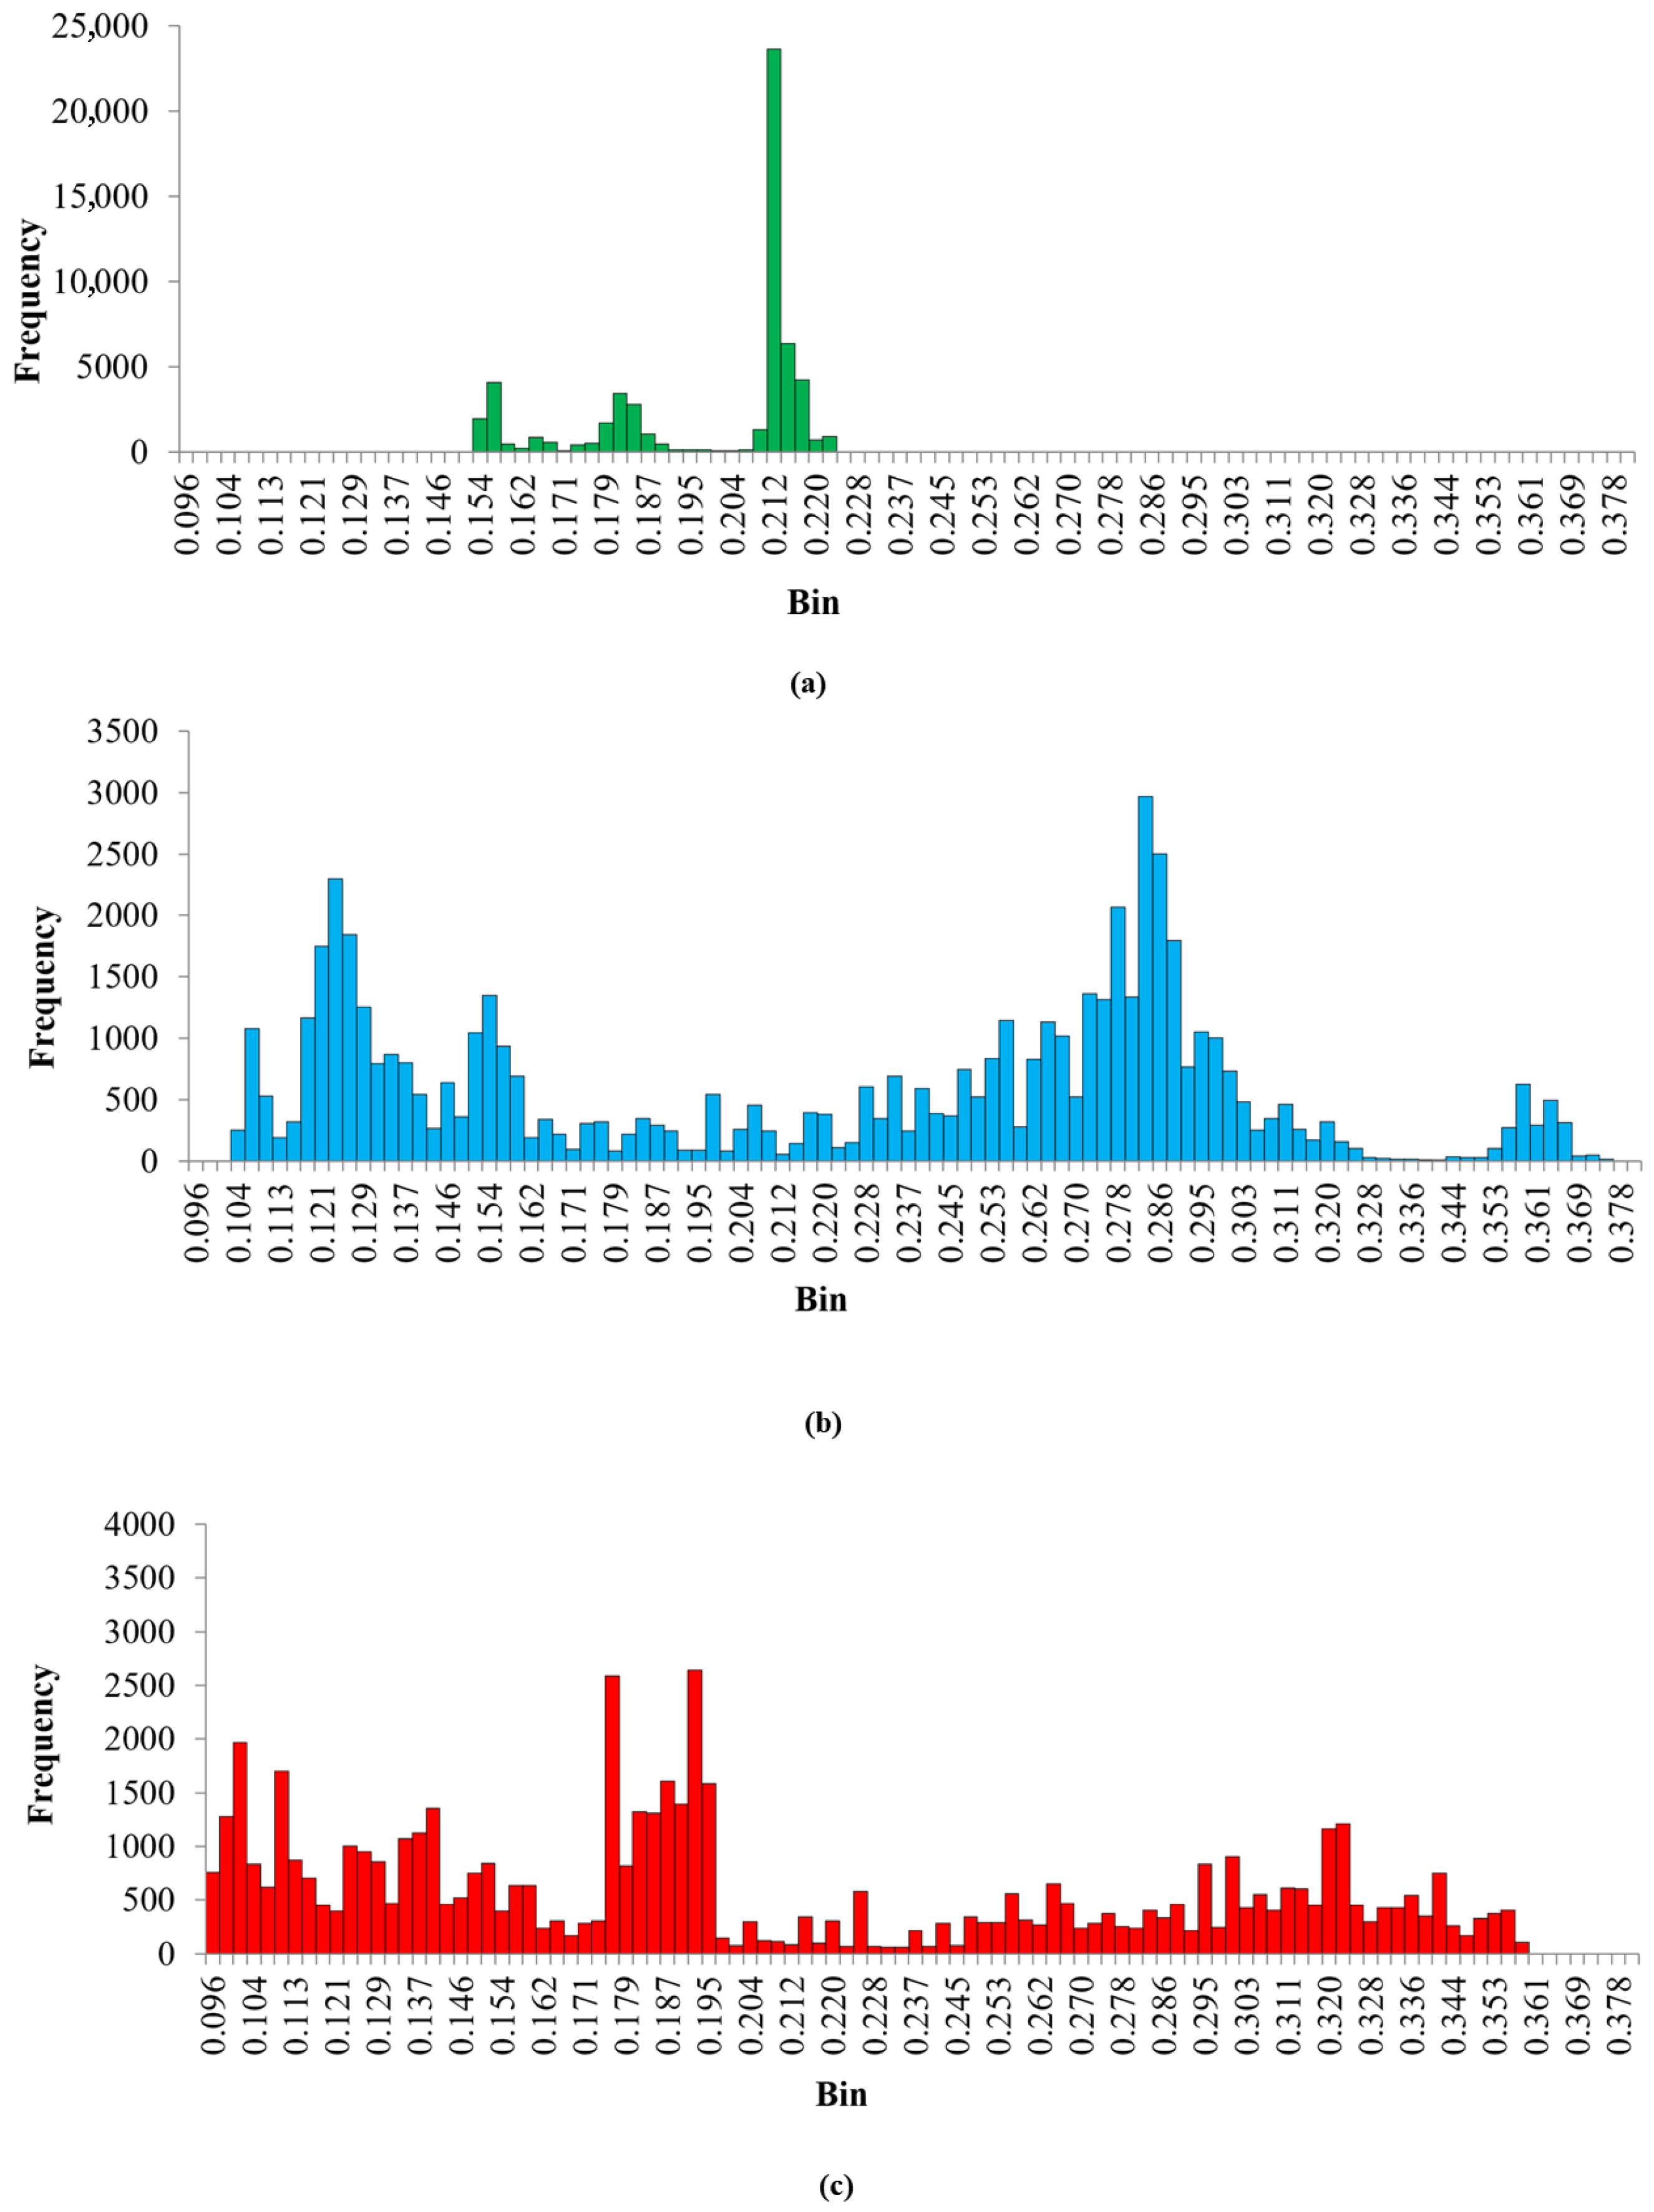
The descriptive statistics in Table 2 and histograms in Figure 5 collectively show that the EnT cover maintains a much narrower VMC distribution (Coefficient of Variation (CV) = 10.6%) than both the CC and ET covers (CVs = 33.3% and 38.6%, respectively). These differences are corroborated by the standard deviation and range values. The data range for the CC and ET cover was almost the same, with values of 0.27 and 0.26, respectively. However, the EnT cover had a much smaller range (0.07) compared to the other two covers under the same atmospheric circumstances and at the same depth. This indicates a large dispersion of the VMC in the ET and CC covers. The standard deviation (σ) of the observed VMC for the EnT cover (0.021) was substantially distinct from the CC and ET covers (0.074 and 0.078, respectively). It is noteworthy that the σ of both the CC and ET covers at 0.3 m depth appeared similar. This suggests the moisture distribution may be comparable, despite the CC and ET covers’ construction and working mechanisms being on entirely different principles.
The plots shown in Figure 5 provide further clarification of the VMC distribution. Figure 5 illustrates that the CC and ET covers have broader, flatter distributions with greater variability, which aligns with their higher standard deviations and observed field behavior. In contrast, the EnT cover’s distribution is tightly centered near its mean, as seen in the histogram. The VMC values in the EnT cover were distributed between 0.152 and 0.222 m 3 / m 3 , where the mode is 0.21 m 3 / m 3 with a frequency of 23,663, which is almost 42% of the total population. Yet, the remaining 58% of VMC variations occurred in a very narrow range. The measures of the central tendencies (i.e., mean, median, mode) of VMC are almost equivalent (Table 2), which technically indicates the VMC to be normally distributed at 0.3 m depth of the EnT cover.
However, the normality and homogeneity of variance tests performed using the SW (W) test and the AD (A2) test strongly rejected the null hypothesis of normality (p < 0.001) for all covers, indicating that VMC from all three cover systems at shallow depth is non-Gaussian (Table 3). SW and AD statistics (Table 3) confirm that VMC under all three covers deviates strongly from Gaussian behavior ( W 0.92 ; A 2 1.63 × 10 3 ; p < 0.001 ) , primarily due to pronounced right-skewness. Levene’s test revealed that EnT exhibits significantly larger inter-quartile spread than both CC and ET ( F > 5 × 10 4 , p < 0.001 ) , whereas CC and ET share statistically indistinguishable variance (F = 0.23, p = 0.628). These heteroscedasticities support the observed distinctions in VMC variability and justify further use of probabilistic comparative metrics such as PDFs and z-score transformations.
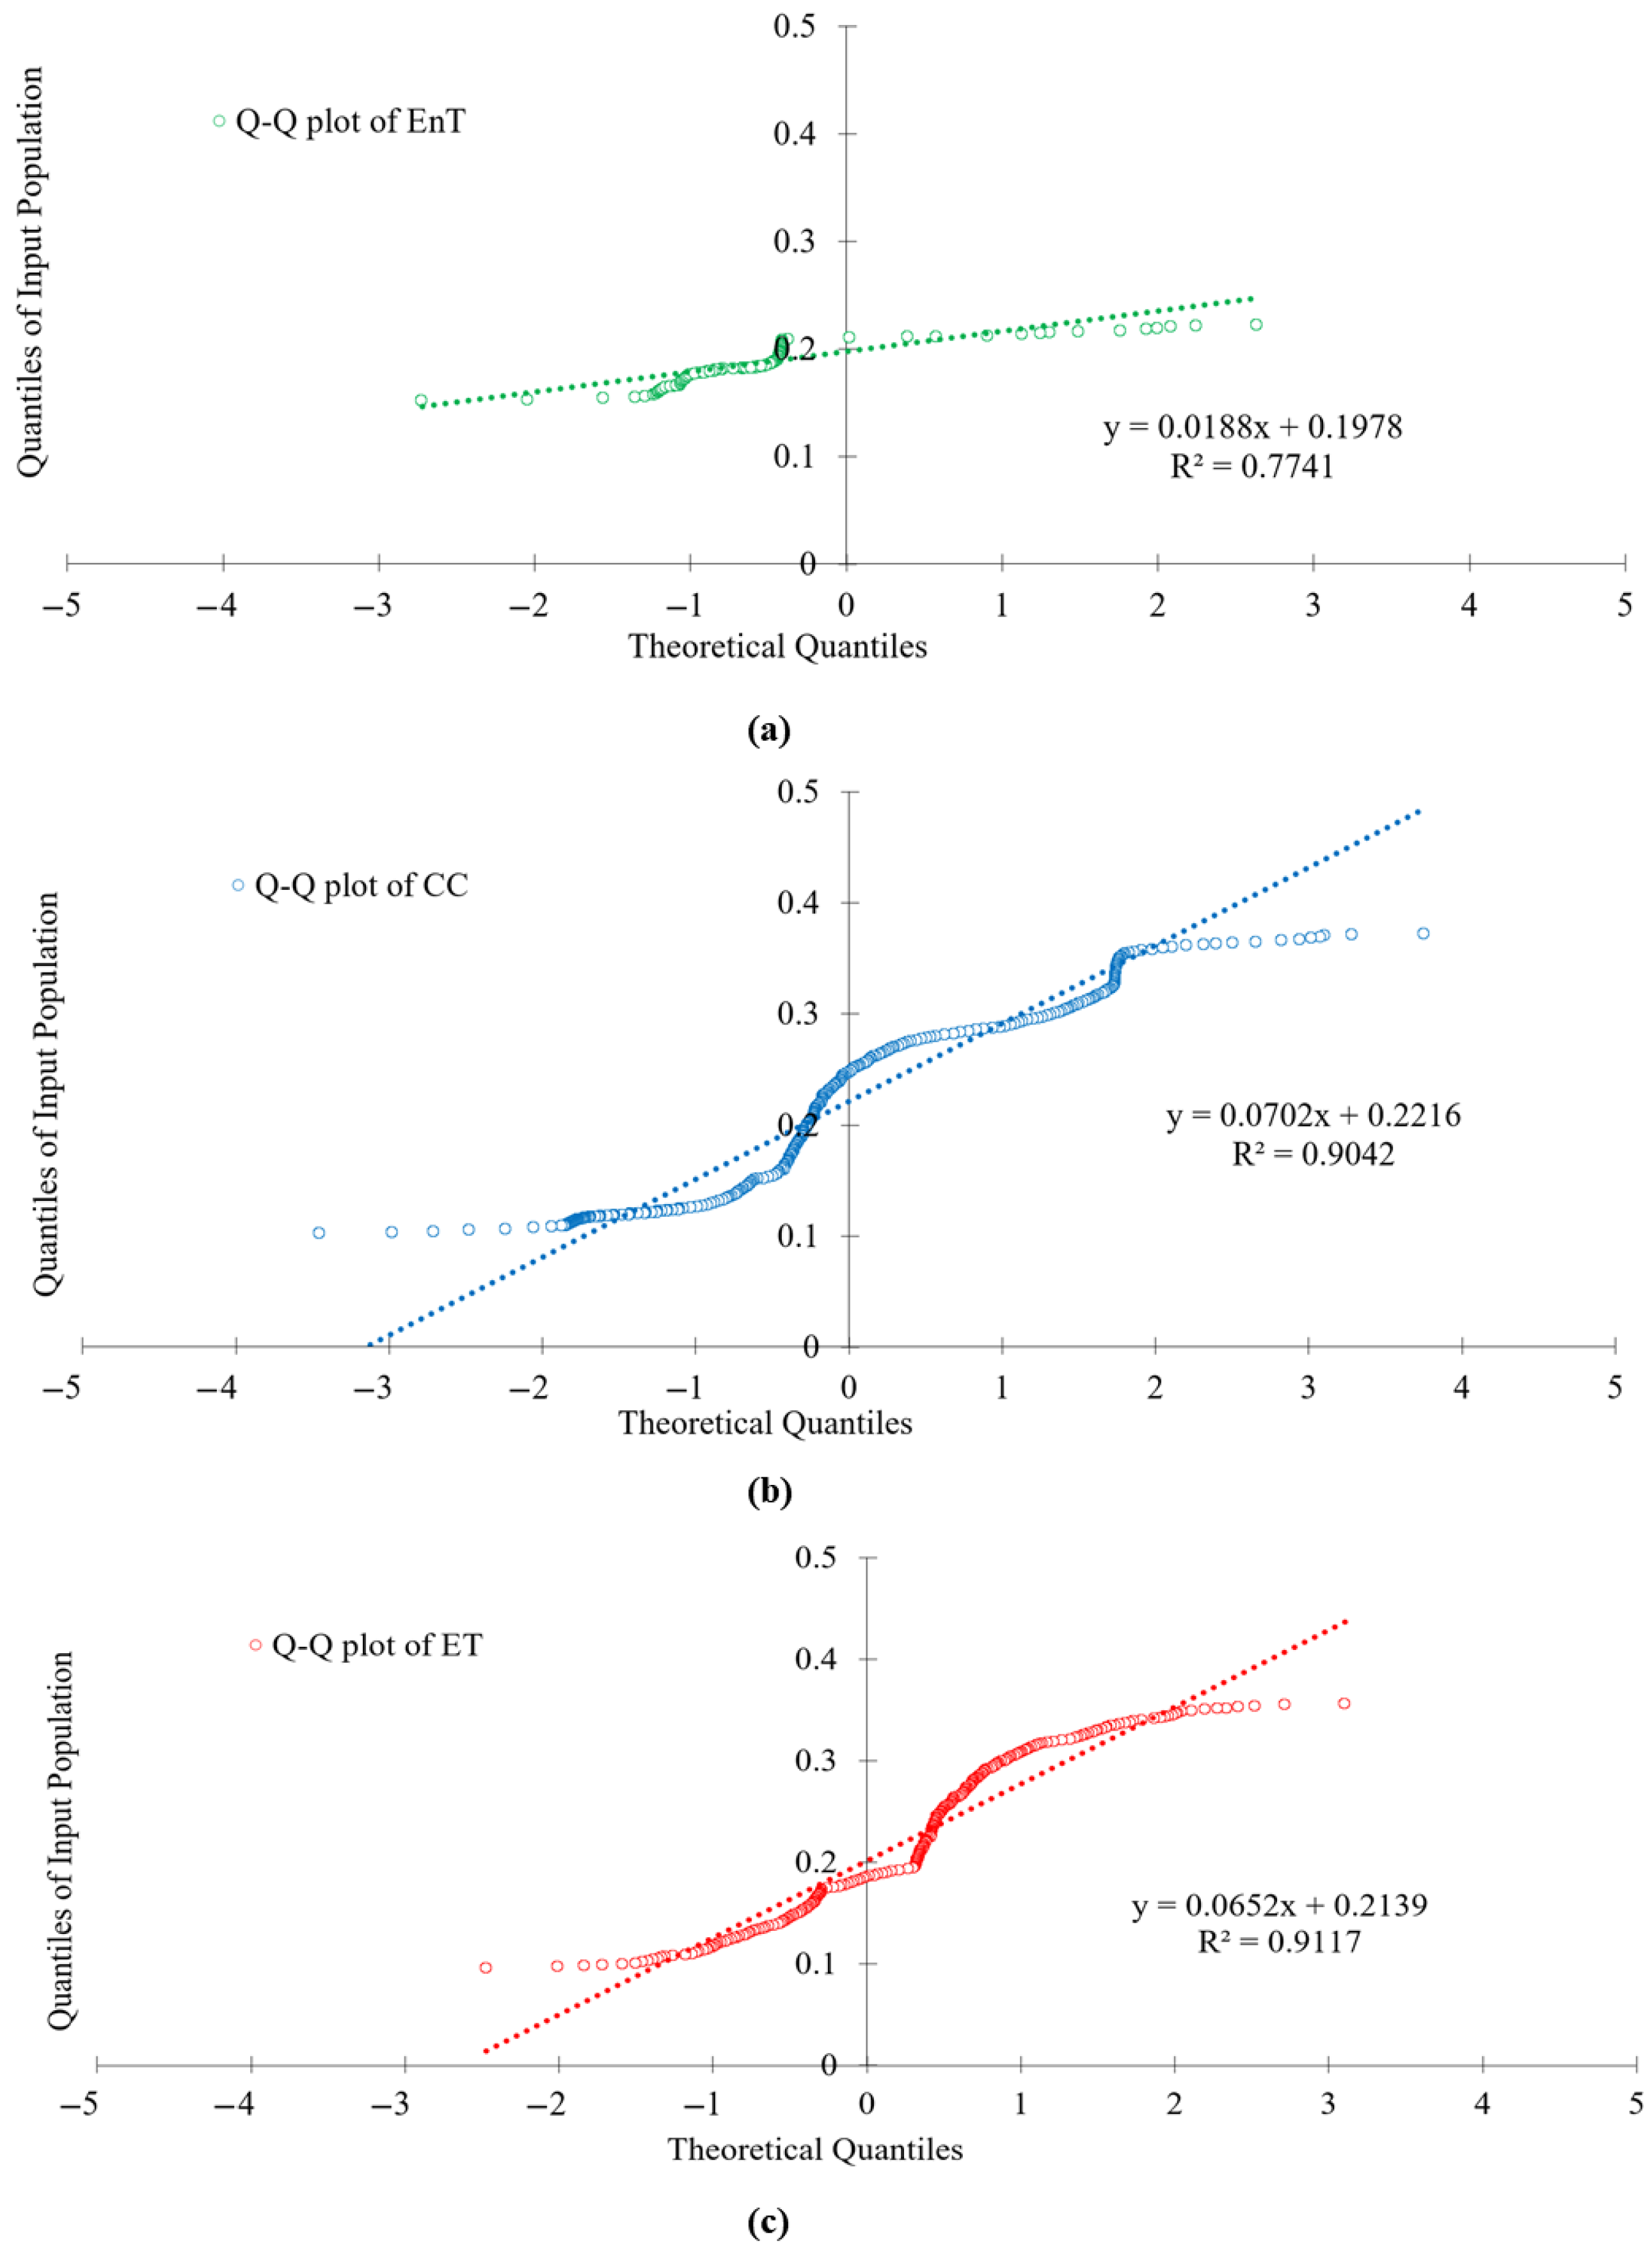
The estimators of symmetry (skewness) and peakedness (kurtosis) of the measured VMC further explained non-normality. The skewness (−1.06) of VMC suggests that the VMC distribution under the EnT cover was highly skewed to the left or negatively skewed. On the contrary, the VMC distribution at 0.3 m depth of CC and ET covers had significantly lower skewness values (Table 2) than the EnT cover. The VMC distributions at 0.3 m depth showed platykurtic behavior, with excess kurtosis of −1.32 (CC), −1.14 (ET), and −1.06 (EnT). To further evaluate the field moisture distribution, quantile–quantile (Q-Q) plots were introduced. Over 56,000 data points were collected for this study (population size). However, it was found that there was a sizable quantity of duplicate data. Although for the robustness of statistical interpretation of the VMC data, it is crucial to conduct analyses with a distinct dataset, for the consistency of the comparative evaluations, all observations of the moisture data were included in the analyses. Additionally, a substantial sample size is essential for the comprehensiveness of statistical interpretation and increased sensitivity. Furthermore, Q-Q plots are often more reliable when examining the normality of the data to minimize type II errors [51,52] with large-scale samples. The Q-Q plots for all the covers are presented in Figure 6. The VMC data should be consistent and in line with its linear Q-Q distribution plot if the soil moisture in the field was normally distributed. However, moisture distributions across all covers exhibited nonlinearity to varying degrees. The VMC distribution in the EnT cover is more non-normal than the other two covers’ moisture distribution, indicated by the EnT cover’s comparatively lower coefficient of determination ( R 2 ) value ( R 2 (EnT) = 0.7741) from the regression analysis. While the Q-Q plots suggest that CC and ET covers loosely follow a normal trend (R2 > 0.90), this statistical alignment primarily exists in the central quantiles. Significant deviations in the tails and slopes confirm the earlier non-normality conclusions, thus supporting treating the Gaussian distribution as a comparative rather than literal model.

3.3. Standard Normal Distribution (SND)

Despite the non-normal distribution, a Gaussian approximation was employed for two key reasons: (1) to enable a standardized comparison across cover types via transformation to the standard normal distribution (SND) from the original space, and (2) to characterize variability in a uniform probabilistic framework, which aligns with common geotechnical practice for field uncertainties. Figure 7 presents the standard normal distribution (SND) plots for three distinct covers. The VMC distribution of the EnT cover has a relatively high peak where the probability density function (PDF) is approximately 19 (Figure 7a), indicating a higher concentration of data points near the mean. The values are centered around a mean VMC of approximately 0.198. On the contrary, the VMC distributions of the CC and ET covers at the same depth are broader compared to the PDF of the EnT cover, with lower peaks of PDF at around 5 (Figure 7b,c) than the EnT cover’s peak, indicating more variability. Therefore, the PDFs represent that the VMC is consistently retained in the EnT cover than the other two covers at the same depth under identical climatic conditions.
The figure also illustrates the data distribution across four standard deviations relative to the mean of individual cover (µ ± 4 × σ). It is to be noted that the moisture distribution of the CC and ET covers in the standard normal space exhibits negative VMC at 4 and 3 standard deviations to the left of the mean (µ − 4 × σ and µ − 3 × σ, respectively). While negative soil moisture content is practically impossible, it is essential to display the negative VMC in the SND to demonstrate the extent of the data distribution and its dispersion. Notable differences are identified in the VMC distribution when comparing the EnT cover to the other two covers (ET and CC cover). In the EnT cover, approximately 95% of the VMC data at a depth of 0.3 m fall within a narrow range of 0.156 to 0.240 m 3 / m 3 , as illustrated in Figure 7a (shaded green area). Conversely, the CC and the ET covers exhibited a broad distribution of VMC and displayed comparable SND, as illustrated in Figure 7b and Figure 7c, respectively. In the CC cover, 95% of the VMC data fall within the range of 0.074 to 0.369 m 3 / m 3 (indicated by the shaded blue area), while in the ET cover, 95% of the VMC data are within the range of 0.045 to 0.359 m 3 / m 3 (represented by the shaded red area).

4. Discussion

This study evaluated the moisture distribution characteristics of three prototype landfill final cover systems: (1) engineered turf cover, (2) compacted clay cover, and (3) evapotranspiration (ET) cover, at a depth of 0.3 m. The findings are based on statistical analyses and probability density functions of VMC, which collectively described the data behavior, variability, and central tendency of moisture distributions across the three cover types at 0.3 m depth under identical climatic conditions. While formal statistical tests rejected normality in all VMC datasets, Gaussian probability density functions and standardized normal transformations were applied for a comparative assessment of data distribution, not for exact fit. This is consistent with many geotechnical analyses, where the normal distribution serves as a first-order probabilistic model for identifying data variability, despite the non-ideal behavior of the data. The transformation to standard normal space (z-scores) enabled direct, unit-invariant comparison of dispersion across cover types and the use of standard normal interpretation bounds. By acknowledging non-normality and interpreting results, the analysis preserved statistical integrity while leveraging the conceptual clarity of Gaussian-based metrics. This is crucial in geotechnical and geoenvironmental design, where relative variability rather than exact distributional fit often governs design checks and cross-cover performance comparisons.
Normality checks (Shapiro–Wilk and Anderson–Darling) consistently rejected Gaussian behavior for VMC across all covers. Variance homogeneity was also not supported. The EnT cover exhibited noticeably broader dispersion, while CC and ET covers showed comparable spread. Descriptive statistics also demonstrated data variability and non-normality. Furthermore, the Q-Q plots visually and quantitatively assessed how closely the VMC distributions conform to a theoretical normal distribution, providing insights into the statistical behavior and variability of each cover system. The Q-Q plot for the EnT cover showed the least alignment with the theoretical normal distribution, as evidenced by significant deviations, particularly at the lower quantiles. The Q-Q plot for the CC cover exhibited a slightly better alignment with the theoretical normal distribution compared to the ET cover, particularly in the central portion of the distribution. The deviations at the extremes suggest that soil saturation or dryness occurred at shallow depths (0.3 m). The Q-Q plot for the ET cover showed a moderately linear relationship between the quantiles of the observed moisture data and the theoretical quantiles, with slight deviations at the tails. These deviations suggest that the moisture data are approximately normal but exhibit heavier tails, indicating the presence of outliers. The heavier tails or outliers suggest that the ET cover may have experienced either extreme drying or saturation, which could impact the cover’s overall performance. The middle section aligns well with the theoretical line, reflecting normal-like behavior for most of the data. The R 2 (0.9117) indicates a strong correlation between the observed and theoretical distributions. However, the slope being less than one implies that the observed data have a smaller spread compared to a perfectly normal distribution.
The Z-score standardization became useful in this context for unit-invariant visualization and a comparative framework, though it does not restore normality. EnT cover exhibited the narrowest moisture distribution, with 95% of the data falling within the range of 0.156 to 0.240 m 3 / m 3 . This reflects a highly consistent moisture profile, as evidenced by the histogram and a smaller standard deviation. The low variability of VMC indicates effective moisture control, likely due to the well-designed and uniform material composition of engineered turf. This material may minimize the risk of repeated wetting and drying of the foundation soil beneath the engineered turf, which is crucial to maintaining the hydrology of the cover soil. The CC cover demonstrated a broader moisture distribution compared to the EnT cover, with 95% of the data falling within 0.074 to 0.369 m 3 / m 3 and a mean moisture content of 0.222 m 3 / m 3 . The wider spread in the histogram indicates greater variability in VMC at a depth of 0.3 m. The ET cover exhibited similar performance to the CC cover; however, the widest moisture distribution, with 95% of the data falling within 0.045 to 0.359 m 3 / m 3 and a mean moisture content of 0.202 m 3 / m 3 . The wide range of VMCs indicates that the ET cover is subjected to extreme drying to excessive saturation. It is to be noted that the root density and growth of ET cover were not examined in this study; however, based on the field observation, the above-ground vegetation growth in the ET cover qualitatively indicated a robust root system.

5. Conclusions

The study aimed to examine the moisture distribution characteristics of different final cover systems of landfills at shallow depth using a one-year high-frequency field monitoring data. To achieve this, in situ soil moisture data from sensors installed at 0.3 m depth under three cover types were analyzed using a probabilistic framework. In this study, Gaussian distributions were applied to approximate the moisture content variability to compute z-scores and probabilistic envelopes (e.g., 95% intervals), which serve as comparative benchmarks rather than absolute fits. Although none of the moisture datasets met the formal criteria for Gaussian normality, the Gaussian (normal) distribution remains a widely used approximation for continuous variables because of its interpretability and utility in standardization. The findings from this one-year field study demonstrated that the engineered turf cover maintains a consistent soil moisture profile under variable climatic conditions, suggesting advantages in regulating near-surface soil hydrologic responses. The outcome of this study may act as a guide for the choice of cover systems based on site-specific conditions, including climate, soil type, and landfill operational goals, to achieve optimal long-term performance. However, conclusions about long-term infiltration control or durability must await multi-year studies involving direct percolation measurements and deeper instrumentation.

Author Contributions

Conceptualization, M.J.B.A., M.A., N.R. and R.S.M.; methodology, M.J.B.A., M.A. and R.S.M.; software, M.J.B.A., M.A. and R.S.M.; validation, M.J.B.A. and N.R.; formal analysis, M.J.B.A. and M.A.; investigation, M.J.B.A., M.A. and R.S.M.; resources, M.J.B.A. and N.R.; writing—original draft preparation, M.A.; writing—review and editing, M.J.B.A., N.R. and R.S.M.; supervision, M.J.B.A. All authors have read and agreed to the published version of the manuscript.

Funding

This research was funded by the National Science Foundation (NSF), grant number #2101081.

Institutional Review Board Statement

Not applicable.

Informed Consent Statement

Not applicable.

Data Availability Statement

Data is contained within the article.

Acknowledgments

The authors gratefully acknowledge the land support and equipment provided by the College of Agriculture and Human Science (CAHS) of Prairie View A&M University. The authors are also grateful to Watershed Geo for providing technical guidance and support during the engineered turf installation.

Conflicts of Interest

Author Maalvika Aggarwal was employed by the company HNTB Corporation. The remaining authors declare that the research was conducted in the absence of any commercial or financial relationships that could be construed as a potential conflict of interest.

Abbreviations

The following abbreviations are used in this manuscript:
EnTEngineered Turf
ETEvapotranspiration
CCCompacted Clay
CBSCapillary Barrier Systems
Q-QQuantile–Quantile
VMCVolumetric Moisture Content
PDFProbability Density Function
SNDStandard Normal Distribution
CVCoefficient of Variation
OMCOptimum Moisture Content
MDDMaximum Dry Density
ASTMAmerican Society for Testing
LLDPELinear Low-Density Polyethylene
USCSUnified Soil Classification System
LLLiquid Limit
PLPlastic Limit
PIPlasticity Index
GCLGeosynthetic Clay Liner
RCRAResource Conservation and Recovery Act
USEPAU.S. Environmental Protection Agency

References

  1. Hauser, V.L.; Gimon, D.M. Evaluating Evapotranspiration (ET) Landfill Cover Performance Using Hydrologic Models; Air Force Center for Environmental Excellence: San Antonio, TX, USA, 2004. [Google Scholar]
  2. Benson, C.; Khire, M. Earthen materials in surface barriers. In Barrier Technologies for Environmental Management; The National Academies Press: Washington, DC, USA, 1997; pp. 79–89. [Google Scholar]
  3. Gross, B.; Bonaparte, R.; Giroud, J. Waste containment systems: Problems and lessons learned. In Appendix F, Assessment and Recommendations for Optimal Performance of Waste Containment Systems, EPA, USA; National Service Center for Environmental Publications (NSCEP): Cincinnati, OH, USA, 2002. [Google Scholar]
  4. Dwyer, S.F. Construction Overview of Six Landfill Cover Designs; Technical report; Sandia National Labs.: Albuquerque, NM, USA; Livermore, CA, USA, 2000. [Google Scholar]
  5. Albright, W.H.; Benson, C.H.; Gee, G.W.; Roesler, A.C.; Abichou, T.; Apiwantragoon, P.; Lyles, B.F.; Rock, S.A. Field Water Balance of Landfill Final Covers. J. Environ. Qual. 2004, 33, 2317–2332. [Google Scholar] [CrossRef] [PubMed]
  6. Benson, C.H.; Albright, W.H.; Roesler, A.C.; Abichou, T. Evaluation of final cover performance: Field data from the alternative cover assessment program (ACAP). Proc. Waste Manag. 2002, 2, 1–15. [Google Scholar]
  7. Benson, C.H.; Bareither, C.A. Designing Water Balance Covers for Sustainable Waste Containment: Transitioning State of the Art to State of the Practice; Geotechnical Special Publication: Oakland, CA, USA, 2012; pp. 1–33. [Google Scholar] [CrossRef]
  8. Alam, M.J.B.; Hossain, M.S. Evaluation of Post-Construction Changes in Soil Hydraulic Properties through Field Instrumentation and In Situ Testing. In Proceedings of the Geo-Congress 2019 Geotechnical Materials, Modeling, and Testing, Philadelphia, PA, USA, 24–27 March 2019; pp. 722–732. [Google Scholar] [CrossRef]
  9. Benson, C.H.; Othman, M.A. Hydraulic Conductivity of Compacted Clay Frozen and Thawed In Situ. J. Geotech. Eng. 1993, 119, 276–294. [Google Scholar] [CrossRef]
  10. Khire, M.V.; Benson, C.H.; Bosscher, P.J. Water Balance Modeling of Earthen Final Covers. J. Geotech. Geoenviron. Eng. 1997, 123, 744–754. [Google Scholar] [CrossRef]
  11. Ogorzalek, A.S.; Bohnhoff, G.L.; Shackelford, C.D.; Benson, C.H.; Apiwantragoon, P. Comparison of Field Data and Water-Balance Predictions for a Capillary Barrier Cover. J. Geotech. Geoenviron. Eng. 2008, 134, 470–486. [Google Scholar] [CrossRef]
  12. Bohnhoff, G.L.; Ogorzalek, A.S.; Benson, C.H.; Shackelford, C.D.; Apiwantragoon, P. Field Data and Water-Balance Predictions for a Monolithic Cover in a Semiarid Climate. J. Geotech. Geoenviron. Eng. 2009, 135, 333–348. [Google Scholar] [CrossRef]
  13. Morris, C.E.; Stormont, J.C. Capillary Barriers and Subtitle D Covers: Estimating Equivalency. J. Environ. Eng. 1997, 123, 3–10. [Google Scholar] [CrossRef]
  14. Kämpf, M.; Montenegro, H. On the performance of capillary barriers as landfill cover. Hydrol. Earth Syst. Sci. 1997, 1, 925–929. [Google Scholar] [CrossRef]
  15. Sawangsuriya, A.; Jotisankansa, A. Capillary Barrier System for Resilient Slope Cover. In Geoenvironmental Engineering; American Society of Civil Engineers: Reston, VA, USA, 2020; pp. 169–185. [Google Scholar] [CrossRef]
  16. Scarfone, R. Modelling the Hydraulic Behaviour of Unsaturated Soils and Application to the Numerical and Experimental Study of Capillary Barrier Systems. Ph.D. Thesis, University of Glasgow, Glasgow, UK, 2020. [Google Scholar] [CrossRef]
  17. Scarfone, R.; Wheeler, S.J.; Smith, C.C. Numerical modelling of the application of capillary barrier systems for prevention of rainfall-induced slope instability. Acta Geotech. 2023, 18, 355–378. [Google Scholar] [CrossRef]
  18. Chetri, J.K.; Reddy, K.R. Advancements in Municipal Solid Waste Landfill Cover System: A Review. J. Indian Inst. Sci. 2021, 101, 557–588. [Google Scholar] [CrossRef]
  19. Huang, X.; Shi, Z.H.; Zhu, H.D.; Zhang, H.Y.; Ai, L.; Yin, W. Soil moisture dynamics within soil profiles and associated environmental controls. Catena 2016, 136, 189–196. [Google Scholar] [CrossRef]
  20. Liu, J.; Gao, Z.; Wang, M.; Li, Y.; Ma, Y.; Shi, M.; Zhang, H. Study on the dynamic characteristics of groundwater in the valley plain of Lhasa City. Environ. Earth Sci. 2018, 77, 646. [Google Scholar] [CrossRef]
  21. United States Environmental Protection Agency; Innovation, T.; Division, F.S. Fact Sheet on Evapotranspiration Cover Systems for Waste Containment; United States Environmental Protection Agency: Washington, DC, USA, 2003.
  22. Brown, D.W.; Daley, D.J.; Tully, W.P. Determination of Evapotranspiration Landfill Cover System Design Parameters Using the Simultaneous Heat and Water (SHAW) Model. Master’s Thesis, State University of New York, Syracuse, NY, USA, 2007. [Google Scholar]
  23. Bronstert, A.; Plate, E.J. Modelling of runoff generation and soil moisture dynamics for hillslopes and micro-catchments. J. Hydrol. 1997, 198, 177–195. [Google Scholar] [CrossRef]
  24. Sadek, S.; Ghanimeh, S.; El-Fadel, M. Predicted performance of clay-barrier landfill covers in arid and semi-arid environments. Waste Manag. 2007, 27, 572–583. [Google Scholar] [CrossRef] [PubMed]
  25. Henneberger, R.; Chiri, E.; Bodelier, P.E.; Frenzel, P.; Lüke, C.; Schroth, M.H. Field-scale tracking of active methane-oxidizing communities in a landfill cover soil reveals spatial and seasonal variability. Environ. Microbiol. 2015, 17, 1721–1737. [Google Scholar] [CrossRef]
  26. Mishra, S. Dealing with uncertainty in environmental model predictions. Eos 2001, 82, 568. [Google Scholar] [CrossRef]
  27. Brum, M.; Fan, F.M.; Salla, M.R.; von Sperling, M. Analysis of a probabilistic approach for modelling and assessment of the water quality of rivers. J. Hydroinform. 2022, 24, 783–797. [Google Scholar] [CrossRef]
  28. Alam, M.J.B.; Aggarwal, M.; Rahman, N. Investigation of the Effect of Geosynthetics on Climate-Induced Changes in Unsaturated Soil Behavior Using Non-Parametric Measure. In Proceedings of the Geo-Congress 2024. American Society of Civil Engineers (ASCE), Vancouver, BC, Canada, 25–28 February 2024; pp. 436–446. [Google Scholar] [CrossRef]
  29. Caldwell, T.G.; Tabatabai, S.; Huntington, J.M.; Davies, G.E.; Fuhrmann, M. Evapotranspiration covers at uranium mill tailings sites. Vadose Zone J. 2022, 21, e20222. [Google Scholar] [CrossRef]
  30. Lee, W.J.; Schnabel, W.E. Implementation of a Pilot Scale Evapotranspiration Landfill Cover for Use in Cold Regions. In Proceedings of the World Water Congress 2005: Impacts of Global Climate Change—Proceedings of the 2005 World Water and Environmental Resources Congress, Anchorage, AK, USA, 15–19 May 2005; pp. 1–11. [Google Scholar] [CrossRef]
  31. Joshi, R.; Zhu, M. Sustainability aspects of geosynthetic landfill final cover systems. E3S Web Conf. 2024, 569, 06004. [Google Scholar] [CrossRef]
  32. Albright, W.H.; Benson, C.H.; Gee, G.W.; Abichou, T.; Tyler, S.W.; Rock, S.A. Field Performance of Three Compacted Clay Landfill Covers. Vadose Zone J. 2006, 5, 1157–1171. [Google Scholar] [CrossRef]
  33. METER Group Inc. Method A: Soil-Specific Calibrations for METER Soil Moisture Sensors. 2023. Available online: https://metergroup.com/resources/services/custom-calibration/ (accessed on 16 May 2023).
  34. Chen, L.; Shapiro, S.S. An alternative test for normality based on normalized spacings. J. Stat. Comput. Simul. 1995, 53, 269–287. [Google Scholar] [CrossRef]
  35. King, A.P.; Eckersley, R.J. Inferential Statistics IV: Choosing a Hypothesis Test. In Statistics for Biomedical Engineers and Scientists; Academic Press: Cambridge, MA, USA, 2019; pp. 147–171. [Google Scholar] [CrossRef]
  36. Razali, N.M.; Wah, Y.B. Power comparisons of shapiro-wilk, kolmogorov-smirnov, lilliefors and anderson-darling tests. J. Stat. Model. Anal. 2011, 2, 21–33. [Google Scholar]
  37. Engmann, S.; Cousineau, D. Comparing distributions: The two-sample anderson-darling test as an alternative to the kolmogorov-smirnoff test. J. Appl. Quant. Methods 2011, 6, 1–17. [Google Scholar]
  38. Mason, D.M.; Schuenemeyer, J.H. A Modified Kolmogorov-Smirnov Test Sensitive to Tail Alternatives. Ann. Statist. 1983, 11, 933–946. [Google Scholar] [CrossRef]
  39. Baumgartner, D.; Kolassa, J. Power considerations for Kolmogorov–Smirnov and Anderson–Darling two-sample tests. Commun. Stat.-Simul. Comput. 2023, 52, 3137–3145. [Google Scholar] [CrossRef]
  40. Hawkins, D.M. The distribution of the Anderson Darling statistic. In Communications in Statistics—Simulation and Computation; Taylor & Francis: Oxfordshire, UK, 2024. [Google Scholar] [CrossRef]
  41. Gastwirth, J.L.; Gel, Y.R.; Miao, W. The Impact of Levene’s Test of Equality of Variances on Statistical Theory and Practice. Statist. Sci. 2009, 24, 343–360. [Google Scholar] [CrossRef]
  42. Carroll, R.J.; Schneider, H. A note on levene’s tests for equality of variances. Stat. Probab. Lett. 1985, 3, 191–194. [Google Scholar] [CrossRef]
  43. Doob, J.L. The Development of Rigor in Mathematical Probability (1900–1950). Am. Math. Mon. 1996, 103, 586–595. [Google Scholar] [CrossRef]
  44. Ellison, B.E. Two Theorems for Inferences about the Normal Distribution with Applications in Acceptance Sampling. J. Am. Stat. Assoc. 1964, 59, 89–95. [Google Scholar] [CrossRef]
  45. Gross, L. Measurable functions on Hilbert space. Trans. Am. Math. Soc. 1962, 105, 372–390. [Google Scholar] [CrossRef]
  46. Gillespie, D.T. A theorem for physicists in the theory of random variables. Am. J. Phys. 1983, 51, 520–533. [Google Scholar] [CrossRef]
  47. Phoon, K.K. Reliability-Based Design in Geotechnical Engineering: Computations and Applications, 1st ed.; CRC Press: Boca Raton, FL, USA, 2008; pp. 1–531. [Google Scholar] [CrossRef]
  48. Duncan, J.M. Factors of Safety and Reliability in Geotechnical Engineering. J. Geotech. Geoenviron. Eng. 2000, 126, 307–316. [Google Scholar] [CrossRef]
  49. Cao, Z.; Wang, Y.; Li, D. Probabilistic approaches for geotechnical site characterization and slope stability analysis. In Probabilistic Approaches for Geotechnical Site Characterization and Slope Stability Analysis; Springer Nature: Berlin/Heidelberg, Germany, 2016; pp. 1–190. [Google Scholar] [CrossRef]
  50. Kumar, S.; Choudhary, S.S.; Burman, A.; Singh, R.K.; Bardhan, A.; Asteris, P.G. Probabilistic Slope Stability Analysis of Mount St. Helens Using Scoops3D and a Hybrid Intelligence Paradigm. Mathematics 2023, 11, 3809. [Google Scholar] [CrossRef]
  51. Chantarangsi, W.; Liu, W.; Bretz, F.; Kiatsupaibul, S.; Hayter, A.J.; Wan, F. Normal probability plots with confidence. Biom. J. 2015, 57, 52–63. [Google Scholar] [CrossRef]
  52. Sürücü, B.; Koç, E. Assessing the validity of a statistical distribution: Some illustrative examples from dermatological research. Clin. Exp. Dermatol. 2008, 33, 239–242. [Google Scholar] [CrossRef] [PubMed]
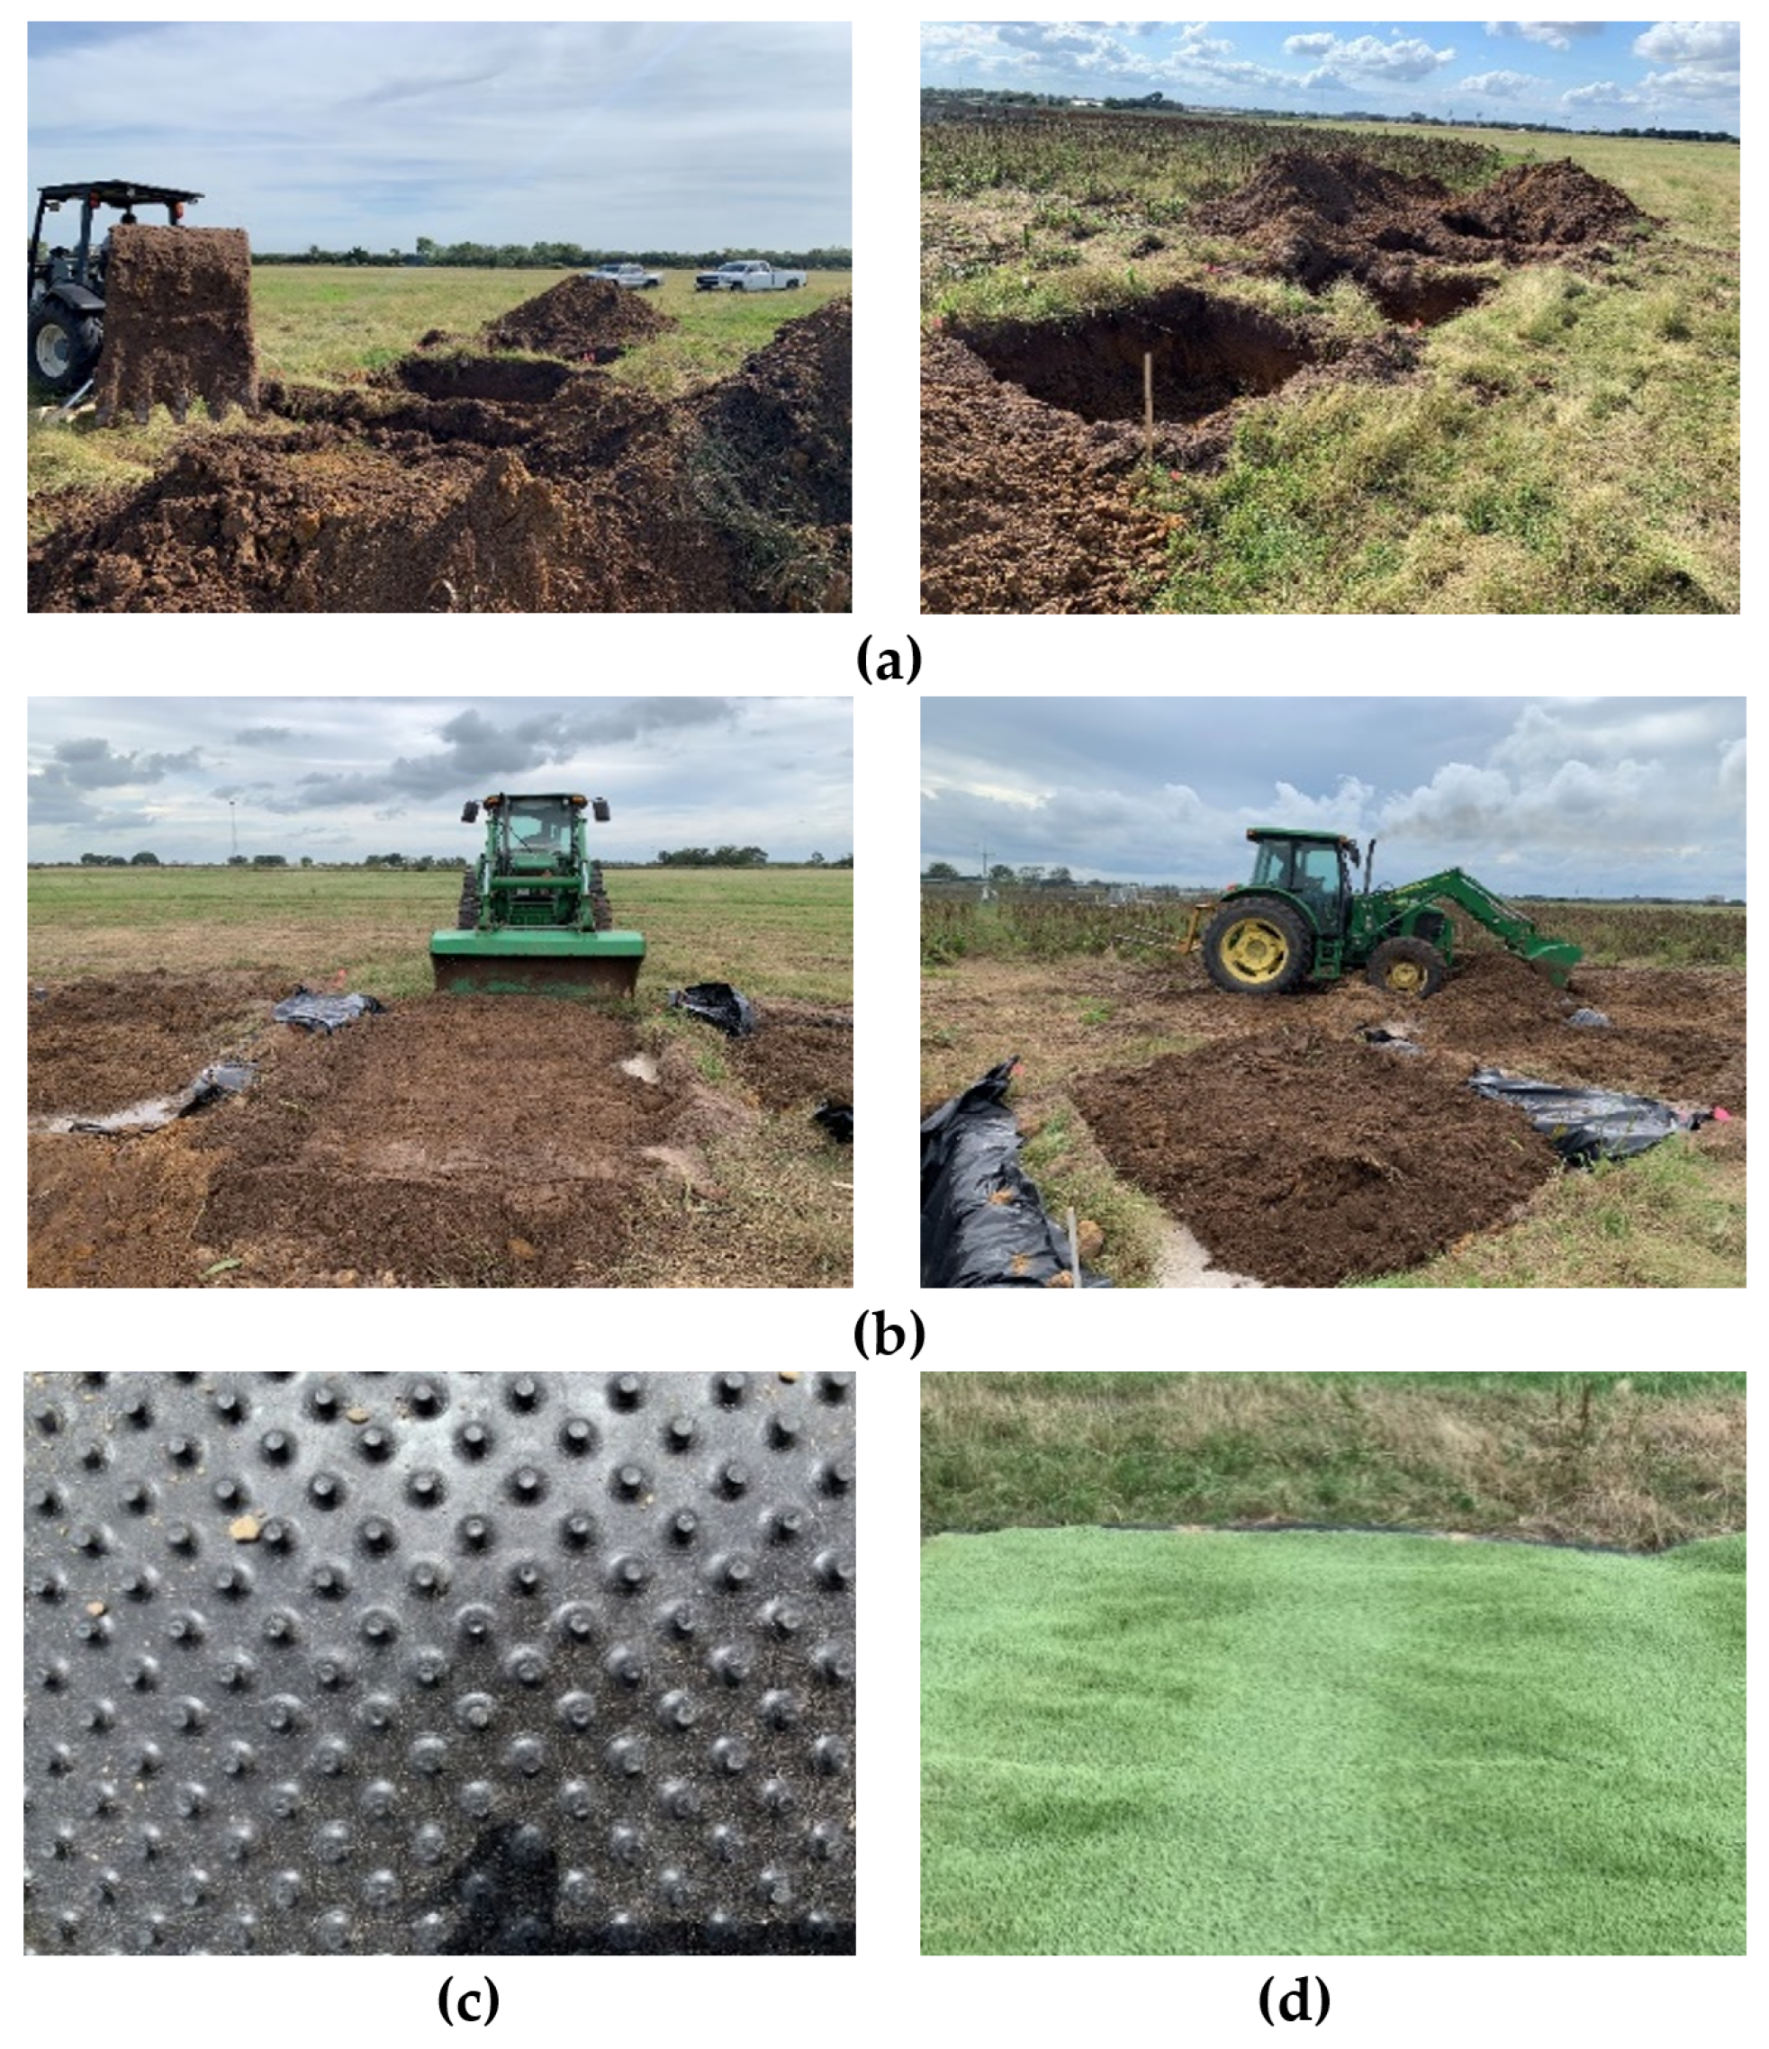
Figure 1. Construction of the test sections: (a) excavation of the test pits; (b) soil backfilling after a 1.524 × 10 4 m (6 mil) plastic sheet placed on the bottom of the excavation floor and inside the side wall of excavated pits; (c) textured geomembrane layer smoothed compacted layer; (d) engineered turf placed over the textured geomembrane.
Geotechnics 05 00064 g001
Figure 2. Calibration curve.
Geotechnics 05 00064 g002
Figure 3. (a) Schematic of test sections and instrumentation. (b) Details of sand strip.
Geotechnics 05 00064 g003
Figure 4. (a) Change in soil moisture with precipitation. (b) Temperature profile.
Geotechnics 05 00064 g004
Figure 5. Histogram of the (a) EnT cover, (b) CC cover, and (c) ET cover.
Geotechnics 05 00064 g005
Figure 6. Q-Q plot of measured VMC at 0.3 m depth: (a) EnT cover, (b) CC cover, and (c) ET cover.
Geotechnics 05 00064 g006
Figure 7. Standard normal distribution for (a) EnT cover, (b) CC cover, and (c) ET cover.
Geotechnics 05 00064 g007
Table 1. Configuration details of the three side-by-side field test covers.
Cover TypeSurfaceCompactionDepth (m)Sensor Placement
EnTEngineered Turf95% of MDD1.2TEROS11 at 0.3 m
CCBare Soil95% of MDD1.2TEROS11 at 0.3 m
ETBermuda Grass80% of MDD1.2TEROS11 at 0.3 m
Table 2. Descriptive statistics.
Descriptive StatisticsEnTCCET
Mean ( μ )0.1980.2220.202
Standard Error0.0000.0000.000
Median0.2100.2470.185
Mode0.2100.2810.193
Standard Deviation ( σ )0.0210.0740.078
Coefficient of Variation (CV)10.6%33.3%38.6%
Excess Kurtosis−0.368−1.325−1.138
Skewness−1.056−0.1490.431
Range0.0700.2700.260
Minimum0.1520.1020.096
Maximum0.2220.3720.356
Count565785657856578
Confidence Level (95.0%)0.0000.0010.001
Table 3. Test statistics for normality and homogeneity of variance.
Cover/ComparisonTestTest Statistic
CoverNormality TestW-Statisticp-ValueInterpretation
EnT 0.7512<0.001Not normal
CCShapiro–Wilk0.9036<0.001Not normal
ET 0.9151<0.001Not normal
CoverNormality TestA2-Statisticp-valueInterpretation
EnT 6309.94<0.001Not normal
CCAnderson–Darling2302.51<0.001Not normal
ET 1631.67<0.001Not normal
ComparisonHomogeneity TestF-Statisticp-valueInterpretation
EnT vs. CC 63026.38<0.001Unequal variances
EnT vs. ETLevene’s Test53891.15<0.001Unequal variances
CC vs. ET 0.23470.628Equal variances
Disclaimer/Publisher’s Note: The statements, opinions and data contained in all publications are solely those of the individual author(s) and contributor(s) and not of MDPI and/or the editor(s). MDPI and/or the editor(s) disclaim responsibility for any injury to people or property resulting from any ideas, methods, instructions or products referred to in the content.