Abstract
In this study, the behavior of a three-hinged buried precast arch structure under the impact of the design truck was studied and evaluated based on the finite element method. A three-dimensional finite element analysis model of the buried precast arch structure has been meticulously established, considering arch segments’ joining and surface contact and interaction between surrounding soil and concrete structures. The behavior of the arch structure was examined and compared with the influence of pavement types, number of lanes, and axle spacings. The crucial findings indicate that arch structure behavior differs depending on design truck layouts and pavement stiffness and less on multi-lane vehicle loading effects. Furthermore, the extent of pressure propagation under the wheel depends not only on the magnitude of the axle load but also on the stiffness of the pavement structures. Cement concrete pavement (CCP) allows better dispersion of wheel track pressure on the embankment than asphalt concrete pavement (ACP). Therefore, the degree of increase in arch displacement with ACP is higher than that of CCP. To enhance the coverage of the vehicle influence zone, an extension of the backfill material width should be considered from the bottom of the arch and with the prism plane created at a 45-degree transverse angle.
1. Introduction
The world has witnessed a leap in construction technology in recent decades, and infrastructure has been promoted and developed rapidly. Modular structures, such as prefabricated members, have been widely used in various projects and constructions. Modular designs have been widely applied in underground and semi-underground infrastructure development. Since then, it has been essential in connecting transport infrastructure [1,2]. Modular underground arch bridges (MUABs) and buried precast arch culverts are typical forms of buried precast arch structures (BPASs) [3].
The construction of modular concrete structures has become a technological solution in structural engineering. These modular forms (called segments) and structural solutions offer precast arch structures’ construction productivity and performance advantages. Because of the effective load-sharing and backfilling of the soil–structure interaction system (also known as the soil-arching effect), an embedded arch bridge has a higher load-carrying capacity than a conventional bridge [1]. The soil-arching effect is significantly affected by the depth of backfill soil, the soil’s deformation modulus, and the arch structure’s stiffness [4]. Modular forms of precast structures have many advantages when erecting buried arch structures, including more accessible, faster construction methods and ease of quality control of components during fabrication at the factory.
Some studies proposed the process of earthquake analysis and seismic design for construction works [5,6], and showed that underground and semi-underground structures are less vulnerable to earthquakes than fully exposed structures [5]. Recent efforts on micro-parameters of granular material models and behavior of transverse connectivities of precast segment bridges subjected to vehicular loading have been discussed [7,8]. Several studies have been interested in the behavior of buried structures under the vehicles’ live load, but focused on evaluating the buried box structures instead of buried arch structures [9,10,11,12].
The soil envelope is an integral part of BPAS. The structural backfill material, the extent of the structural backfill zone, and the processes utilized to install and compact the backfill to make up the soil envelope. Therefore, the soil envelope can be a static and/or seismic resistance part of BPAS after backfill, as mentioned in the general design standards [13,14]. The burial depth (i.e., cover depth) has to be designed to ensure vehicular loading attenuation above the arch structure. Another design guideline [15] noted that all flexible buried structures require adequate backfill support to maintain structural integrity. Most structural culvert issues stem from using inappropriate backfill material, insufficient compaction, or incorporating frozen material into the structural envelope during construction. Granular material has stronger shear strength, compacts more efficiently, and takes less control or effort than clayey soil, which should be used as backfill material [15]. However, studies on the effect of soil envelope stiffness on the resistance of buried arch structures have not been addressed fully.
A few studies have partly evaluated and demonstrated the dispersion of vehicle loads on the embankment of the buried box structures by experimental research and numerical simulation as common analytical approaches [9,10,11,12]. By experimental field measurement, Orton et al. [9] examined the field measurement of 10 existing reinforced-concrete buried box structures with burial depths from 0.76 m to 4.1 m. The influence of live load on the buried box structures decreased when the embankment thickness increased. Additionally, the 2012 AASHTO LRFD standard was conservative in predicting strain/displacement compared to field data for burial depths below 2.4 m [9]. Seo et al. [10] indicated that the modeling of in-plane live-load attenuation improved the reinforced concrete box culvert load-rating results by considering the system-level pavement stiffness model.
For buried box structures, the depth of cover material and the length of the reinforced concrete transition plate affect the behavior of the pavement [10]. Taking into account the stiffness of the pavement can increase the load effect for both medium-thickness asphalt concrete pavements and cement concrete pavements, both for box structures with vehicles applying directly on the top plate (i.e., deck slab) and for box structures with small burial depths [10]. However, these studies [10] still have some limitations, such as using two-dimensional reduced models, such as linear-elastic behavior, and not considering wheel track area with axle. The evaluation and optimization of the structural performance of reinforced concrete buried structures in poorly cohesive soils have also been investigated by parametric analysis in the finite element model [16]. However, Alshboul et al. [16] focused on the complete circular section, small diameter (smaller than 1.5 m), and untapped the influence of vehicle load. Studies on BPAS have still not been thoroughly evaluated. Therefore, investigations into the behavior of BPAS due to the impact of vehicles have become a matter of concern for researchers worldwide.
This research presents an approach to examine the behavior of a three-hinged buried precast arch structure under the impact of the designed truck by a three-dimensional finite element analysis (FEA) model. First, a sophisticated three-dimensional FEA model was described and simulated. The following section introduces and explains in detail the surface interaction model and the connection model of the structural components in the FEA model. Next, behavior analysis (displacement and stress) was performed to study the impact of the vehicle load above on the buried arch structure. Finally, the key conclusions were drawn from the study.
2. Methods
2.1. FEA Model of Studied BPAS
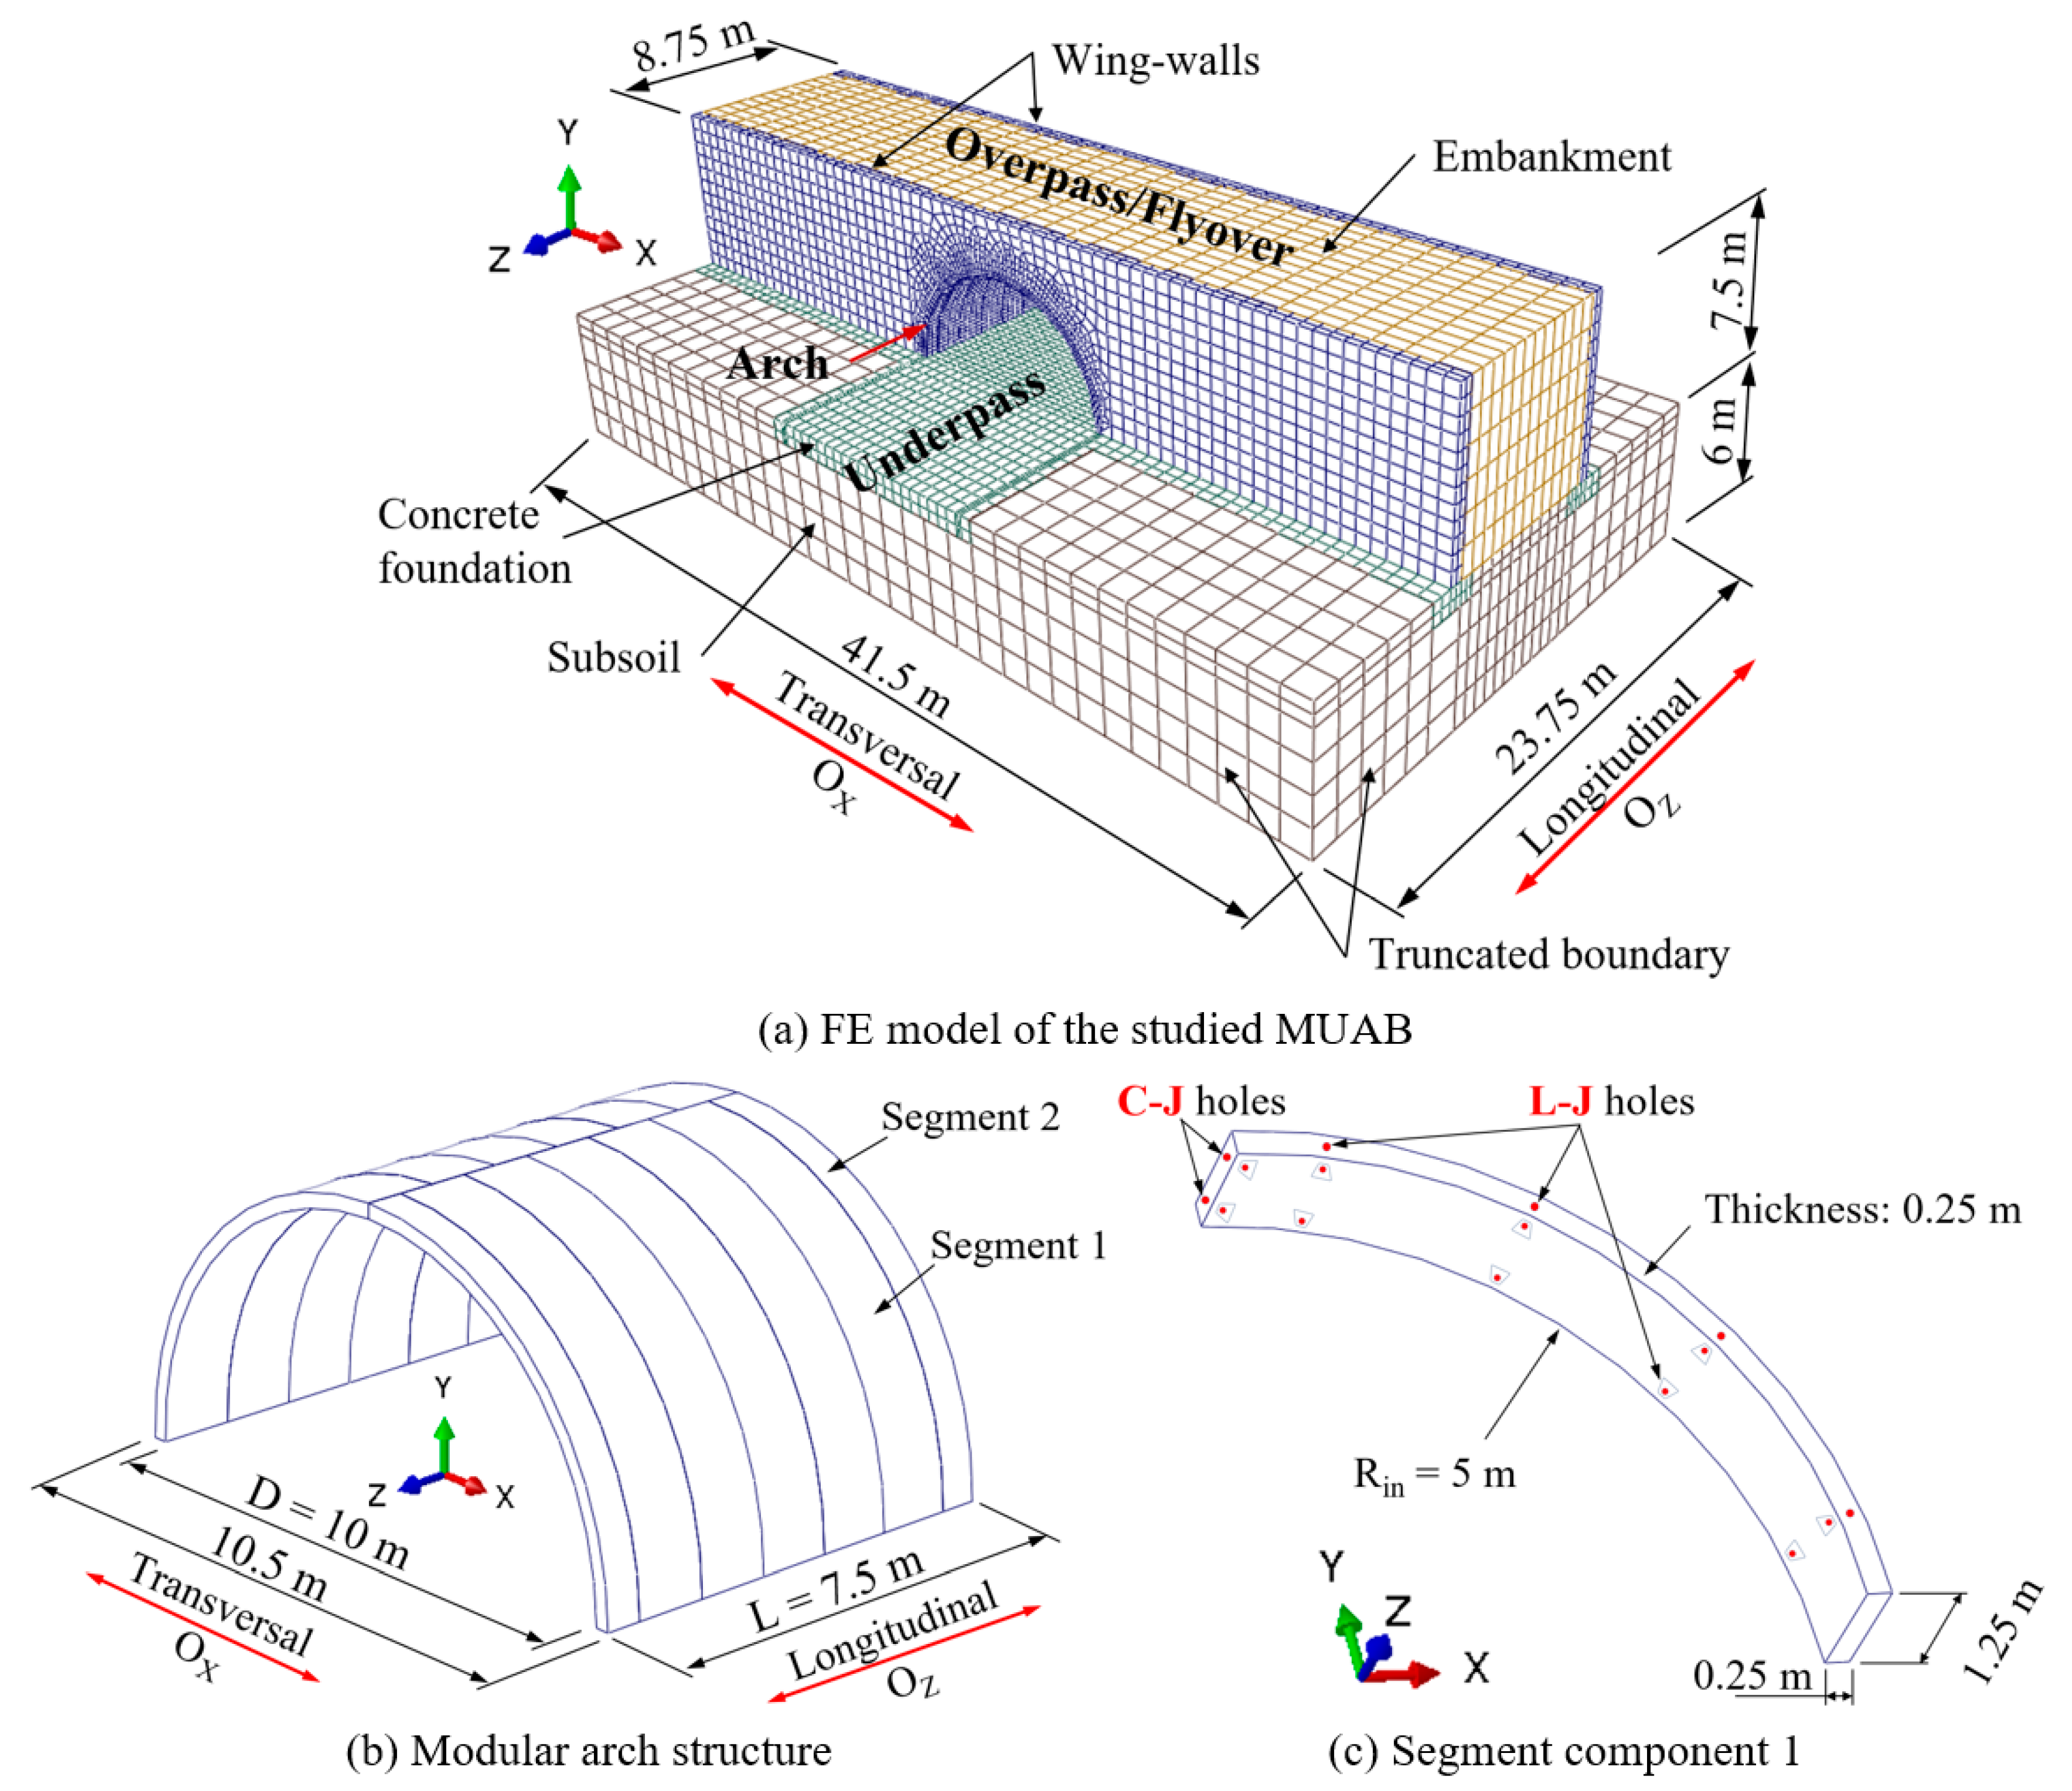
A three-hinged BPAS having an overpass road and an underpass road, as shown in Figure 1 [3], was numerically simulated with an eight-node brick element (C3D8 element) using ABAQUS software [17]. The total length of the arch (half a circle), including wing walls, is 8.75 m. The arch length is enough to accommodate two lanes of traffic running above. The outer and inner diameters of the arch are 10.5 m and 10 m, respectively, implying the arch thickness is 0.25 m. The inner diameter of 10 m is enough to design two lanes of traffic for the underpass road. The arch structure was erected in a staggered pattern by two types of segmental arch. These segments have an identical thickness and inner/outer radii; however, their widths differ (1.25 m and 0.625 m). Wing walls and embankments fitted the geometrical features of the three-hinged BPAS. The BPAS was set on an inverted concrete foundation (with a thickness of 1.0 m). Each concrete wing wall (0.625 m thickness) was installed on the wing wall foot. The surrounding soil comprised a 7.5 m-thick embankment and a 6 m-thick subsoil laid on top of the bedrock (hypothetical strata). Assume that the pavement structure of the overpass road is 0.5 m thick. Therefore, the total thickness of layers covering the arch structure at the top of the crown (i.e., burial depth) is 2.25 m and is 1.75 m if excluding the pavement structure thickness.
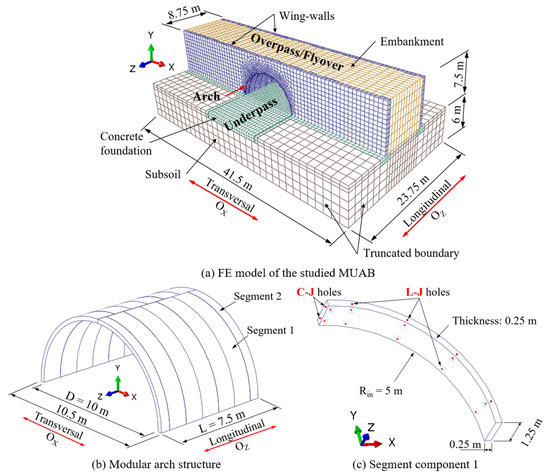
Figure 1.
Schematic of the studied buried precast arch structure [3].
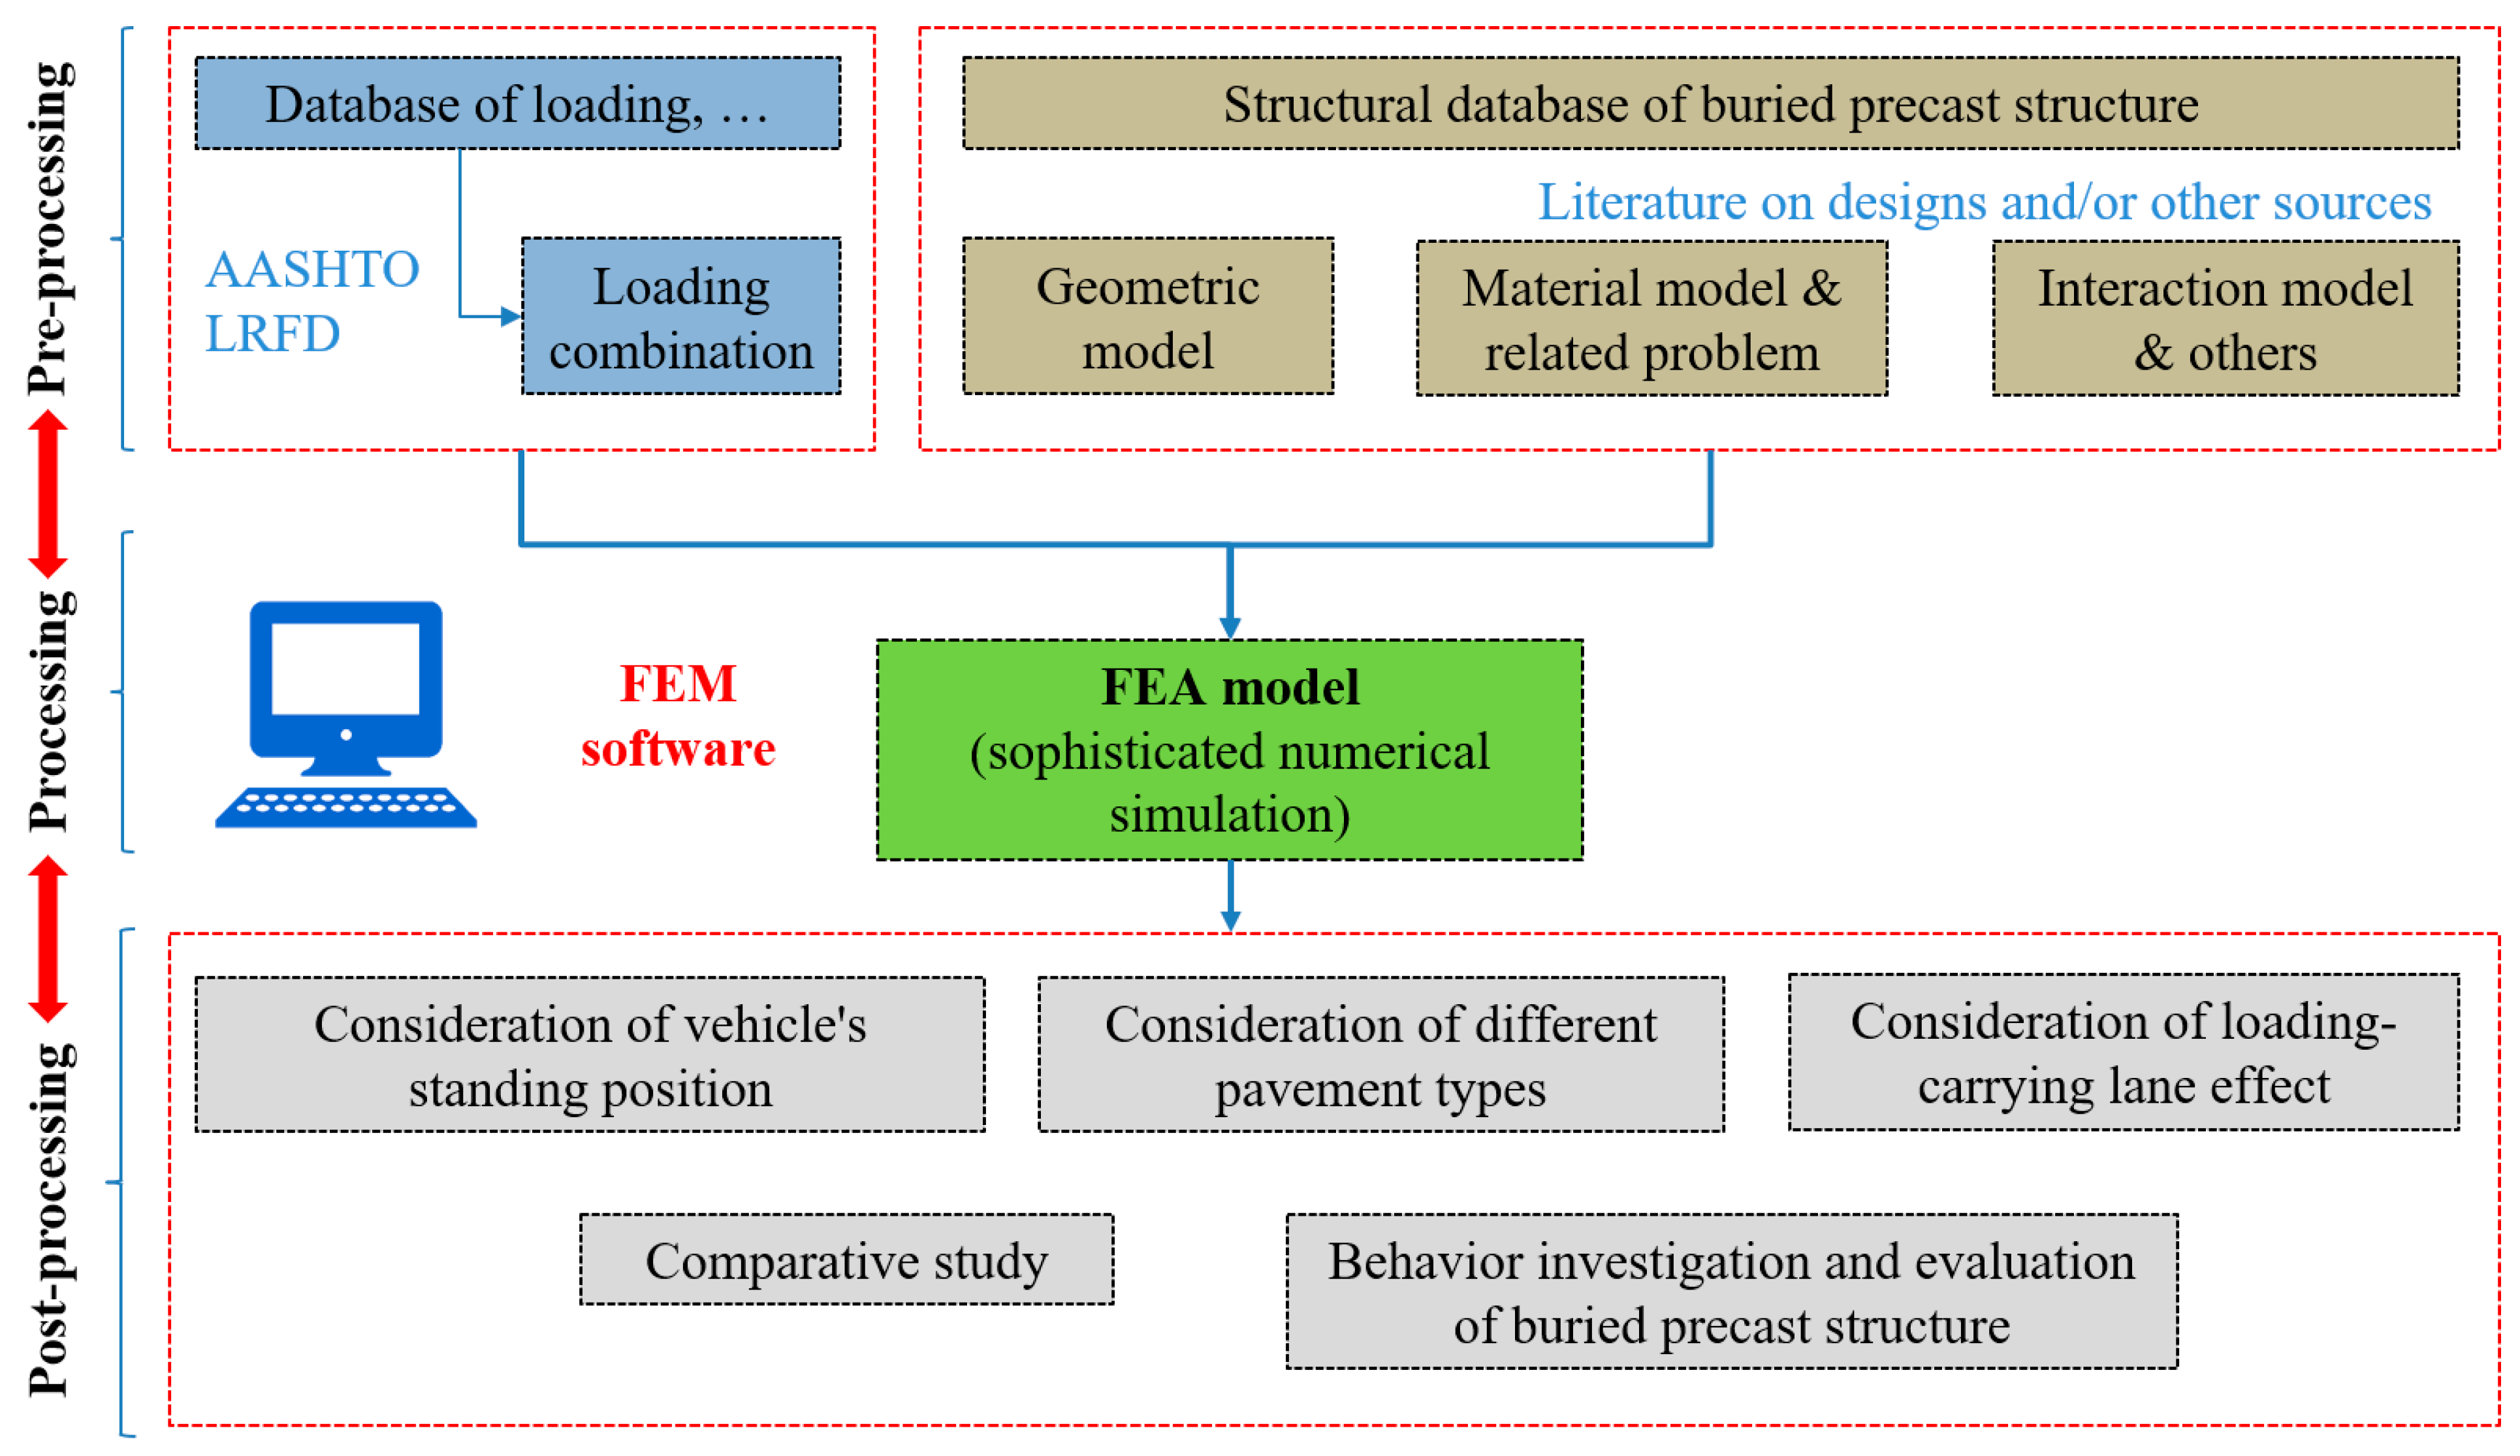
The proposed research process of this study is presented in the diagram, as shown in Figure 2. In an innate problem of FEA, a too-coarse element meshing could lead to deviations from the expected accuracy. In contrast, a too-fine element meshing could consume much time and computing resources, especially for a high-complexity model and/or a large size. For this reason, a sufficiently fine element meshing was used for the concrete structure, and a coarser element meshing was applied for the surrounding soil to make a suitable FEA model meshing for the studied BPAS (see Figure 1). In addition, sufficient element meshing with an optimal element number was estimated before conducting a replication analysis. The technique was based on gradually testing the relationship between the number of meshed elements and the convergence of displacement and the analysis time [3].

Figure 2.
Schematic of the proposed methodology for numerical research.
2.2. Material Model
The concrete used in the BPAS was modeled using ABAQUS. The study considered its nonlinearity [18] using the plastic-damage model (i.e., concrete damaged plasticity model) established by Lee and Fenves [19,20]. The concrete damaged plasticity model was adopted to simulate the damage-cracking behavior of concrete, which is necessary. This model in quasi-brittle materials can be defined by calculating the dissipated fracture energy necessary to form microcracks in the BPAS concrete. The model was built to assume that the concrete uniaxial compressive and tensile responses were impacted by damaged plasticity. The rate-independent model assumes the critical components of the inviscid-concrete damage plasticity model under strain-rate decomposition. Elastic and plastic components made up the entire strain tensor.
M40-grade concrete (having compressive and tensile strengths are f’c = 40 MPa and ft = 4 MPa, respectively) was modeled in ABAQUS and used for the segmental arch and wing wall; meanwhile, M30-grade concrete (having compressive and tensile strengths are f’c = 30 MPa and ft = 3 MPa, respectively) was designed and used for the invert foundation (Figure 3). The inelastic strain was initialized in compressive behavior as 50% of the tensile strength, f’c. Above this point, the curve steadily grew to the compressive strength, f’c. The first crack appeared at 85 percent of f’c. After reaching its peak, the stress–strain curve dropped (referred to as the softening section of the curve). Crushing failure occurred at an ultimate strain of 20% f’c after the curve dropped. The elastic strain, on the other hand, increased the tensile strength. Cracking strain developed after the tension stress peak (i.e., at the tensile strength). At an ultimate strain of 1% ft, stiffening failure occurred. The numerical simulation of concrete material was briefly introduced in this part, and the properties of the concrete damaged plasticity model are shown in Table 1. Details can be further referred to Nguyen et al. [3].
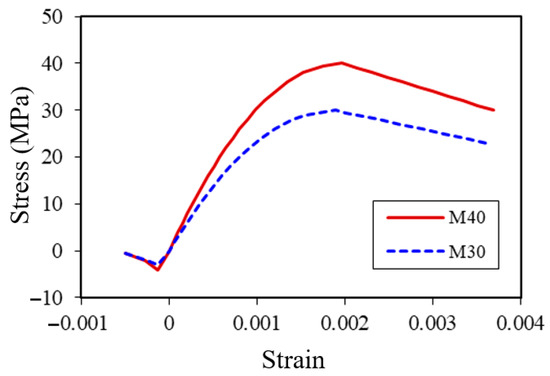
Figure 3.
Stress–strain relationship of concrete material.

Table 1.
Properties of the concrete model for BPAS.
The surrounding soil of the BPAS model is symmetrical. To avoid losing the generality of the buried structure problem, the BPAS model was built with a shallow cover on top of the segmental arch (the burial depth, including pavement structure, is 2.25 m < 2.4 m) [13]. The soil properties addressed in the BPAS FEA model for soil generalizability are given in Table 2, which were previously employed by [3]. These are the general values for the soils applicable to BPAS construction, including standard clayey subsoil and high-quality mixed sandy embankment soil. The Mohr–Coulomb plasticity model created the FEA soil model geometry (see Figure 1), allowing soil hardening behaviors.
Table 2.
Properties of the surrounding soil.
2.3. Contact Surface and Joint Model
For segmental arch structures, the joint surface shapes the between segments (e.g., concave-convex joints, flat joints, tongue–groove joints), and the effect of the prestressed rebar system in the arch structure creates shear resistance at the contact surfaces between the segments. In addition, the backfill material should have a high friction angle and be compacted to create a significant soil-arching effect surrounding the arch structure. Therefore, it is necessary to accurately model the friction of the contact surfaces between structural parts of BPAS [3].
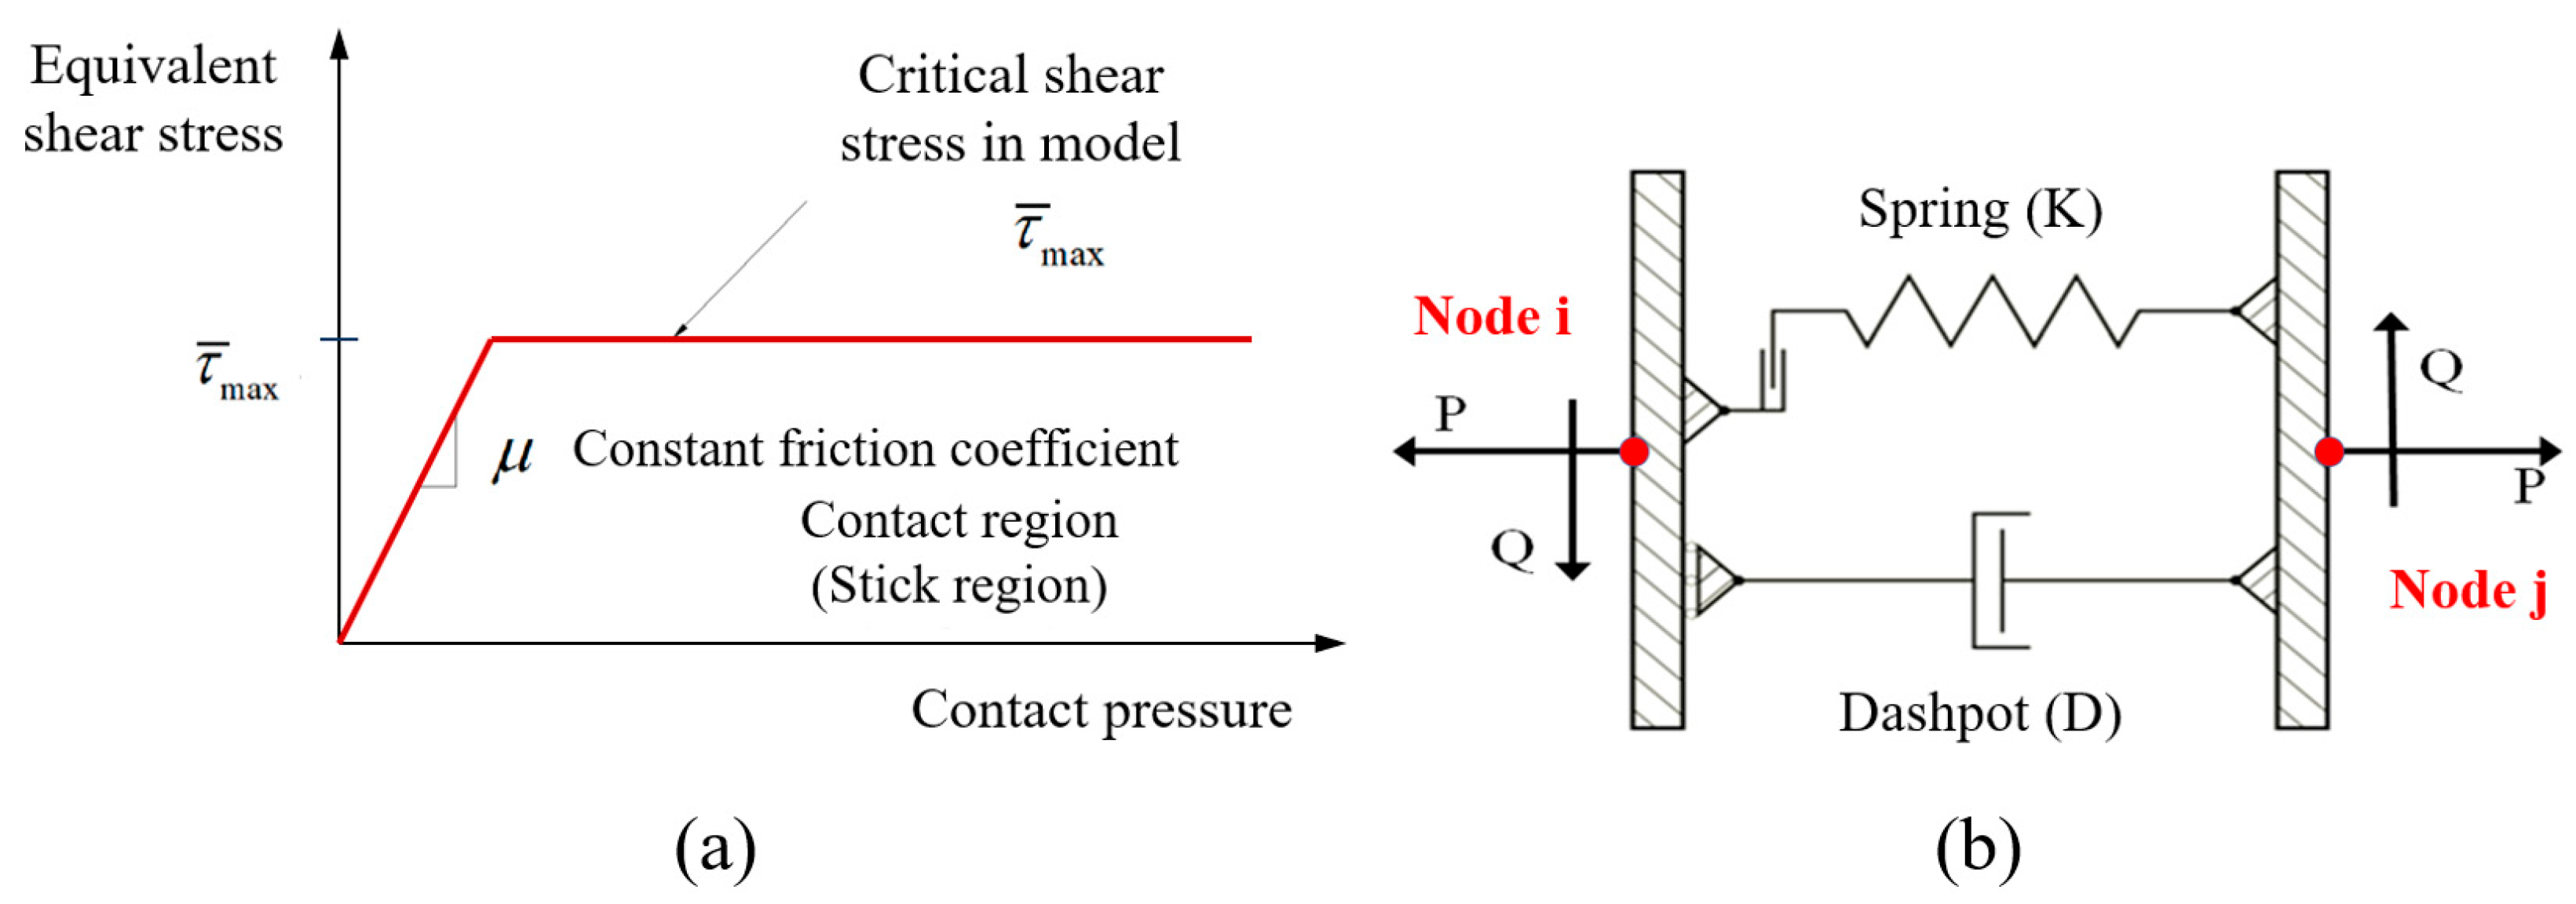
Contact surfaces were used to model the shear-force resistances in the FEA model: (1) between segments and (2) between segments and the surrounding soils. The mechanical contact properties of these contact surfaces were modeled with surface-to-surface contact interactions in ABAQUS using the hard contact and standard Coulomb friction model [17]. In the basic form of the Coulomb friction model, two contacting surfaces can carry shear stresses up to a certain magnitude across their interface before they start sliding relative to one another [see Figure 4a]. The standard Coulomb friction model relates the maximum allowable frictional shear stress across an interface to the contact pressure between the contacting bodies. The modeling of contact surfaces and the calculation of surface friction coefficients have been presented in previous studies [3]. To represent a normal-weight concrete cast against hardened concrete, the Coulomb friction model was created with an interface friction coefficient of 0.6 for segment-to-segment interactions. Interface friction coefficients of soil–concrete interactions were calculated with two-thirds of the internal friction angle of the soil [3].
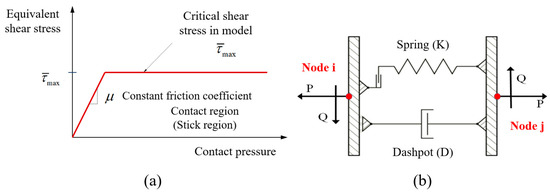
Figure 4.
(a) Slip regions for the standard Coulomb friction model [17], and (b) simplified model of segmental connection using prestressed steel rebars.
The standard Coulomb friction model defines critical shear stress at which sliding of the surfaces starts as a fraction of the contact pressure between the surfaces, as Equation (1). For a three-dimensional model, two orthogonal components of shear stress ( and ) are along with the interface between the two bodies, and these components act in the local tangent directions for the contact surfaces or contact elements. Slipping can occur if the equivalent stress is critical stress . In addition, the friction is isotropic, resulting in the direction of the slip and the frictional stress coinciding as Equation (3) [17].
where critical shear stress; is contact pressure; is the isotropic friction coefficient; is user-specified; is equivalent shear stress; is an equivalent slip rate; and are two shear stress components; is the slip rate in direction ().
The FEA model used tie constraints as a semi-rigid link between the arch segments and the inverted concrete foundation. Surface-based tie constraints connect two surfaces. The surface-to-surface discretization technique was used [17]. Longitudinal and circumferential connections between arch segments by prestressed steel bars modeled using spring elements were presented by Nguyen et al. [3]. The stiffness of the joint by the prestressed steel bar is equal to the stiffness of the spring [see Figure 4b]. The tensile and compressive stiffnesses of prestressed steel bars were calculated using Equation (4) [3].
where k = equivalent stiffness (N/m), A = cross-sectional area of rebar (m2), E = elastic modulus of material (Pa), and L = length of the rebar (m).
3. Pavement Structure and Vehicle Load
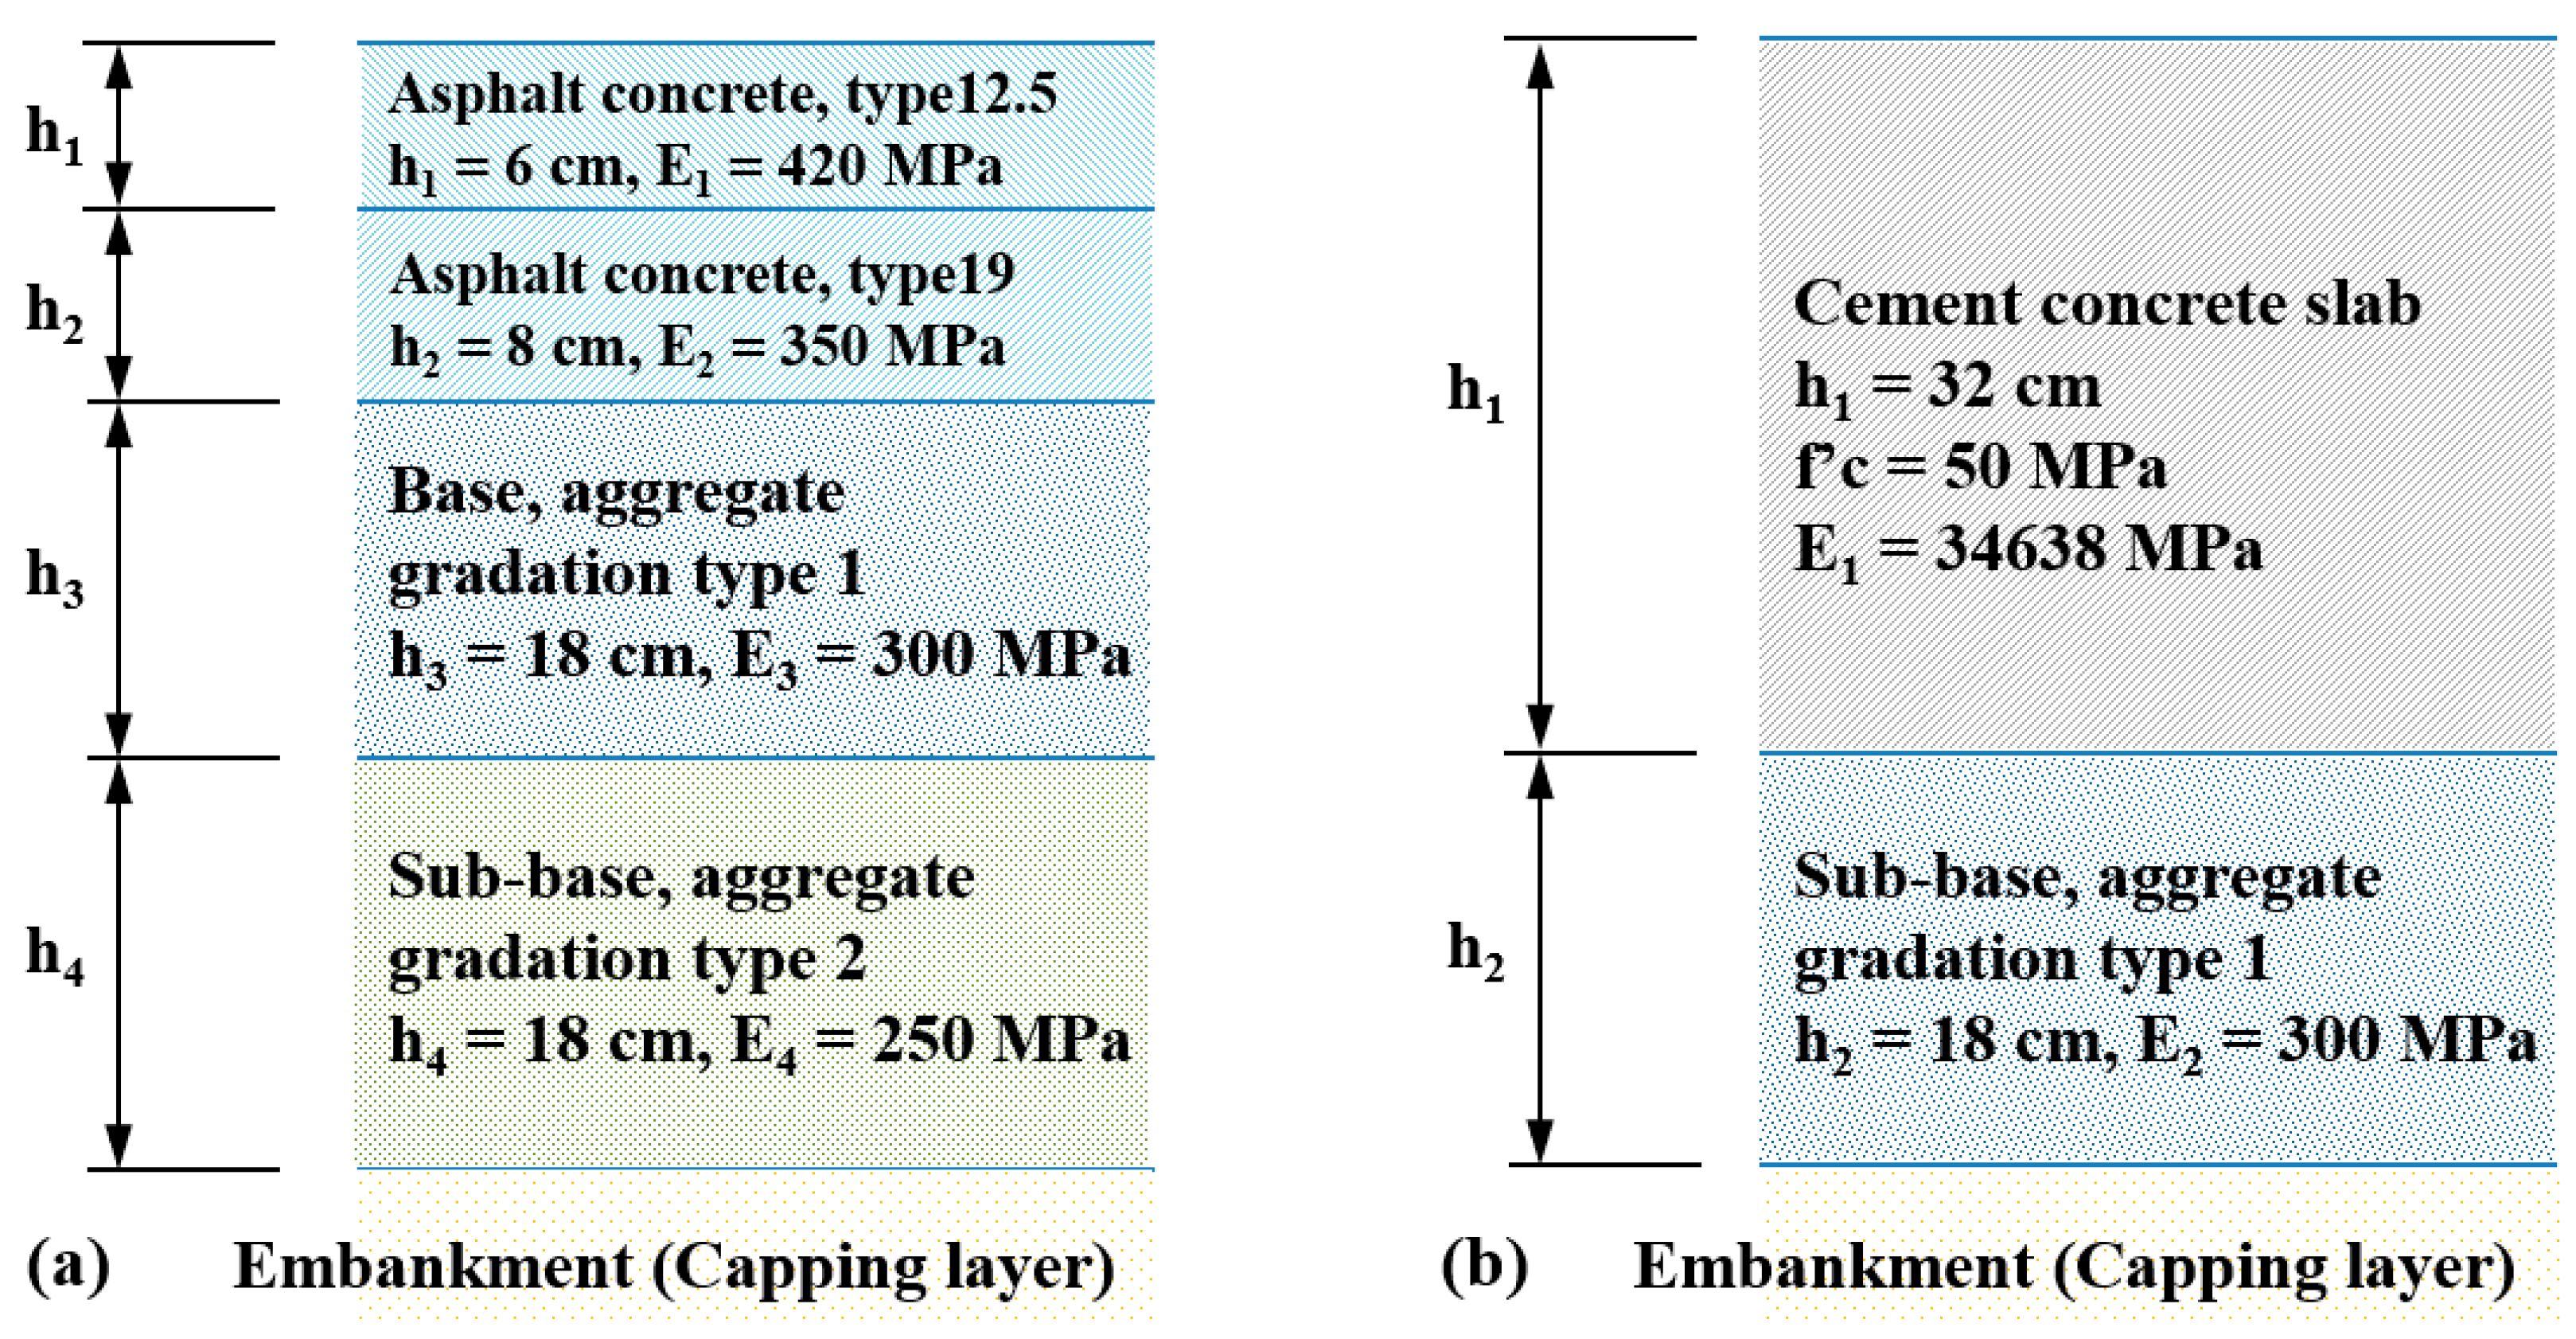
The general assumption was that the pavement structure was expected to have a thickness of 50 cm. Two options for the pavement structure (soft pavement structure made of asphalt concrete pavement (ACP) and hard pavement structure made of cement concrete pavement (CCP)) were proposed, as shown in Figure 5. Specifications of design and construction for soft and rigid pavement structures were followed on TCCS 38:2022 [21] and TCCS 39:2022 [22], respectively, applied as the basis for the structural and material selection of the component classes. These pavement structures are general and common without loss of generality. The surface layers were assumed to be monolithic working material layers modeled as elastic behavior materials.
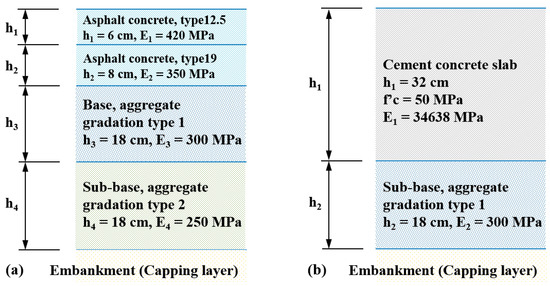
Figure 5.
Schematic case of pavement structures composed of multilayers: (a) asphalt concrete pavement and (b) cement concrete pavement.
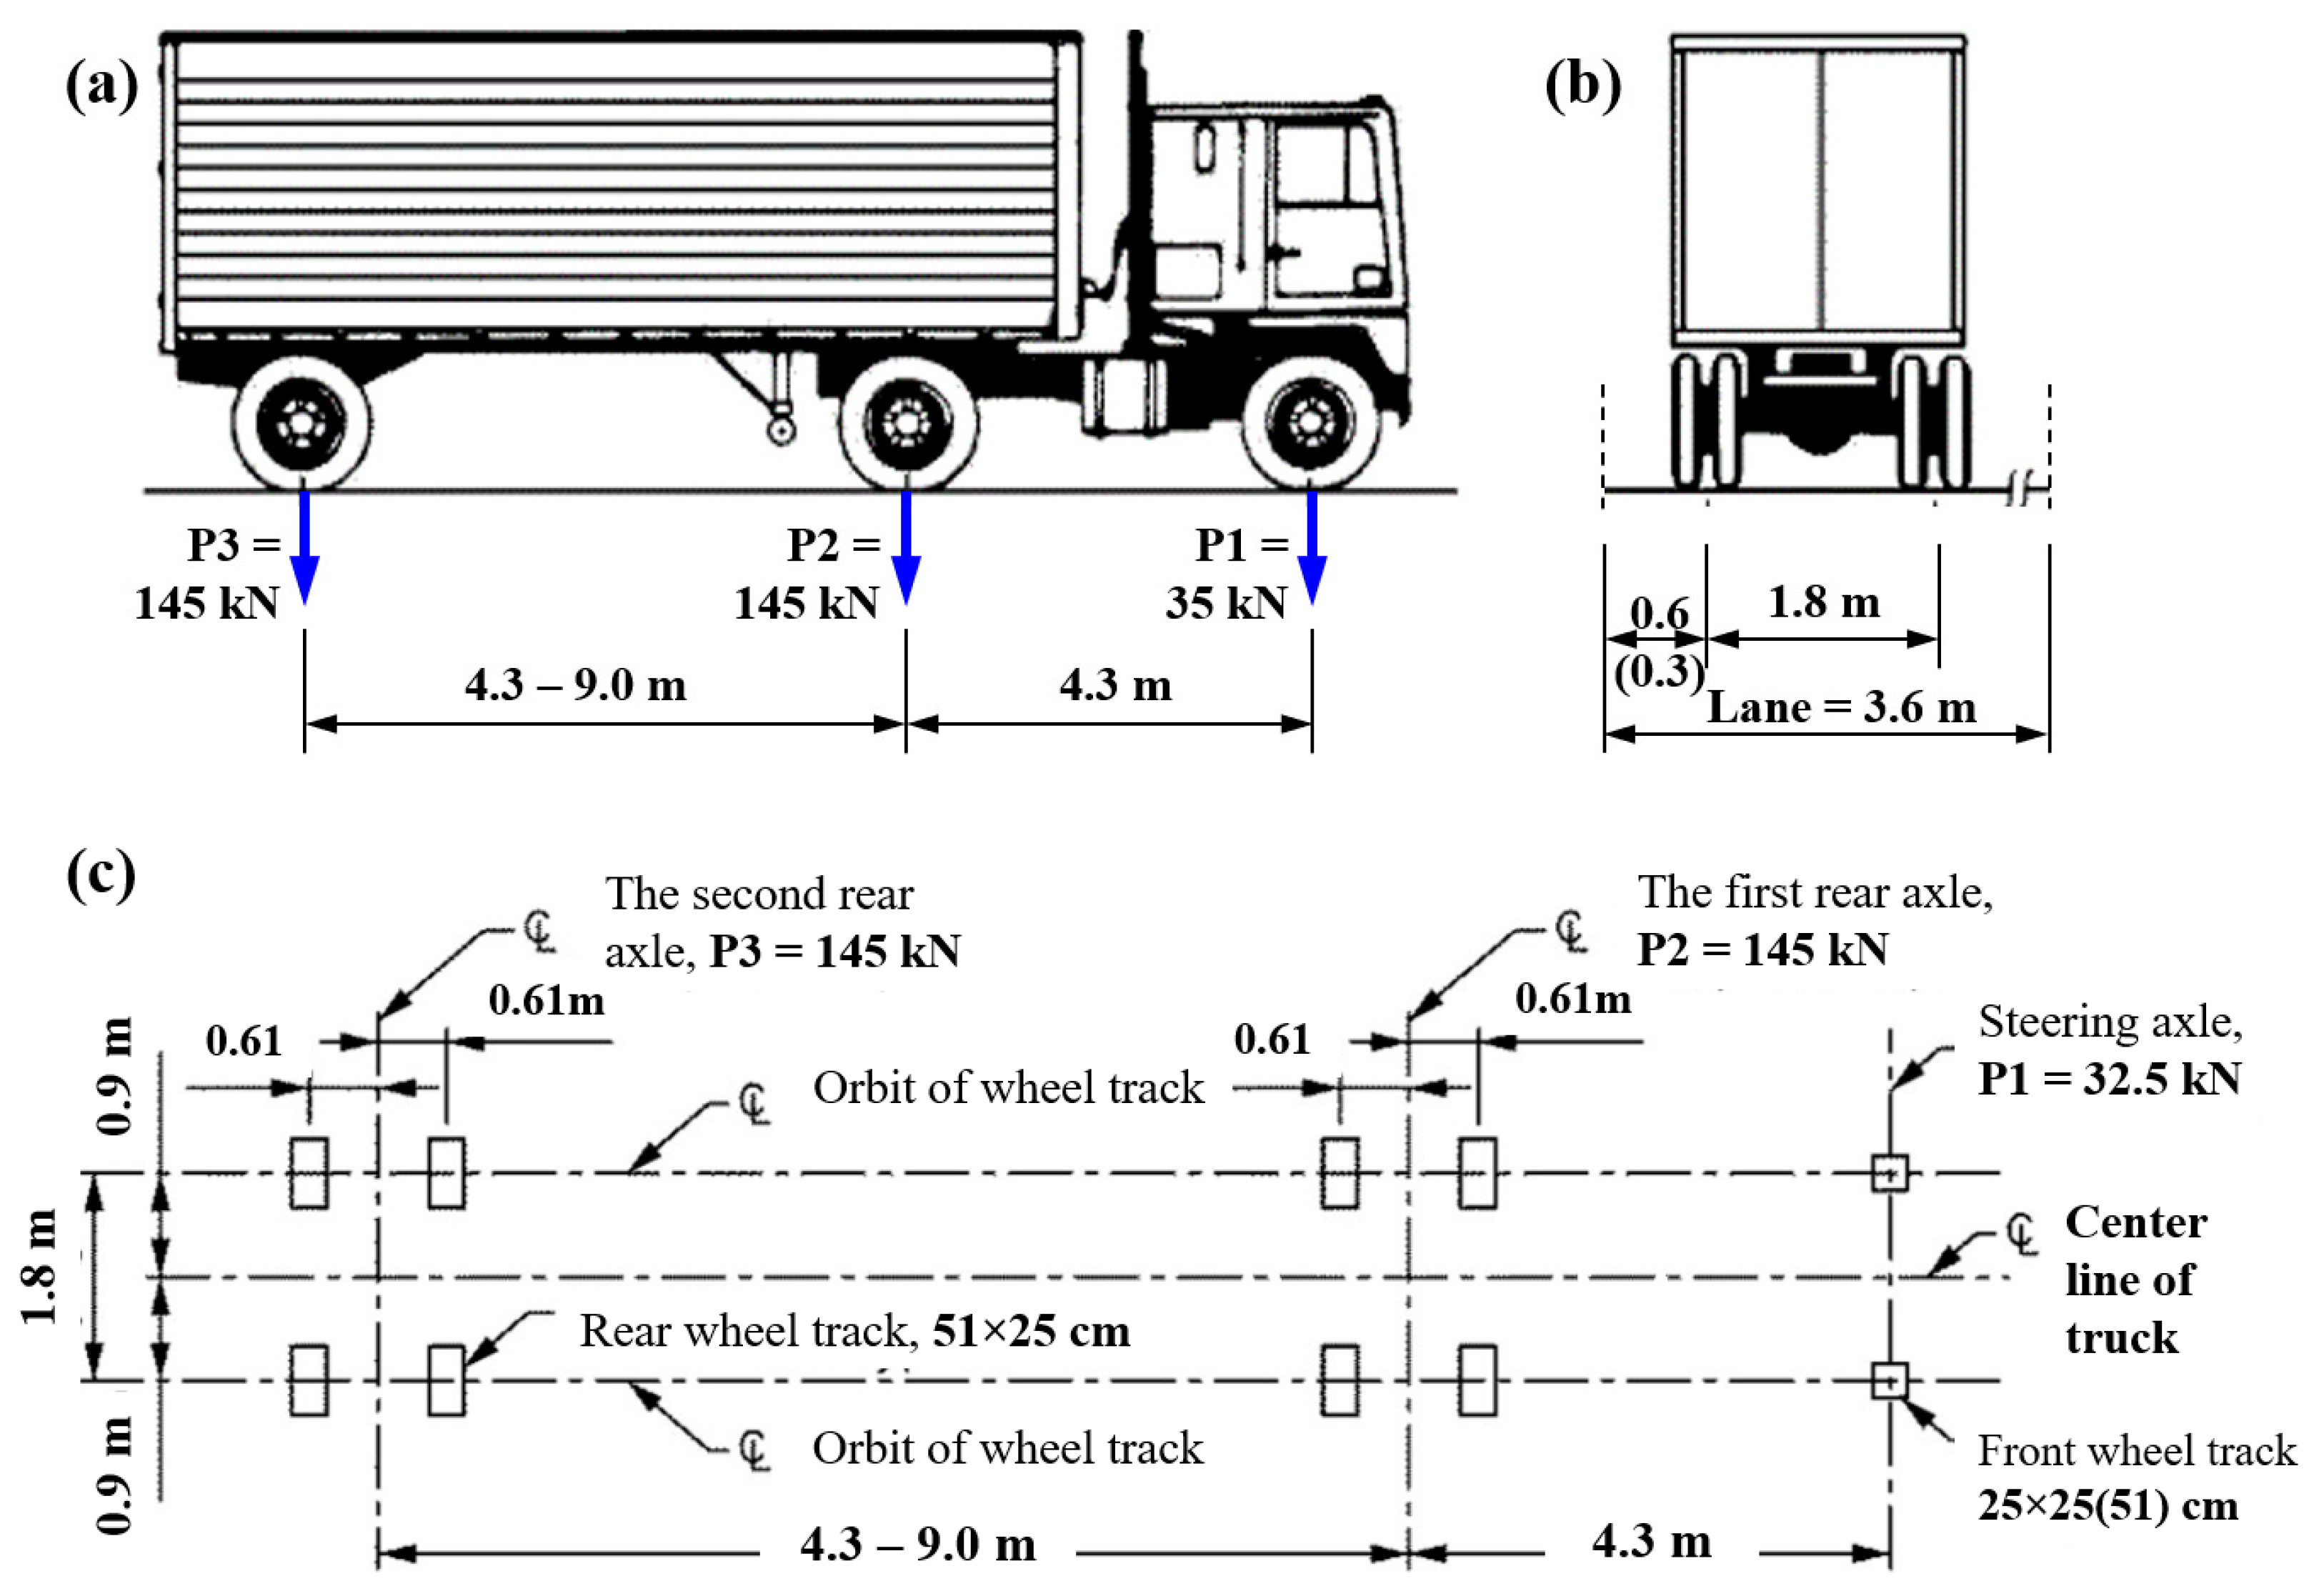
In this study, assuming slow-moving, the vehicle load was considered as the static load. This means that the vibration and dynamic force factors arising during the vehicle’s movement (including braking force) are not considered. The vehicle load was built in the analytical model through the load distribution diagram of the design truck axles and the corresponding wheel tracks (Figure 6) according to design standards [13,14]. The tire contact area (wheel track) of a wheel assembly (with one or two tires) is assumed to be a rectangle of 51 × 25 cm [with a width of 51 cm (horizontal) and a length of 25 cm (longitude)]. The tire pressure is evenly distributed over the contact area at that time. The magnitude of the pressure depends on the value of the axle load distributed to the wheel assembly. In the case of the orthogonal deck slab and the orthogonal deck cover, the wheels of the front axle are assumed to be a single 25 × 25 cm rectangle. In the case of two lanes, the trucks are placed in the same direction. The distance between the two closest rows of wheels of the two parallel trucks is 1.2 m. All relevant provisions were met following the provisions of the current standard [13,14]. The distance between the front axle and the first rear axle (i.e., [P1–P2]) is 4.3 m, while the distance from the first rear axle to the second rear axle (i.e., [P2–P3]) is adjustable in the range from 4.3 m to 9.0 m.
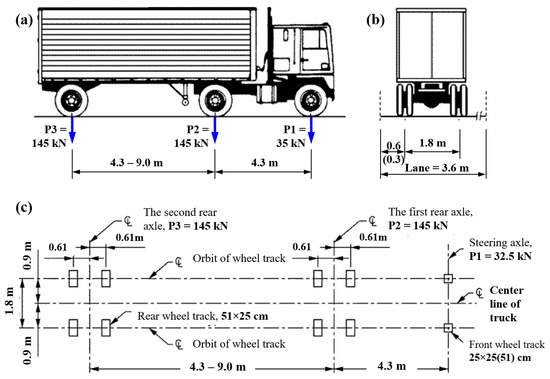
Figure 6.
Load distribution diagram of the design truck axles and corresponding wheel tracks: (a) Elevation view (the longitude of the truck); (b) side view (the horizontal of the truck); (c) wheel track diagram on the road [13,14].
A self-weight and design truck loading combination was applied to the BPAS structure under different scenarios (see Table 3). The behavior of BPAS under vehicle load was analyzed and calculated by a static implicit solver considering the geometry and material nonlinearities. This set of algorithms is available in ABAQUS for the stages to be analyzed: quasi-static and static stages [17]. The semi-static phase was modeled to remove the inertia effect before the truck was loaded. The self-weight loading increased linearly with small increments applied long enough until the stress/displacement in the arch reached static stability. The truck loading was then added to the FEA model for a steady period. In this analysis problem, the displacements of the lateral faces were limited on truncated boundaries and did not change during the analysis period.
Table 3.
Matrix of studied scenarios.
A multi-case analysis with different load steps and load combinations of BPAS was carried out to evaluate the behavior of the arch structure in many different aspects. All segment components of the BPAS were evaluated at each arch cross-section alongside the longitudinal direction of the arch structure, especially at three cross-sections, including the arch mouth, one-four of the arch length, and one-two of the arch length. A sketch of critical BPAS sections and their monitoring points is shown in Figure 7. At each monitoring section, the behavior of the arch was evaluated in the element at the angle from 0° (bottom) to 90° (top), similar to the method applied to the previous buried precast arch structures [3,23].
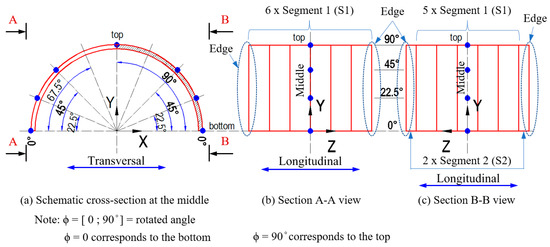
Figure 7.
Sketch of critical BPAS sections and their monitoring points.
4. Results and Discussions
4.1. Response of Segmental Arch
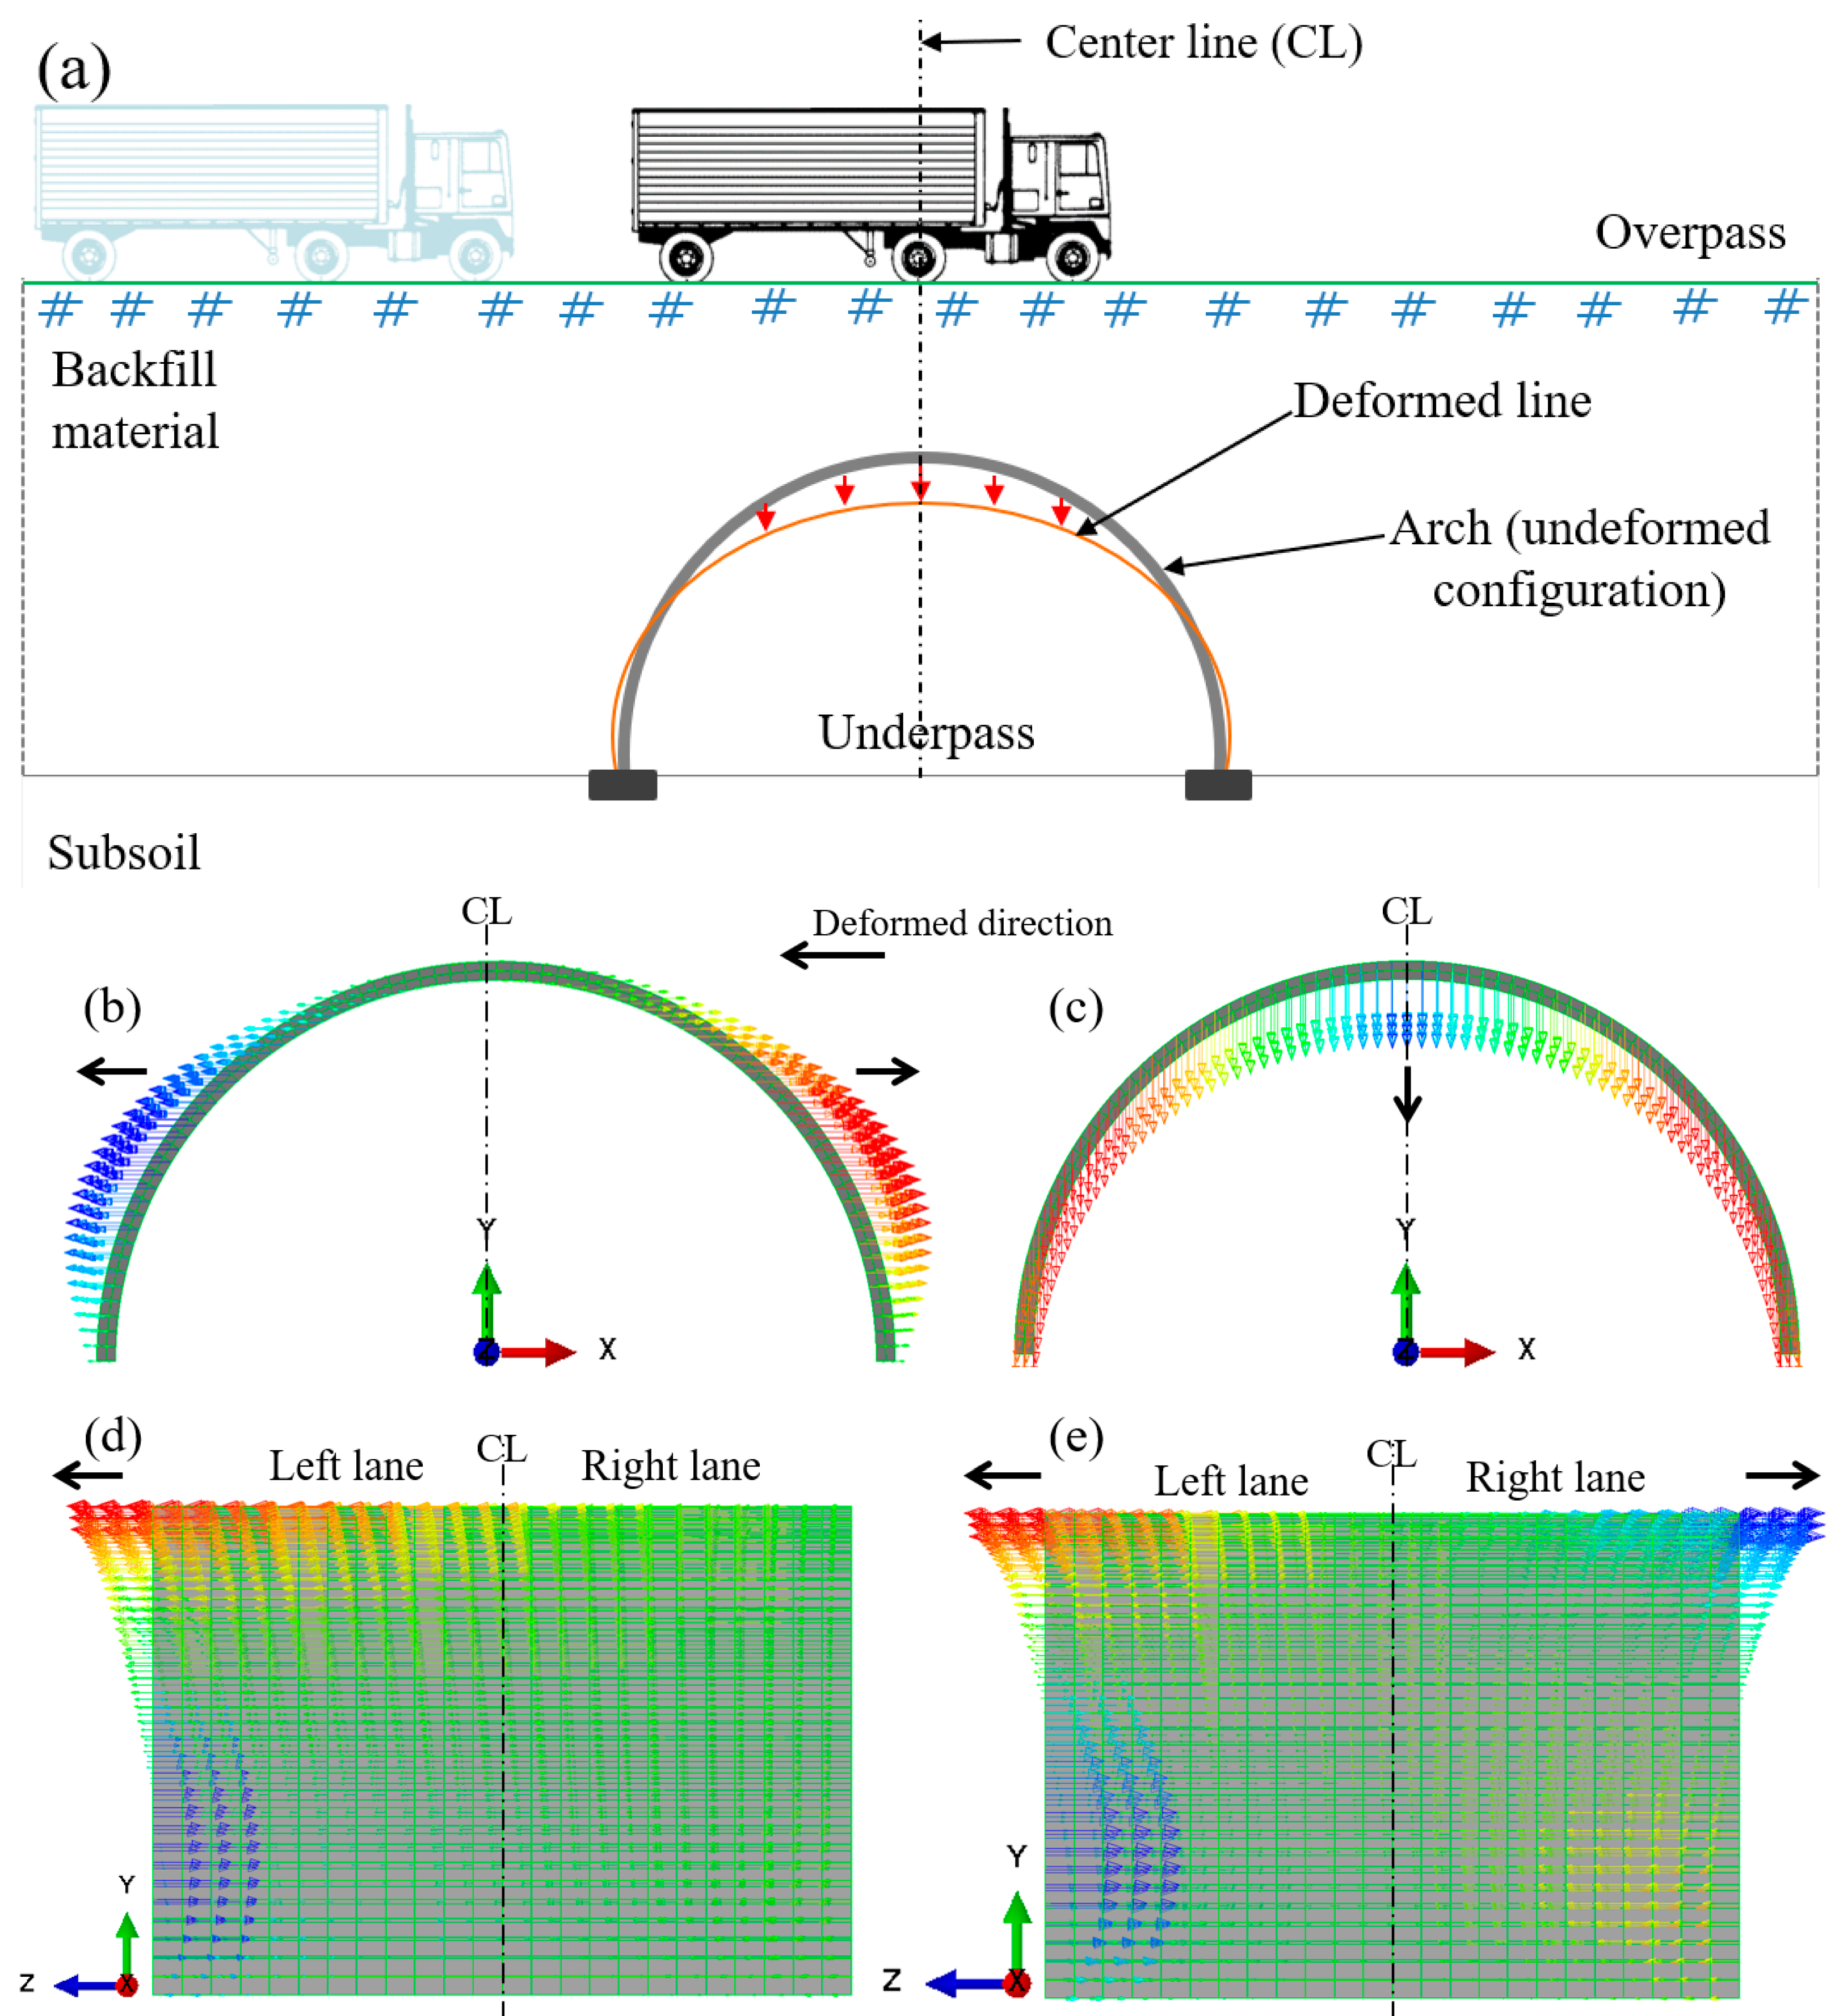
The influence of vehicles on the underlying structure depends on the vehicle’s standing position [12]. The problem becomes simpler and can be considered a series of discrete static action cases when the speed of vehicle movement is low enough and the time to transfer the vehicle weight to the arch structure system is large enough. Figure 8 illustrates the displacement pattern of the arch in three directions (transverse, longitudinal, and vertical directions of the arch). The obtained analytical results are similar to the findings and records in previous research reports [24,25]. Seeing that the top (i.e., ϕ = 90°) of the arch mouth resulted in the largest displacement, the arch mouth is the most vulnerable to damage compared to other positions on the arch when subjected to vehicle loading. In particular, the top of the arch was more prone to peeling and destruction than the mid-arch body part (i.e., ϕ = 22.5–67.5°). Therefore, the top of the arch mouth could be considered the weakest zone. The arch feet (i.e., ϕ = 0°) were relatively stable. The mid-arch body zone tended to bulge laterally in the transverse direction of the arch when loaded from the overpass. However, the lateral displacement was not significant due to the soil-arching effect of backfill around the arch. As a result, the bending moment arising in the mid-arch body can be reduced. The overall deformation diagram of the arch on the arch cross-section was focused on the vertical direction, as shown in Figure 8.

Figure 8.
(a) Diagram of the overall deformed configurations of the buried arch in cross-section in the hypothesis, and deformation diagram of the arch in FEA model in the following directions: (b) transverse direction, X; (c) vertical direction, Y; (d) longitudinal direction, Z, single-lane case (truck on left lane); (e) arch longitudinal direction, Z, two-lane case.
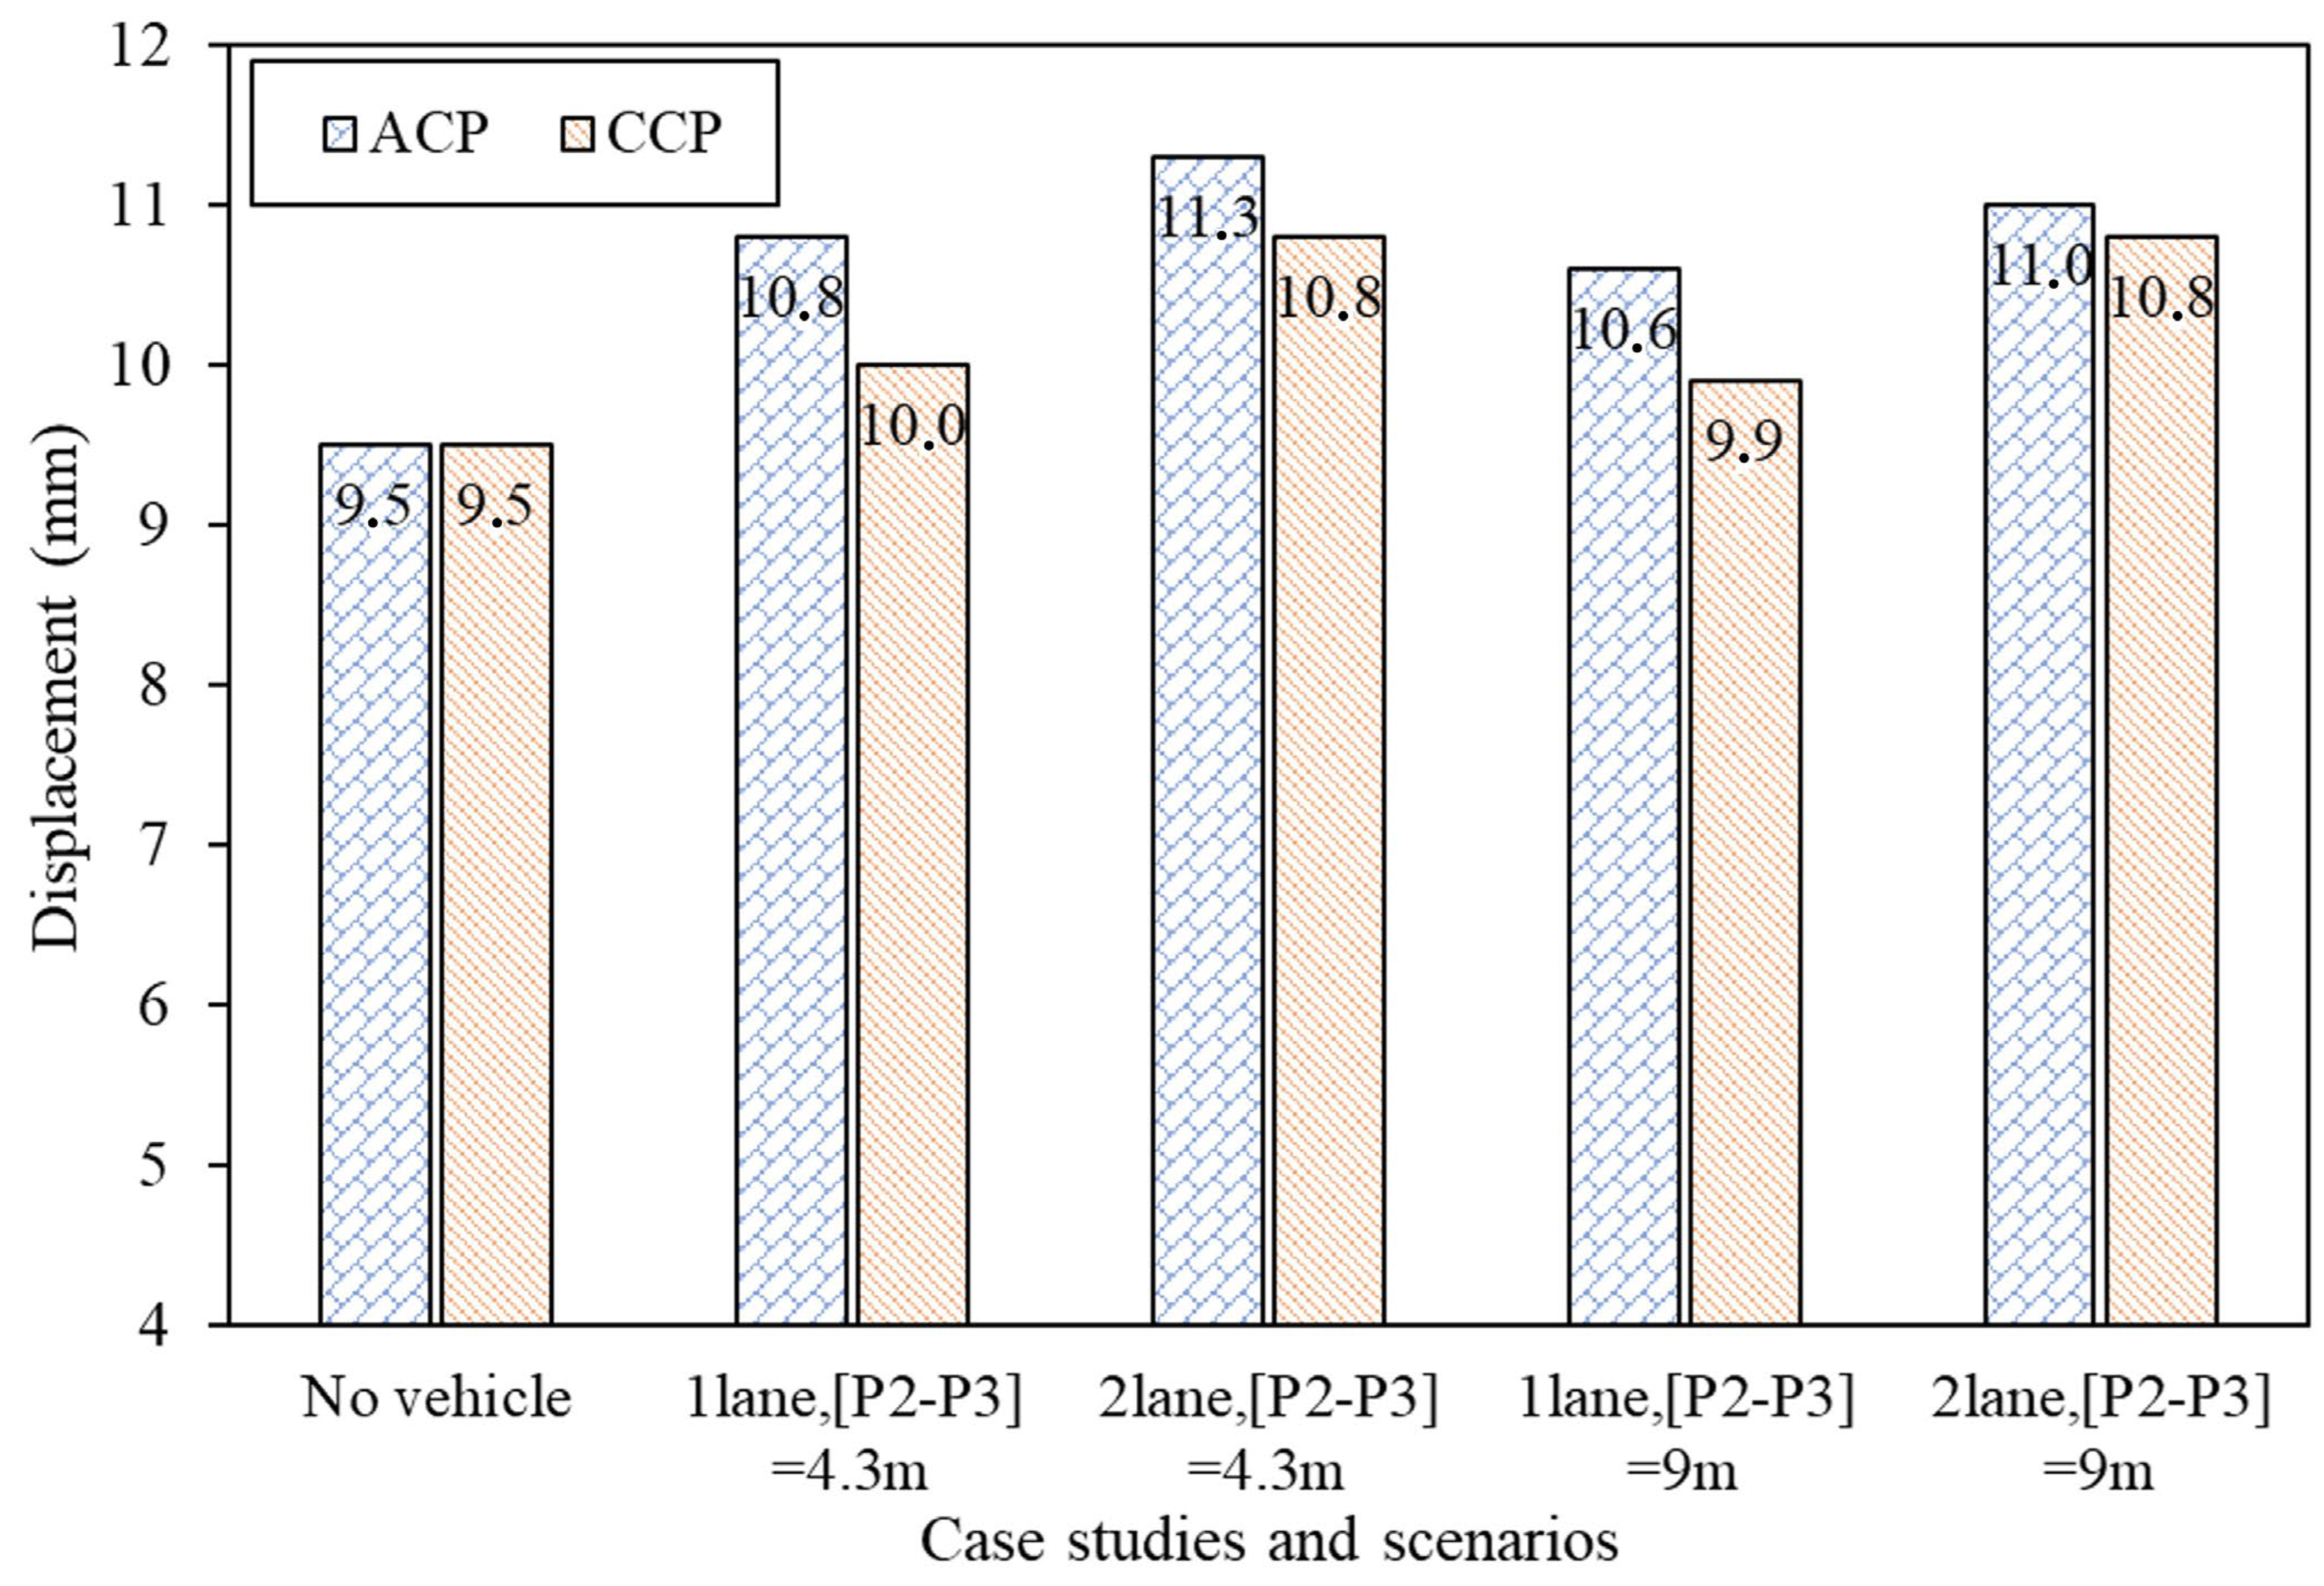
Figure 9 shows the maximum displacement of the arch under the influence of the truck-layout scenarios, considering the two different pavement structures. Displacement criteria for buried arch structures have been recommended to be mandatory in urban areas [13]. The allowable displacement for BPAS was proposed by a ratio of the arch span over 500 mm, as expressed in Equation (5). In the case of this work, the allowable displacement was 20 mm. The displacement of BPAS (in all combinations of the self-weight loading and the truck loading) was smaller than 50% of the allowable displacement (the average was approximately 45%). The analyzed results indicated that the displacement of the arch was only significantly dependent on the degree of loading concentration on the top of the arch, but less dependent on the number of loading traffic lanes. In other words, the effect of vehicle loads on multiple lanes did not cause any significant increase in displacement for the precast arch structures.

Figure 9.
The maximum displacement of the arch was under the influence of design truck loading scenarios that consider two different pavement structures.
The displacement excess rates in the cases with truck loading versus those without truck loading are summarized in Table 4. Furthermore, the highest and lowest rates of displacement excess were 18.9% (in the case of two-lane truck loading, the distance between the two rear axles was 4.3 m, on ACP road surface type) and 4.2% (in the case of single-lane truck loading, the distance between the two rear axles was 9 m, on CCP road surface type). The average displacement increased with the ACP, which was higher than that of the CCP (15.0% versus 9.2%). It shows that the influence of the above vehicle loaded on the BPAS was higher for the softer pavement structure (ACP compared with CCP). This is because the stiffer pavement structure (CCP) was capable of transferring and dispersing vehicle loads under the wheel tracks onto the embankment, which means that the loaded pressure per unit area directly below the stiffer pavement structure (CCP) could be lower than that of the softer pavement (ACP).
Table 4.
Percentage of displacement excess in the cases with a vehicle compared to the case without a vehicle.
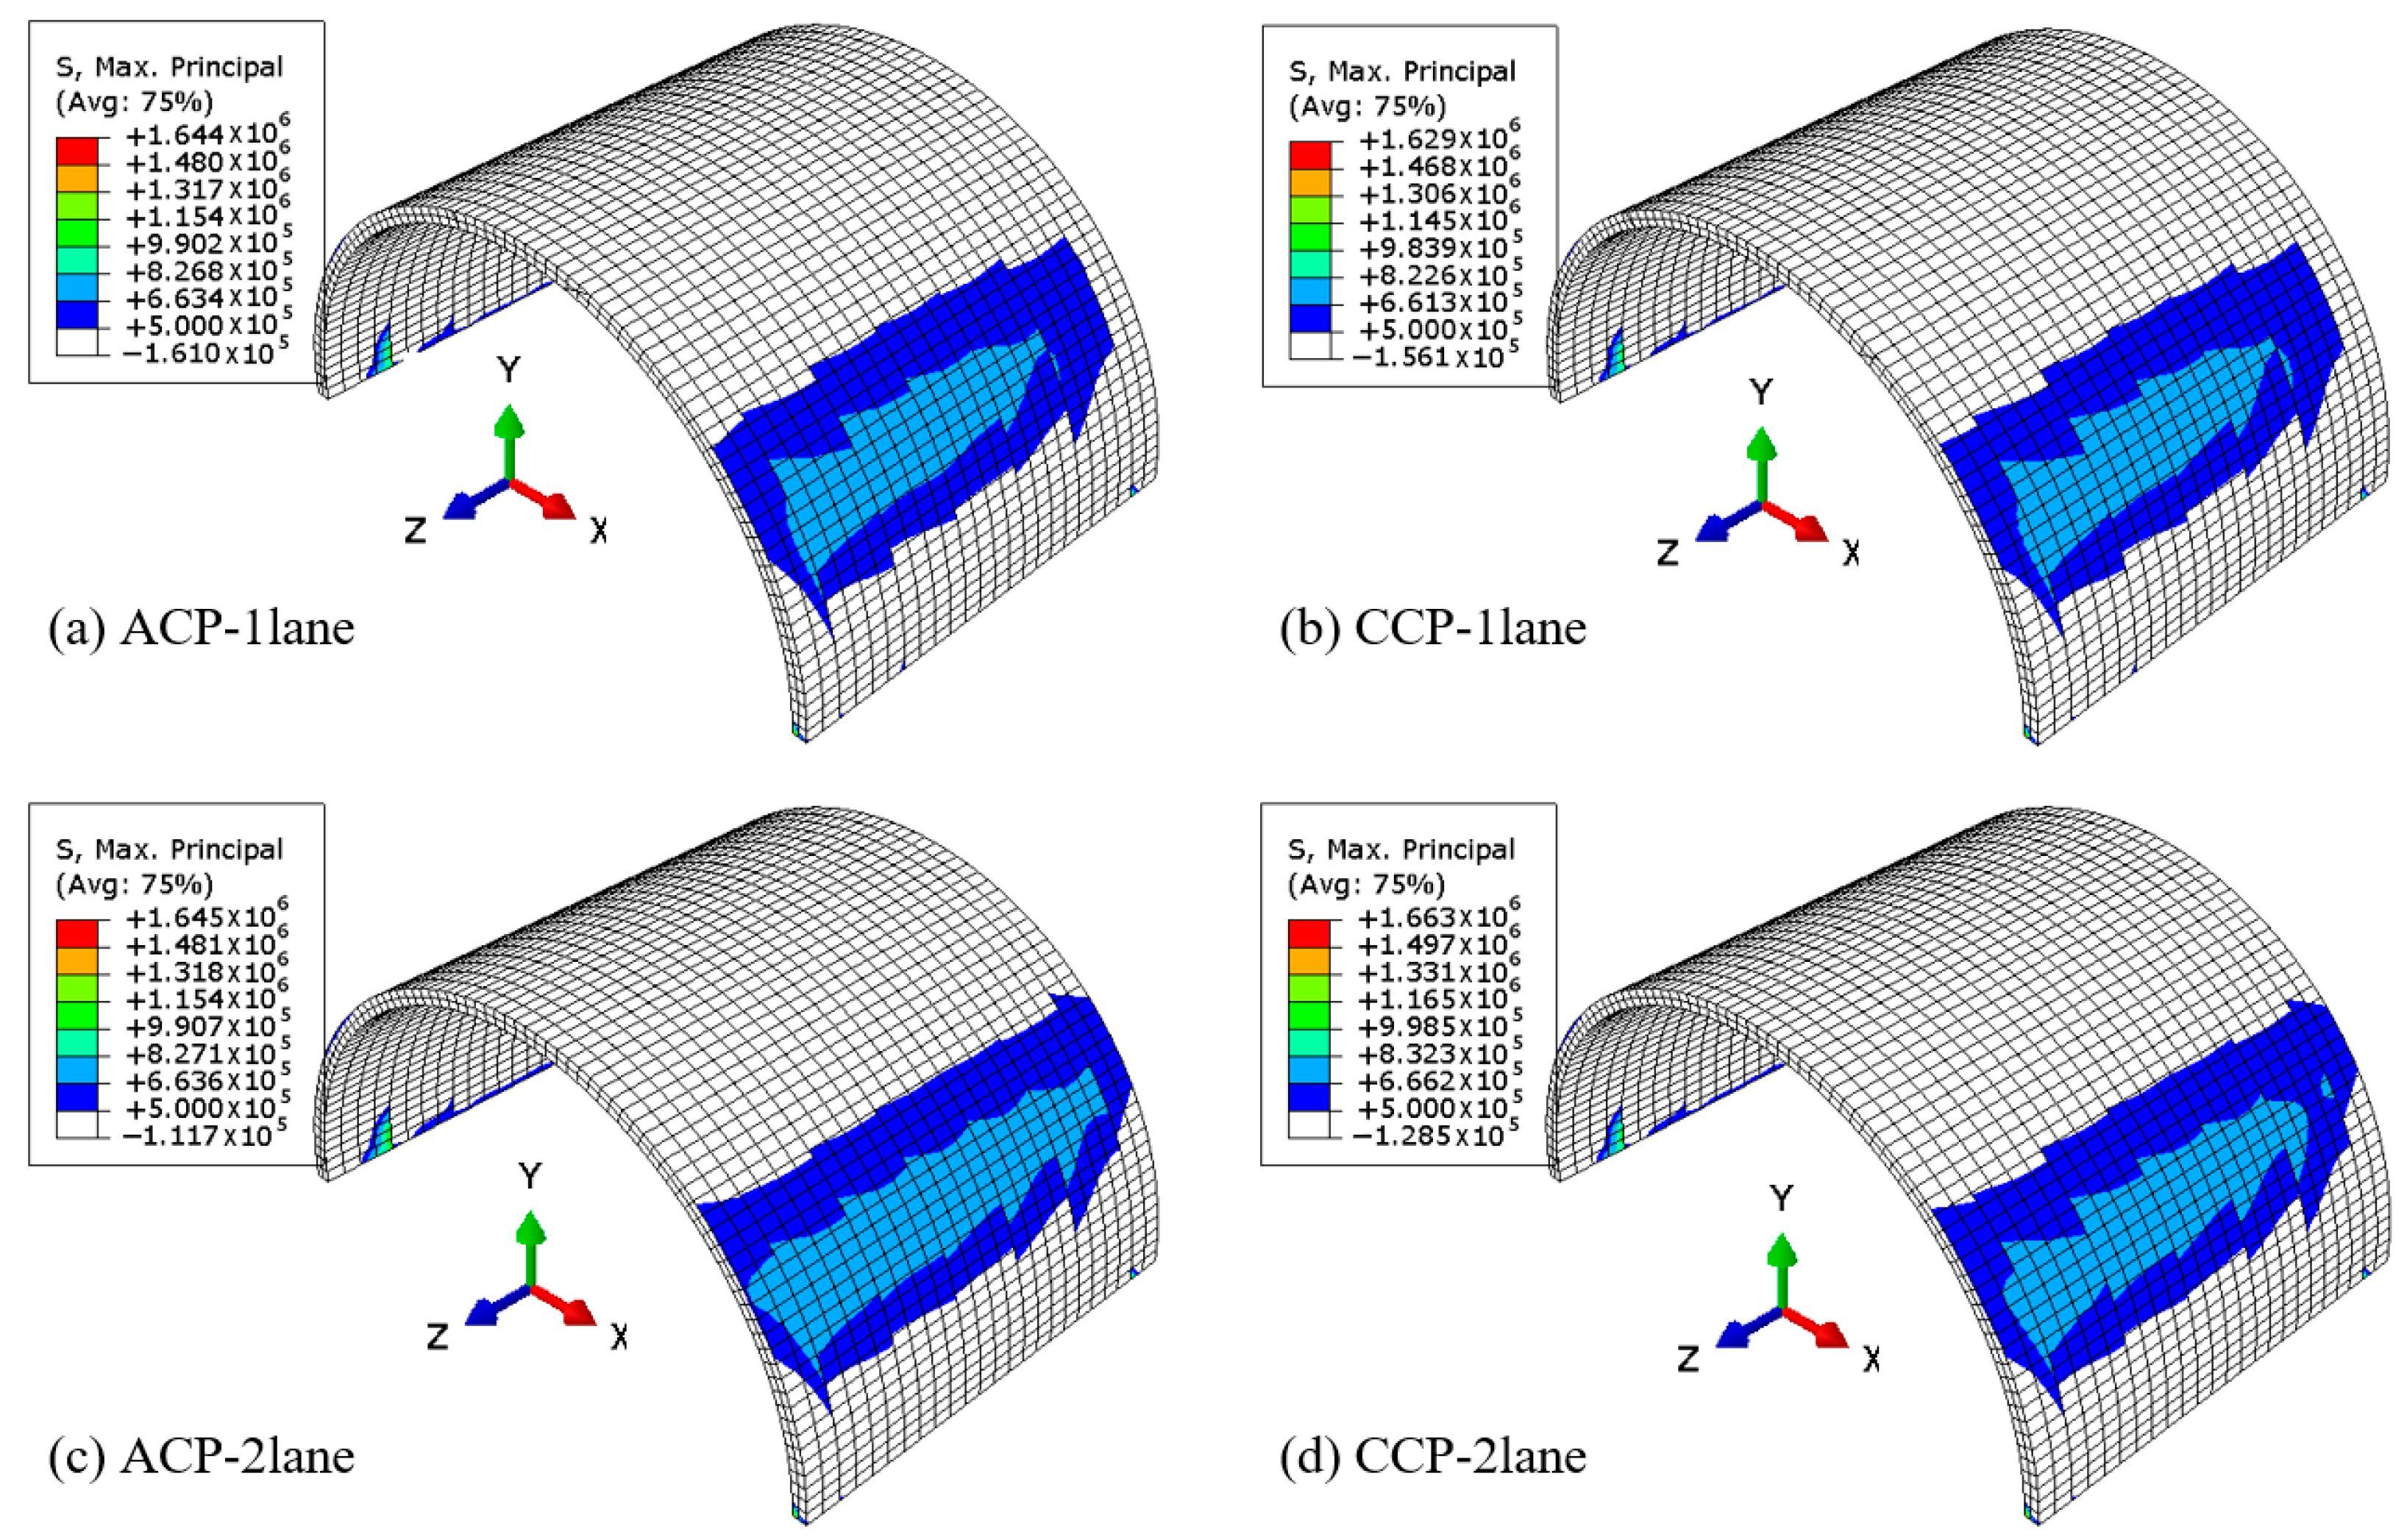
Figure 10 shows significant tensile stress in the arch structure under different scenarios. A frequently occurring criterion was adopted to evaluate the failure in the concrete arch structure when the tensile stress in concrete exceeded the material’s tensile strength [3]. As seen from the figures, the arch zone subjected to significant tensile stress commonly consists of the following areas: the bottom of the arch, specifically around the contact surfaces of the segments; the outer extent of the body-arch zone; and the inner extent of the top of the arch. Tensile stress in the arch structure was distributed similarly in all evaluation scenarios. However, there is a difference in distribution coverage between the single-lane and two-lane loading. The tensile stress in the arch structure of the case of the two-lane loading was greater than that of the single-lane loading, but not significantly (roundly 2%). The maximum tensile stress recorded in the arch was 1663 Pa (accounting for 41.6% of the tensile strength of the arch concrete). The tensile stress in the arch structure increased insignificantly (increased by around 3%) when subjected to additional vehicle load.
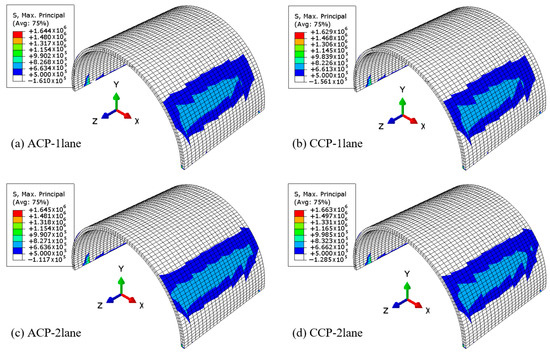
Figure 10.
Tensile stress in the arch structure under different scenarios (unit: Pa).
4.2. Liveload Attenuation in Backfill Material
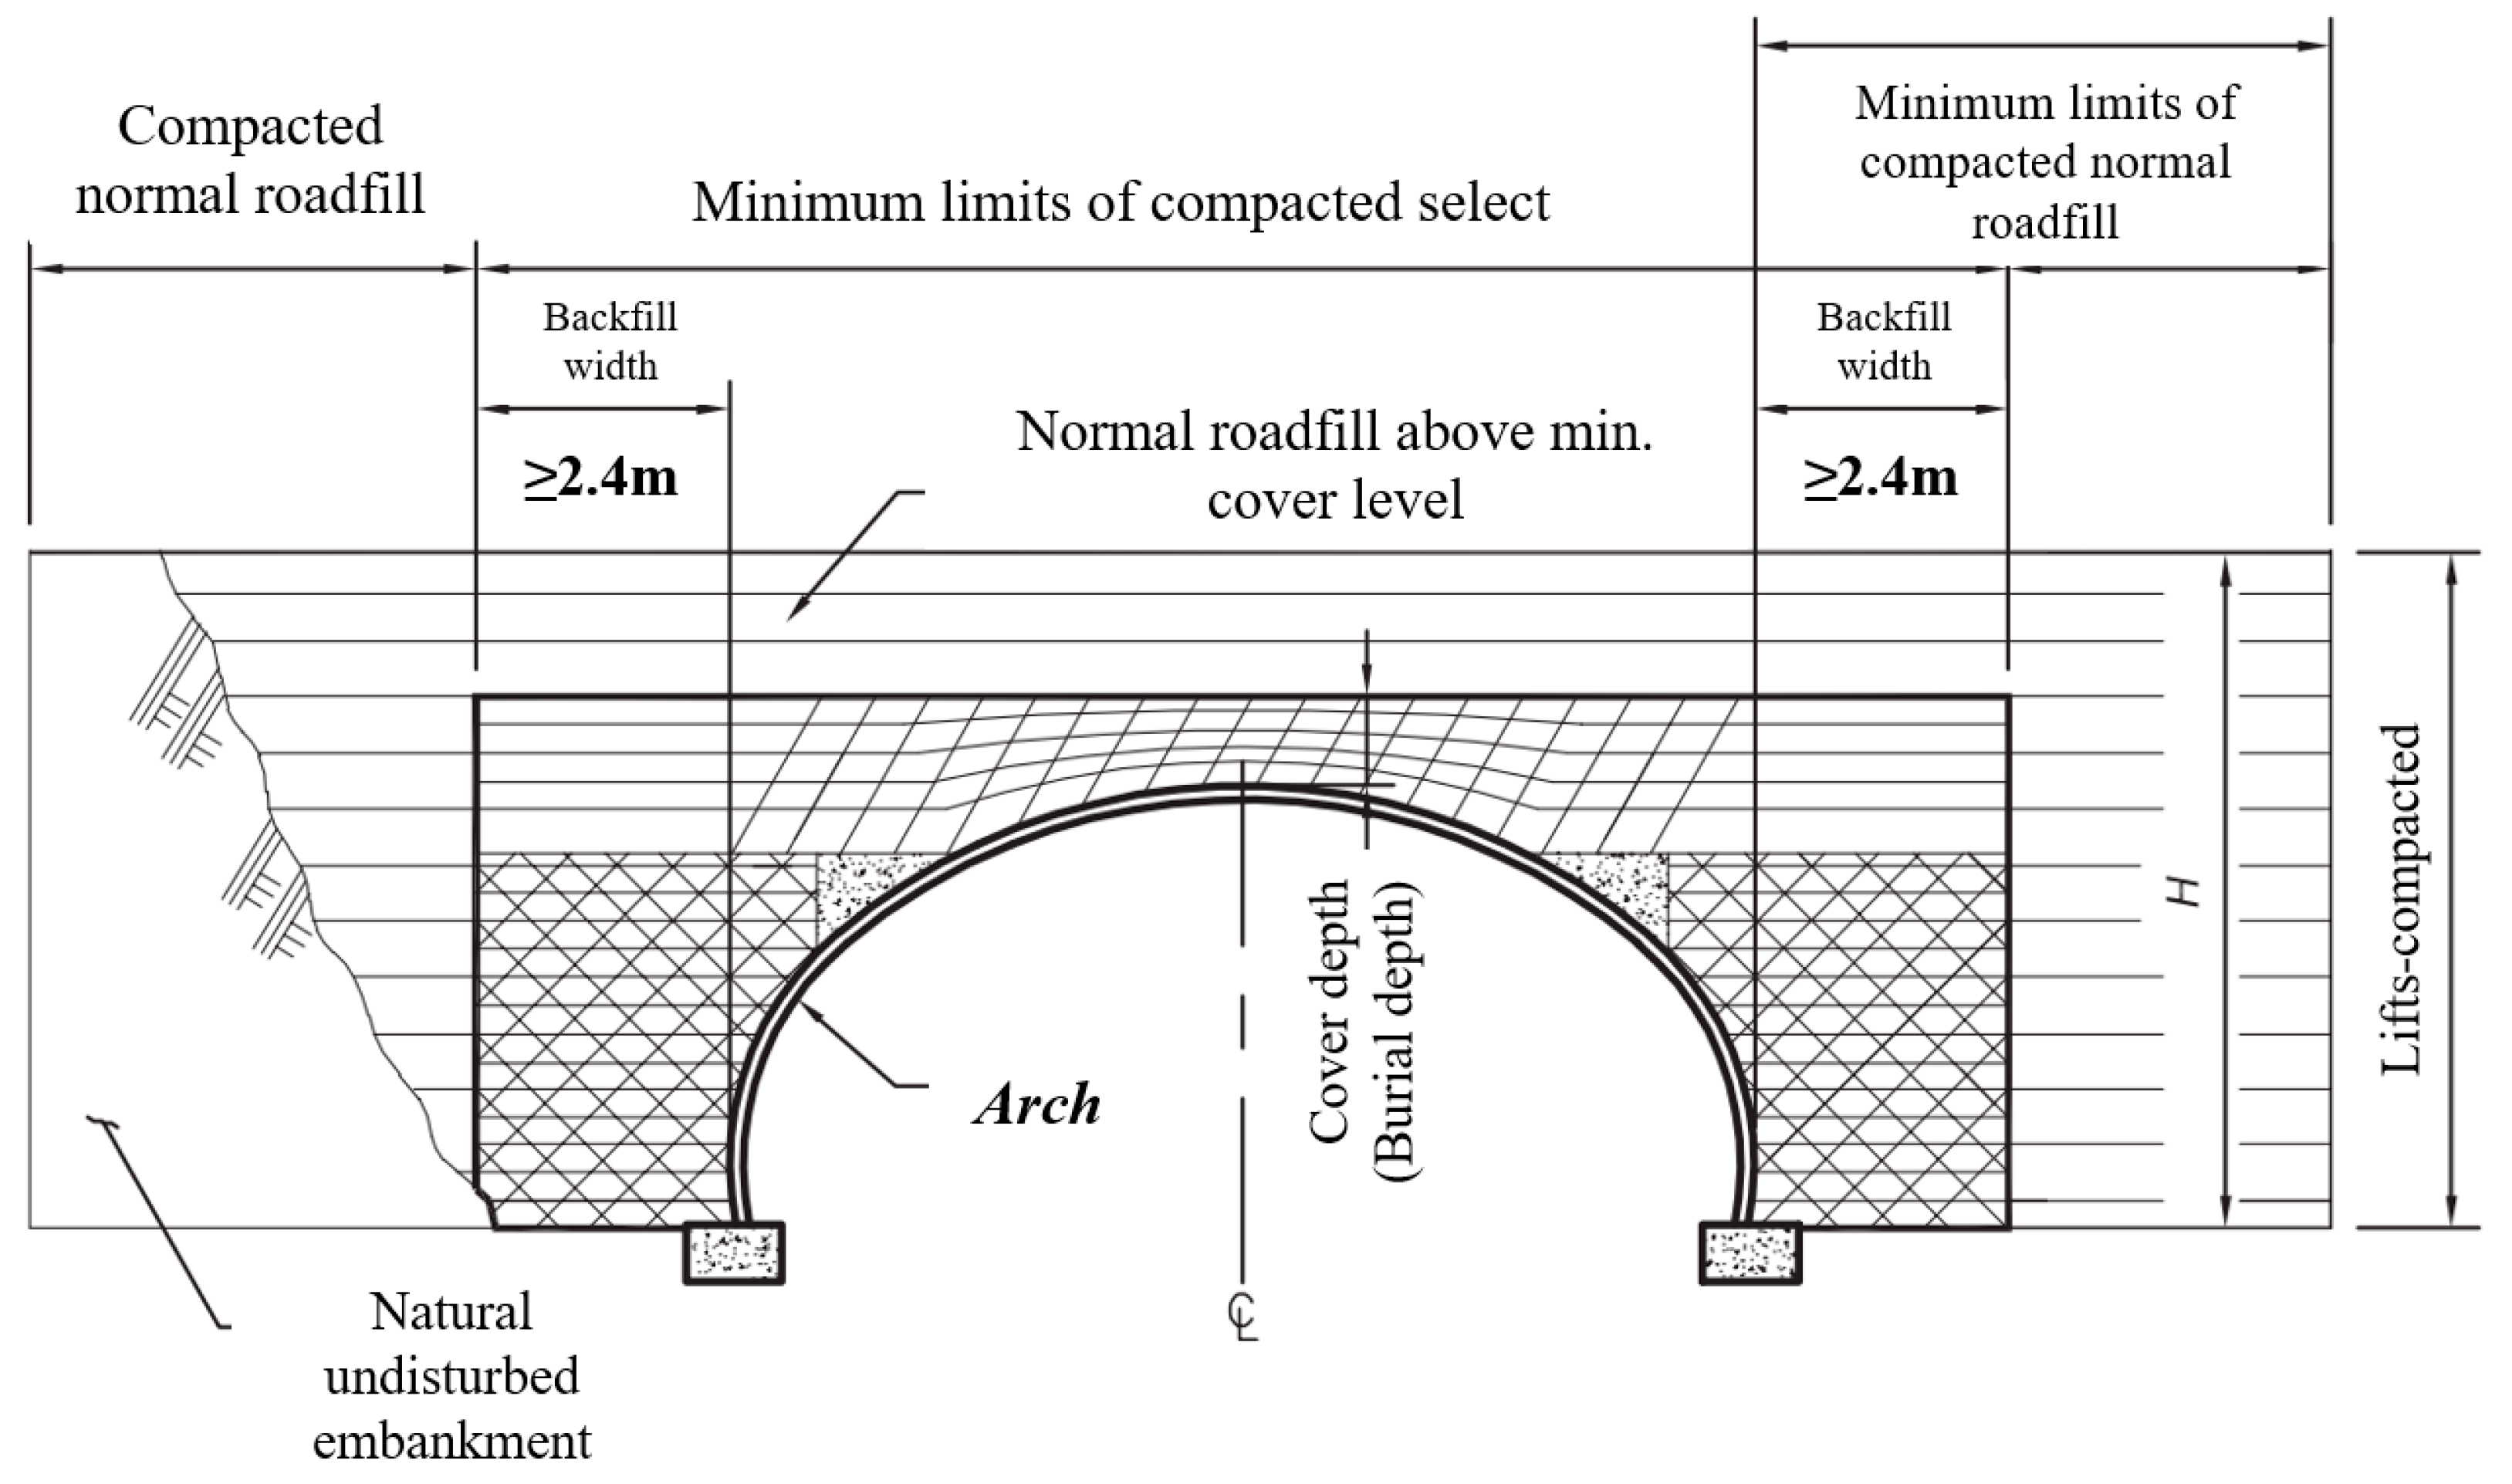
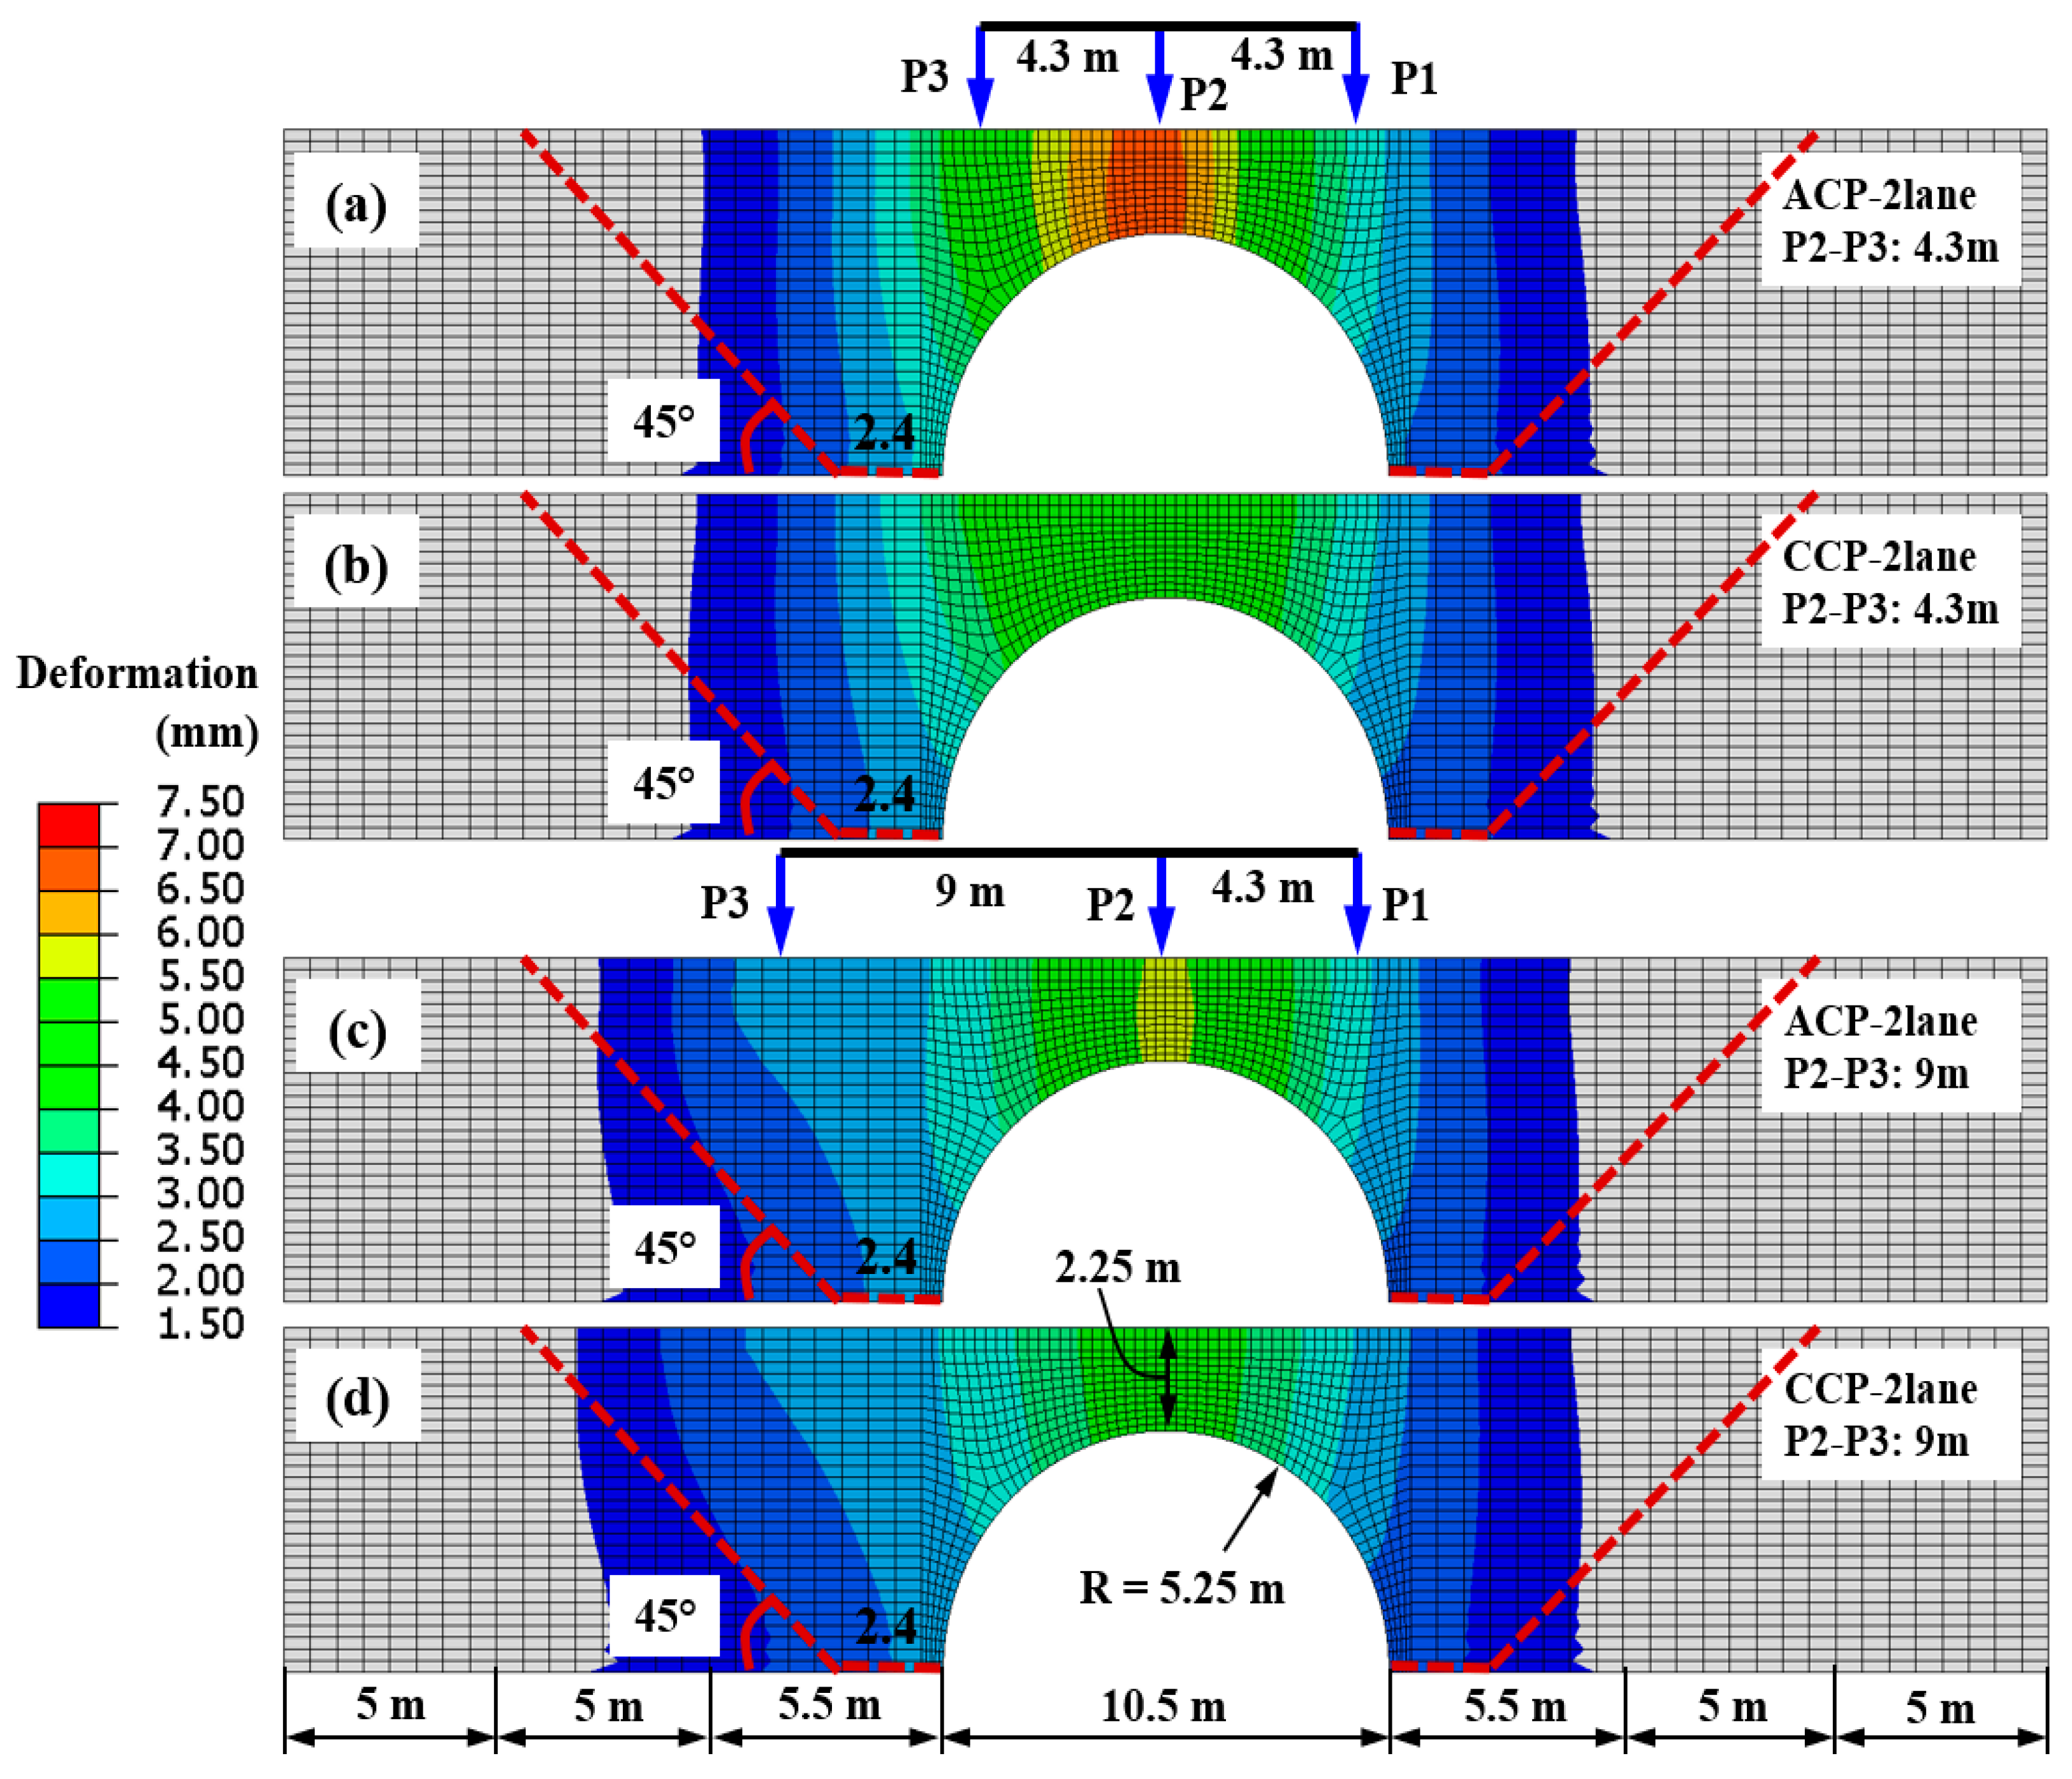
The backfill material covers stabilized buried structures and spread the service loading on the overpass to the underlying buried structures. For the buried arch form, the surrounding soil also creates a soil-arching effect that enhances the stability and strength of the soil-structure system, especially under the impact of earthquakes [3]. The design regulation of backfill materials has been specified and guided by several design standards [13,14], as illustrated in Figure 11. Meanwhile, Figure 12 shows the influenced zone of the embankment under the design truck loadings considering both different pavement stiffnesses and different rear axle distances (i.e., [P2–P3]) of the design truck (from 4.3–9.0 m). The results of numerical analysis (see Figure 12) show quite a similarity in the area of influence of vehicle load with the recommendations for embankment on the arch structure included in the design standard. The extent of the influence zone followed the general rule that it was concentrated near the apex above the arch top and decreased as it moved away from the arch top. The spread of wheel track pressure under the wheel depends on the magnitude of the axle load. The larger the axle load, the broader and deeper the influence zone. The spread of wheel track pressure also depends on the stiffness of the pavement structure. The CCP structure allowed the wheel load distribution on the embankment to be better than the ACP structure. However, it is recommended that the distribution distance of the axle load on the overpass road be considered when computing buried structures. Assuming that the extent of the influence zone of the embankment is determined, as shown in Figure 11. The influence zone could be 2.4 m wide from the bottom of the arch, and on the prism plane created with the transverse angle of 45°, this prism could cover the influence zone. This is aligned with the standard [14], which recommends a minimum backfill width of 2.4 m over the structure.
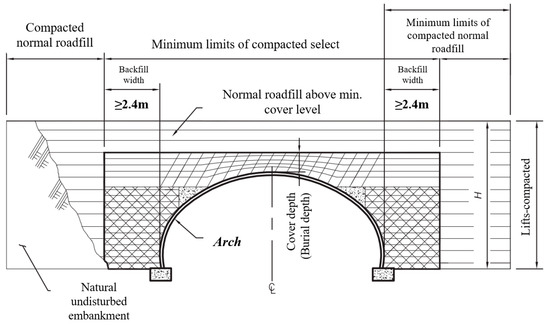
Figure 11.
Structural backfill envelope and influence zone of BPAS according to AASHTO LRFD [13] and TCVN 11823:2017 [14].

Figure 12.
The extent of influence of the backfill material under the impact of the design truck taking into account the type of pavement structure and the distance of the rear axles [P2–P3] of the truck: (a) ACP, rear axle spacing of 4.3 m; (b) CCP, rear axles spacing of 4.3 m; (c) ACP, rear axles spacing of 9 m; (d) CCP, rear axles spacing of 9 m.
4.3. Influence of Backfill Material
The soil envelope is an integral part of BPAS. The structural backfill material, the extent of the structural backfill zone, and the processes utilized to install and compact the backfill make up the soil envelope. Therefore, the soil envelope can be a resistance part of BPAS considered after backfill [13]. The burial depth (i.e., cover depth) has to be designed to ensure vehicular loading attenuation above the arch structure. Another design guideline [15] noted that all flexible culverts require adequate backfill support to maintain structural integrity. Most structural culvert issues stem from using inappropriate backfill material, insufficient compaction, or incorporating frozen material into the structural envelope during construction. Granular material has more muscular shear strength, compacts more efficiently, and takes less control or effort than clayey soil, which should be considered backfill material [15].
Figure 13 shows the effect of Young’s modulus of embankment material on the maximum displacement and stress of BPAS. When Young’s modulus was increased from 25 MPa to 250 MPa, the maximum displacement of BPAS under ACP and CCP structures was decreased by roundly 40.4% and 39.1%, respectively. Interestingly, tensile stress recorded in BPAS concrete under ACP and CCP structures was reduced by roundly 56.1% and 53.3%, respectively. This significantly reduced the risk of cracking in BPAS. In general, it is found that the stiffness of the backfill material significantly affects the behavior in BPAS. The BPAS behavior was stable when Young’s modulus of embankment material was greater than 200 MPa. Generally, the BPAS responses were within the allowable limits (displacement and stress) with the studied variation in the embankment stiffness.
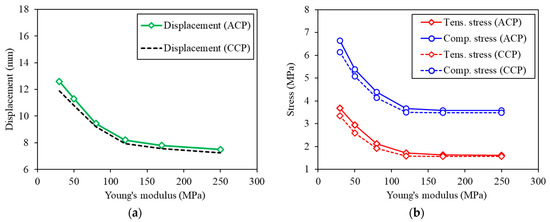
Figure 13.
Maximum responses of BPAS with respect to Young’s modulus of embankment material: (a) displacement; (b) stress.
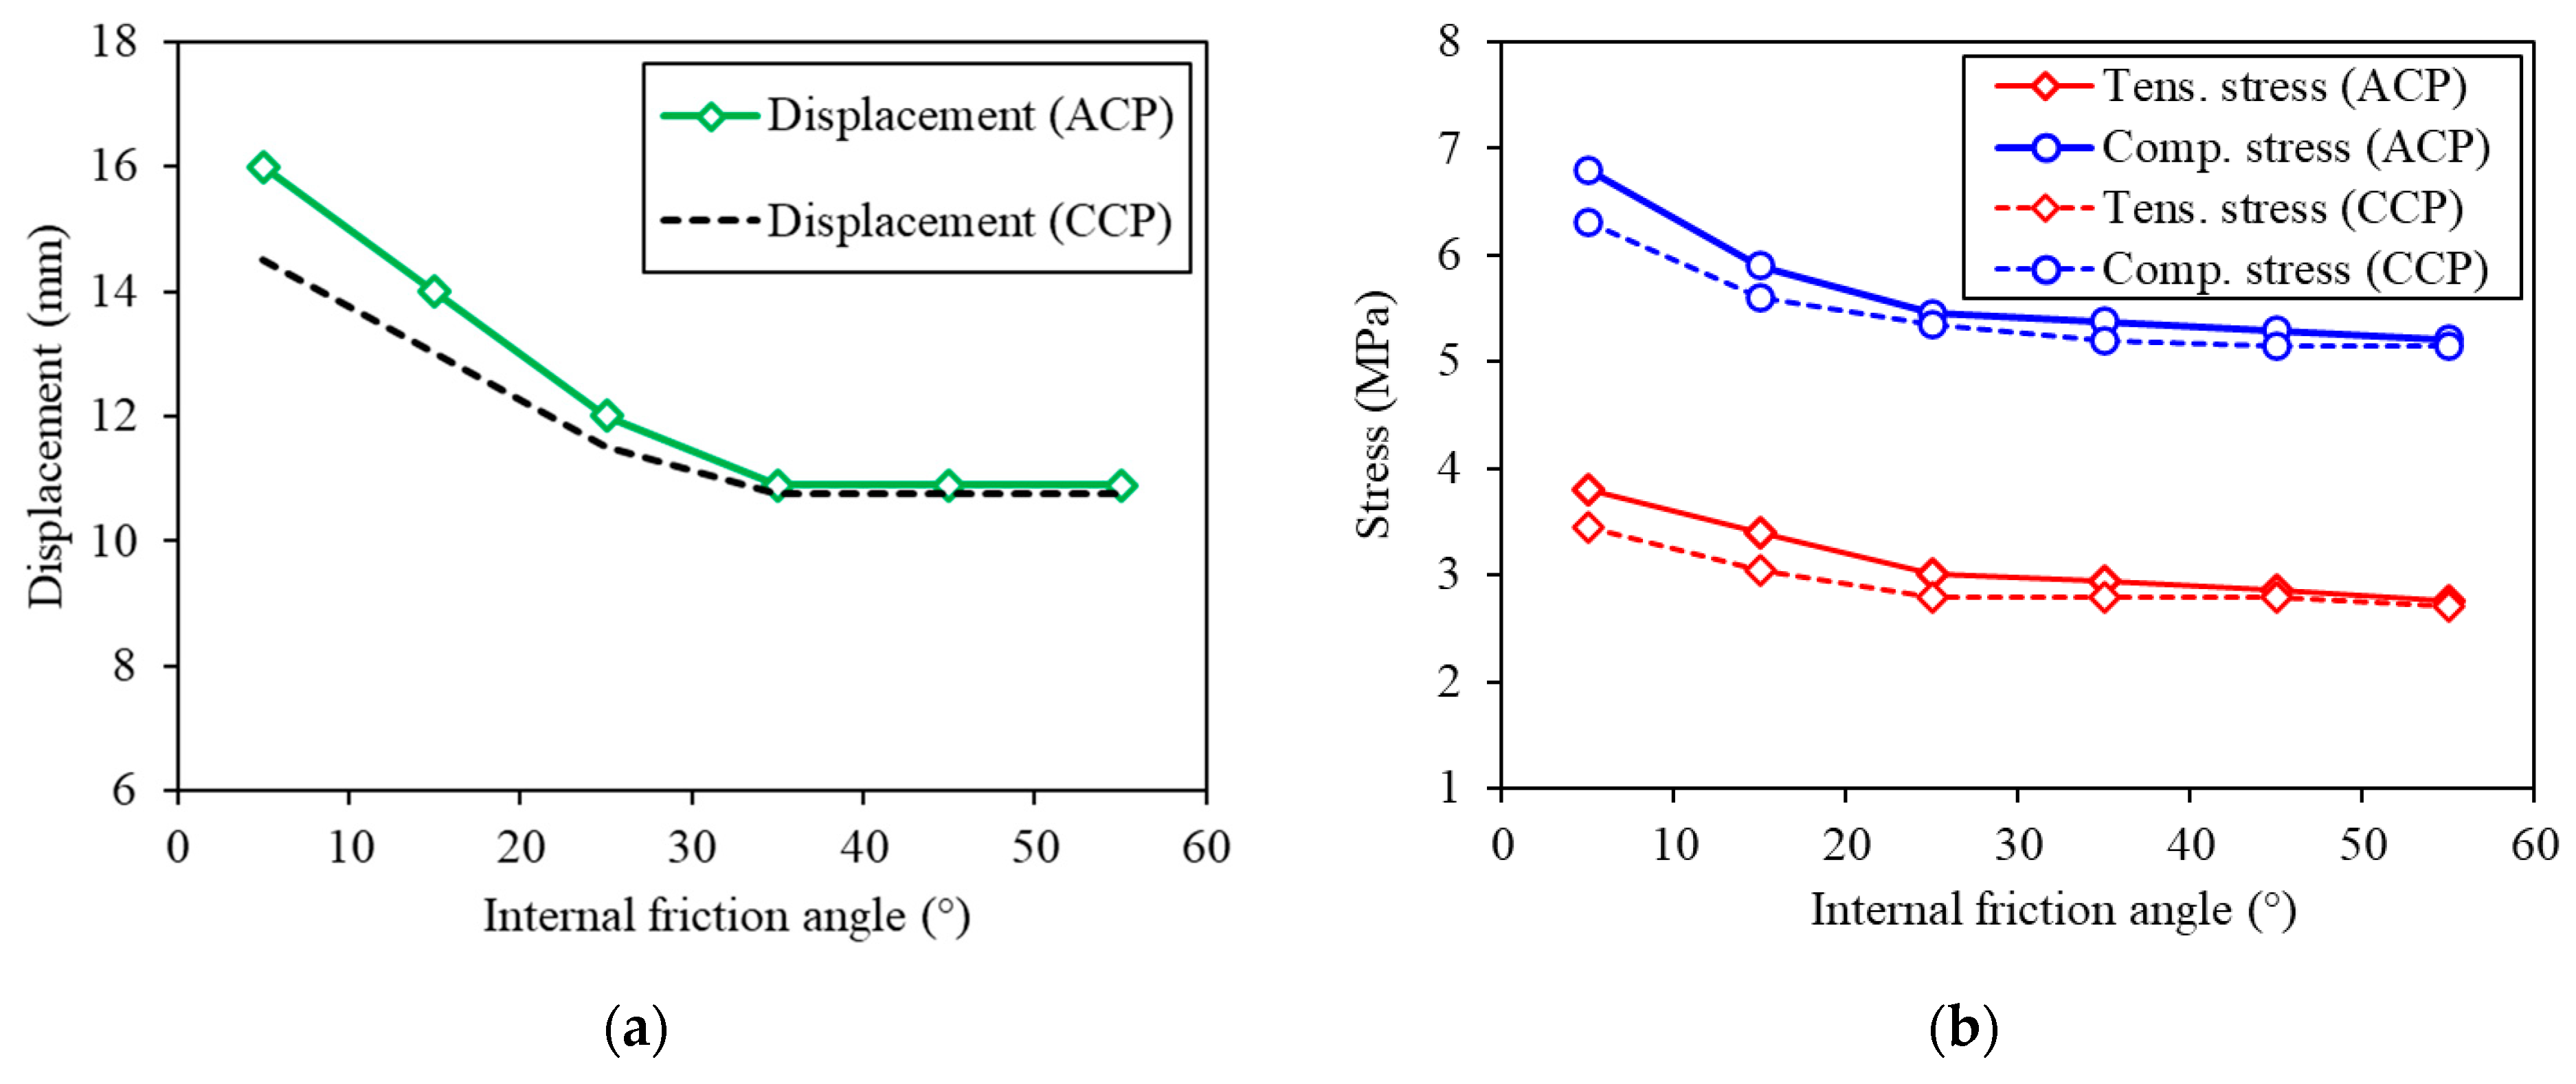
Figure 14a and Figure 14b illustrate the effects of the internal friction angle of embankment material on the maximum displacement and stresses (i.e., compressive and tensile) in the segment components of the BPAS, respectively. When the internal friction angle of embankment material was increased from 5° to 55°, the responses of BPAS under ACP and CCP structures were reduced gradually. However, the rate of decrease was slower than when the embankment stiffness changed. This is simply due to the stiffness of embankment material directly governing deformation/displacement, while the friction angle affected yield criteria in the plasticity model (ability of soil to resist failure), which did not significantly influence elastic stress–strain behavior of embankment material. The behavior of BPAS gradually stabilized when the internal friction angle of the backfill soil was above about 40 degrees.
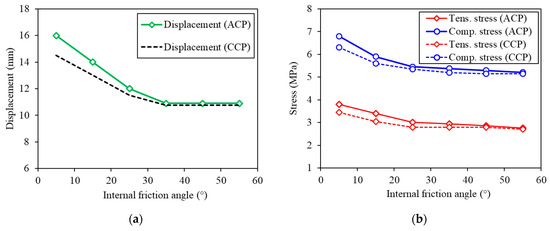
Figure 14.
Maximum responses of BPAS with respect to the internal friction angle of embankment material: (a) displacement; (b) stress.
From Figure 13 and Figure 14, despite the changes in important properties of the embankment, the results still show that the stiffer pavement structure provides a more effective vehicular load-attenuation effect on the buried structure than the softer pavement. Displacements and stresses in BPAS tended to decrease as the properties of the backfill material were upgraded. However, the stiffness of the backfill soil should be as close as possible to the stiffness of the pavement structure to reduce the abruptness of the top-down stiffness transition (ACP compared with CCP). This could help to disperse stress and load from the wheels on the road surface better.
5. Conclusions
The behavior of the BPAS arch structure under the impact of the design truck was evaluated by static analysis on ABAQUS [17]. A three-dimensional FEA model of a three-hinged BPAS considered the interaction and joint effects between segments and between different structural parts. The FEA model used suitable material models to reflect the behavior of the particle material. In addition, the behavior of the BPAS arch structure has been evaluated in many different scenarios, taking into account different pavement structures and truck axle distances. The asymmetry of vehicle loads has already been addressed. Therefore, this study presented a possible approach to evaluate the behavior of BPAS. The crucial findings of this study can be obtained as follows:
- (1)
- The vehicle’s effect on the buried arch structure depends on the vehicle’s standing position on the structure. The arch area is relatively weaker than the other areas on the arch. The arch bending was reduced due to the soil-arching effect, and the dominant displacement direction was vertical. The displacement of the arch varied depending on the truck’s layout and the different pavement stiffness. The effect of vehicle loads on multiple lanes did not cause a significant displacement increase for segmental arch structures. The displacement of the arch was only significantly dependent on the degree of load concentration on the top of the arch and less dependent on multiple lanes of loads.
- (2)
- The degree of increase in arch displacement with asphalt concrete pavement (ACP) was higher than that of cement concrete pavement (CCP) (15.0% versus 9.2%). Therefore, the influence of the vehicle load above on the buried arch structure tended to be higher for the softer pavement structure than the stiffer pavement structure (ACP compared with CCP). The additional displacement under vehicle load was significantly lower in the case of a loaded lane, and the truck rear axle spacing is 9 m.
- (3)
- The tensile stress zone distribution in the arch structure was not significantly dependent on the rear axle distance of the truck and the pavement structure. However, there was a difference in distribution coverage when the BPAS was loaded on single-lane loading and two-lane loading. The tensile stress in the arch structure of two load-carrying lanes was greater than that of a single load-carrying lane but not significantly (roundly 2%). The tensile stress in the arch structure increased insignificantly with additional vehicle load (around 3%).
- (4)
- The extent of wheel track pressure propagation depended not only on the magnitude of the axle load but also on the stiffness of the pavement structure. The CCP structure allowed the wheel load distribution on the backfill material to be better than the ACP structure. The extent of the influence zone of the backfill should be defined as 2.4 m wide from the bottom of the arch and on the prism plane created with a 45-degree transverse angle, which could enhance coverage of the vehicle’s affected area on the buried structure.
This study is among the first to numerically evaluate how different pavement types influence behavior in shallow BPAS under vehicular loads. However, the study is limited to materials and vehicular loads with typical representative properties. Problems related to soil embankment failure may be considered in advanced soil models. Describing the behavior of vehicles with dynamic effects of continuous motion in experimental research could reflect well on considering the repetitive nature of vehicular loading as well as fatigue-related issues in shallowly buried structures. Therefore, future studies may consider adding more to develop a comprehensive study of a large topic.
Author Contributions
Conceptualization, methodology, software, validation, formal analysis, investigation, data curation, writing—original draft, visualization: V.-T.N.; methodology, resources, validation, visualization, supervision, writing—review and editing: J.H. All authors have read and agreed to the published version of the manuscript.
Funding
This research received no external funding.
Data Availability Statement
The data used to support the findings of this study are available from the corresponding author upon reasonable request.
Conflicts of Interest
The authors declare no conflicts of interest.
Abbreviations
The following abbreviations are used in this manuscript:
| BPAS | Buried precast arch structures |
| ACP | Asphalt concrete pavement |
| CCP | Cement concrete pavement |
| FEA | Finite Element Analysis |
| FEM | Finite Element Model |
References
- Abe, T.; Nakamura, M. The use of and the caution in the application of the culvert constructed by large pre-cast element in the expressway construction. Found Eng. Equip. 2014, 42, 8–11. [Google Scholar]
- Miyazaki, Y. Fundamental Study on Seismic Behavior of Hinge Types of Precast Arch Culverts in Culvert Longitudinal Direction. Ph.D. Dissertation, Kyoto University, Kyoto, Japan, 2019. [Google Scholar]
- Nguyen, V.-T.; Seo, J.; Ahn, J.-H.; Haldar, A.; Huh, J. Finite element analysis-aided seismic behavior examination of modular underground arch bridge. Tunn. Undergr. Space Technol. 2021, 118, 104166. [Google Scholar] [CrossRef]
- Abuhajar, O.; El Naggar, H.; Newson, T. Static soil culvert interaction the effect of box culvert geometric configurations and soil properties. Comput. Geotech. 2015, 69, 219–235. [Google Scholar] [CrossRef]
- Hashash, Y.M.; Hook, J.J.; Schmidt, B.; John, I.; Yao, C. Seismic design and analysis of underground structures. Tunn. Undergr. Space Technol. 2001, 16, 247–293. [Google Scholar] [CrossRef]
- Nguyen, V.-T.; Ahn, J.-H.; Haldar, A.; Huh, J. Fragility-based seismic performance assessment of modular underground arch bridges. Structures 2022, 39, 1218–1230. [Google Scholar] [CrossRef]
- Zhou, X.; Jin, D.; Ge, D.; Chen, S.; You, Z. Identify the Micro-Parameters for Optimized Discrete Element Models of Granular Materials in Two Dimensions Using Hexagonal Close-Packed Structures. Materials 2023, 16, 3073. [Google Scholar] [CrossRef] [PubMed]
- Li, P.; Yang, C.; Xu, F.; Li, J.; Jin, D. Reinforcement of Insufficient Transverse Connectivity in Prestressed Concrete Box Girder Bridges Using Concrete-Filled Steel Tube Trusses and Diaphragms: A Comparative Study. Buildings 2024, 14, 2466. [Google Scholar] [CrossRef]
- Orton Sarah, L.; Loehr, J.E.; Boeckmann, A.; Havens, G. Live-Load Effect in Reinforced Concrete Box Culverts under Soil Fill. J. Bridge Eng. 2015, 20, 04015003. [Google Scholar] [CrossRef]
- Seo, H.; Wood Timothy, A.; Javid Amir, H.; Lawson William, D. Simplified System-Level Pavement-Stiffness Model for Box Culvert Load-Rating Applications. J. Bridge Eng. 2017, 22, 04017066. [Google Scholar] [CrossRef]
- Acharya, R.; Han, J.; Parsons Robert, L. Numerical Analysis of Low-Fill Box Culvert under Rigid Pavement Subjected to Static Traffic Loading. Int. J. Geomech. 2016, 16, 04016016. [Google Scholar] [CrossRef]
- Park, J.-Y.; Sohn, D.-S.; Lee, J.-H.; Kim, S.-H.; Jeong, J.-H. Influence of Box Culverts on Behavior of Jointed Concrete Pavements. J. Perform. Constr. Facil. 2015, 29, 04014053. [Google Scholar] [CrossRef]
- American Association of State Highway and Transportation Officials. AASHTO LRFD Bridge Design Specifications, SI Units; American Association of State Highway and Transportation Officials: Washington, DC, USA, 2017. [Google Scholar]
- TCVN11823; Road Bridge Design. National Standard: Hanoi, Vietnam, 2017.
- Alberta. Design Guidelines for Bridge Size Culverts; Government of Alberta: Edmonton, AB, Canada, 2004.
- Alshboul, O.; Almasabha, G.; Shehadeh, A.; Al Hattamleh, O.; Almuflih, A.S. Optimization of the Structural Performance of Buried Reinforced Concrete Pipelines in Cohesionless Soils. Materials 2022, 15, 4051. [Google Scholar] [CrossRef] [PubMed]
- Abaqus, V. 6.20 Documentation; Dassault Systemes Simulia Corporation: Vélizy-Villacoublay, France, 2020. [Google Scholar]
- Hognestad, E. Study of Combined Bending and Axial Load in Reinforced Concrete Members; University of Illinois at Urbana Champaign: Champaign, IL, USA, 1951. [Google Scholar]
- Lee, J.; Fenves, G.L. A plastic-damage concrete model for earthquake analysis of dams. Earthq. Eng. Struct. Dyn. 1998, 27, 937–956. [Google Scholar] [CrossRef]
- Lee, J.; Fenves, G.L. Plastic-damage model for cyclic loading of concrete structures. J. Eng. Mech. 1998, 124, 892–900. [Google Scholar] [CrossRef]
- TCCS38:2022/TCĐBVN; Flexible Pavement Design—Specification and Guidelines. Ministry of Transport: Ha Noi, Vietnam, 2022.
- TCCS39:2022/TCĐBVN; Specifications for Design of Jointed Plain Cement Concrete Pavement for Highway. Ministry of Transport: Ha Noi, Vietnam, 2022.
- Jeon, S.H.; Yim, H.J.; Huh, J.; Cho, K.-I.; Ahn, J.-H. Full-scale field testing of a precast concrete buried arch bridge with steel outriggers: Field loading test. Eng. Struct. 2021, 242, 112563. [Google Scholar] [CrossRef]
- Sawamura, Y.; Ishihara, H.; Otani, Y.; Kishida, K.; Kimura, M. Deformation behavior and acting earth pressure of three-hinge precast arch culvert in construction process. Undergr. Space 2019, 4, 251–260. [Google Scholar] [CrossRef]
- Miyazaki, Y.; Sawamura, Y.; Kishida, K.; Kimura, M. Influence of longitudinal structural connectivity on seismic performance of three-hinged precast arch culverts. Soils Found. 2021, 61, 1681–1698. [Google Scholar] [CrossRef]


Disclaimer/Publisher’s Note: The statements, opinions and data contained in all publications are solely those of the individual author(s) and contributor(s) and not of MDPI and/or the editor(s). MDPI and/or the editor(s) disclaim responsibility for any injury to people or property resulting from any ideas, methods, instructions or products referred to in the content. |
© 2025 by the authors. Licensee MDPI, Basel, Switzerland. This article is an open access article distributed under the terms and conditions of the Creative Commons Attribution (CC BY) license (https://creativecommons.org/licenses/by/4.0/).