Article

In Situ and Laboratory Testing of Boom Clay at Shallow Depths in Belgium

by
Maria Konstadinou
1,*,
Etienne A. Alderlieste
1,
Cor Zwanenburg
2,
Cihan Cengiz
1,
Anderson Peccin da Silva
1 and
Charlotte J. W. van Verseveld
3
1
Geo-Engineering Section, Deltares, Boussinesqweg 1, 2629 HV Delft, The Netherlands
2
Geo-Engineering Section, Delft University of Technology, Mekelweg 5, 2628 CD Delft, The Netherlands
3
GBM Works, Grasweg 31, 1031 HW Amsterdam, The Netherlands
*
Author to whom correspondence should be addressed.
Geotechnics 2025, 5(2), 23; https://doi.org/10.3390/geotechnics5020023
Submission received: 24 December 2024 / Revised: 16 February 2025 / Accepted: 14 March 2025 / Published: 28 March 2025

Abstract

The shear strength and compression properties of stiff Boom clay from Belgium at a depth of about 16.5 to 28 m were investigated by means of cone penetration and laboratory testing. The latter consisted of index classification, constant rate of strain, triaxial, direct simple shear and unconfined compression tests. The Boom clay samples exhibited strong swelling tendencies. The suction pressure was measured via different procedures and was compared to the expected in situ stress. The undrained shear strength profile determined from cone penetration tests (CPTs) was not compatible with the triaxial and direct simple shear measurements, which gave significantly lower undrained shear strength values. Micro-computed tomography (μCT) scans of the samples showed the presence of pre-existing discontinuities which may cause inconsistencies in the comparison of the laboratory test results with in situ data. The experimental data gathered in this study provide useful information for analyzing the mechanical behaviour of Boom clay at shallow depths considering that most investigations in the literature have been carried out on deep Boom clay deposits.

1. Introduction

Boom clay is a Tertiary marine clay located in the northeast of Belgium and almost the entirety of the Netherlands. From a hydrological point of view, Boom clay is an aquitard with very low hydraulic conductivity, and from a geomechanical perspective, it is a stiff, overconsolidated plastic clay [1,2]. Most of the investigations into Boom clay have been carried out on samples from the vicinity of Mol in Belgium. The Boom clay present between 190 m and 290 m under the Mol-Desser nuclear site was selected as a potential host formation for the disposal of radioactive waste [3]. Considering that Boom clay has a number of properties that are favourable for a disposal facility, Dutch authorities have also investigated the design of a generic repository for all Dutch radioactive waste to be situated at a depth of 500 m in the Boom clay layer [4,5,6]. Due to the interest in using Boom clay as a candidate for radioactive disposal, various studies have been conducted to investigate the thermo-hydromechanical behaviour of Boom clay, which is of particular importance for the design, excavation and long-term performance of an underground radioactive waste facility [7,8,9,10,11,12,13]. The geotechnical properties of Boom clay have also been investigated in other studies carried out in the Antwerp region [14] and for the construction of the Western Scheldt Tunnel in the Netherlands [15,16]. A summary of the geotechnical properties of Boom clay as found in the literature is given in Mendoza [2], Milioritsas [17] and Wiseall et al. [18].
GBM Works BV in the Netherlands has been working on the development of a water jetting technique combined with vibro driving (a so-called Vibrojet) for the installation of large monopiles (https://www.gbmworks.com/, accessed on 22 March 2025). Proof-of-concept field-scaled tests were performed by installing a 2 m diameter pile at a depth of 25 m. The field tests were conducted at a site in the port area of Antwerp in the north of Belgium (Figure 1). At this site, Boom clay is encountered at a depth of about 16.5 m below surface. The presence of Boom clay at such a shallow depth offers an excellent opportunity to test the functionality of the new installation technique in stiff clay. Such conditions are considered to be representative for potential installation locations in the North Sea. The field tests were supported by in situ tests and a laboratory testing program which included various soil element tests such as triaxial compression, direct simple shear, constant rate of strain, unconfined compressive strength and swelling tests. The results were also complemented with X-ray microtomography scans.
In the present work, the results of the in situ and soil element tests on Boom clay are analyzed, and when relevant, they are compared to the test results from different sites as reported in the literature. The results of this study provide useful information on the geotechnical characterization of Boom clay at shallow depths, and although the results may not be representative of the behaviour of Boom clay at greater depths, they can be used to complement the existing experimental database on Boom clay which mainly consists of data from deeper layers. In addition, as concluded by Deng et al. [19], a comparison of laboratory test results from different sites and different testing depths is important for gaining a better understanding regarding the transferability of knowledge on Boom clay.

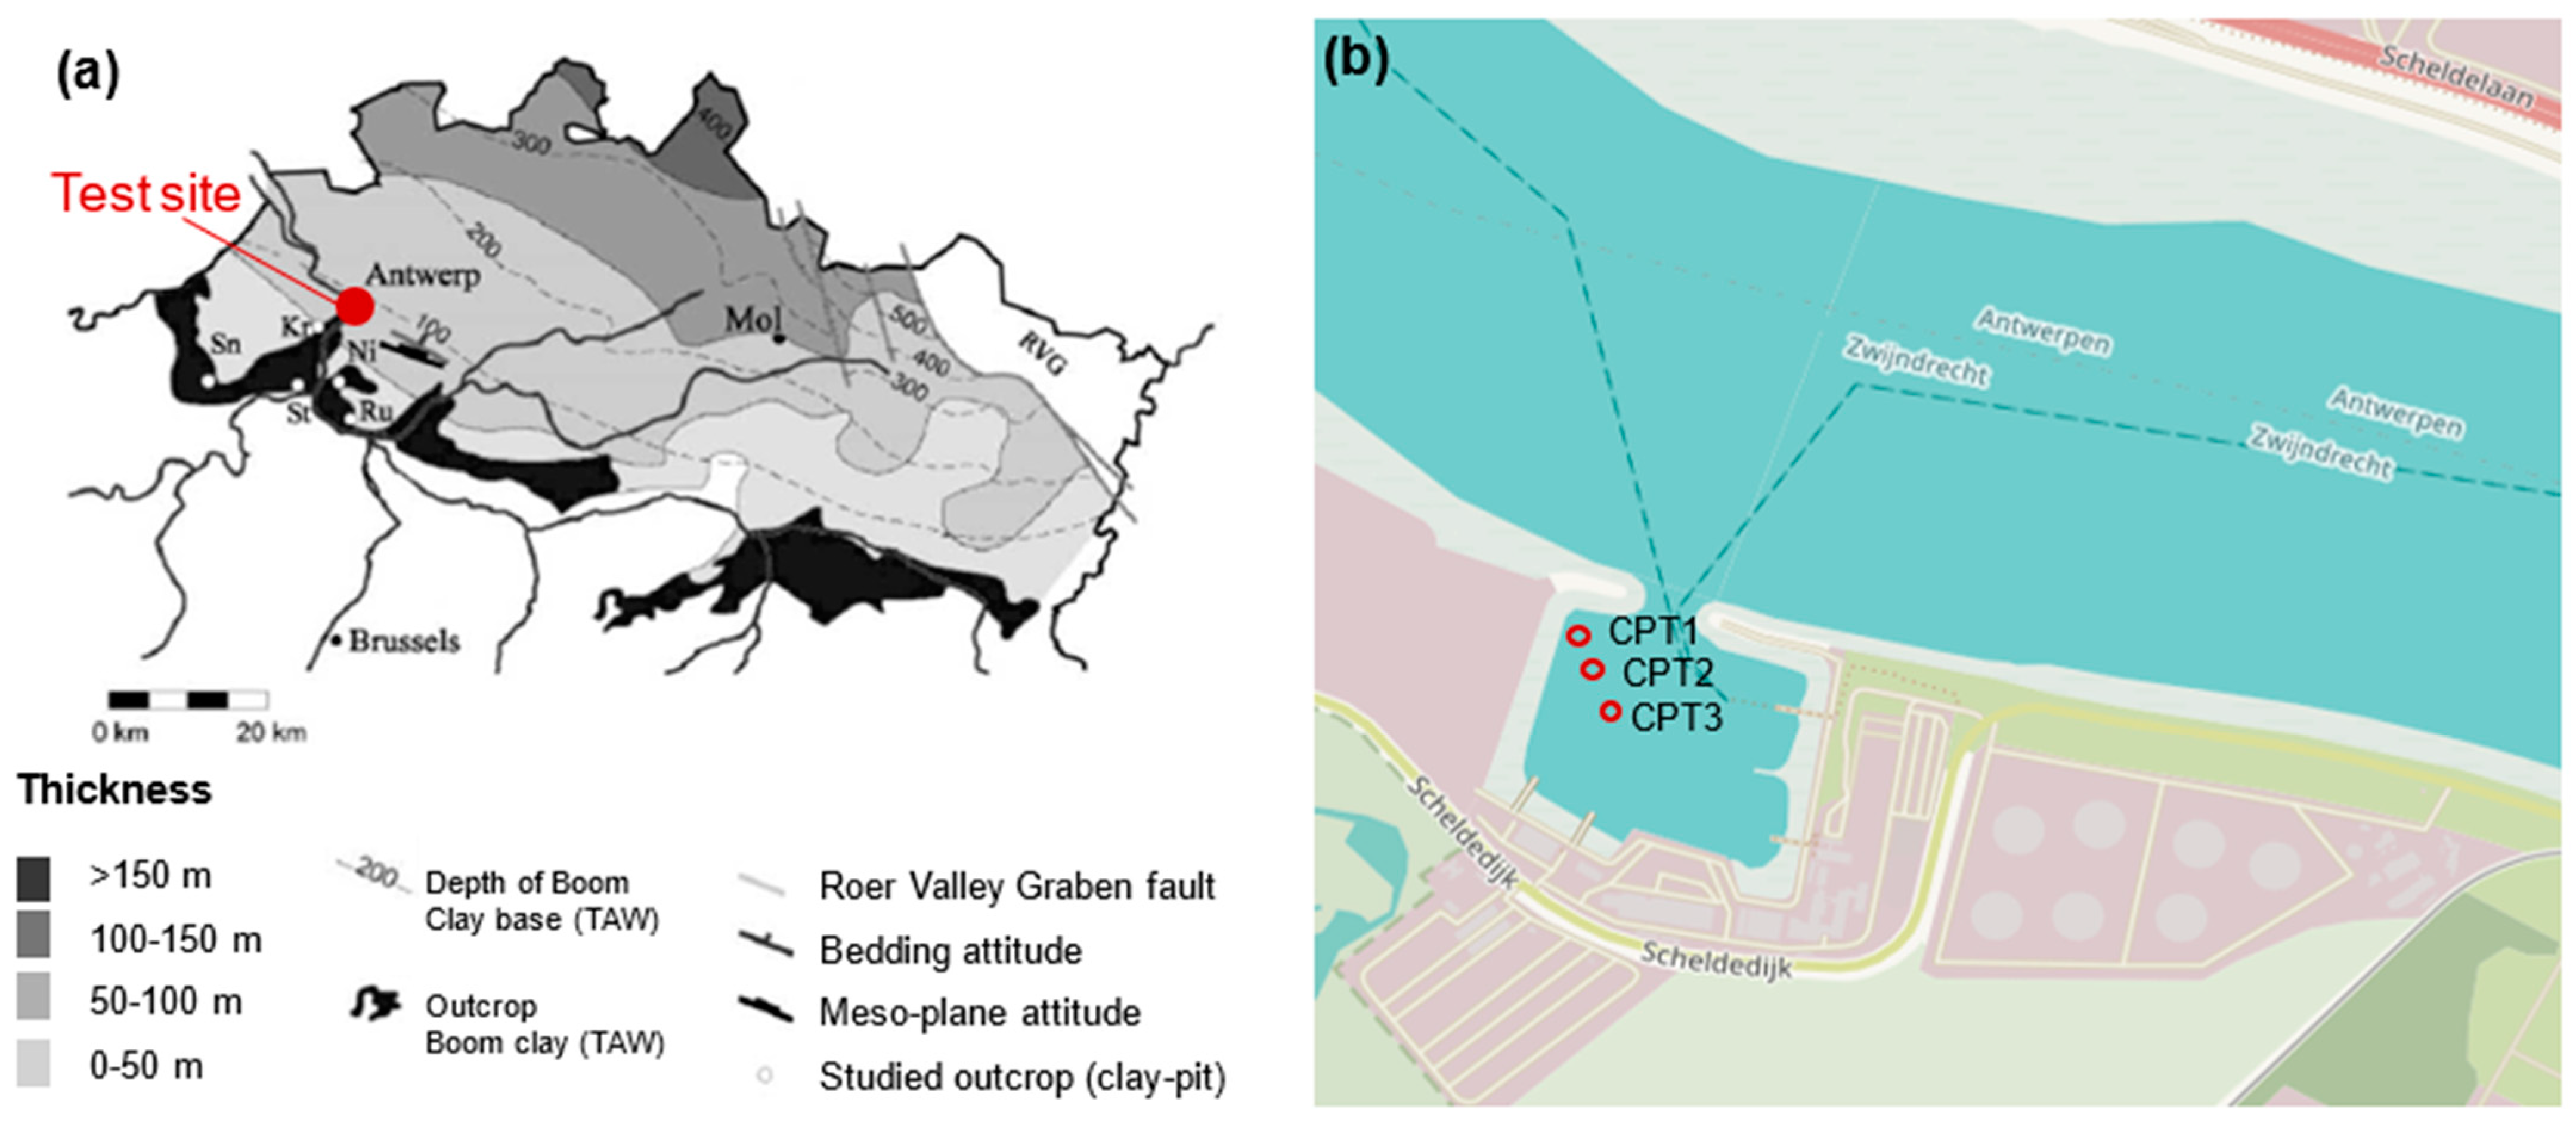
2. In Situ Testing and Sampling Material

In situ testing included three cone penetration tests (CPT1, CPT2, CPT3) and three boring drillings adjacent to the sites of the CPTs for material sampling (B1, B2, B3). The locations of the CPT sites are given in Figure 1b. The stratigraphy of the test sites, as identified from the in situ tests, indicates the presence of a sand layer on top of the Boom clay layer. The latter is encountered at about 16.5 m below ground level. The net cone tip resistance, qnet, and the corrected friction ratio, Rft, of the CPTs are calculated based on Equations (1) and (2), respectively [20], and are plotted against the penetration depth in Figure 2. In the Boom clay layer, the corrected cone resistance and friction ratio are approximately 4 MPa and 5.5%, respectively.
q n e t ( M P a ) = q c + u 2 ( 1 a σ v 0
R f t ( % ) = f s q c + u 2 ( 1 a ) σ v 0
where qc is the cone penetration resistance (MPa), a is the cone area ratio (a = 0.85), u2 is the water pressure at the base of the sleeve (MPa), σv0 is the total vertical stress (MPa) and fs is the sleeve friction (MPa).

3. Testing Program and Methods

The tested Boom clay was subjected to index classification testing that included water content, unit weight and Atterberg limits tests. The swelling pressure was measured through two different methods: the constant volume [21,22] and constant load methods ([23], Method C). The mechanical response in one-dimensional compression is examined by performing constant rate of strain, CRS, tests following [24]. The CRS ring used had a diameter of 63 mm, while the tested samples had a height of approximately 20 mm. The stress–strain response was investigated by means of triaxial and direct simple shear (DSS) tests. The triaxial tests were performed in accordance with [25] on samples with a diameter and height of approximately 66 mm and 132 mm, respectively. DSS tests, which were in agreement with [26], were performed on cylindrical samples having a diameter of 63 mm and a height at preparation of approximately 20 mm. The DSS samples were fitted inside a rubber membrane and reinforced by a stack of rings. Protruding pins were added to the platen surfaces of a DSS device to avoid slippage occurring at the soil–platen interface during shearing. Boom clay samples were also subjected to a standard unconfined compression strength (UCS) test following [27]. The dimensions of the tested samples were about 66 mm in terms of diameter and 125 mm in terms of height. All tests were performed at the Deltares geotechnical laboratory. To analyze the internal 3D microstructure of the Boom clay samples, micro-computed tomography (μCT) scans were also carried out. The X-ray scans were performed using a multi-scale X-ray CT scanner at TU Delft with a spatial resolution of 25 microns. Table 1 summarizes the testing conditions of all the tests reported in this study.
The behaviour of Boom clay in the field is of interest. The laboratory tests were therefore conducted at the field stress level. The in situ effective vertical stress, σvi′, for each of the tested samples given in Table 1 was estimated as follows:
σ v i = γ h u 0
where γ is the mean unit weight of the formations above the depth considered, taken as 18.5 kN/m3 for the Boom clay layer and 20 kN/m3 for the encountered sand layer; h is the sampling depth; and u0 is the in situ pore pressure estimated from the water level above the seabed.

4. Experimental Test Results

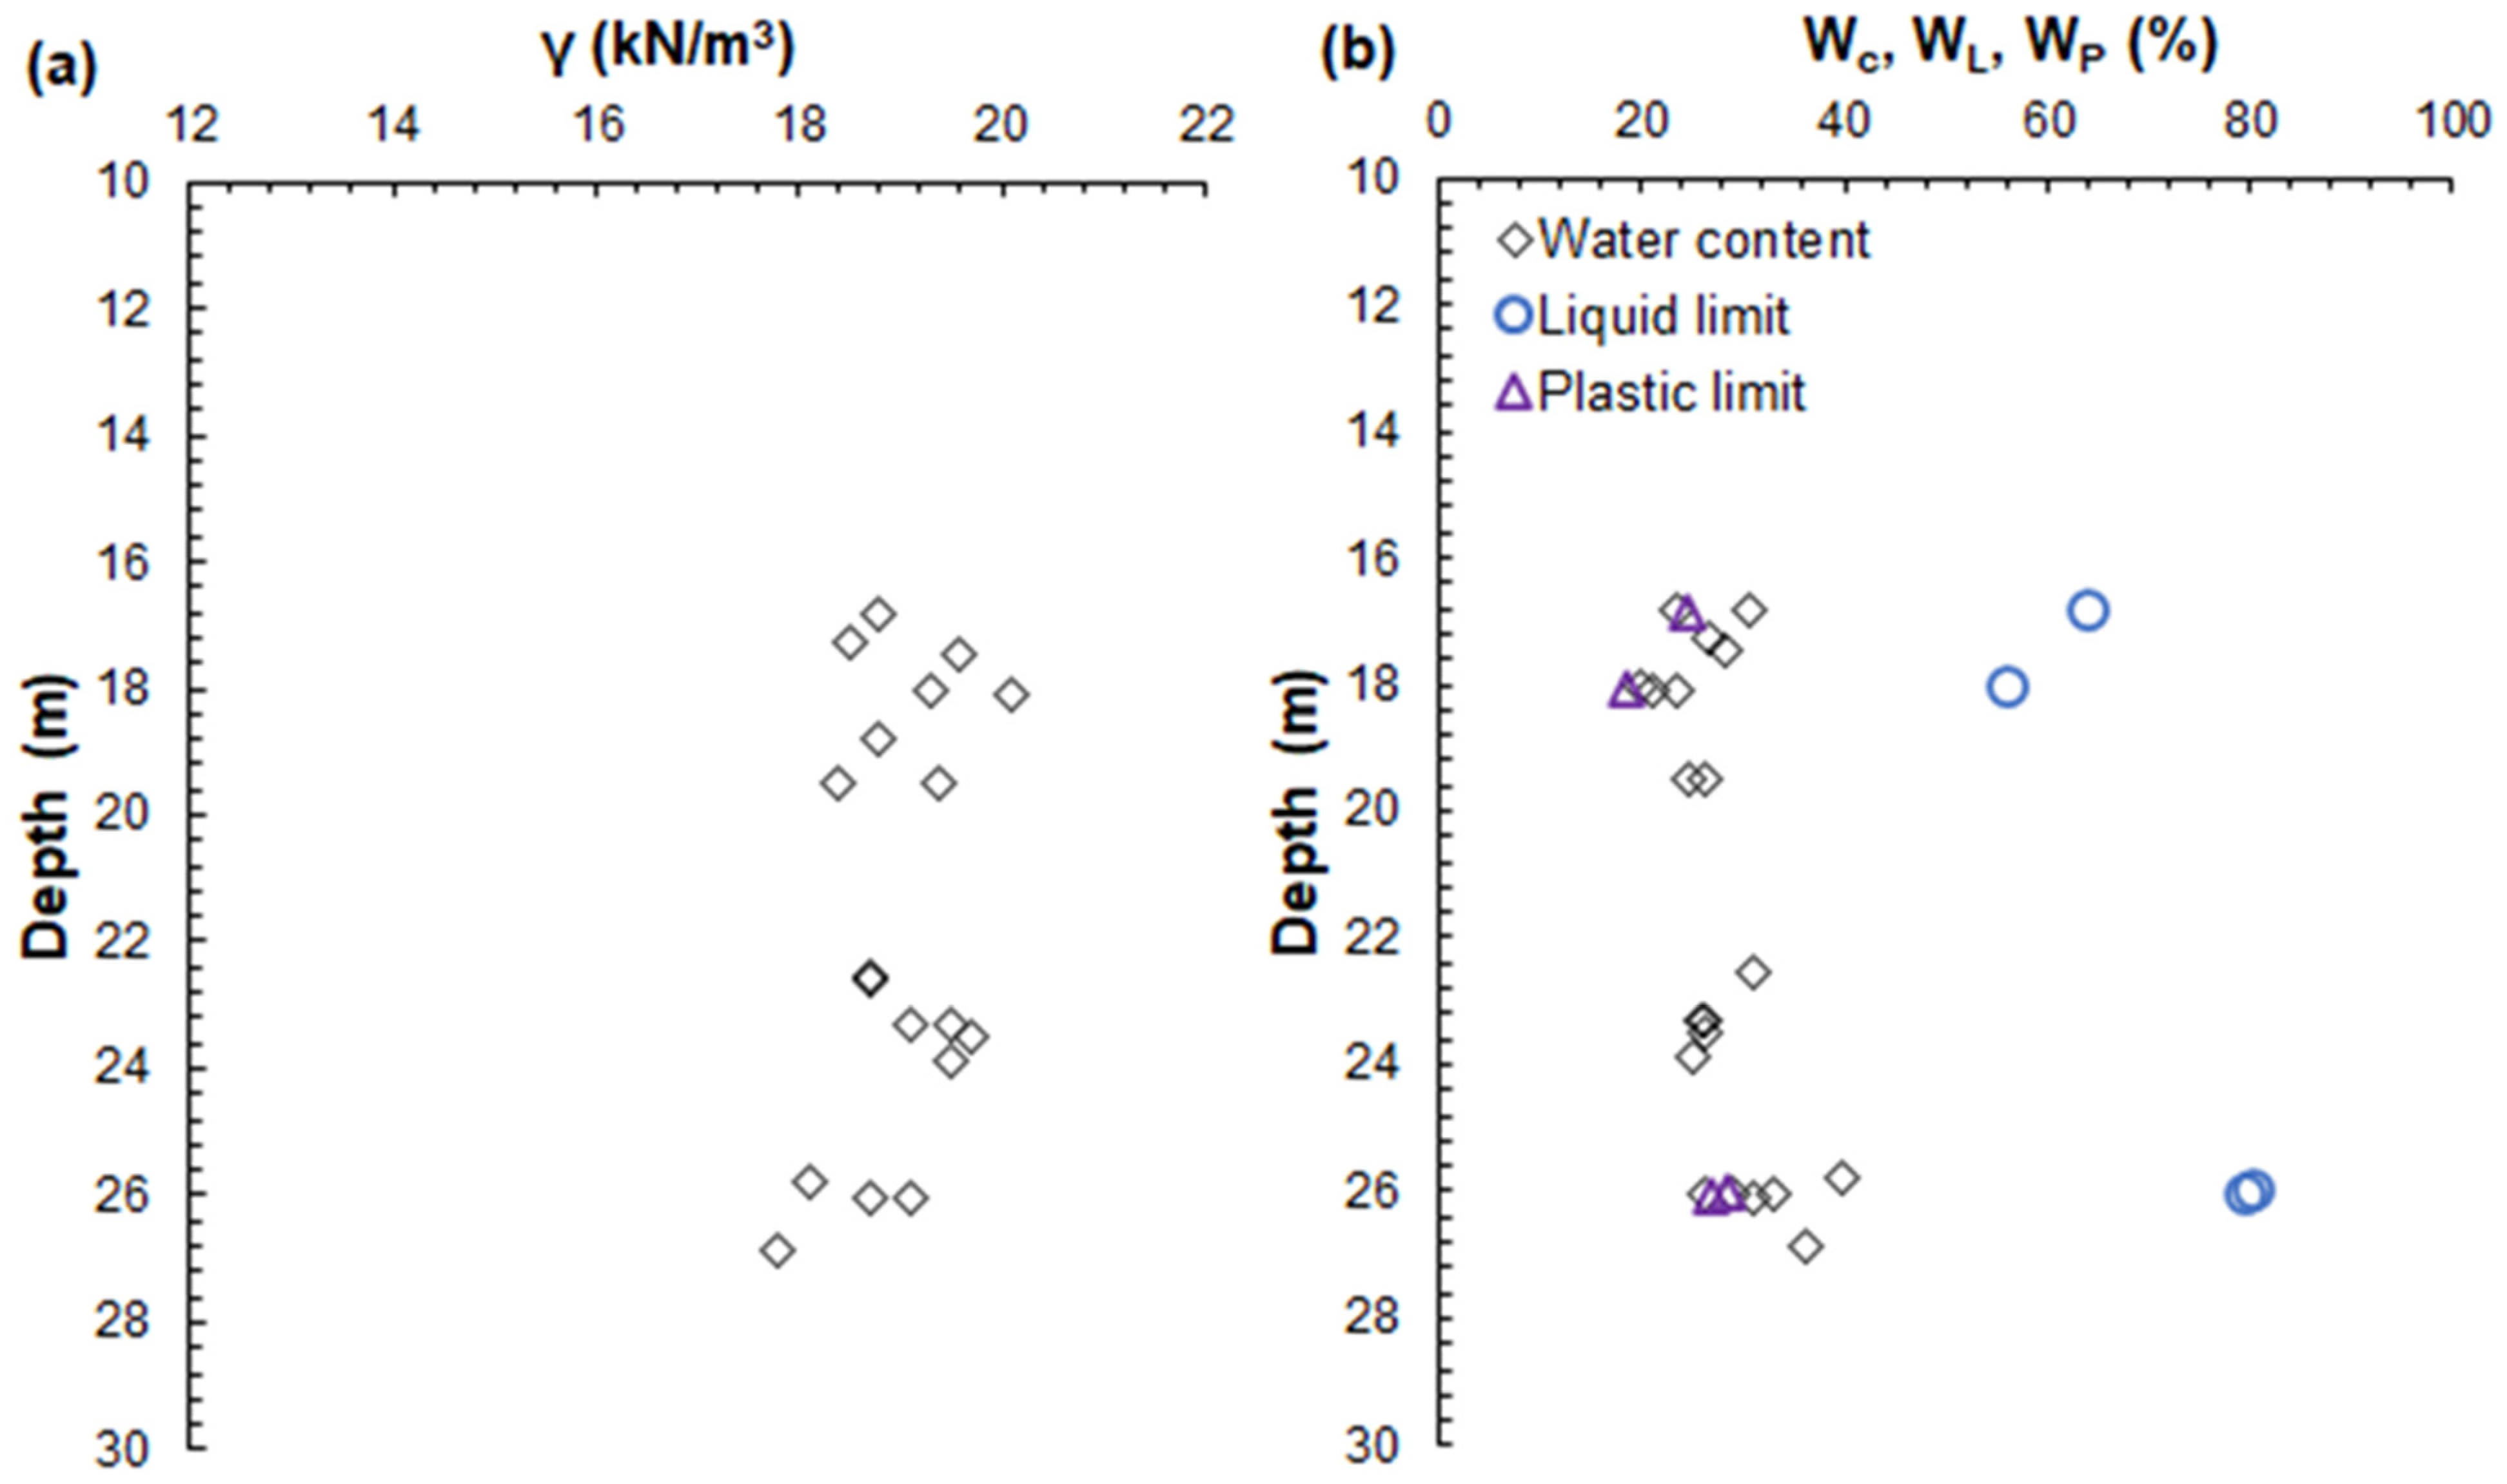
4.1. Index Classification Tests
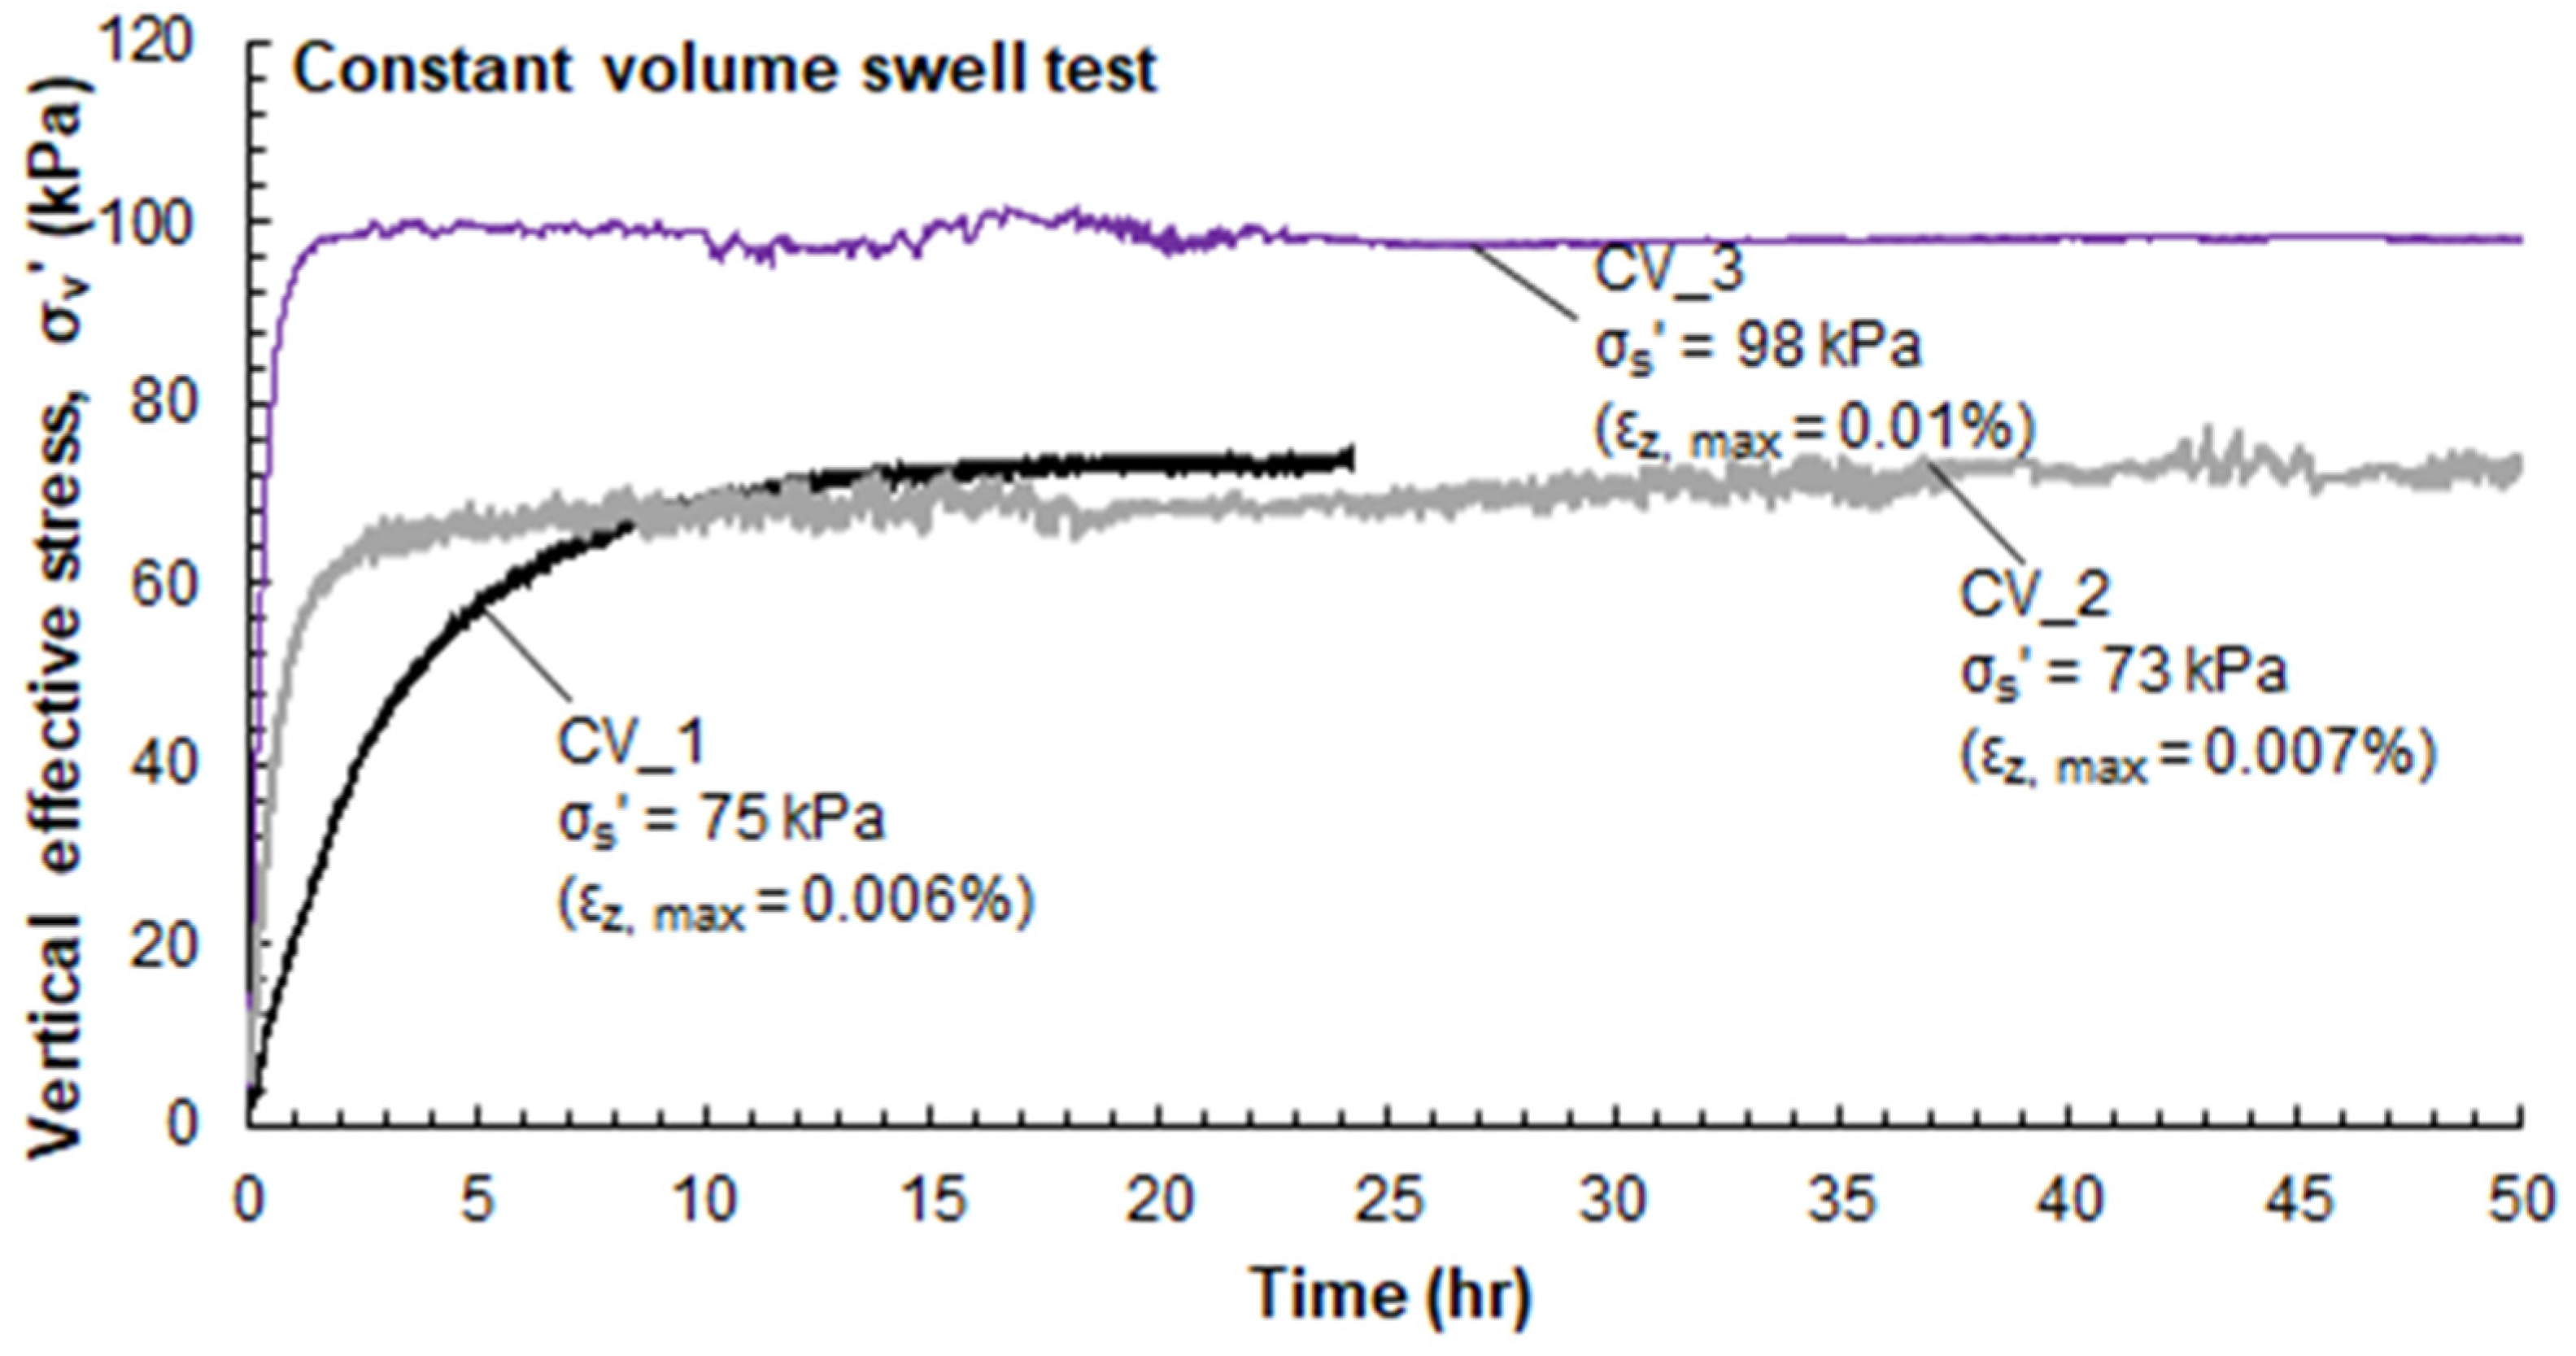
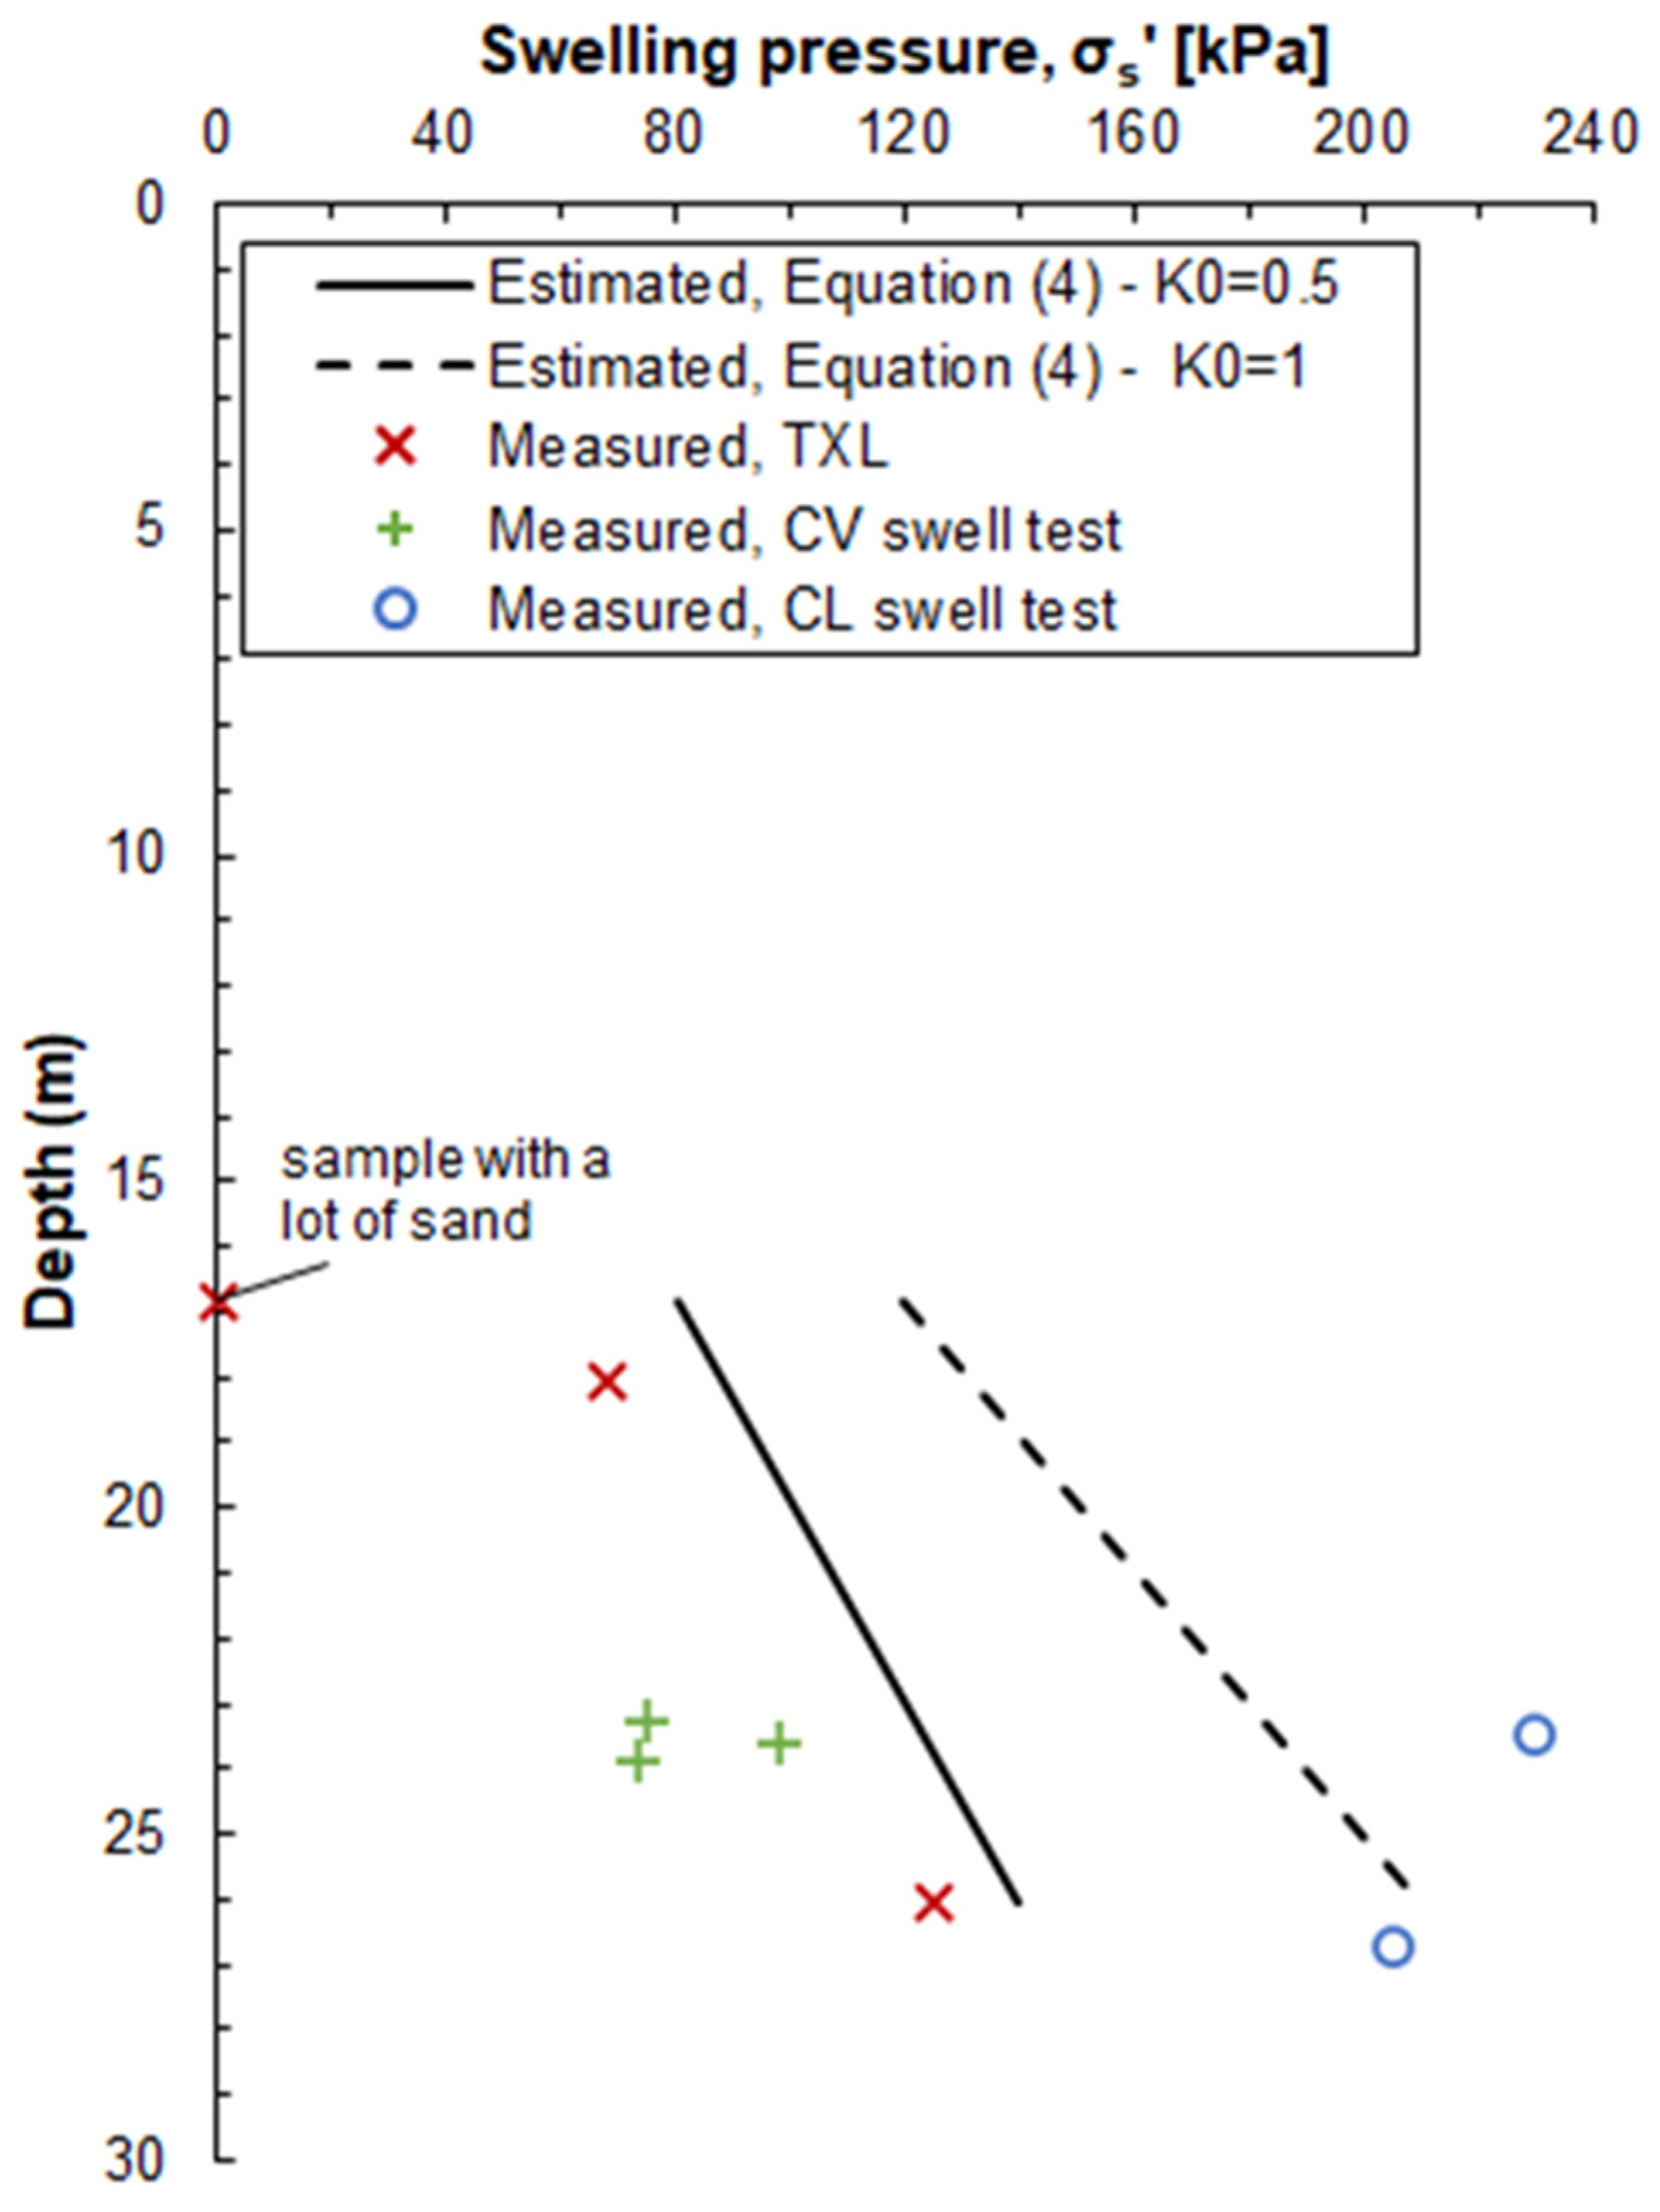
Figure 3 shows in-depth profiles for the bulk unit weight, γ; water content, Wc; and liquid (WL) and plastic (WP) limit of the tested Boom clay samples. At the testing location, the water content ranges from 20 to 40%. Overall, the water contents are slightly higher than the plastic limit, which is in the order of 19–28%. The liquid limit varies between 56 and 80% and shows an increasing tendency with depth. The index properties of Boom clay in the present study are compared in Table 2 with the properties of Boom clay as cited in the literature.

4.2. Swelling Tests

The release of the total stress acting on a soil sample due to its extraction from the ground results in the development of negative pore water pressure (suction) in the sample. It is acknowledged in the literature that there is a relation between the suction of a saturated sample and the state of stress at the depth at which the sample has been extracted [30,31,32]. In the case of an isotropic elastic sample and “perfect sampling”, whereby no mechanical disturbance is caused by shearing during sampling, extraction, transportation, extrusion or trimming, the developed suction, Δu, of the sample equals the mean effective stress, pi′, applied to the sample prior to extraction [32]:
Δ u = ( σ v i + 2 σ h i ) 3 = σ v i ( 1 + 2 K 0 ) 3
where σvi′ and σhi′ are the in situ vertical and horizontal effective stress, respectively, and K0 is the coefficient of earth pressure at rest.
The swelling of the samples due to suction release can alter the initial microstructure of the samples and influence the soil’s mechanical properties [33,34]. Extra attention is thus required to prevent the contact of the samples with water during testing. In this study, Boom clay samples were mounted on dry porous stones. For the case of triaxial tests after application on an initial cell pressure of 5 kPa, the porous stones were flushed with water, and the sample was saturated. During these processes, the cell pressure was adjusted to hinder a volume change in the sample in excess of ±0.07% [35]. The cell pressure applied to counteract the swelling of the sample is called the “swelling pressure” herein.
In practice, different procedures have been established to experimentally determine the soil swelling pressure. In this study, besides the triaxial tests, two types of swelling tests were also performed using a CRS apparatus. These types of tests will be herein referred to as constant volume (CV) and constant load (CL) swell tests. In all CV and CL swell tests, the Boom clay samples were placed on dry porous stones and were initially subjected to a contact pressure of about 5 kPa. For the case of constant volume swell tests, the samples were subsequently soaked in water while their volume was kept unchanged by maintaining the sample height practically constant. To achieve this, sample movement was monitored by a linear displacement transducer (LVDT), the vertical movement of which was adjusted during the swelling phase to eliminate any displacement measurements. The precision of the LVDT was at a level such that sample volume could be maintained to within 0.005% of the sample height throughout the swelling process. The swelling pressure was considered equal to the vertical stress developed under the applied constant volume conditions. In the constant load swell tests after the addition of water under a set pressure of 5 kPa, the samples were allowed to swell while an LVDT was used to measure the vertical movement that the samples developed in order to keep the applied set pressure of 5 kPa constant. When swelling ceased, the samples were loaded with a strain rate of 0.0005 mm/min until their original volume was reached. The swelling pressure was then determined as the pressure required to compress the samples back to their original volume.
The results of the constant load and constant volume swell tests showing the development of effective vertical stress and volumetric strain with time are shown in Figure 4 and Figure 5, respectively. The swelling pressures measured from the triaxial, CV and CL tests are plotted for comparison in Figure 6 together with the swelling pressure as this is estimated based on Equation (4) for K0 values of 0.5 and 1.0. It should be pointed out that previous laboratory investigations into Boom clay at the Mol site indicated that the values for K0 in the normally consolidated condition were between 0.5 and 0.8 [7,36]. At the same site, in situ K0 measurements at a depth of about 223 m had some scatter in terms of K0 values: K0 = 0.3–0.9 [10]. To the authors’ knowledge, field measurements of in situ K0 values for Boom clay at shallow depths have not been reported in the literature.
The constant volume swell pressure appears to fit the swelling pressure from triaxial tests better. On the other hand, the constant load swell pressure is about 2.5 times higher than the constant volume swell pressure. In fact, Thompson et al. [21] showed that the constant volume swell pressure can be approximately one-third of the constant load swell pressure. The data in Figure 6 show that the Boom clay samples retrieved from a depth of 16.9–26.8 m below ground level exhibit swelling tendencies, the magnitude of which, however, depends on the measurement procedure applied and the imposed stress paths. The dependency of the swelling pressure on the testing method was also emphasized by Reiffsteck et al. [37]. Nagaraj et al. [38] suggested that the constant load (CL) swell method allows for a completely swollen condition and provides a better estimation of swelling pressure compared with the constant volume (CV) method. In addition, since the K0 value was not determined experimentally, it is difficult to make any direct comparisons between the measured swelling pressures and the in situ state of stress. Nevertheless, the data in Figure 6 show that when testing Boom clay samples, it is important to take precautions before placing the samples in contact with water [39,40]. As illustrated in Figure 4b, for the tested samples, the release of swell pressure results in a volumetric strain of 4–7%.

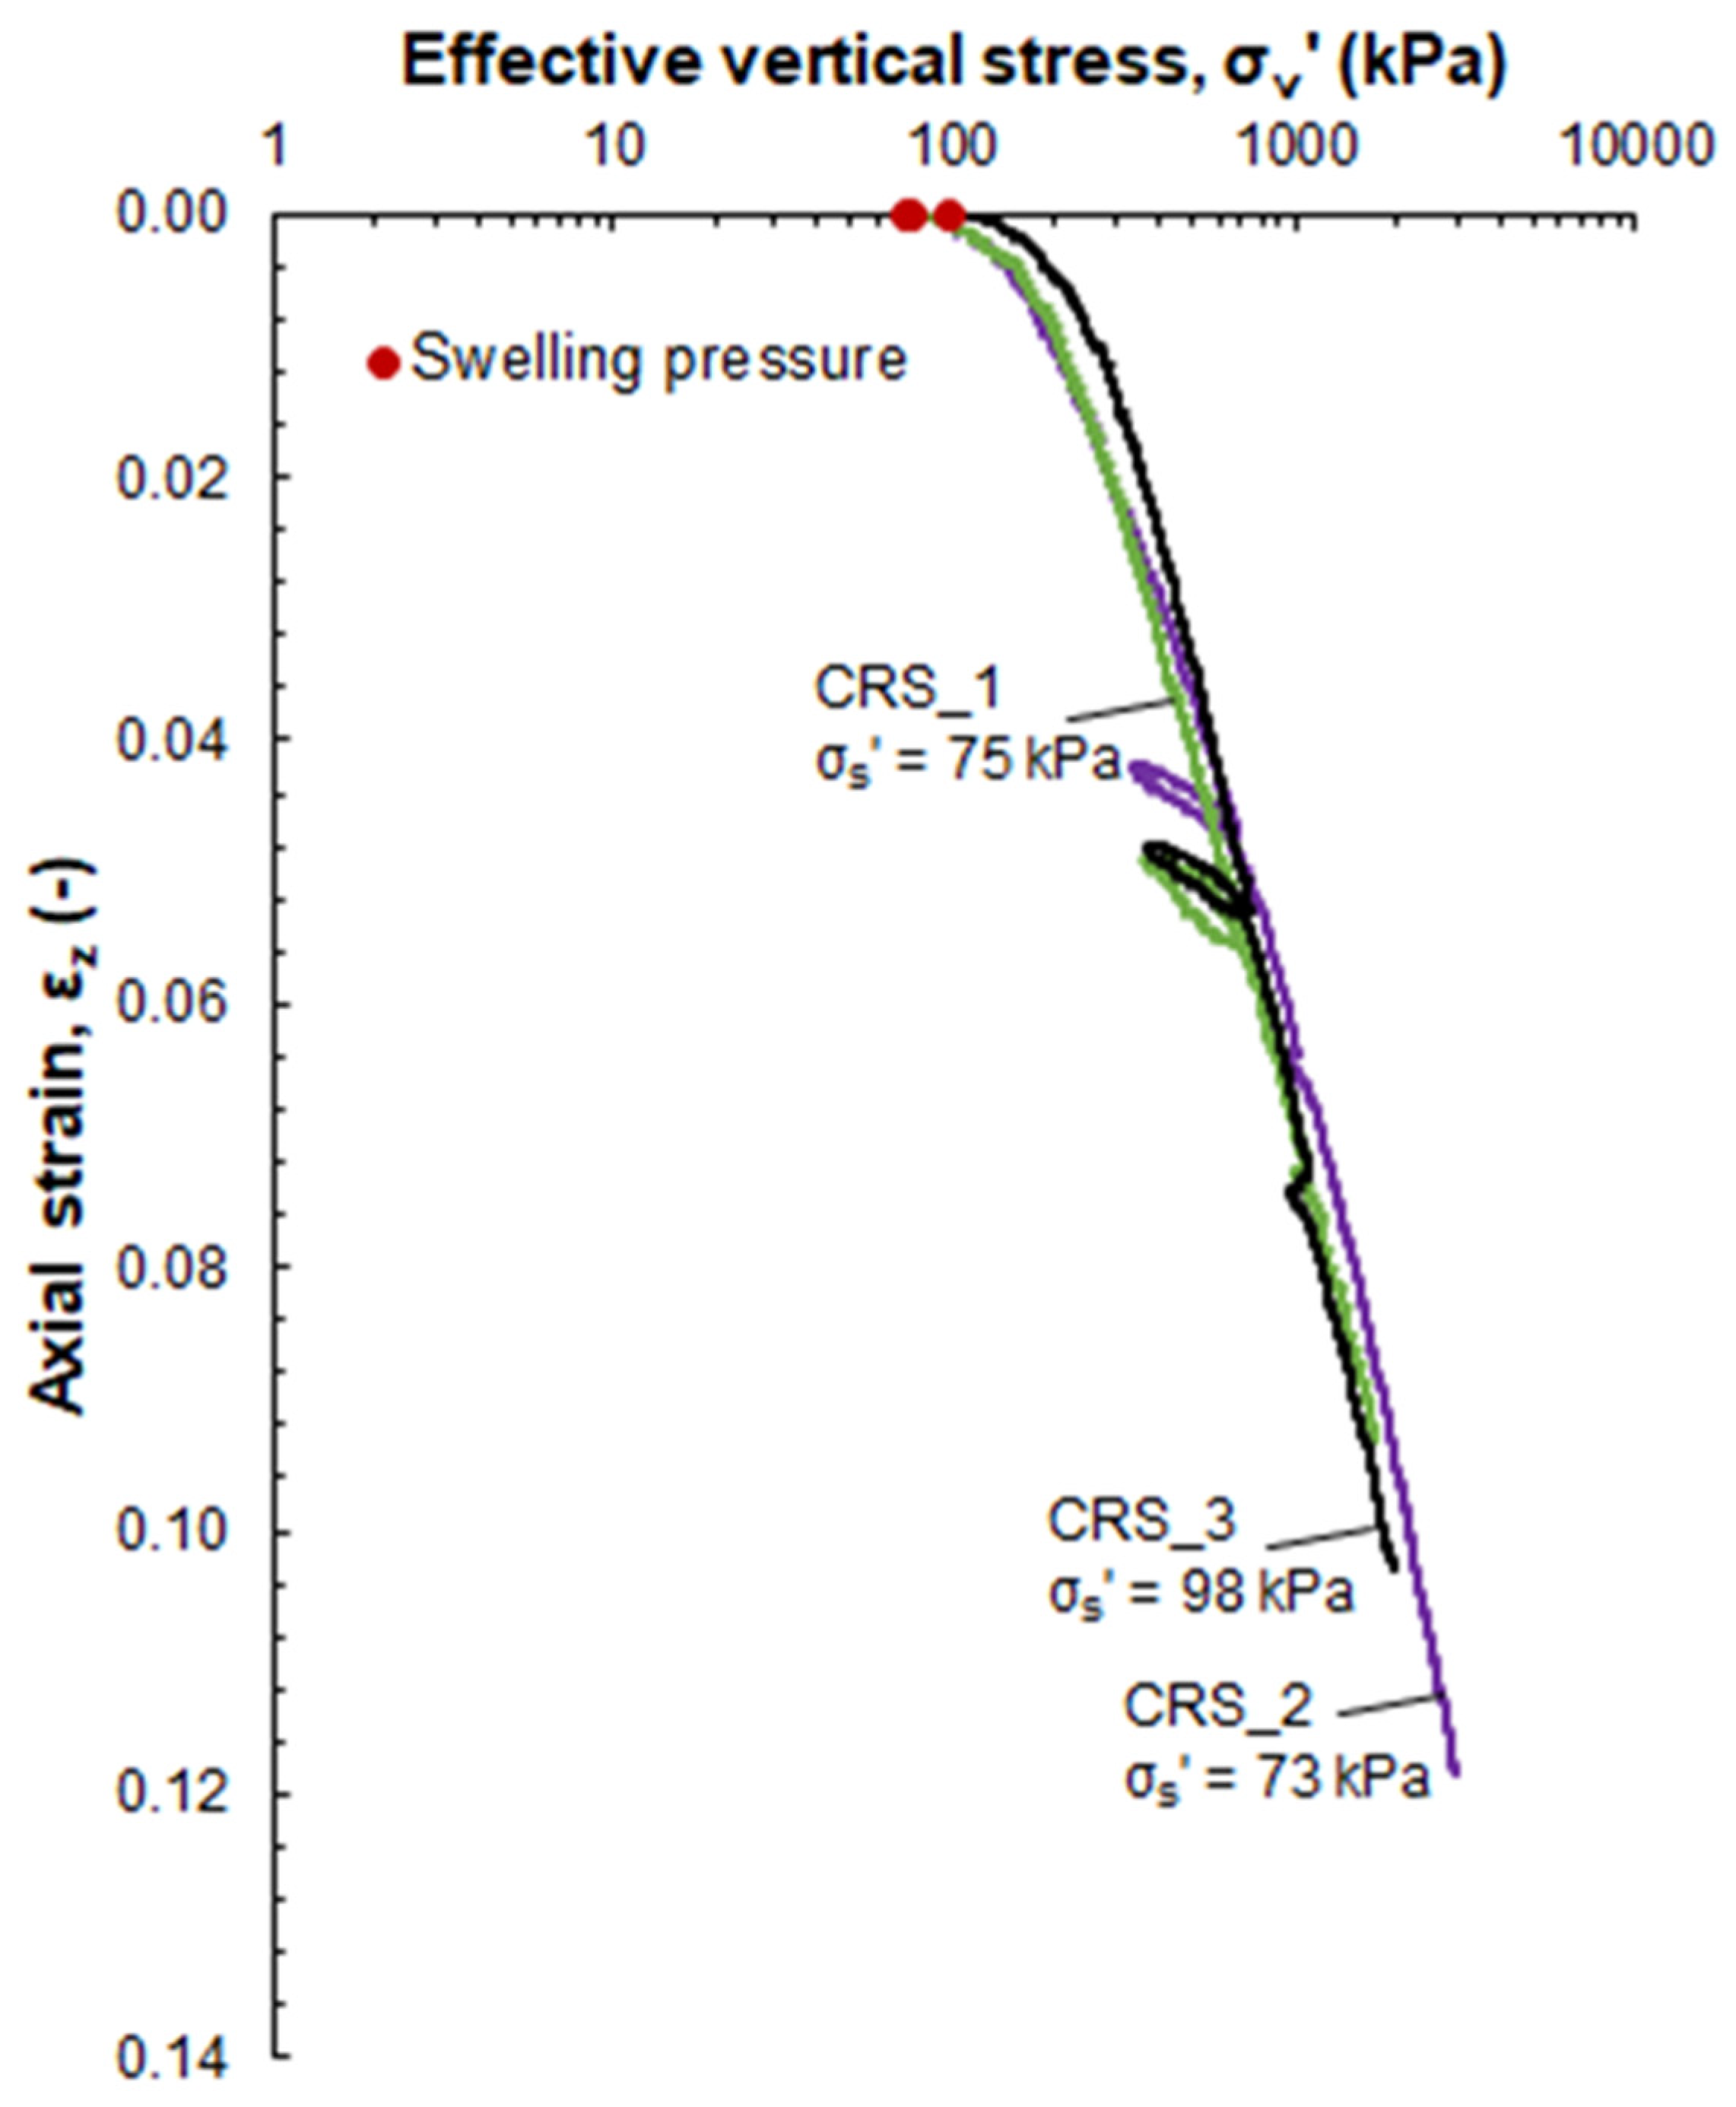
4.3. Compression Tests

At the end of the CV tests, as shown in Figure 5, the samples were subjected to constant rate of strain, CRS, testing. The consolidation curves obtained are shown in terms of axial strain, εz, versus vertical effective stress, σv′, in Figure 7. Loading started from the swell pressure measured at constant volume and consisted of six loading steps: loading to 4 × σvi′ (step A), followed by unloading to 2 × σvi′ (step B), reloading to 6 × σvi′ (step C), relaxation for 16 h (step D) and reloading to a maximum compression stress of about 10–15 times the estimated in situ effective vertical stress, σvi′ (step E). The applied deformation rate, dh/dt, was 0.03 mm/h, which corresponds to approximately 0.15%/h. This deformation rate resulted in the development of an excess pore water pressure at the base of the samples of less than 1.5% of the applied vertical stress.
All three samples tested exhibit a similar unloading/reloading behaviour. The compression index, Cc, was obtained from the slope of the loading εzσv′ curve in the effective stress range of 6 × σvi′ up to the maximum compression stress. The swelling index, Cs, was calculated based on the data during the unloading stage in the effective stress range of 4 × σvi′ to 2 × σvi′ kPa (Cs,A→B). The secondary compression index, Cα, was deduced from the relaxation phase, during which the vertical stress, σv′, was reduced with time under constant strain. The consolidation data, Cc, Cs and Cα, are summarized in Table 3.
The preconsolidation stress, σp′, is determined using Casagrande’s method [41]. It should be pointed out, however, that for the stress levels applied, the consolidation curves in Figure 7 show a predominant elastic behaviour under compression without notable changes in the stiffness response. This behaviour makes it difficult to estimate the preconsolidation stress. In Table 3, the yield stresses determined are also shown. The estimated σp′ values range from 280 to 440 kPa, which corresponds to an overconsolidation ratio, OCR, of 1.3 to 2.6.
Deng et al. [19] performed several oedometer tests on Boom clay samples taken from the Essen and Mol sites. They reported compression index, Cc, values in the range of 0.123–0.228 for oedometer tests with a maximum effective vertical stress of 3.2 MPa. These values seem to be in relatively good agreement with the Cc values obtained in this research. However, as concluded by Deng et al. [19], the compression index values from oedometer tests at pressures reaching 32 MPa have significantly higher values. It is thus likely that the maximum pressure applied in the CRS tests of this study was not high enough to evidence the post-yield compression behaviour, an assumption that also hinders the assessment of the OCR. Specifically, if this assumption is valid, the OCR of the tested Boom clay at a depth of 23.3–23.9 m below ground level is at least higher than 10, considering that the samples were subjected to loading up to a maximum pressure of 10–15 times the estimated in situ vertical effective stress. The OCR response is highly influenced by the effective stress level at the sampling depth. It should be highlighted that previous studies on Boom clay samples from the Mol site at a depth of 190–290 m below ground level indicate an OCR of about 2.4 [7,9].
Sorensen and Okkels [42] proposed a simple correlation to estimate the compression index which considers the water content (%) and plasticity index, Ip (%), as variables:
C c = 0.0012 · I P + 0.0085 · W c 0.05
Equation (5) was mainly used for high-plasticity overconsolidated clays, but it remains applicable to a wide range of clays. Using Equation (5), the estimated Cc values for the Boom clay samples of this study, with an average water content of 30% and a plasticity index in the range of 40–50%, are 0.253–0.265. The estimated values are a factor of two higher compared with the measured values. This can be an indication that the tested samples may have not been loaded to pressures high enough to reflect the virgin compression behaviour.

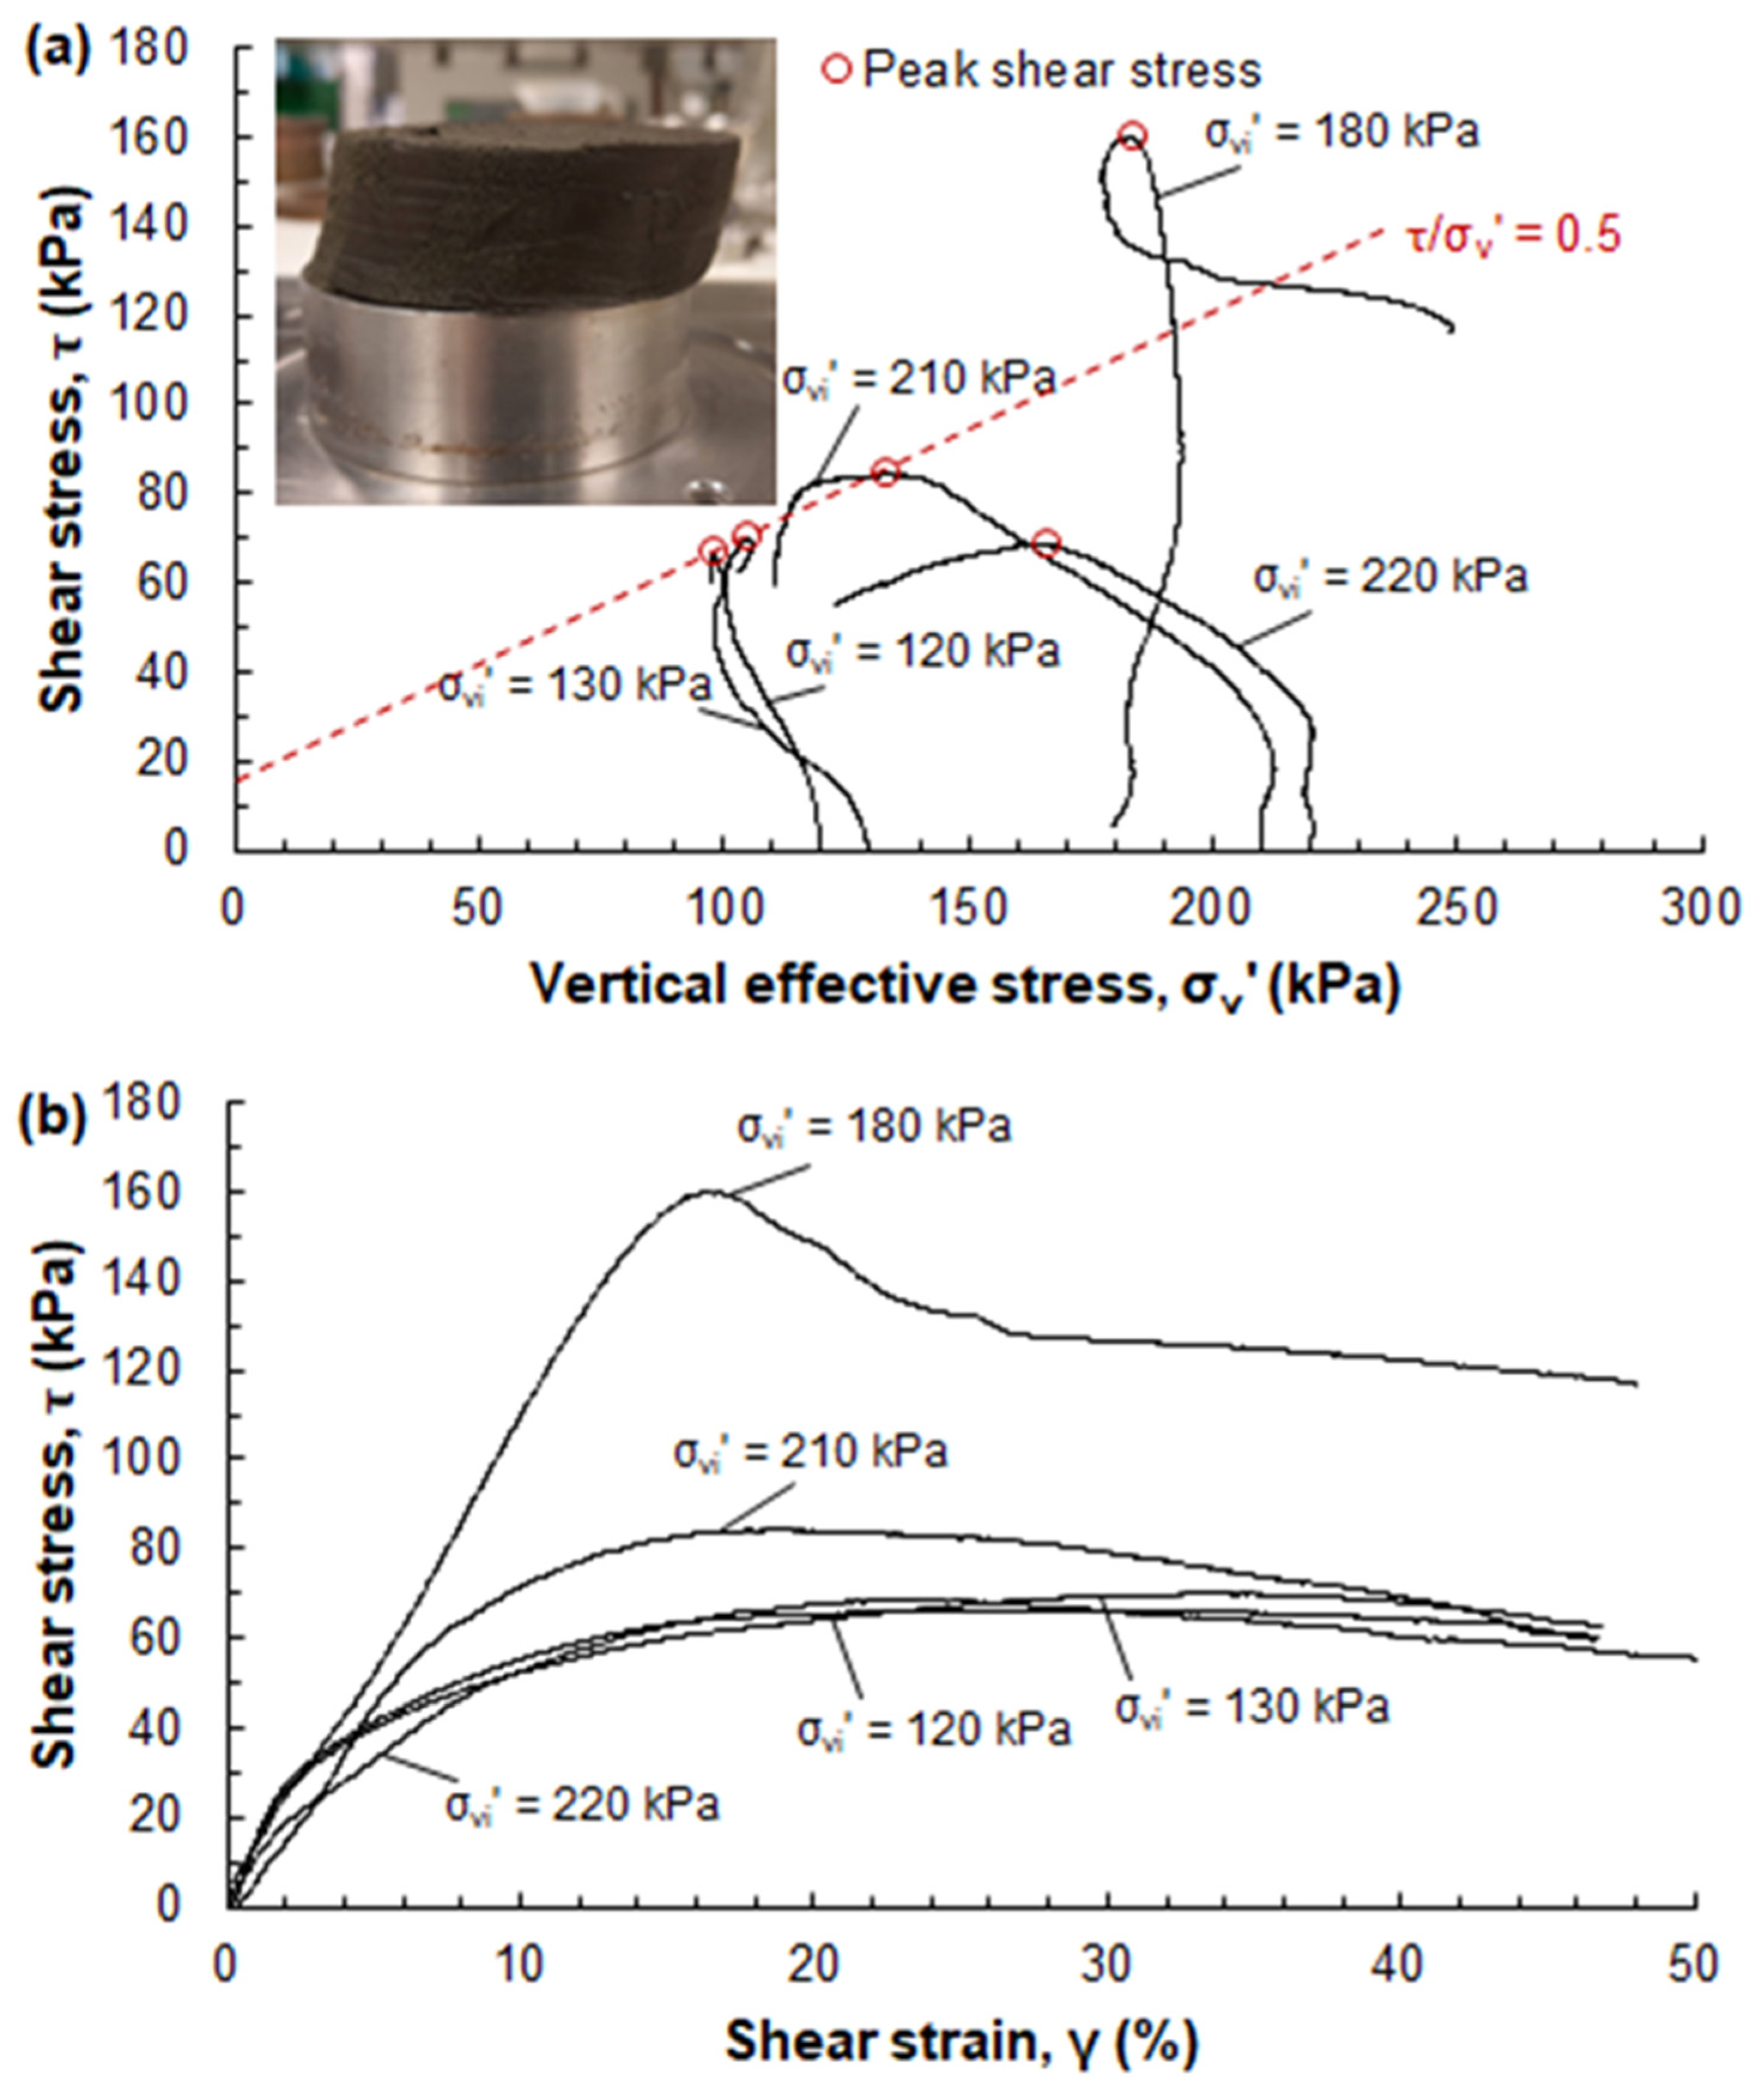
4.4. Shear Strength Tests

The samples were installed in a triaxial apparatus with the use of dry porous stones. During the saturation process, a confining pressure was imposed to prevent swelling. After saturation, with Skempton’s B parameter having a value greater than 0.96, the samples were anisotropically consolidated along a constant effective stress ratio line, K0 = 0.5. Shearing was applied under undrained conditions in a deformation-controlled mode. Figure 8a shows the stress paths of the tested samples, while the stress–strain curves and the excess pore water pressure against strain curves are shown in Figure 8b,c, respectively. Lastly, Figure 8d plots the principal stress ratio (σ1′/σ3′) against strain.
The samples appear to have approached the critical state with the deviator stress reaching a plateau in Figure 8b. Peak and strain softening are observed for two of the samples, while for one of the samples, an almost continuous increase in strength with increasing strain is recorded. The sample with the lowest initial mean effective stress, pi′, is also the sample which exhibits the lowest level of mobilized shear strength, although the differences in the pi′ values of the tested samples are not large. Visual observations of the deformation shape of the samples at the end of shearing show that for the samples with strain softening, shear planes develop [Figure 8e,g], whereas the sample that shows no strain softening response fails in a bulging mode [Figure 8f]. A best fit line was drawn through the peak stress points in Figure 8a. A mobilized friction angle of φ′ = 270 and a mobilized cohesion c′ = 6 kPa were determined from the slope and intercept of this line as given by Equations (6) and (7).
ϕ = sin 1 ( 3 M 6 + M )
c = ( α tan ϕ ) M
where M is the gradient of the slope (q/p′), and α is the y-intercept.
Alternatively to defining failure at peak shear stress, the points at which the principal stress ratio reaches a maximum are shown in Figure 8a. The best fit line through these points, however, shows a negative value for cohesion. Obviously, the number of triaxial tests performed herein is limited, which hinders the accurate determination of the friction angle and cohesion. Consequently, the φ′ and c′ values provided in this study should be regarded as preliminary and are subject to refinement as further data become available.
The effective cohesion, c′, and internal friction angle, φ′, of Boom clay at the Antwerp site were found to be 14.7 kPa and 22°, respectively [43]. The c′ and φ′ values of Boom clay at the Scheldt site proposed by Schittekat et al. [44] are similar to those of Antwerp: c′ = 22 kPa, and φ′ = 25.04°. The failure envelopes of intact Boom clay samples at the Mol and Essen sites were gathered by Deng et al. [19]. Part of these failure envelopes are plotted together with the test data of this study in the qp′ plane in Figure 9. For the limited number of triaxial tests performed in this study, the peak shear stress, q, and the corresponding mean effective stress, p′, points fall well along the failure envelopes defined for Boom clay at Mol and Essen. The lower friction angles and higher cohesion values for Antwerp and Scheldt Boom clay can be attributed to the stress level dependency of the failure envelope. Deng et al. [19] concluded that the failure envelope of Boom clay at Mol and Essen is not linear, especially in the lower stress part (p′ lower than 2 MPa). This implies that higher friction angles and lower cohesion values are expected at low stress levels such as the ones applied in this study (p′ lower than 300 kPa).
Direct simple shear (DSS) tests were also performed on the Boom clay samples. The samples were consolidated to the estimated in situ vertical stress and were subsequently subjected to loading under a shear strain rate of 8%/h. During shearing, the height of the samples was maintained constant, and this is considered to be equivalent to undrained testing [45]. The effective stress paths and the stress–strain relationships of the tested samples are illustrated in Figure 10a,b, respectively. With the exception of the DSS test at σvi′ = 180 kPa, the samples do not exhibit sharp peak strength or a strong dilative response, which are characteristics more expected for heavily overconsolidated clays. The DSS test at σvi′ = 180 kPa exhibits the highest shear strength, which may be attributed to the higher degree of overconsolidation. For the rest of the samples, the shear stress–strain curves converge at large strains. For these samples, the undrained shear strength ratio (defined as the ratio of peak shear stress to the vertical effective stress at the start of shearing) ranges from 0.3 to 0.5.
The failure envelope corresponding to peak shear stress points is also shown in Figure 10a. The failure envelope has a cohesion intercept of c′ = 17 kPa and a slope τ/σv′ = 0.5. The angle of internal friction φ′ is estimated to be 26.5°. Outliers in this estimation are the peak shear stress points of the DSS tests at σvi′ = 180 and 220 kPa.
The Boom clay samples in this study were also subjected to a standard unconfined compression strength (UCS) test. The unconfined compressive strength for samples at a depth of 23–27 m was found to be 470–580 kPa. The details of the tested samples are given in Table 1. For Boom clay, the UCS is not well documented. Coll [9] determined the UCS for Boom clay samples at the Mol site from a depth of 223 m below the surface and found a value of 2.5 MPa. Bernier et al. [10] reported a value of 2 MPa for Boom clay samples also from Mol.

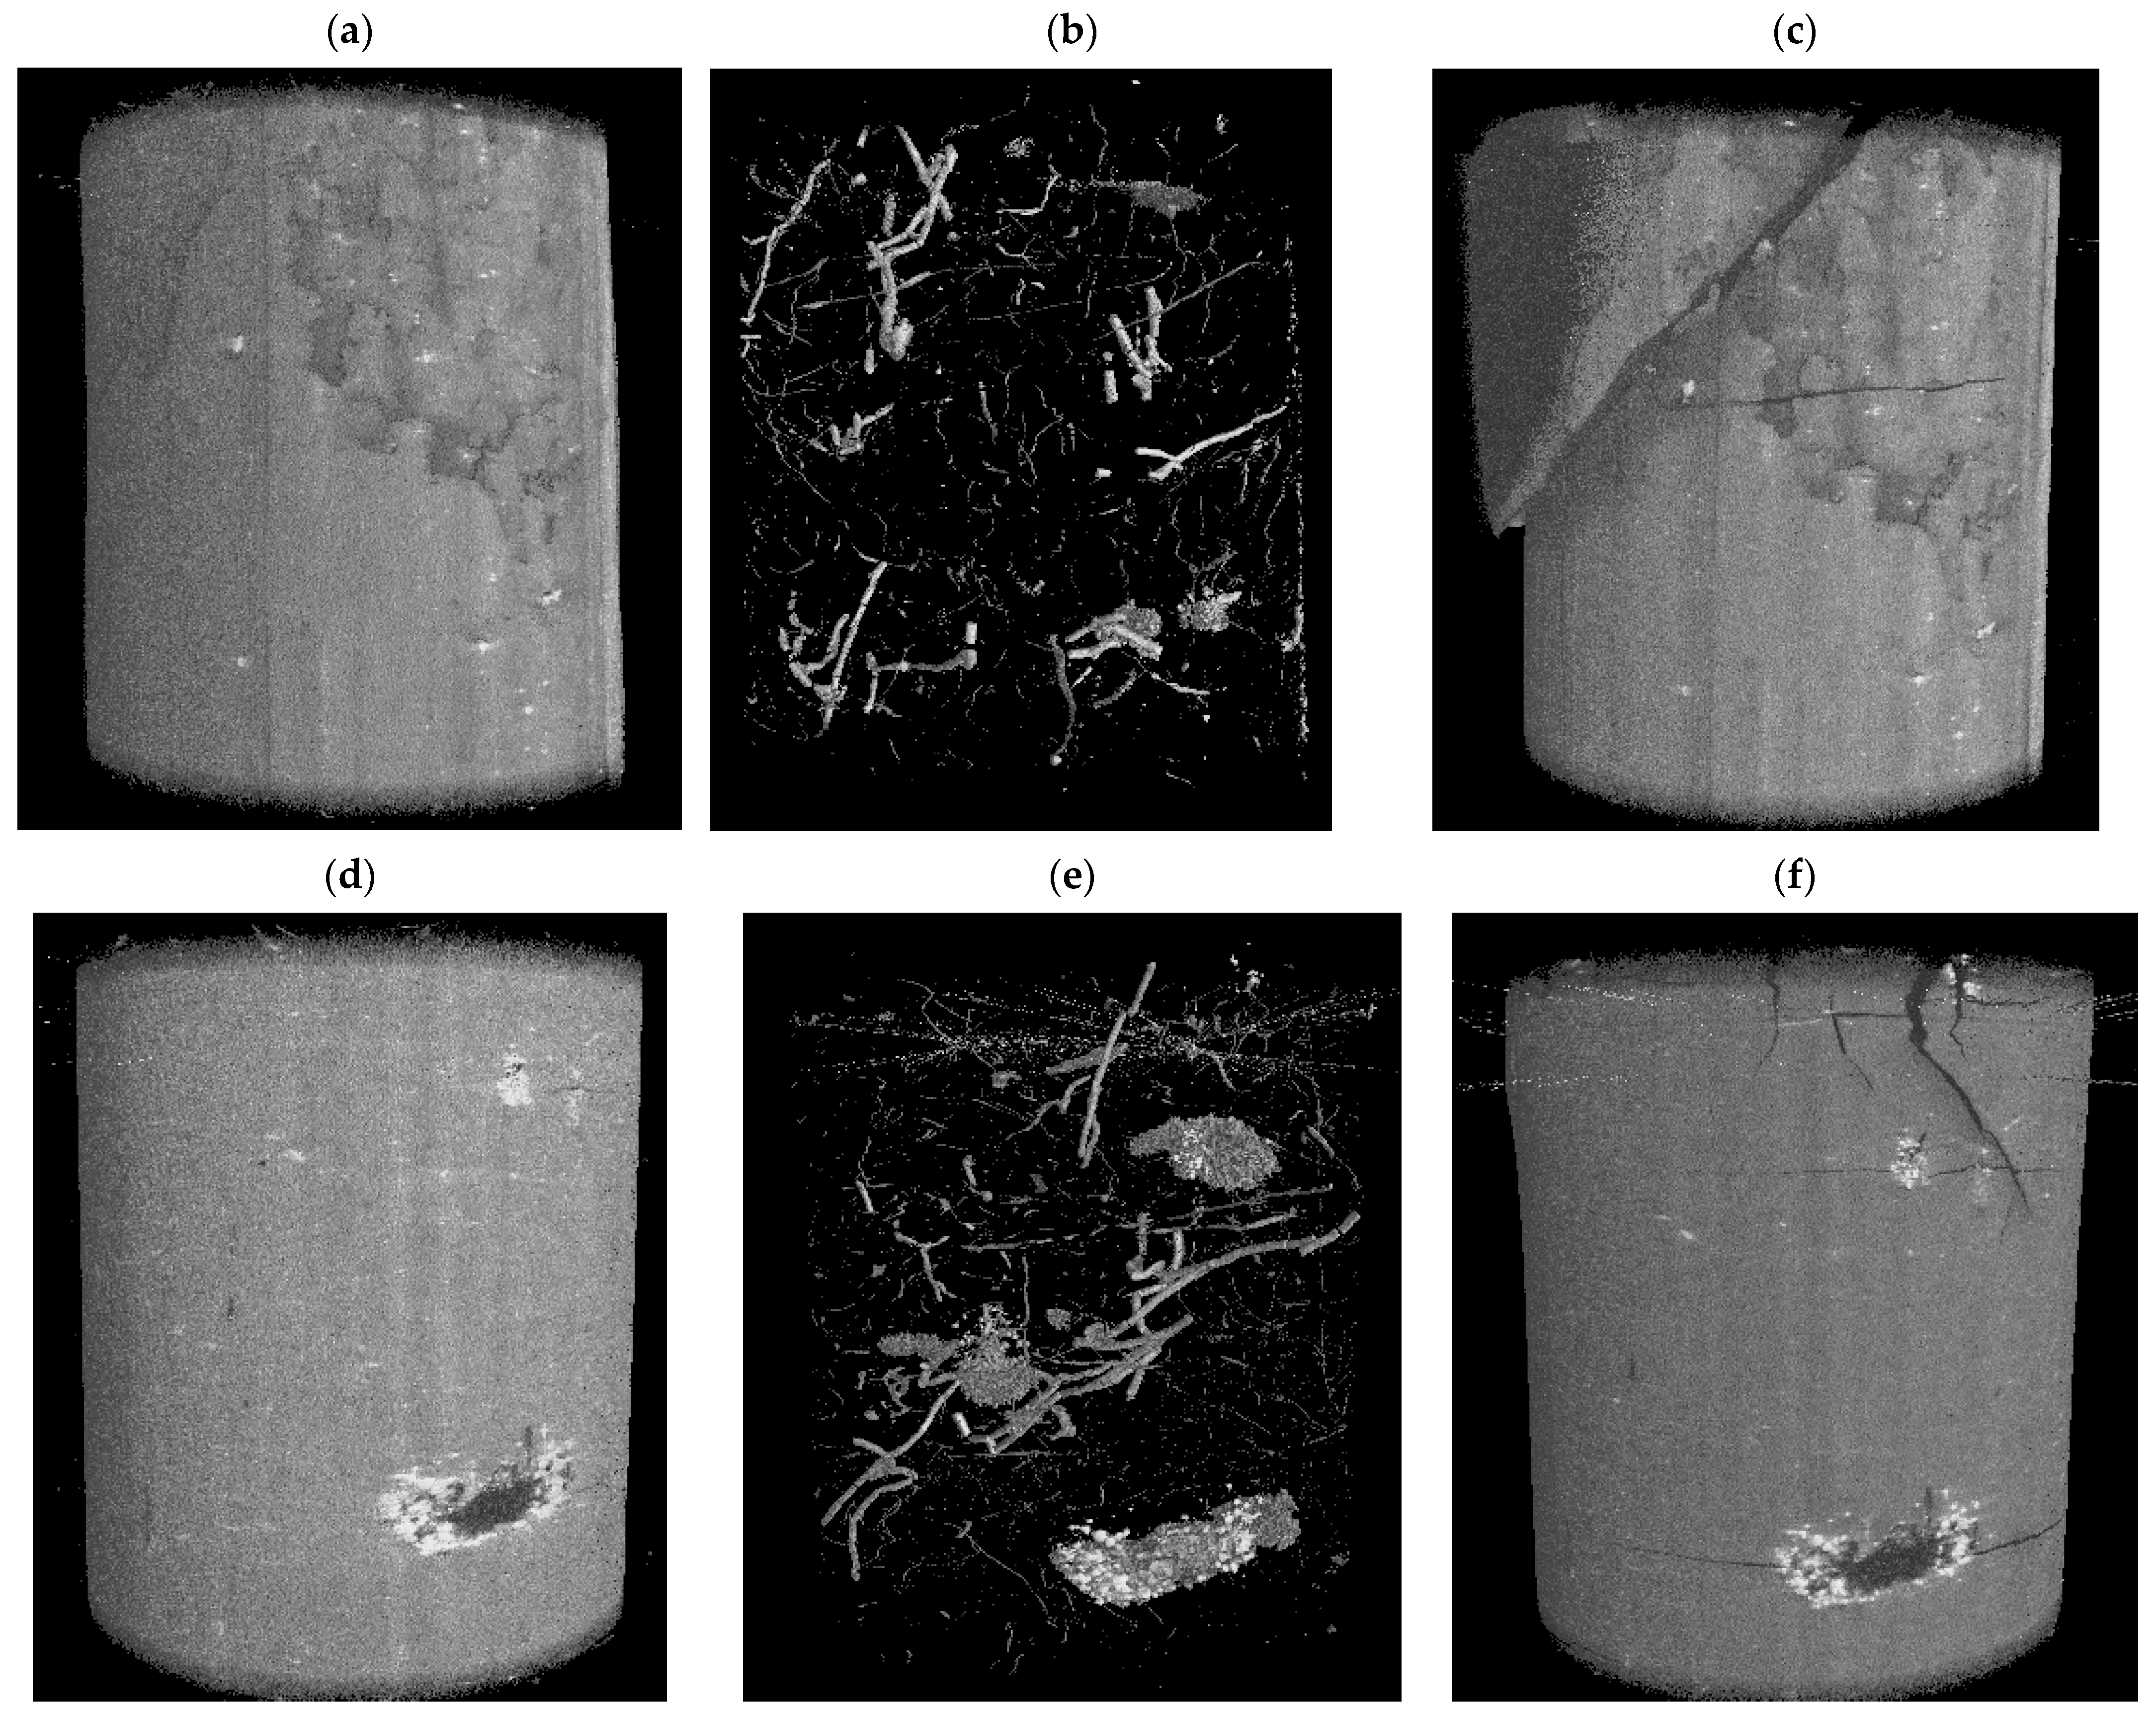
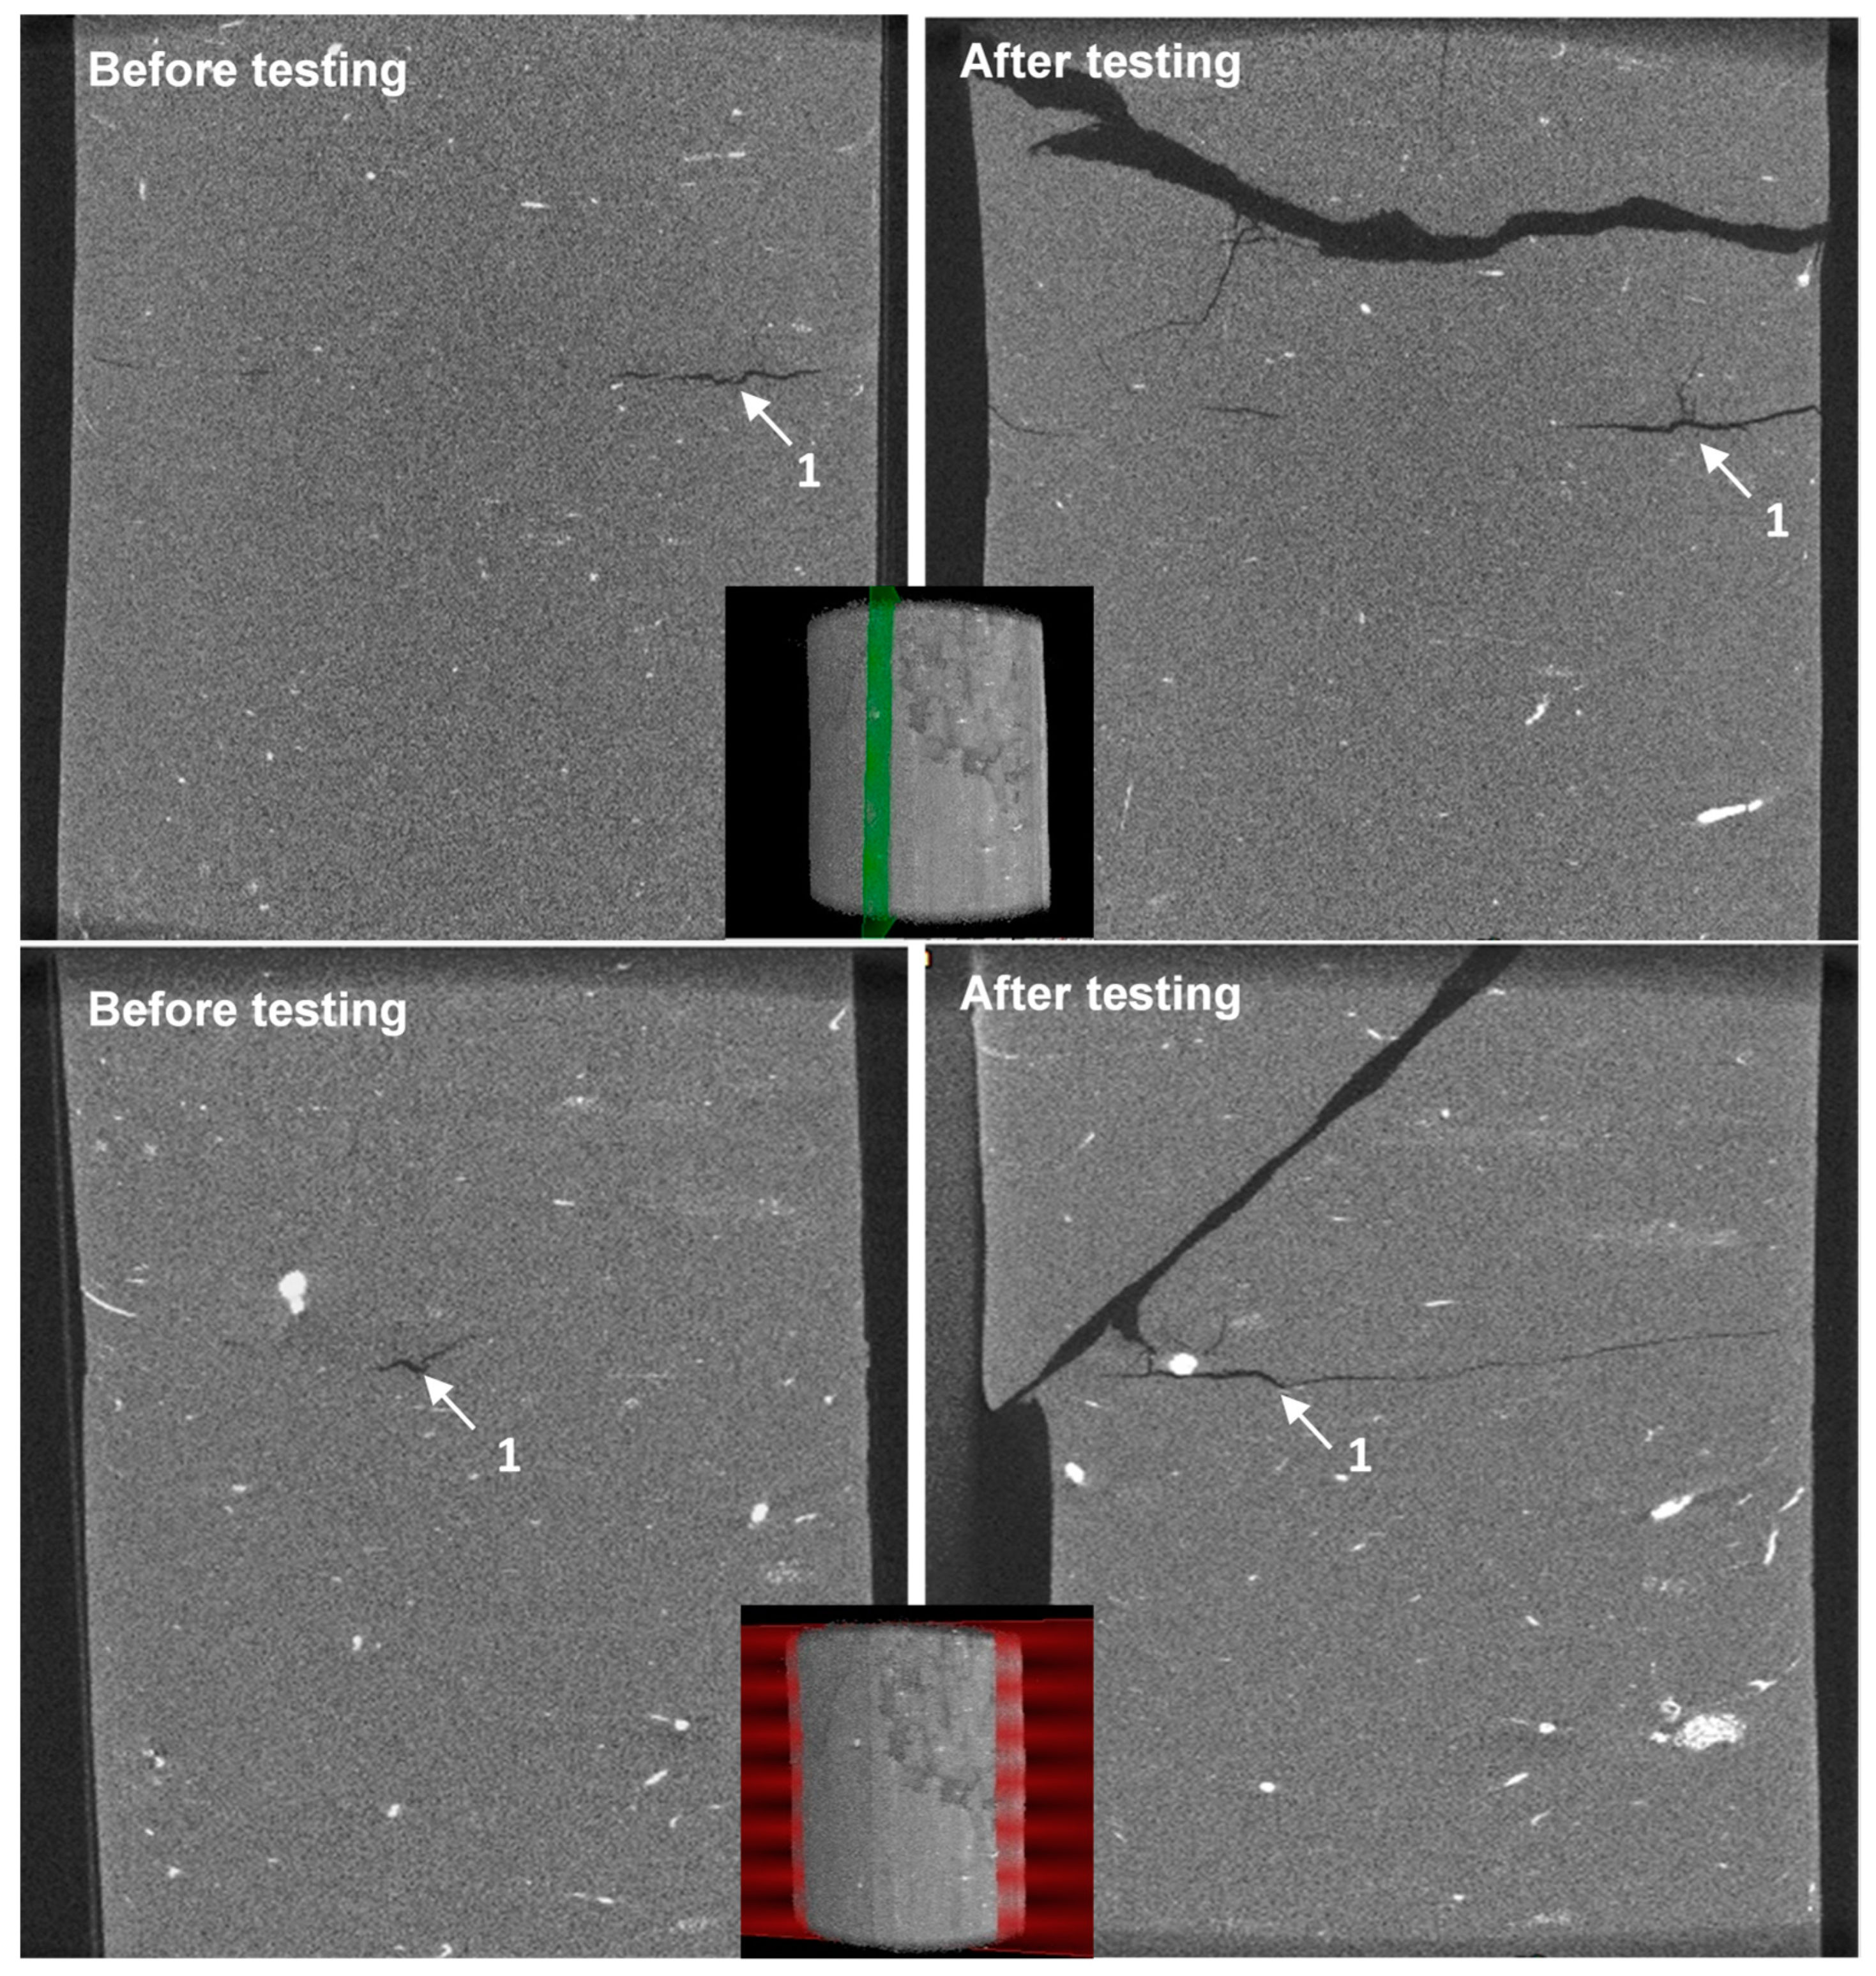
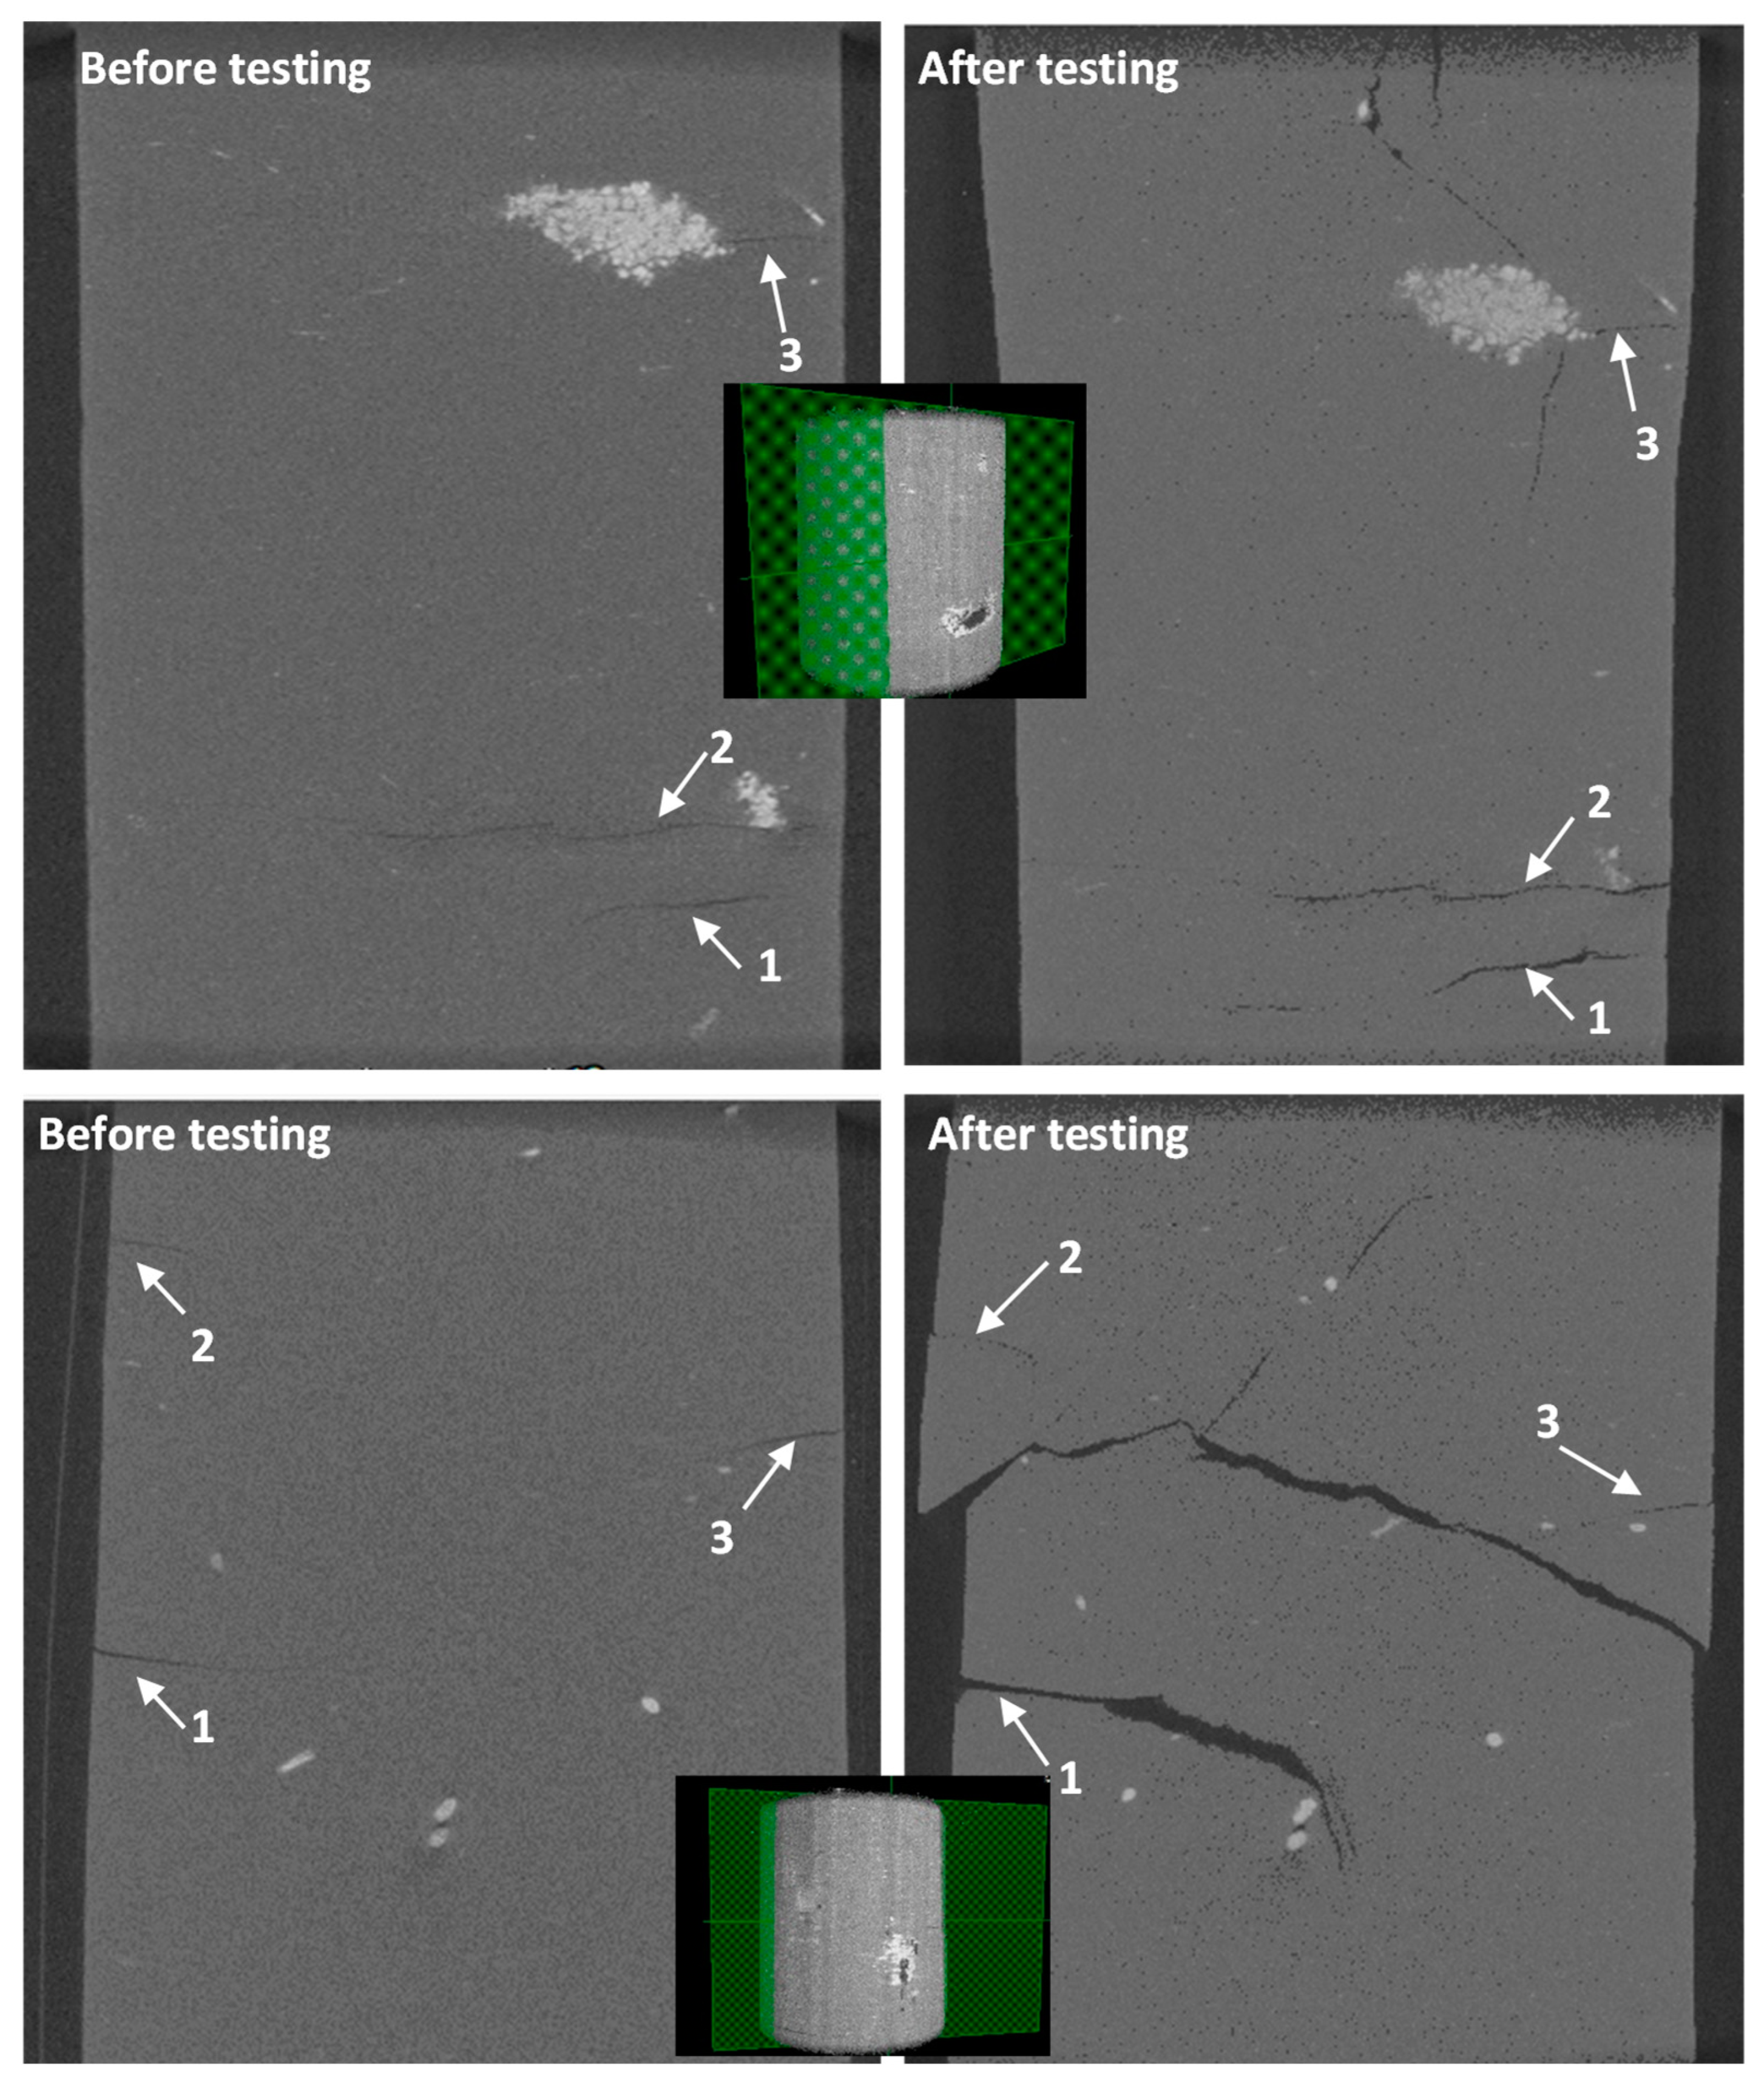
4.5. X-Ray Tomography

The microstructure of Boom clay can determine its mechanical behaviour. Micro-computed tomography (μCT) scans were carried out on two of the Boom clay samples (UCS_1 and UCS_2 in Table 1). Since μCT is a non-destructive technique, the Boom clay samples were scanned before and after UCS testing. The scans were performed at TU Delft university using a CoreTOM micro-CT scanner manufactured by TESCAN. The scanner operates using X-ray radiation. The resolution for the scans in this study was 64.4 μm. The 3D reconstruction images of the samples are shown in Figure 11a,d and Figure 11c,f for the samples prior to and after shearing, respectively. Figure 11b,e show the 3D reconstruction of the inclusions inside the Boom clay samples. These inclusions are shown in white due to their higher density. Vertical sections from the 3D X-ray images of the samples prior to and after testing are shown in Figure 12 and Figure 13. As can be seen, fractures are clearly visible throughout the sections before the shearing of the samples. It is interesting to note that the discontinuities depicted on the intact samples are oriented perpendicularly with respect to the vertical direction, which is the direction of stress release during sampling.

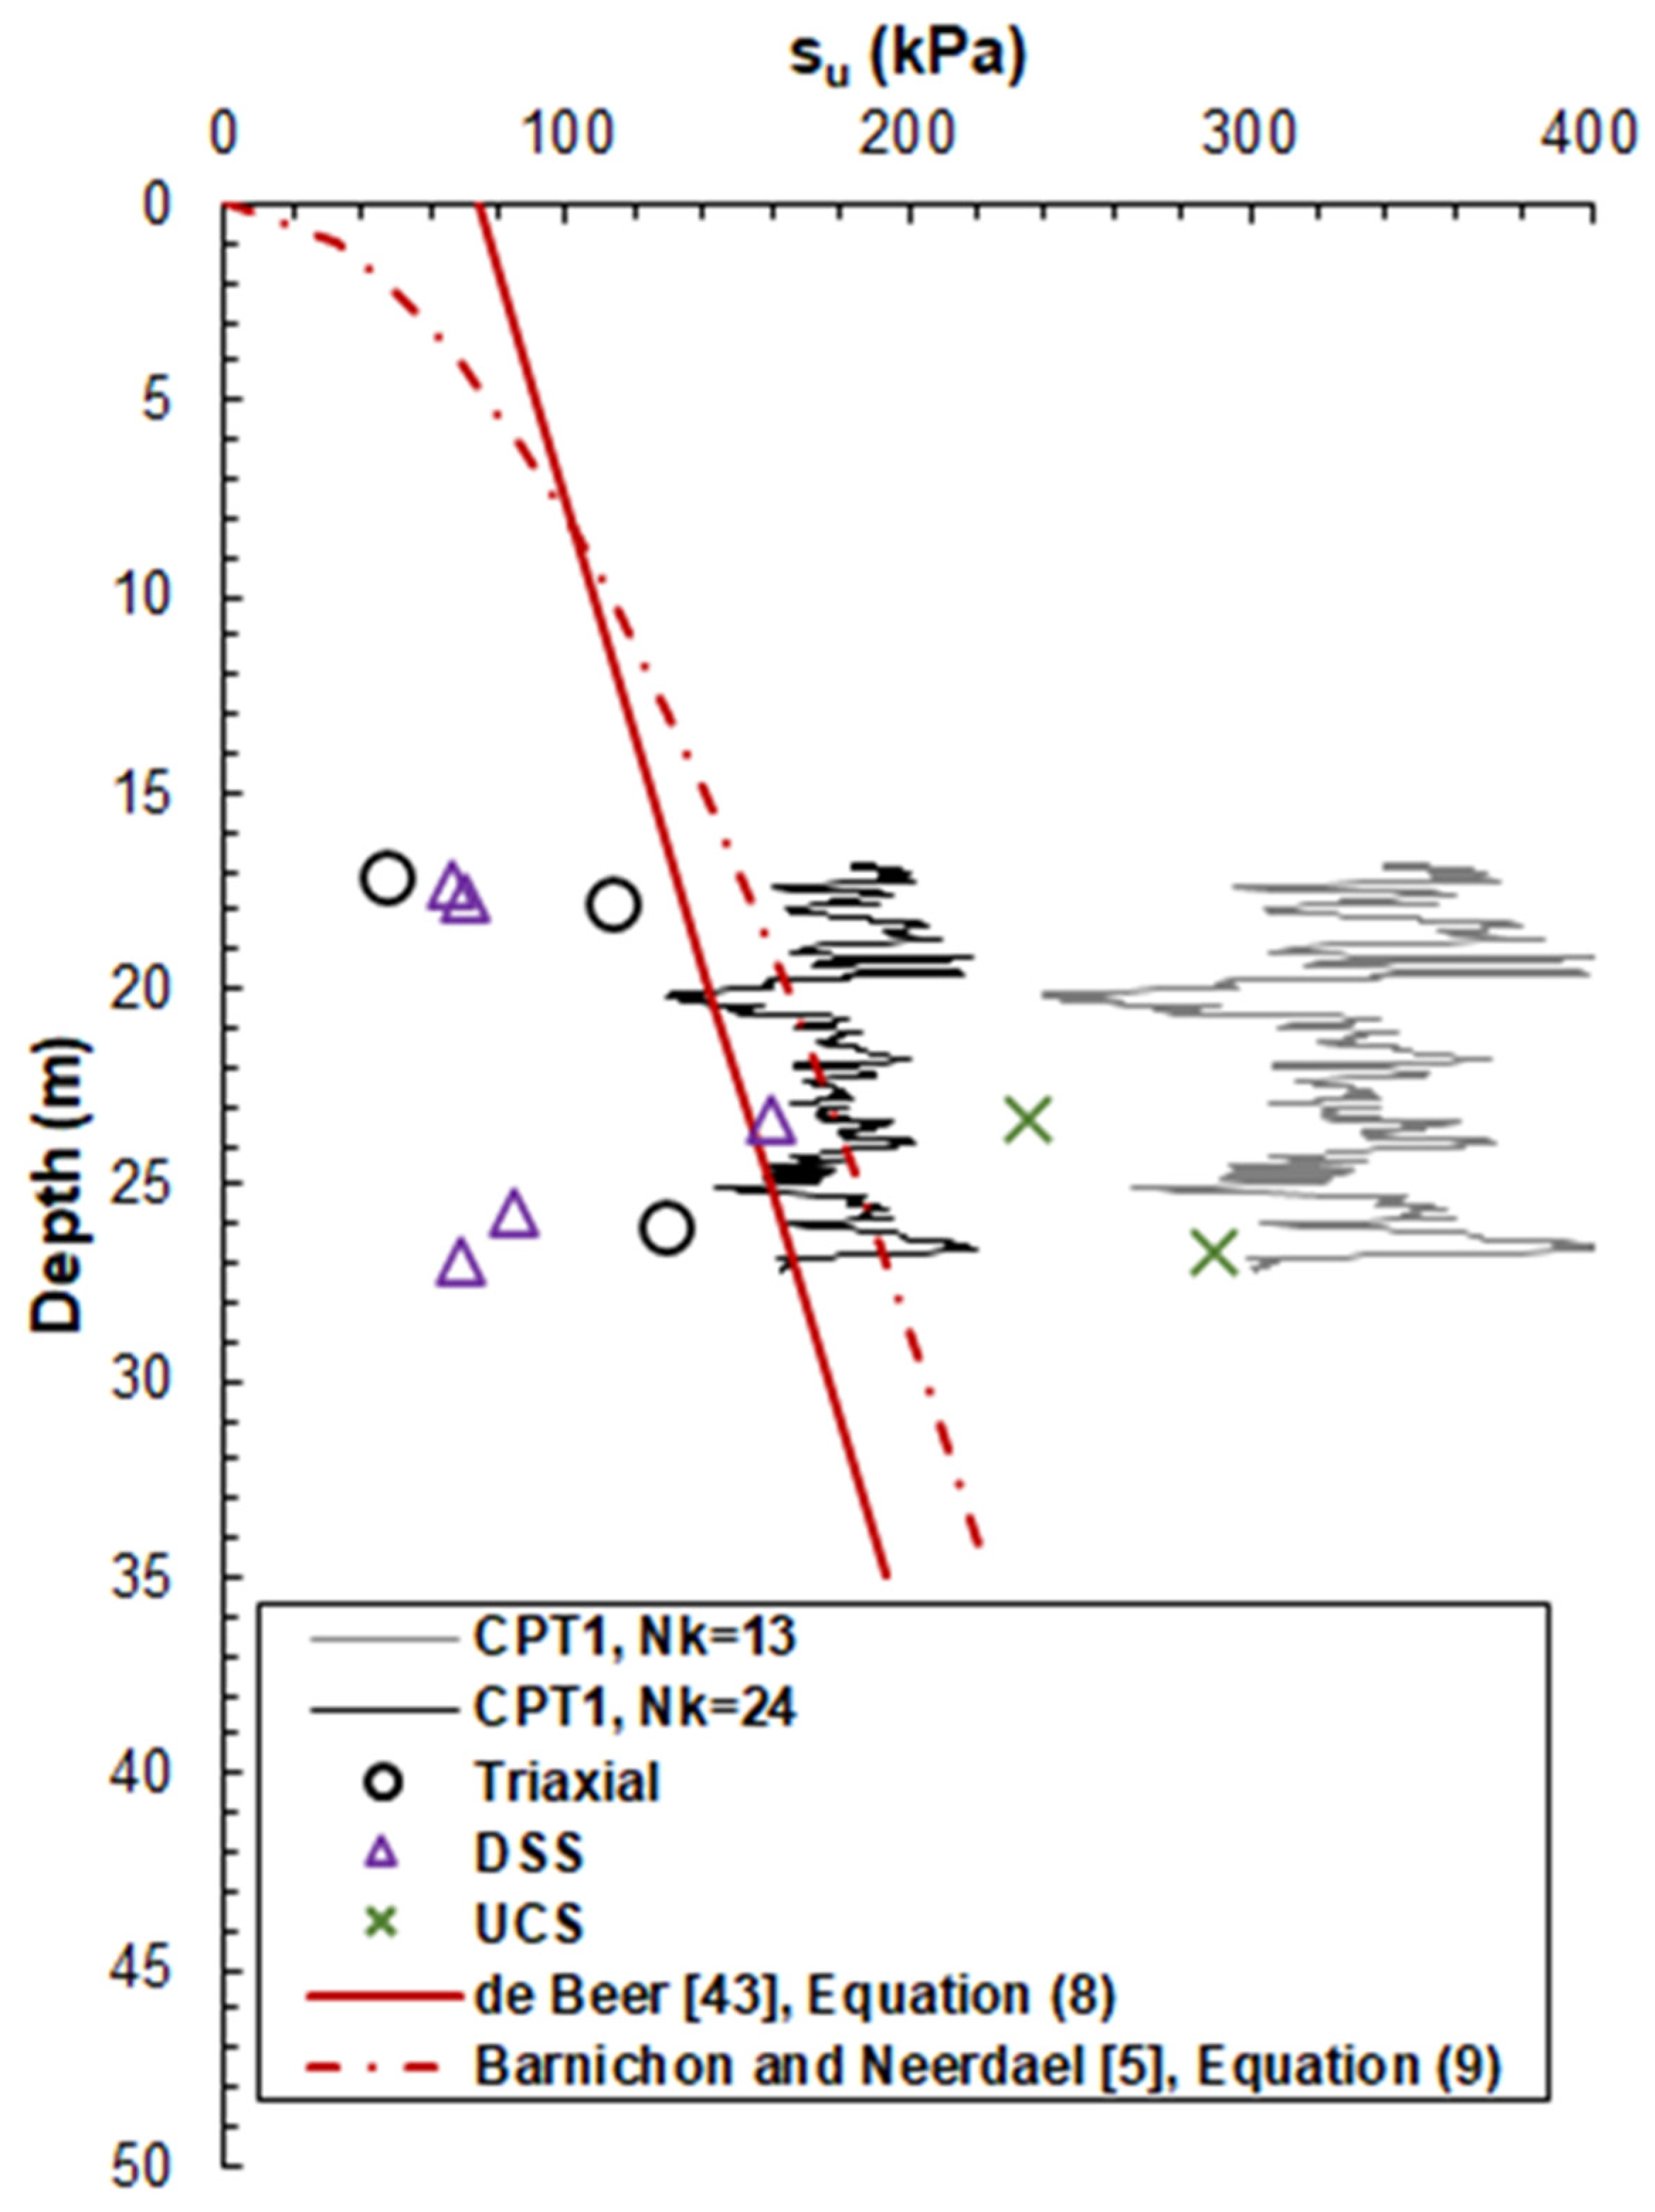
5. Undrained Shear Strength Profile

The undrained shear strength profile at the investigated area is illustrated in Figure 14. In this figure, the combined undrained shear strength data from CPT, triaxial, direct simple shear and unconfined compression strength, UCS, tests are plotted against the depth below ground level. For the CPTs, it is common practice to link the net cone resistance, qnet, with the undrained shear strength, su, through a so-called cone factor, Nk [20]:
s u = q n e t N k
The typical values of Nk for Boom clay reported in the literature are in the range of 13–24. These Nk values were applied in Equation (8) to determine the undrained shear strength for CPT1 given in Figure 14. In order to keep this figure clear, only the s u profile for CPT1 is plotted. As can be seen in Figure 2, all available CPTs show similar results. For the UCS tests, the undrained shear strength is taken to be equal to one-half of the unconfined compressive strength [46].
De Beer [43] determined the undrained shear strength of Boom clay samples from Antwerp by performing a large number of unconfined compression tests and unconsolidated undrained triaxial tests. According to De Beer [43] for Boom clay samples with a depth ranging from 0 to 50 m below the soil surface, the undrained shear strength, s u , linearly increases with depth as follows:
s u = 0.75 + 0.035 z
Barnichon and Neerdael [5] compiled the results of De Beer [43] with the results of consolidated undrained triaxial tests on Boom clay samples at the Mol site taken from higher depths (180 to 250 m). Barnichon and Neerdael [5] concluded that the evolution of undrained shear strength with depth is better described with a non-linear relation:
s u = 0.3272 z 0.5464
In Equations (9) and (10), s u is given in bars, and z is the depth below the soil surface in meters. For comparison purposes, the proposed depth-dependent s u relationships for Antwerp and Mol Boom clay are also shown in Figure 14.
It can be observed that the s u profiles determined from Equations (9) and (10) are in relatively good agreement with the undrained shear strength determined from the CPT data and for a cone factor of Nk = 24. On the other hand, the resulting set of s u values from the triaxial and DSS tests displays a scatter, while these values are overall much lower than the undrained shear strength expected based on the CPT data, even for the highest Nk value used. On the contrary, the s u values from the UCS tests align better with the undrained shear strength expectations of the CPTs.

6. Discussion

Based on CPT data, the Boom clay examined in this paper is classified as a very stiff to hard clay with an undrained shear strength, s u , in the order of 200–350 kPa for Nk values of 24 and 13, respectively. On the other hand, the laboratory triaxial and DSS test results show a clay with an s u of 50–160 kPa. In fact, in order to match the triaxial and DSS s u values, a cone factor of about Nk = 40 is required, which seems to be an unrealistically high value. Opposite to these results, the undrained shear strength from UCS tests is a factor of 2.5–3.0 times higher than the undrained shear strength measured in triaxial testing. It should be stressed that the samples used in the UCS tests were not saturated prior to shearing, as was the case for the triaxial samples. As proven in this study, the Boom clay samples build up suction as a result of stress release during extraction. It is possible that the generated suction desaturates the sample, affecting the soil’s response to shearing [47,48,49]. It is generally acknowledged that the undrained shear strength increases as the degree of saturation becomes lower [50,51].
In the comparison between field and laboratory responses, the impact of sample disturbance can be important. It is known after all that very stiff clays present challenges in obtaining quality undisturbed samples. Most of the sample disturbance is believed to be caused by the discontinuous structure (presence of fractures) and stress release [52]. The X-ray tomography scans performed in this study showed the occurrence of cracks on the tested Boom clay samples. It is difficult to distinguish between whether these cracks are naturally occurring cracks or cracks produced by sampling and/or sample handling. It is also not clear to what extent the presence and orientation of pre-existing discontinuities affect the stress–strain response of the samples to shearing and the development of failure patterns. Nevertheless, the presence of these fractures on the intact samples brings concerns regarding the degree of disturbance during sampling. As highlighted by Bésuelle et al. [13], prior-to-testing cracks on block samples of Boom clay raise fundamental questions about the relationship between the parameters measured in the laboratory and those that fit with in situ data.
The results of this study show that when experimental testing involves very stiff clays, as is the case with Boom clay, the assessment of engineering properties can be challenging. Extra attention should be given to the microstructural state of the sample prior to testing and the adoption of procedures appropriate for testing a material that has suction forces and strong swelling tendencies.

7. Conclusions

In the present work, the mechanical behaviour of Boom clay from Antwerp at a depth of 16.5 to 28 m was investigated by performing in situ and laboratory tests. The measured values of net cone resistance and the friction ratio were about 4 MPa and 5.5%, respectively. Despite their relatively shallow depth, the extracted samples showed swelling tendencies. The magnitude of the swelling pressure was found to be strongly dependent on the measurement method adopted and can be as high as 1.2–1.8 times the in situ mean effective stress. For the tested samples, the release of swelling pressure resulted in a volumetric strain of 4–7%. This result signifies the importance of taking precautions before placing the samples in contact with water. The compression properties of the tested Boom clay samples as determined from the constant rate of strain tests were in good agreement with the properties of other Boom clays at different testing sites for an applied vertical effective stress up to 3.2 MPa. A large scatter was observed on the undrained shear strength values of the Boom clay samples measured via triaxial, direct simple shear and unconfined compression strength tests, while there was a mismatch between these values and those obtained from CPT correlations. X-ray tomography scans of the samples before testing revealed the presence of fractures that were not observable by the naked eye, a finding whose repercussions should be considered in the interpretation of the experimental results.
The discrepancy between the undrained shear strength values obtained from CPTs and those measured by triaxial and DSS tests raises concerns about the validity of the ex situ laboratory tests and the ability to obtain high-quality undisturbed soil samples. This highlights the importance of an integrated site investigation that places great emphasis on in situ testing for obtaining soil parameters and defining strength profiles. For laboratory tests, X-ray tomography can be a useful tool for evaluating sample quality prior to testing.

Author Contributions

Conceptualization, M.K.; Methodology, M.K. and E.A.A.; Investigation, M.K. and E.A.A.; Writing—original draft, M.K.; Writing—review & editing, E.A.A., C.Z., C.C., A.P.d.S. and C.J.W.v.V.; Project administration, E.A.A. All authors have read and agreed to the published version of the manuscript.

Funding

This research was part of the joint industry project “Silent Installation of MonoPiLEs, part 2” (SIMPLE II) and received funding from the Netherlands Enterprise Agency (Dutch: Rijksdienst voor Ondernemend Nederland, RVO), under grant number HER+-00398666.

Data Availability Statement

The data presented in this study are available on request from the corresponding author due to privacy restrictions.

Conflicts of Interest

The authors declare no conflict of interest.

References

  1. Bernier, F.; Volckaert, G.; Alonso, E.; Villar, M. Suction-controlled experiments on Boom clay. Eng. Geol. 1997, 47, 325–338. [Google Scholar]
  2. Mendoza, R.C. Determination of Lateral Stresses in Boom Clay Using a Lateral Stress Oedometer. Master’s Thesis, International Institute for Geo-Information Science and Earth Observation, Enschede, The Netherlands, 2004. [Google Scholar]
  3. ONDRAF/NIRAS. SAFIR 2—Safety Assessment and Feasibility Interim Report 2. Brussels, Belgium: Belgian Agency for Radioactive Waste and Enriched Fissile Materials, Dec. 2001a, NIROND 2001-06 E.
  4. Steen, B.; van de Vervoort, A. Mine Design in Clay, CORA Project TRUCK-I; Leuven, Belgium: Karholieke Universiteit Leuven. August 2008. Available online: https://www.covra.nl/app/uploads/2022/03/CORA-17-Mine-Design-in-Clay-TRUCK-I.pdf (accessed on 22 March 2025).
  5. Barnichon, J.D.; Neerdael, B.; Grupa, J.; Vervoort, A. Cora Project Truckii. Technical Report; Waste & Disposal Department SCK·CEN: Mol, Belgium, 2000; Available online: https://www.covra.nl/app/uploads/2019/08/CORA-18-Terughaalbare-opslag-op-diepte-van-500m-in-de-Boomse-kleiformatie-TRUCK-II.pdf (accessed on 20 December 2024).
  6. Vardon, P.; Buragohain, P.; Hicks, M.; Hart, J.; Fokker, P.A.; Graham, C. Technical Feasibility of a Dutch Radioactive Waste Repository in Boom Clay: Thermo-Hydro-Mechanical Behaviour; Delft University of Technology: Delft, The Netherlands, 2017; OPERA-PU-TUD321c. [Google Scholar]
  7. Horseman, S.T.; Winter, M.G.; Entwistle, D.C. Geotechnical Characterisation of Boom Clay in Relation to the Disposal of Radioactive Waste: Final Report; EUR 10987; Commission of the European Communities: Luxembourg, 1987. [Google Scholar]
  8. Baldi, G.; Hueckel, T.; Peano, A.; Pellegrini, R. Developments in Modelling of Thermo-Hydro-Geomechanical Behaviour of Boom Clay and Clay-Based Buffer Materials: Final Report; EUR 13365 EN; Commission of the European Communities: Luxembourg, 1991. [Google Scholar]
  9. Coll, C. Endommagement des roches Argileuses et Perméabilité Induite au Voisinage D’ouvrages Souterrains. Ph.D. Thesis, Université Grenoble I, Saint-Martin-d’Hères, France, 2005. [Google Scholar]
  10. Bernier, F.; Li, X.L.; Bastiaens, W. Twenty-five years’ geotechnical observation and testing in the Tertiary Boom clay formation. Géotechnique 2007, 57, 229–237. [Google Scholar]
  11. Cui, Y.J.; Le, T.T.; Tang, A.M.; Delage, P.; Li, X.L. Investigating the time dependent behaviour of Boom clay under thermo-mechanical loading. Géotechnique 2009, 59, 319–329. [Google Scholar]
  12. Yu, H.D.; Chen, W.Z.; Jia, S.P.; Cao, J.J.; Li, X.L. Experimental study on the hydro-mechanical behaviour of Boom clay. Int. J. Rock Mech. Min. Sci. 2012, 53, 59–165. [Google Scholar]
  13. Bésuelle, P.; Viggiani, G.; Desrues, J.; Coll, C.; Charrier, P. A laboratory experimental study of the hydromechanical behaviour of Boom clay. Rock Mech. Rock Eng. 2014, 47, 143–155. [Google Scholar]
  14. Wemaere, I.; Marivoet, J.; Labat, S. Hydraulic conductivity variability of the Boom Clay in north-east Belgium based on four core drilled boreholes. Phys. Chem. Earth 2008, 33, 24–36. [Google Scholar]
  15. Hass, H.R.; Klaff, J.; Seidel, H.W. Use of brine freezing for the construction of the traverse galleries. In Ground Freezing 2000—Frost Action in Soils; Thimus, J.F., Ed.; CRC Press: Louvain-la-Neuve, Belgium, 2000; pp. 289–294. [Google Scholar]
  16. Rijkers, R.; Hemmen, B.; Naaktgeboren, M.; Weigl, H. In situ frost heave loads in artificially frozen ground for tunneling. In Proceedings of the International Tunnel Association, Sydney, Australia, 2–6 March 2002. [Google Scholar]
  17. Milioritsas, M. Geotechnical Modelling of a Deep Tunnel Excavation in the Boom Clay Formation. Master’s Thesis, Department of Civil Engineering and Geosciences, Delft University of Technology, Delft, The Netherlands, 2014. [Google Scholar]
  18. Wiseall, A.; Graham, C.; Zihms, S.; Harrington, J.; Cuss, R.; Gregory, S.; Shaw, R. Properties and Behaviour of the Boom Clay Formation Within a Dutch Repository Concept; OPERA: Vlissingen, The Netherlands, 2015; OPERA-PU-BGS615. [Google Scholar]
  19. Deng, Y.F.; Tang, A.M.; Cui, Y.J.; Nguyen, X.P.; Li, X.L.; Wouters, L. Laboratory hydro-mechanical characterization of Boom clay at Essen and Mol. Phys. Chem. Earth 2011, 36, 1878–1890. [Google Scholar]
  20. Lunne, T.; Robertson, P.K.; Powell, J.J.M. The Cone Penetration Test in Geotechnical Practice; EF Spon/Blackie Academic, Routledge Publishing: New York, NY, USA, 1997; p. 64. [Google Scholar]
  21. Thompson, R.W.; Perko, H.A.; Rethamel, W.D. Comparison of constant volume swell pressure and oedometer load-back pressure. In Proceedings of the 4th International Conference on Unsaturated Soils, Carefree, AZ, USA, 2–6 April 2006. [Google Scholar]
  22. Okkels, N.; Hansen, P.B. Swell pressure and yield stresses in Danish, highly over-consolidated, Palaeogene clays of extreme plasticity. In Proceedings of the 17th Nordic Geotechnical Meeting, Challenges in Nordic Geotechnic, Reykjavik, Iceland, 25–28 May 2016. [Google Scholar]
  23. D4546; Standard Test Methods for One-Dimensional Swell or Collapse of Soils. ASTM: West Conshohocken, PA, USA, 2021.
  24. D4186; Standard Test Method for One-Dimensional Consolidation Properties of Saturated Cohesive Soils Using Controlled-Strain Loading. ASTM: West Conshohocken, PA, USA, 2006.
  25. ISO 17892-9; Geotechnical Investigation and Testing—Laboratory Testing of Soil—Part 9: Consolidated Triaxial Compression Tests on Water Saturated Soils. ISO: Geneva, Switzerland, 2018.
  26. D6528; Standard Test Method for Consolidated Undrained Direct Simple Shear Testing of Fine Grain Soils. ASTM: West Conshohocken, PA, USA, 2017.
  27. D2166; Standard Test Method for Unconfined Compressive Strength of Cohesive Soil. ASTM: West Conshohocken, PA, USA, 2016.
  28. Belanteur, N.; Tacherifet, S.; Pakzad, M. Etude des comportements mecanique, thermo-mecanique et hydro-mecanique des argiles gonflantes et non gonflantes fortement compactees. Rev. Fr. De Géotechnique 1997, 78, 31–50. [Google Scholar]
  29. Dehandschotter, B.; Vandycke, S.; Sintubin, M.; Vandenberghe, N.; Wouters, L. Brittle fractures and ductile shear bands in agrillaceous sediments: Inferences from Oligocen Boom Clay (Belgium). J. Struct. Geol. 2004, 27, 1095–1112. [Google Scholar]
  30. Skempton, A.W.; Sowa, V.A. The behaviour of saturated clays during sampling and testing. Géotechnique 1963, 13, 269–290. [Google Scholar]
  31. Bishop, A.W.; Kumapley, N.K.; El Ruwayih, A. The influence of pore water tension on the strength of a clay. Proc. R. Soc. Lond. 1974, 1286, 511–554. [Google Scholar]
  32. Doran, I.G.; Sivakumar, V.; Graham, J.; Johnson, A. Estimation of in-situ stresses using anisotropic elasticity and suction measurements. Géotechnique 2001, 50, 189–196. [Google Scholar]
  33. Horseman, S.T.; Winter, M.G.; Entwistle, D.C. Triaxial experiments on Boom clay. In The Engineering Geology of Weak Rock; CRC Press: Rotterdam, The Netherlands, 1993; pp. 36–43. [Google Scholar]
  34. Sultan, N. Etude Du Comportement Thermo-Mécanique De l’argile De Boom: Expériences Et Modélisation. Ph.D. Thesis, Ecole Nationale des Ponts et Chaussées, Paris, France, 1997. [Google Scholar]
  35. Berre, T. Triaxial testing at the Norwegian Geotechnical Institute. Geotech. Test. J. 1982, 5, 3–17. [Google Scholar]
  36. Henrion, P.N.; Monsecour, M.; Fonteyne, A.; Hermans, N.; Manfroy, P.; Neerdael, B.; de Bruyn, D. Characterisation of the Boom Clay, Semi-Annual Report 18; Contract WAS-334-83-7-B(RS); R&D Programme on Radioactive Disposal into Geological Formation (Study of a Clay Formation); SCK CEN: Mol, Belgium, 1984. [Google Scholar]
  37. Reiffsteck, P.; Szymkiewicz, F.; Fanelli, S. Comparison of the measurement of swelling pressure through different tests. In Proceedings of the XVII European Conference on Soil Mechanics and Geotechnical Engineering, Reykjavik, Iceland, 1–7 September 2019. [Google Scholar]
  38. Nagaraj, H.B.; Munnas, M.M.; Shridharan, A. Critical evaluation of determining swelling pressure by swell-load method and constant volume method. Geotech. Test. J. 2009, 32, 305–314. [Google Scholar]
  39. Graham, J.; Kwok, C.K.; Ambroise, R.W. Stress release, undrained storage, and reconsolidation in simulated underwater clay. Can. Geotech. J. 1987, 24, 279–288. [Google Scholar]
  40. Delage, P.; Le, T.T.; Tang, A.M.; Cui, Y.J.; Li, X.L. Suction effects in deep Boom clay block samples. Géotechnique 2007, 57, 239–244. [Google Scholar]
  41. Casagrande, A. The Determination of the Pre-Consolidation Load and Its Practical Significance. In Proceedings of the 1st International Conference on Soil Mechanics and Foundation Engineering, Cambridge, MA, USA, 22–26 June 1936. [Google Scholar]
  42. Sorensen, K.K.; Okkels, N. Correlation between compression index and index parameters for high plasticity Paleogene clays. In Proceedings of the XVI European Conference on Soil Mechanics and Geotechnical Engineering, Edinburgh, Scotland, 13–17 September 2015. [Google Scholar]
  43. de Beer, E. Shear strength characteristics of the ‘Boom clay’. Proc. Geotech. Conf. Oslo 1967, 1, 83–88. [Google Scholar]
  44. Schittekat, J.; Henriet, J.P.; Vandenberghe, N. Geology and geotechnique of the Scheldt Surge Barrier, characteristics of an overconsolidated clay. In Proceedings of the 8th International Harbour Congress, Antwerp, Belgium, 13–17 June 1983. [Google Scholar]
  45. Dyvik, R.; Berre, T.; Lacasse, S.; Raadim, B. Comparison of truly undrained and constant volume direct simple shear tests. Géotechnique 1987, 37, 3–10. [Google Scholar]
  46. Widodo, S.; Ibrahim, A.M.; Hong, S. Analysis of different equations of undrained shear strength estimations using Atterberg limits on Pontianak soft clay. Chall. Mod. Technol. 2012, 3, 46–50. [Google Scholar]
  47. Cui, Y.J.; Delage, P. Yielding and plastic behaviour of an unsaturated silt. Géotechnique 1996, 46, 291–311. [Google Scholar] [CrossRef]
  48. Uchaipichat, A. Effect of suction on unconfined compressive strength of clayey soils with different sand contents. ARPN J. Eng. Appl. Sci. 2014, 9, 881–884. [Google Scholar]
  49. Zhang, F.; Cui, Y.; Zeng, L.; Robinet, J.C.; Conil, L.; Talandier, J. Effect of degree of saturation on the unconfined compressive strength of natural stiff clays with consideration of air entry valve. Eng. Geol. 2018, 237, 140–148. [Google Scholar] [CrossRef]
  50. Nakata, Y.; Tashita, T.; Chibana, H.; Matsukata, K. Effect of drainage and saturation on undrained shear strength for compacted sandy soils. E3S Web Conf. 2019, 92, 07003. [Google Scholar] [CrossRef]
  51. Briaud, J.L. Geotechnical Engineering: Unsaturated and Saturated Soils; John Wiley & Sons, Inc.: Hoboken, NJ, USA, 2013. [Google Scholar]
  52. McManis, K.; Lourie, D.E. Issues and techniques for sampling overconsolidated clays. In Transportation Research Record 1479; National Academy Press: Washington, DC, USA, 1995. [Google Scholar]
Figure 1. (a) The Boom clay formation in Belgium, with its depth and thickness (after ONDRAF/NIRAS [3]). The location of the test site and (b) CPT location (source: www.OpenStreetMap.org).
Geotechnics 05 00023 g001
Figure 2. Cone penetration test (CPT) data. Profile of (a) corrected cone tip resistance, qnet; (b) corrected friction ratio, Rft; and (c) pore pressure.
Geotechnics 05 00023 g002
Figure 3. The in-depth distribution of the following: (a) bulk unit weight, γ, and (b) water content, Wc; liquid limit, WL; and plastic limit, WP, for the tested Boom clay.
Geotechnics 05 00023 g003
Figure 4. The development of volumetric strain, εv, with the following: (a) vertical effective stress, σv′, and (b) time from the start of testing. Constant load (CL) swell tests on Boom clay samples.
Geotechnics 05 00023 g004
Figure 5. The development of vertical effective stress, σv′, with time from the start of testing. Constant volume (CV) swell tests on Boom clay samples. In parentheses is the maximum volumetric strain, εz,max, recorded during testing.
Geotechnics 05 00023 g005
Figure 6. In-depth distribution of measured and predicted swelling pressure for tested Boom clay samples.
Geotechnics 05 00023 g006
Figure 7. CRS tests on Boom clay samples. Effective vertical stress, σv′, against axial strain, εz.
Geotechnics 05 00023 g007
Figure 8. Undrained triaxial compression tests on Boom clay samples: (a) effective stress paths; (b) stress–strain curves; (c) excess pore water pressure, Δu, against axial strain curves; (d) principal stress ratio, σ1′/σ3′, against axial strain; (eg) deformation pattern of Boom clay samples after testing.
Geotechnics 05 00023 g008
Figure 9. Failure envelopes in p′—q plane for intact Boom clay at Mol and Essen [19].
Geotechnics 05 00023 g009
Figure 10. Static DSS tests on Boom clay: (a) effective shear stress paths and (b) stress–strain curves.
Geotechnics 05 00023 g010
Figure 11. Three-dimensional reconstruction images of the surface of the Boom clay samples: (a,d) prior to and (c,f) after UCS testing; (b,e) the 3D reconstruction of the inclusions inside the samples. X-ray μCT scans on samples UCS_1 and UCS_2.
Geotechnics 05 00023 g011
Figure 12. X-ray μCT vertical sections of sample UCS_1 before and after UCS testing. The arrows show discontinuities on the intact and sheared sample.
Geotechnics 05 00023 g012
Figure 13. X-ray μCT vertical sections of sample UCS2 before and after UCS testing. The arrows show discontinuities on the intact and sheared sample.
Geotechnics 05 00023 g013
Figure 14. The undrained shear strength profile of Boom clay from 16.5 to 27 m below ground level based on CPT, triaxial, DSS and UCS test data and relations reported in the literature [5,43].
Geotechnics 05 00023 g014
Table 1. Sample characteristics.
TestBoringDepthWcγσviσvcσhcσs
(m)(%)(kN/m3)(kPa)(kPa)(kPa)(kPa)
ACU_1BH317.821.220.11301306568.3
ACU_2BH117.223.518.8120120600
ACU_3BH126.026.319.1210210105125
DSS_1BH317.72019.3130130--
DSS_2BH325.733.118.7210210--
DSS_3BH117.326.718.5120120--
DSS_4BH123.325.719.1180180--
DSS_5BH226.736.417.8220220--
CL_1BH123.526.119.7180---
CL_2BH226.830.918.7220--205
CL_3BH223.526.419.4190--230
CV/CRS_1BH123.326.419.5180--75
CV/CRS_2BH223.925.115.7190--73
CV/CRS_3BH223.624.814.7190--98
UCS_1BH123.325.918.8180---
UCS_2BH226.731.218.7220---
Note: ACU, DSS, CL, CV, CRS and UCS tests refer to anisotropically consolidated undrained triaxial, direct simple shear, constant load, constant volume, constant rate of strain and unconfined compressive strength tests, respectively. Wc is the water content prior to testing; γ is the bulk unit weight prior to testing; σvi′ is the in situ effective vertical stress; σvc′ and σhc′ are the effective vertical and horizontal stress at the end of consolidation, respectively; σs′ is the swelling pressure.
Table 2. Index properties of Boom clay.
PropertyFrom the Literature *Present Study
Water content, Wc (%)20–3020–40
Unit weight, γ (kN/m3)-17.8–20.1
Plastic limit, Wp (%)22–2919–28
Liquid limit, WL (%)55–8056–80
* Refs [1,7,10,13,28,29].
Table 3. Compressibility parameters.
TestBoringDepthCcCsCασp
(m)(-)(-)(-)(kPa)
CRS_1BH123.30.1100.0230.0017283
CRS_2BH223.90.1300.0190.0015440
CRS_3BH223.60.1300.0180.0025315
Note: Cc is the normal compression index, Cs is the swelling index during unloading from step A to B, Cα is the secondary compression index and σp′ is the preconsolidation stress.
Disclaimer/Publisher’s Note: The statements, opinions and data contained in all publications are solely those of the individual author(s) and contributor(s) and not of MDPI and/or the editor(s). MDPI and/or the editor(s) disclaim responsibility for any injury to people or property resulting from any ideas, methods, instructions or products referred to in the content.

