Article

Exploring Soil–Water Characteristic Curves in Transitional Oil Sands Tailings

1
Department of Civil and Environmental Engineering, University of Alberta, Edmonton, AB T6G1H9, Canada
2
Centre for Oil Sands Sustainability, Northern Alberta Institute of Technology (NAIT), Edmonton, AB T5G 0Y2, Canada
*
Author to whom correspondence should be addressed.
Geotechnics 2024, 4(4), 1106-1123; https://doi.org/10.3390/geotechnics4040056
Submission received: 28 August 2024 / Revised: 9 October 2024 / Accepted: 15 October 2024 / Published: 18 October 2024

Abstract

Soil–water characteristics curves (SWCC) have proved useful in estimating parameters used in modeling unsaturated geotechnical properties of soils including permeability and strength. Either saturation, gravimetric, and instantaneous and initial volumetric water content designation can be used to develop SWCCs. Studies have shown that any of the designations will give good estimates for soils that do not undergo volume change with suction change whereas, for soils that undergo substantial volume change, only saturation and instantaneous volumetric water content designation obtained by incorporating shrinkage curves can give correct estimates. Transition oil sands tailings have fines content that cannot be categorized as sandy or fine materials, and research on volume change with suction change in these materials is limited. In this study, HyProps, Tempe cells, and a chilled-mirror water potential meter were used to measure suction and corresponding water contents for samples that were prepared by mixing coarse sand and Fluid Tailing by ratios that mimic transition zone tailings. Shrinkage tests were also performed to observe the extent of volume change with suction increase. Air Entry Values (AEV) estimated from SWCCs based on gravimetric water content were found to be lower than those estimated from saturation-based SWCCs due to substantial volume changes in these materials with suction increase. The use of saturation water content designation is recommended in estimating AEV for transitional oil sands tailings. This is useful information in predicting the long term unsaturated geotechnical behavior of these materials for environmental management and safety purposes.

1. Introduction

Canada is the fourth largest oil producer in the world with about 167 billion of oil barrels that can be recovered economically, with the technology and economic conditions existing today, and oil sands hosting 97% of Canada’s proven oil reserves [1]. About 20% of the Alberta Oil Sands reserves can be recovered using trucks and shovels to excavate and transport oil sands to plants where bitumen is separated and recovered from sand using hot water extraction and froth treatment [1,2].
The process of recovering bitumen from sand results in by-products known as tailings which are mixtures containing water, residual bitumen, silts, clay, trace metals, salts, and other hydrocarbons. In the process of recovering bitumen, about 0.25 m3 of tailings and 1 m3 of sand are generated for every single barrel of bitumen produced [3]. In the process of tailings deposition in containing dykes, sand segregates and deposits form beaches adjacent to dykes and the remaining slurry is deposited at the center of the pond as Fluid Tailings (FT).
Containing fines dominated by clay minerals, mostly illite and kaolinite as well as illite-smectite mixed layers [4], FTs are highly dispersed and take exceptionally long to dewater and consolidate and without mediations this can take decades to settle and gain the desired strength. This has led to the increase in the total volume of FT in the Athabasca oil sands region, which has reached 1392 million cubic metres (Mm3) in 2022 [2]. As per Directive 85, fluid tailings (FT) refer to any fluid waste coming from bitumen extraction facilities with more than 5% suspended solids by mass and undrained shear strength less than 5 kPa [2]. These must be managed to meet both closure and regulatory requirements.
Soil–water Characteristic Curve (SWCC) shows the relationship between the amount of water retained in the soil and the corresponding soil water potential known as matric suction. In studying unsaturated soil properties of soils, SWCC is a useful tool to calculate, as it provides the key parameters needed to implement unsaturated soil mechanics in geotechnical engineering practices [5]. Unsaturated soil property functions to be used in modeling geotechnical engineering scenarios are well estimated by SWCC.
To quantify water retained in soils when developing SWCC, any of the following water content designations and respective Equations (1)–(4) with variables as defined in Figure 1 can be used:
  • Gravimetric water content which is the ratio of mass of water (Mw) to mass of solids (Ms) as in Equation (1)
w = M w M s × 100 %
  • Degree of saturation which refers to the percentage ratio of volume of water (Vw) to instantaneous volume of voids (Vv) as in Equation (2)
S = V W V w + V a × 100 % = V W V v × 100 %
  • Volumetric water content defined as the ratio of volume of water (Vw) to the initial total soil volume (V) shown in Equation (3)
θ = V w V   × 100 %
  • Instantaneous volumetric water content relating the volume of water in the soil to instantaneous volume of soil as shown in Equation (4)
θ i = V w V i × 100 %
From water content designations Equations (1)–(4), it can be deduced that gravimetric water content is not affected by volume change; whereas, both saturation and instantaneous volumetric water content designation are affected by volume change. The most common water content designation used in geotechnical engineering is gravimetric water content. This is also the easiest to measure since it does not involve soil volume measurement at different suctions, which can be difficult to perform considering the design of the laboratory equipment used to measure soil suctions. Instantaneous volumetric water content and degree of saturation designations require measurements of the soil volume corresponding to each suction as they are referenced to instantaneous volume at each suction to account for volume changes. Volumetric water content designation holds the least significance in unsaturated soil mechanics unless the soil under study has shown a no volume change condition.
Soil–water characteristics curves based on any of the four designations of water content in soils are the same when there is a negligible volume change with suction increase [5]. Contrarily, for soils that experience a high volume change with an increase in suction, studies have shown that Air Entry Values (AEV) estimated from gravimetric water content designation will tend to give wrong and underestimated AEV. As the volume change effect will not be accounted for, most correct values are estimated from SWCC using the degree of saturation and instantaneous volumetric water contents designations [5,6,7,8].
Previous studies have shown the profound influence of fines content on the compressibility of soils; a study by Watabe et al. [9] on sand mixture with dredged clay with 30.7 plasticity index showed an increase in compressibility with fines (<75 µm particle size), increasing from 30% to 95% while remaining incompressible when fines content is less than 30%. Also, a study by Cabalar and Hasan [10] on sand-clay mixtures constituting different sands and the same clay type concluded that the compressibility of samples increased with fines content (<75 µm particle size), from 0% to 30%. However, the same study revealed variations in compressibility depend on pore fluid properties, and sand particle size and shape, even at the same fine contents of mixtures. Contrarily, a study by Carrera et al. [11] on sand and fines (9.4% plasticity index) mixtures shows a decrease in compressibility with fines increasing from 0% to 50%, a trend seeming to regress beyond that point. Also, a study by Li and Coop [12] on iron ore tailings, containing non-plastic fines fractions varying from 15% to 91%, noted a gradual decrease in compressibility with fines increase. There are discrepancies between studies on different sand-fine mixtures’ compressibility behavior; the fraction of contained fines can be a determining factor, but the index properties of the fines and the resulting mixtures matter. As stated by Fredlund et al. [5], even fines alone can be compressible or incompressible depending on their stress history, the nature of the clay minerals contained, and the initial water content. It is paramount, therefore, to always characterize study samples for other properties, including Atterberg limits, to arrive at the factors influencing their geotechnical behavior.
Numerous studies have focused on the unsaturated properties of compressible soils. Croney and Coleman [13] carried out research to determine the relationship of soil structure to suction in compressible, incompressible, and semi-compressible materials. Among their findings was that, at any suction below air entry value for compressible materials, the change in moisture content was associated with volume change, whereas a limited volume change was evidenced after air entry value suction. They also concluded that a unique suction–saturation relationship exists for each partially compressible and compressible soil in disturbed conditions.
In a study by Fredlund and Zhang [14], to understand errors in unsaturated soil property functions estimated under the assumption that soils are incompressible, they explained how shrinkage curves can be properly used to describe SWCC laboratory results for compressible soils. Air entry values estimated from SWCC based on Saturation designation were found to be different from those obtained from SWCC based on Gravimetric Water designation. Their recommendation was to use saturation-based SWCC for accurate estimations. A study by Huang et al. [15] confirmed that unsaturated properties, such as air entry values and saturated hydraulic conductivity, are affected by the void ratio, which is a similar finding to that of Fredlund [16] and Fredlund, et al. [5], therefore implying the importance of understanding volume change behavior. Parent et al. [17] studied SWCC and shrinkage curves for Bentonite and Kaolinite clays and concluded that resulting SWCC properties were greatly influenced by the specific surface area, mineralogy, exchangeable sodium percentage, and exchangeable cations available in these clays.
Understanding the scarcity of SWCC models for materials undergoing volume change with suction increase, Mbonimpa et al. [18] produced a suitable model to predict SWCCs of compressible soils by considering void ratio change with suction; this was a modification to the Kovacs model for incompressible soils.
The Unified Oil Sands Tailings Classification System has categorized oil sands tailings deposits into four major groups, namely, Sand, Sandy Fines, Transition, and Fines zones [19]. Tailing deposits in the transition zone are characterized by fines content and sand-fines ratio (SFR) ranging from 25% to 50% and 1 to 3, respectively, whereby fines are defined as solid particles smaller than 44 mµ in size.
Some tailings deposits encountered in oil sands mine sites today fall into the transition zone; these include some thickened tailings (TT) [20,21], composite tailings (CT), and non-segregating tailings (NST), resulting from the co-deposition of sand and FT to avoid segregation and fasten consolidation [20,22]. Volume change behavior and the unsaturated properties of transitional oil sand tailings deposits are difficult to predict, with limited research available today on these materials. They may be too fine to behave as cohesionless and incompressible or too sandy to behave as cohesive and compressible soils, depending on the amount and properties of fines included.
As of the time of conducting this study, the authors were unaware of any research that had investigated SWCC behavior of transitional oil sands tailings. SWCCs are very useful in estimating other unsaturated soil property functions including shear strength and the unsaturated coefficient of permeability functions. The accuracy of the estimated values for these unsaturated property functions will greatly rely on the accuracy of SWCC properties used as inputs in the model.
This paper therefore intends to study the unsaturated behavior of these tailings within the transition zone and determine the appropriate water content designation to be used when developing SWCCs for estimating their unsaturated geotechnical properties. The scope of this study is limited to untreated oil sands tailings in the transitional zone.

2. Materials and Methods

2.1. Materials

Mixtures of Coarse Sand Tailings (CST) and Fluid Tailings (FT) were created to obtain samples with fines contents mimicking oil sands tailings within a transition zone defined by Sand-Fines Ratio (SFR), between 1 and 3. Tailings and sand samples were received in slurry and dry forms, respectively, from different mine sites; the intention behind mixing samples from different sites was to obtain mixtures covering a vast range of compositions representing actual conditions of tailings in oil sands mines. Tailing from different sites could have different properties and composition as they come from different ores of a different nature and/or are employing different froth processes [17], thus leading to differences in tailings’ composition.
Five different mixtures, namely, SM 28–3.0. SM 27–2.3, SM 37–4.8, SM 28–3.6, and SMK 43–1.6 were made. In sample naming, the prefix SM stands for materials constituting Sand and FT, whereas SMK stands for a sample constituting Sand, FT, and Kaolinite (Speswhite China clay). In the following numbers, XX-Y.Y, XX stands for fines content in percentage and Y.Y stands for MBI value. An extra sample was later introduced as a modification of sample, SM 37-4.8, by adding 1% solids of bentonite (Wyoming bentonite) to see the influence of this highly active clay on AEV; this sample was not fully characterized and therefore not used in further analysis.

2.2. Methodology

2.2.1. Samples Preparations

Sample preparations involved the mixing of fluid tailings and sand in predetermined ratios to result in mixture samples with fine contents belonging in a transitional oil sands tailings category. Using a drill mixer, fluid tailings were mixed for homogenization in their original pails before a required amount was scooped, weighed, and moved to a mixing container. Sand was inspected for any debris and removed before weighing the required amount and adding it to the mixing container with fluid tailings. The mixture was homogenized using a drill mixer for 10 min. Every time that a sample was needed from the mixture made, it was ensured to be homogenized first. All mixtures were designed to have solids contents below their segregation lines to avoid any segregation during the test, where resulting fluid tailings–sand mixtures showed higher water contents above segregation lines, a specific resistance to filtration press setup was used to filter out excess water, and the remaining mixture was re-homogenized, ready for subsequent tests. For the sample SMK 43-1.6, which had kaolinite added, deionized water was added to reach the desired sixty percent solids content.

2.2.2. Particle Size Distribution (PSD)

Characterization to determine Particle Size Distribution (PSD), bitumen, and water contents of the received CST and FT was performed to be able to establish mixing ratios that would produce mixtures with predetermined SFR. Sieve measurements were used to determine PSD for solids with a particle size greater than 45 µm, whereas laser diffraction was used to analyze particles less than 45 µm in size. From PSD, fines content was taken as a cumulative percentage of particles <44 µm as defined in the oil sand tailings industry. For clay contents (<2 µm), this was also determined from PSD information as a cumulative percentage of particles <8 µm to account for the platy shape of particles since it was analyzed using laser diffraction [23].

2.2.3. Atterbergy Limits

Atterberg limits tests were performed to determine the plasticity of the samples. Tests were conducted as per ASTM D4318–17 [24]. Liquid limit was determined using a Casagrande device; soil paste was placed in a brass cape and, using the tool, a groove was cut at the center of the sample. A crank was then rotated at a constant speed to lift and drop the cup, the number of blows to close the groove by about 13 mm in distance was recorded and plotted against the sample’s moisture content. A minimum of three tests for the same sample at different moisture contents were performed. Using these data points, a flow line was plotted from which interpolation was performed to determine the moisture content required to be able to close the groove by about 13 mm in 25 blows; this is the moisture content referred to as liquid limit.
Plastic Limit was determined by rolling the soil sample by hand on a glass plate into threads with a uniform diameter of about 3 mm. The threads are rolled until they start to crumble and the moisture content at this point is measured as the plastic limit. All samples were tested in triplicates for reliability; repeatability was observed between results of the same sample.

2.2.4. Methylene Blue Index (MBI)

This is the measure of the amount of methylene blue dye that can be adsorbed by clay, which is a measure for the cation exchange capacity and surface area of clay. Sethi [25] developed a test that is commonly used to measure MBI for oil sands tailings, this was from ASTM modification. Further studies on the use of the method have been conducted by other researchers, including [26,27,28]. The same was used in this study; it involved sample dispersion for homogeneity, removing iron oxide-hydroxide effects to titration by acidifying, and finally titrating the sample with methylene blue to determine the endpoint which is shown by a blue halo. Knowing the volume of methylene blue used to adsorb the sample with a known mass, Equation (5) is used to calculate MBI as milliequivalents of methylene blue needed to adsorb 100 g of sample.
M B I   ( m e q / 100   g ) = M B   v o l u m e   ( m l s ) × M B   N o r m a l i t y M a s s   o f   d r i e d   s a m p l e   ( g ) × 100    

2.2.5. Bitumen Content

Bitumen content was measured using the Dean–Stark extraction method, which involves refluxing toluene through the sample to dissolve bitumen. The sample and solvent containing dissolved bitumen are heated causing the solvent and water to rise as vapor and become trapped by the condenser while leaving solids in the thimble.

2.2.6. Specific Gravity

Complying with ASTM D854–14 [29], a water pycnometer was used to determine specific gravity of all the samples. This involved cleaning, drying, and measuring the mass of the empty pycnometer (M1). The pycnometer was filled with water to a known volume (Vw) of 500 mL and de-aired to remove any trapped air bubbles; the mass of the pycnometer with water (M2) was obtained together with the corresponding temperatures to be used later for mass corrections. All measured values were repeated five times to obtain accurate average values.

2.2.7. Soil Water Characteristics Curves (SWCC)

Various laboratory equipment, as shown in Figure 2, were used to determine data for SWCC. Suctions less than 25 kPa were measured using the HyProp device (Pullman, WA, USA) shown in Figure 2a, which measures the water content–tension relation of soils. The device has two tensiometers with different depths sitting within an 8 cm diameter and a 5 cm height sample ring, these are used to measure matric suction. Both the sensor unit and tension measuring shafts were degassed before the test to ensure the connection between water in soil and degassed water in a porous ceramic tip on the tension shaft. This was achieved using a refill unit as explained in UMS GmbH [30] for at least 24 h. After checking and confirming the functionality of the sensor unit and tension shafts, a sample ring and dirt protector were attached followed by measuring the mass of the assembly. Since all the samples used in this study were in slurry form, they were saturated, thus allowing us to skip the saturation stage of the test. The soil sample was gently poured into the ring to the brim, the assembly with soil sample was set on a balance that was connected to a computer which was set to record the mass of the assembly after every five minutes. Since the sample within the ring is kept open to the atmosphere, sample mass and volume kept diminishing with time due to evaporation. After every five minutes, the HyProp automatically records water tension as the average of the two tension shafts. Knowing the initial mass of the HyProp, the initial mass of the whole assembly, and the initial gravimetric water content for the sample, instantaneous water contents corresponding to respective suctions are back calculated as the sample evaporates and dries. It took 11 to 16 days to complete the test of each sample based on composition; all tests were performed under room temperature averaging 19⁰ C in the lab. The Van Genuchten model [31] was used to fit this set of data, which was later combined with higher suction data from other devices to model the entire SWCC.
Suctions in the range between 25 kPa and 400 kPa were measured using Tempe Cells shown in Figure 2b. These are made of a seven-centimeters (7 cm) high and seven-centimeters (7 cm) diameter plexiglass cylinder mounted on a base holding a high Air Entry Value (AEV) up to 500 kPa ceramic stone. A base plate below the porous stone has a pipe that drains water from the sample in the cylinder. Also, a lid has an inlet tube used to supply air pressure to the sample. Porous stones were submerged in water for at least twenty-four hours to allow them to become fully saturated for accurate fluid flow measurement. About two-thirds of the cell was filled with a homogenized sample whose initial water content was known, this was followed by tightly closing the lid to avoid any air leakage. This was followed by inspecting any bubbles in the pipes, whenever bubbles were found, they were flashed using deionized water that was run from an air purge pipe through the assembly base to the outlet pipe. Air pressure equal to the desired suction is applied to the cell, leading to water release until the plateau is reached. From the principle of axis translation, the value of applied pressure is considered equal to the matric suction value. The mass of the assembly was recorded upon reaching the plateau for later use to back-calculate water content corresponding to respective applied suction. Following the same procedures, air pressure was then increased to subsequent higher suctions until the highest was reached. In this study, 25, 50, 100, 200, 300 and 400 kpa suction intervals were used for Tempe cells. After water release under the highest suction (400 kPa) was complete, the sample was taken out and oven-dried to determine the water content corresponding to this suction. The same water content was used together with the measured weight changes between suctions to back-calculate moisture contents corresponding to each suction. Each test was performed in duplicate to ensure reproductivity and reliability. Mean values were finally taken after rejecting any anomalies. It took between five and nine days for each sample to complete dewatering under one specific suction.
Higher suctions above 500 kPa were measured using a chilled-mirror water potential meter with built-in internal temperature control, WP4-T, shown in Figure 2c. It is automatic, easy to use, and capable of providing direct readings within five minutes. The device has proved reliable in determining high total suction up to 300,000 kPa [32]. It comprises a sealed chamber featuring an infrared thermometer, photoelectric cell, mirror, and a fan. Temperature difference is of major concern when using this device because temperature influences water potential, so to accommodate that, the WP4-T model that was used in this study was temperature-controlled. On top of that, all samples were kept in the same room as the potential meter to minimize the difference between the sample and dew point temperature. Measurements were also taken in equilibrium mode, which waits for the sample to equilibrate fully before taking the measurement. It is also important to clean the sensors and block to avoid any sample contamination by dust and sample waste [33].The device was calibrated daily using KCl with 0.5 molality, following the procedures in Decagon Devices [33]. A soil specimen with a 40 mm diameter and 5 mm thickness in a plastic container is inserted into the chamber drawer on a tray and then sealed to let the specimen equilibrate with the chamber environment thermodynamically, aided by a fan. The surface temperature of the mirror is lowered by the cooling system to the dew-point temperature at which condensation onsets on the mirror, soon as the photoelectric cell detects the start of condensation, the corresponding temperature is measured by a thermocouple. The device internally computes vapor pressure above the soil specimen within the chamber based on dewpoint, whereas saturated vapor pressure is computed based on specimen temperatures. Using the information, Kelvin’s equation (Equation (6)) is used to calculate the total suction for the specimen. The temperature (T) of the samples and calculated water potential (ψ) are then displayed on LCD screen.
ψ = R T M × l n p p o
where P is air vapor pressure, Po is saturation vapor pressure computed from samples’ temperature, M is the molecular mass of water (18.01528 g/mol), and R is the gas constant (8.31 J/mol K). To determine moisture content corresponding to each suction, initial moisture content and sample mass were known and recorded before letting the sample start drying. After every suction measurement, the instantaneous mass of the sample was measured and then used to back-calculate the instantaneous moisture content. The same sample was then let to air dry further before the next suction and moisture content measurements were conducted, until the sample became nearly dry.
It is important to keep the sensors clean by making sure the outside and rim of the sample container are clean and not filling the container by more than half, to avoid any spillage.
Equation (7), developed by Fredlund and Xing [34], was used to best fit the SWCC, using the laboratory-measured data to obtain gravimetric water content-based SWCC (w-SWCC).
w ψ = w s 1 l n ( 1 + ψ h r ) l n ( 1 + 10 6 h r ) 1 l n exp 1 + ψ a f n f m f
where af, nf, and mf are fitting parameters, w(s) is saturated GWC, w(ψ) is GWC corresponding to specified suction, and hr denotes residual soil suction.
Using shrinkage data, the saturation (s) value corresponding to gravimetric water content w(ψ) at each stage of the tests was estimated using Equation (8), the saturation value was then substituted in place of w(ψ) in Equation (7) to develop a saturation–suction (s-SWCC) best-fit curve.
s = G S × w ( ψ )   e
Air entry values for each sample were estimated from SWCC at the point of inflection where the soil starts undergoing substantial water content/saturation decrease with suction increase.

2.2.8. Shrinkage Curves

Shrinkage curves are useful in constructing mass–volume constitutive relationships for unsaturated soils. It provides an important visual connection between stress state and soil consistency.
Slurry samples for shrinkage curves tests were prepared in 32 mm thickness and 64 mm diameter brass rings placed on wax paper. Samples were left exposed to the air to allow evaporation and drying from saturation to complete dry conditions. At different stages of drying (at least twice a day), sample diameter and height change were measured using a digital caliper to determine volume. Both diameter and thickness were taken at four distinct locations of the sample and averaged. Each volume measurement was followed by mass measurement to determine the corresponding water content. Figure 3 shows samples at the end of the shrinkage test.
Obtained data were best fit using the hyperbolic shrinkage curve equation developed by Fredlund et al. [35] as in Equation (9).
e w = a s h w c s h b s h c s h + 1 1 / c s h
where ash, bsh, and csh denote minimum void ratio, slope of the line of tangency and shrinkage curve’s curvature, respectively; the ratio ash/bsh = Gs/S is constant for a specific soil, where S denotes the degree of saturation.

3. Results

3.1. Particle Size Distribution (PSD)

Particle size distribution curves for the five designed mixtures are presented in Figure 4, with D10, and fines and clay contents extracted from the curves summarized in Table 1. Samples have fines contents ranging from 27.5% to 43% and SFR between 1.3 and 2.6. The clay fraction for sample SMK 43-1.6 is the highest (38%) as the mixture resulted from mixing sand and kaolinite, which is almost clay size entirely, whereas the rest of the mixtures constituted sand and FTs with particle sizes ranging below and above fines. The particle size below which 10% of the soil particles fall (D10) ranges from 0.2 μm to 7.5 μm in an increasing order, with fines contents increasing in each sample.
Five samples were prepared for this study, their PSD properties are summarized in Table 1. Shown in Figure 4 is the combination of PSD data for each of the five samples.

3.2. Atterberg Limits and Clay Properties

Atterberg limits and the clay properties of each of the samples are shown in Table 2. Liquid limits for the samples vary from 21% to 29%, where the plasticity index ranges between 9% and 19%. Activity and MBI values for the sample SMK 43-1.6 are very low (0.3 and 1.6 respectively) compared to other samples, even though it is the same sample with the highest clay content; this is because the sample contained kaolinite, which is less active in comparison to illite as average clay mineral available in FT.

3.3. Shrinkage Curve

From Shrinkage laboratory tests, the volume change behavior for transition oil sands tailings were studied. As can be observed from the shrinkage curves in Figure 5, all samples followed a normal soil shrinkage curve with three distinct stages.
In stage one, the samples are still fully saturated, and the sample’s volume change is the same as the volume of water released, this is represented by straight lines from the highest water content to the point where the lines start curving. At this point, where the lines start curving is deemed as an air entry value (AEV), and it is at this point that stage two begins, this is the residual phase at which air starts entering the voids, and soil starts desaturating and showing reduced deformation. For all other samples, AEV points follow between 16% and 18% gravimetric water content except for the sample SM 37-4.8 + 1%S Bentonite that was designed to contain bentonite to observe the effect of clay activity. This resulted in the lowest AEV of 8%, which can be explained by bentonite’s strong affinity to water, making it stay saturated even at such low moisture content. Stage two continues from this AEV point until stage three is reached, where all soil particles are almost in contact, thus negligible deformation while drying continues to total dryness, the point at which stage three starts will normally correspond to the shrinkage limit of materials. The shrinkage limits for all other samples follow between 13% and 16% gravimetric water content, except for the sample SM 37-4.8 + 1%S Bentonite, where this point begins at 3% due to high activity and water holding capacity.
Five samples used in this study have shown a decrease in volume from different initial void ratios but converging to nearly the same void ratio of about 0.4 when they are completely dry. Again, due to excessive shrinkage of the sample SM 37-4.8 + 1%S Bentonite containing bentonite, it resulted to the lowest void ratio of about 0.2.

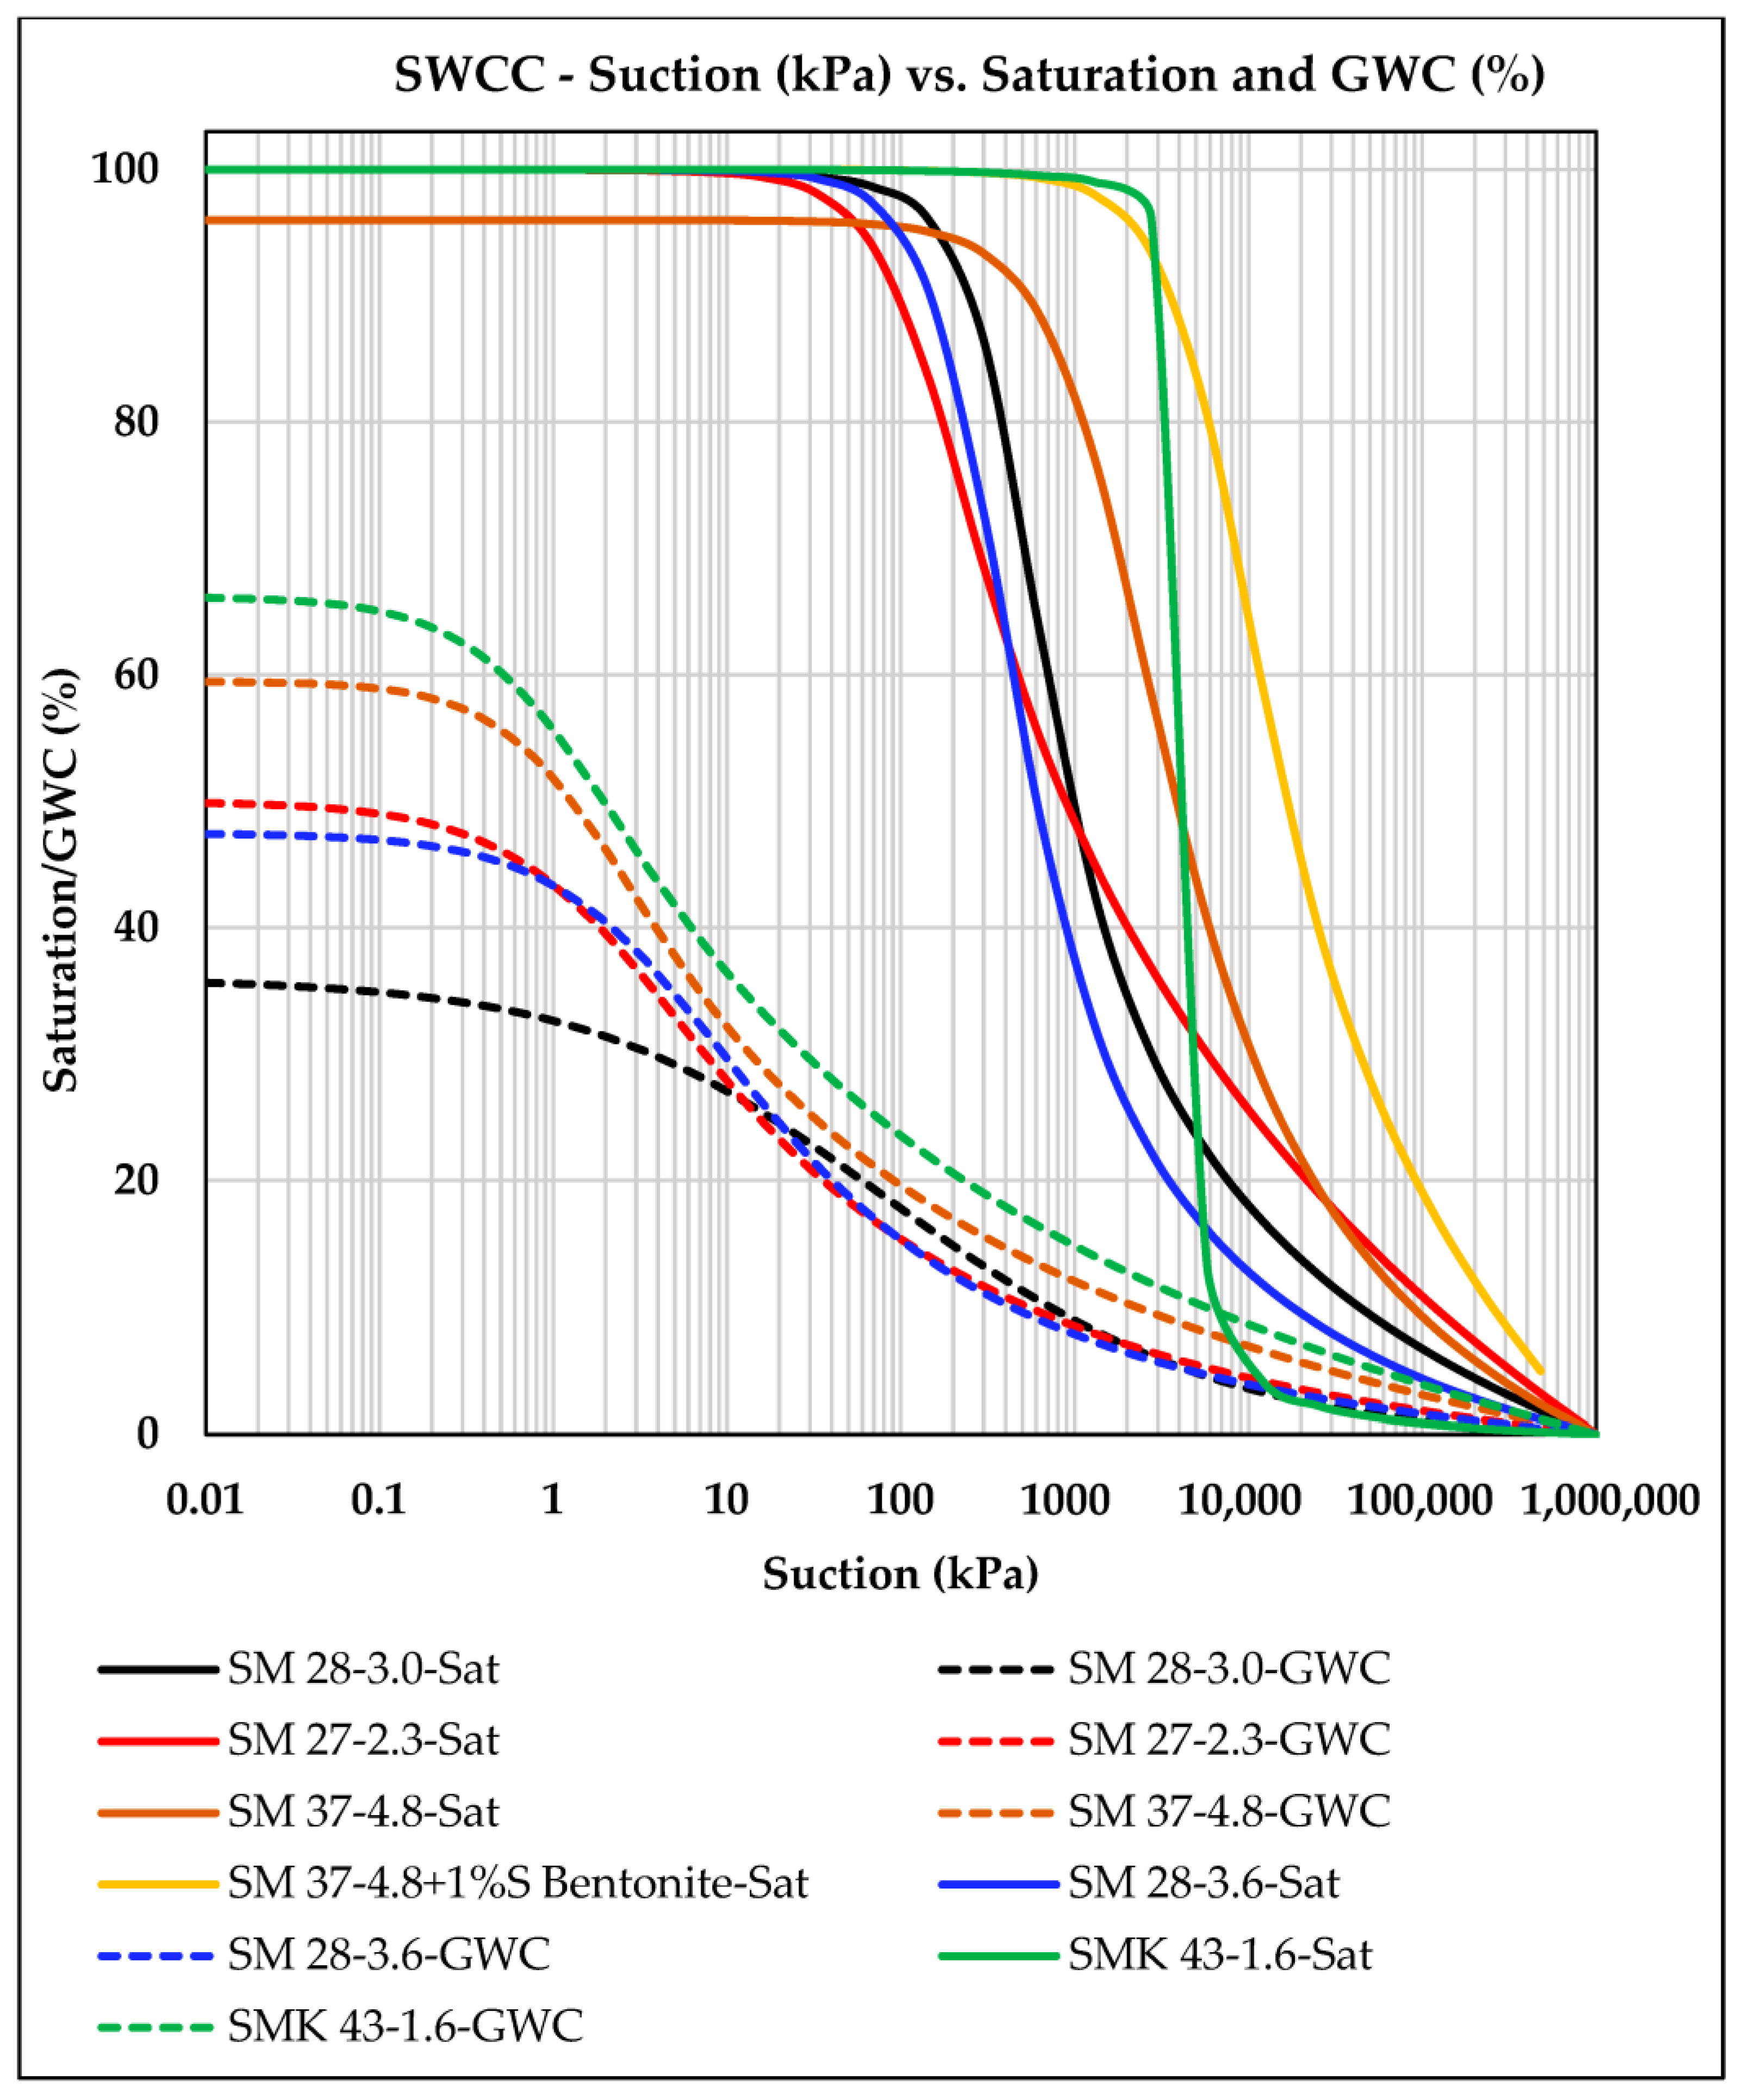
3.4. Soil Water Characteristics Curve

Figure 6 shows soil water characteristic curves for the samples, they are plotted based on both gravimetric water content (w-SWCC) and saturation (s-SWCC), except for the sample SM 37-4.8 + 1%S Bentonite, where due to excessive shrinkage the HyProp device was unable to measure low suctions because the high tensiometer shaft was exposed to the air. Using only Tempe Cells and WP4 data, the plot based on gravimetric water content did not show a clear inflection point. As shown in Figure 6, using a gravimetric-based interpretation, results in low air-entry values range from 0.3 to 2 kPa, as shown in Table 3 and just a slight difference is noted between the samples. However, when the air-entry value is estimated from the saturation-based curves, a great variation in AEVs is observed with values ranging from 60 to 2700 kPa.

4. Discussion

From the shrinkage curve tests, the normalized volume change per unit initial volume (Δe/(1 + e0) is linearly correlated to both fines and clay content with 0.98 and 0.8 R2 values, respectively, as it can be depicted in Figure 7; volume change for these samples is proportional to both fines and clay contents. This can be explained by the large surface area of the fines and the ability to adsorb more water molecules from interlayer spaces between clay particles. Upon drying, water is released, causing these particles to move together, thus more volume changes occur when compared to sand.
The tested samples were designed to have a range of fines (<44 μm particles), a range of clay size (<2 μm equivalent settling diameter), and a range of clay mineral properties. Samples SM 37-4.8 and SMK 43-1.6 have shown higher and increasing AEV in order of increasing fines content, as shown in Table 1 and Table 3. The sample SM 37-4.8 + 1%S bentonite has shown a significant increase in AEV when compared to the parent sample SM 37-4.8, the two samples have comparable properties except for clay mineralogy that has been altered by the addition of bentonite. However, AEV for the sample SM 37-4.8 + 1%S Bentonite with the highest activity is slightly lower than the AEV for the sample SMK 43-1.6, which has least activity but more fines content. Samples SM 27-2.3, RM2, and SM 28-3.6, designed to have nearly the same amount of fines content (28%), have shown a variation in their AEVs increasing in the same order of clay content increase between them, as shown in Table 2. It can be deduced that fines content, and thus the PSD of these materials, has the biggest impact on the measured air entry values, but under similar or near similar PSD conditions, clay mineral composition shows considerable effects on unsaturated properties of these materials. This is similar to the findings of Song and Hong’s [36] study on weathered mudstone and granite soils.
Also, as shown in Figure 8, the increase in both fines and clay contents correlated well with the increase in AEV. The increase in AEVs with increase in fines and clay contents can be explained by the tiny pore sizes within the fines and clays leading to higher capillary forces and thus an increase in AEV as fines dominate.
From the combined SWCC plots in Figure 6 and corresponding AEVs summarized in Table 3, the extent of variation between saturation- (s-SWCC) based and Gravimetric water content- (w-SWCC) based SWCC can be depicted; the variation is substantial up to four orders of magnitude. As has been previously observed with studies on oil sands tailing with SFR < 1 (Fines zone) [7,8] and on Regina clay [8], these results demonstrate that the transitional zone oil sand tailings undergo substantial volume change with suction increase, thus requiring the use of the saturated-based SWCC as opposed to a gravimetric-based SWCC.
Analysis was performed to quantify and correlate the effect of fines content and volume change to the multiplying factor that exists between air entry values obtained from saturation (AEV-s) and the values obtained from gravimetric water content (AEV-w), shown in Table 3. Knowing the multiplying factor between these two AEVs at different index properties would be useful in interpreting AEV-w into AEV-s for transitional oil sands tailings if their fine contents are known. From Figure 9, AEV-s can be estimated if AEV-w and fines contents for respective oil sands transitional tailings are known. Similarly, Figure 10 can be used as a quick check for AEV-s of oil sands tailings when their AEV-w and shrinkage properties are known. Further study of more points is recommended in the future for the greater reliability of these curves.
Figure 9 and Figure 10 show good power–law correlations between AEV-s/AEV-w multiplying factors in relation to fines content and volume change, respectively.

5. Conclusions

Soil water characteristic curves are fundamental in establishing parameters for modeling the unsaturated geotechnical properties of soils, which have given good estimates for the strength and permeability of drying soils. The designation used for retained water content at each suction matters a lot in determining realistic and accurate parameters; for soils experiencing volume change during the drying process only designations accounting for volume change, i.e., saturation and instantaneous volumetric water content can be used. This work has experimentally investigated the extent of volume change for transitional oil sands tailings with varying clay contents and SFR between 1 and 3, to determine the appropriate designation to be used in developing their accurate SWCCs for accurate input in modeling unsaturated soil property functions.
From the shrinkage curve study transitional oil sand tailings have shown an increase in volume changes proportional to an increase in their fines and clay size contents. Air entry values estimated from both Saturation and Gravimetric water content-based SWCCs have shown to also increase with the increase in fines content, for samples with similar fines content and PSD the increase in AEV is proportional to clay size contents increase. This demonstrates that for these unsaturated properties, the size properties influence dominates over activity-based properties.
Air entry value differences between saturation and gravimetric water contents-based SWCCs for the same transitional zone oil sands tailing samples is substantial. The use of gravimetric water content underestimates AEVs and, if used, will lead to wrong unsaturated geotechnical parameters for these materials. It is therefore necessary to conduct shrinkage study to obtain the correct AEV based on saturation designation.
The ratio between AEVs estimated from saturation and GWC-based SWCC have shown a good correlation with fines contents and volume change. This is an implication that AEVs estimated based on w-SWCCwould be more erroneous as the fines increase. Also, under any circumstance that shrinkage test cannot be performed, these correlations can be used to estimate saturation-based AEV from the determined gravimetric water content-based AEV and sample’s fines contents or volume change information.
This study enhances the understanding of soil water characteristics curves for transitional oil sands tailings deposits, thus providing a strong framework for predicting their unsaturated soil behavior as they migrate from saturated to dry states. The findings have shown that consideration of volume change offers improved accuracy for predicting water retention in these tailings. Subsequently, this provides accurate estimations for unsaturated hydraulic conductivity, volume change, consolidation, seepage control, and strength gain of such materials. This is useful information for both operators and regulators to come up with appropriate long-term behavior predictions of these deposits for successful environmental management and safety.
This study has potential limitations which could affect its reproducibility and application. The influence of residual bitumen in transitional oil sands tailings has not been considered, and bitumen has the potential to disturb soil–water interaction due to its hydrophobic properties, thus affecting the unsaturated properties of these soils. Moreover, the high variability of these materials can affect suction measurement accuracy and reliability. The presence of bitumen and clay can lead to clogging and affect the accuracy of sensors in HyProp and water potential meter (WP4-T). Heterogeneity in these materials can also result in inconsistent and non-representative results, as different tailings deposits may behave differently even under the same conditions. The authors recommend future research to determine the influence of bitumen and chemical composition on the unsaturated behavior of transitional oil sands tailings.

Author Contributions

Conceptualization, P.K.; methodology, P.K.; software, P.K.; validation, P.K., G.W.W. and H.K.; formal analysis, P.K.; investigation, P.K.; resources, G.W.W.; data curation, P.K.; writing—original draft preparation, P.K.; writing—review and editing, H.K.; visualization, P.K.; supervision, G.W.W. and H.K.; project administration, G.W.W.; funding acquisition, G.W.W. All authors have read and agreed to the published version of the manuscript.

Funding

This research was funded by the Natural Sciences and Engineering Research Council of Canada and Canada’s Oil Sands Innovation Alliance (NSERC/COSIA) Industrial Research Chair in Oil Sands Tailings Geotechnique: RES0046210 (COSIA) and RES0043995 (NSERC).

Data Availability Statement

The entirety of the data used in this study is documented within this paper.

Acknowledgments

The authors would like to acknowledge research and financial support from the Natural Sciences and Engineering Research Council of Canada and Canada’s Oil Sands Innovation Alliance (NSERC/COSIA) Industrial Research Chair in Oil Sands Tailings Geotechnique and Industrial Research Chair for Colleges in Oil Sands Tailings Management. The authors wish to express their gratitude to Lous Kabwe for his technical support and review of the work.

Conflicts of Interest

The author declares no conflicts of interest.

References

  1. Natural Resources Canada. Energy Fact Book 2022–2023; Natural Resources Canada: Ottawa, ON, Canada, 2023.
  2. Alberta Energy Regulator. State of Fluid Tailings Management for Mineable Oil Sands-2022; Alberta Energy Regulator: Calgary, AB, Canada, 2023.
  3. Beier Nicholas, A.; Kabwe Louis, K.; Don Scott, J.; Pham Nam, H.; Wilson, G.W. Modeling the Effect of Flocculation and Desiccation on Oil Sands Tailings. Geo-Chicago 2016, 2016, 321–330. [Google Scholar] [CrossRef]
  4. Chalaturnyk, R.J.; Don Scott, J.; Özüm, B. Management of oil sands tailings. Pet. Sci. Technol. 2002, 20, 1025–1046. [Google Scholar] [CrossRef]
  5. Fredlund, D.G.; Rahardjo, H.; Fredlund, M.D. Unsaturated Soil Mechanics in Engineering Practice; John Wiley & Sons, Inc.: Hoboken, NJ, USA, 2012. [Google Scholar] [CrossRef]
  6. Zhang, F.; Fredlund, D.G.; Ward Wilson, G. Water Permeability Function for Soils that Undergo Volume Change as Suction Changes. Indian Geotech. J. 2016, 46, 210–227. [Google Scholar] [CrossRef]
  7. Fredlund, D.; Houston, S. Interpretation of soil-water characteristic curves when volume change occurs as soil suction is changed. Adv. Unsaturated Soils 2013, 1, 15. [Google Scholar]
  8. Fredlund, D.; Stone, J.; Stianson, J.; Sedgwick, A. Determination of water storage and permeability functions for oil sands tailings. In Proceedings of the Tailings and Mine Waste, Vancouver, BC, Canada, 1 November 2011. [Google Scholar]
  9. Watabe, Y.; Yamada, K.; Saitoh, K. Hydraulic conductivity and compressibility of mixtures of Nagoya clay with sand or bentonite. Géotechnique 2011, 61, 211–219. [Google Scholar] [CrossRef]
  10. Cabalar, A.F.; Hasan, R.A. Compressional behaviour of various size/shape sand–clay mixtures with different pore fluids. Eng. Geol. 2013, 164, 36–49. [Google Scholar] [CrossRef]
  11. Carrera, A.; Coop, M.; Lancellotta, R. Influence of grading on the mechanical behaviour of Stava tailings. Géotechnique 2011, 61, 935–946. [Google Scholar] [CrossRef]
  12. Li, W.; Coop, M.R. Mechanical behaviour of Panzhihua iron tailings. Can. Geotech. 2019, 56, 420–435. [Google Scholar] [CrossRef]
  13. Croney, D.; Coleman, J. Soil Structure in Relation to Soil Suction (pF). J. Soil Sci. 1954, 5, 75–84. [Google Scholar] [CrossRef]
  14. Fredlund, D.; Zhang, F. Combination of shrinkage curve and soil-water characteristic curves for soils that undergo volume change as soil suction is increased. In Proceedings of the Soil Mechanics and Geotechnical Engineering, Paris, France, 2–6 September 2013; pp. 2–6. [Google Scholar]
  15. Huang, S.; Barbour, S.L.; Fredlund, D.G. Development and verification of a coefficient of permeability function for a deformable unsaturated soil. Can. Geotech. J. 1998, 35, 411–425. [Google Scholar] [CrossRef]
  16. Fredlund, D.G. The 1999 RM Hardy Lecture: The implementation of unsaturated soil mechanics into geotechnical engineering. Can. Geotech. J. 2000, 37, 963–986. [Google Scholar] [CrossRef]
  17. Parent, S.-É.; Cabral, A.; Zornberg, J.G. Water retention curve and hydraulic conductivity function of highly compressible materials. Can. Geotech. J. 2007, 44, 1200–1214. [Google Scholar] [CrossRef]
  18. Mbonimpa, M.; Aubertin, M.; Maqsoud, A.; Bussière, B. Predictive Model for the Water Retention Curve of Deformable Clayey Soils. J. Geotech. Geoenvironmental Eng. 2006, 132, 1121–1132. [Google Scholar] [CrossRef]
  19. COSIA Deposit Characterization Committee. Measuring Undrained Shear Strength of Oil Sands Tailings Deposits; COSIA: Calgary, AB, Canada, 2014. [Google Scholar]
  20. OSTC/COSIA. Technical Guide for Fluid Fine Tailings Management; Oil Sands Tailings Consortium: Calgary, AB, Canada, 2012. [Google Scholar]
  21. Imperial Oil Resources Limited. Mine Plan Amendment and Tailings Management Plan Integrated Application; Alberta Energy Regulator: Calgary, AB, Canada, 2022.
  22. CNRL. Canadian Natural Jackpine Mine Fluid Tailings Management Report; Alberta Energy Regulator: Calgary, AB, Canada, 2020.
  23. Konert, M.; Vandenberghe, J. Comparison of laser grain size analysis with pipette and sieve analysis: A solution for the underestimation of the clay fraction. Sedimentology 1997, 44, 523–535. [Google Scholar] [CrossRef]
  24. D4318-17; Standard Test Methods for Liquid Limit, Plastic Limit, and Plasticity Index of Soils. ASTM International: West Conshohocken, PA, USA, 2017.
  25. Sethi, A. Methylene Blue Test for Clay Activity Determination in Fine Tails. MRRT Proced. 1995, 23. [Google Scholar]
  26. Kaminsky, H. Demystifying the methylene blue index. In Proceedings of the Oil Sands Tailings 2014, Lake Louise, AB, Canada, 8–10 December 2014. [Google Scholar]
  27. Wells, P.; Kaminsky, H. Slurry to soil clay behaviour model—Using methylene blue to cross the process/geotechnical engineering divide. In Proceedings of the Tailings and Mine Waste 2015, Vancouver, BC, Canada, 26–28 October 2015. [Google Scholar]
  28. Omotoso, O.; Morin, M. Methylene Blue Procedure: Dean Stark Solids; CanmetENERGY: Devon, UK, 2008.
  29. D854-14; Standard Test Methods for Specific Gravity of Soil Solids by Water Pycnometer. ASTM International: West Conshohocken, PA, USA, 2014.
  30. UMS GmbH. Operation Manual-HYPROP; UMS GmbH: Frankfurt, Germany, 2015. [Google Scholar]
  31. Van Genuchten, M.T. A closed-form equation for predicting the hydraulic conductivity of unsaturated soils. Soil Sci. Soc. Am. J. 1980, 44, 892–898. [Google Scholar] [CrossRef]
  32. Gee, G.; Campbell, M.; Campbell, G.S.; Campbell, J. Rapid measurement of low soil water potentials using a water activity meter. Soil Sci. Soc. Am. J. 1992, 56, 1068–1070. [Google Scholar] [CrossRef]
  33. Decagon Devices. Operator’s Manual for Models WP4 and WP4-T; Hopkins Court: Pullman WA, USA, 1998. [Google Scholar]
  34. Fredlund, D.; Xing, A. Equations for the Soil–Water Characteristic Curve. Can. Geotech. 1994, 31, 521–532. [Google Scholar] [CrossRef]
  35. Fredlund, M.; Wilson, G.; Fredlund, D. Representation and estimation of the shrinkage curve. In Proceedings of the Unsaturated Soils: Proceedings of the Third International Conference, UNSAT2002, Recife, Brazil, 10–13 March 2002; p. 145. [Google Scholar]
  36. Song, Y.-S.; Hong, S. Effect of clay minerals on the suction stress of unsaturated soils. Eng. Geol. 2020, 269, 105571. [Google Scholar] [CrossRef]
Figure 1. Tailings Phase Diagram.
Geotechnics 04 00056 g001
Figure 2. Equipment used to obtain SWCC data: (a) HyProp; (b) Tempe cell; and (c) Water potential meter (WP4-T).
Geotechnics 04 00056 g002
Figure 3. Samples after Shrinkage test.
Geotechnics 04 00056 g003
Figure 4. Particle size distribution data for the sample used in the study.
Geotechnics 04 00056 g004
Figure 5. Shrinkage curves.
Geotechnics 04 00056 g005
Figure 6. Combined saturation-based (s-SWCC) and gravimetric water content-based (w-SWCC) soil water characteristics curves for tested samples.
Geotechnics 04 00056 g006
Figure 7. Normalized volume changes upon drying.
Geotechnics 04 00056 g007
Figure 8. Fines and clay contents influence AEV.
Geotechnics 04 00056 g008
Figure 9. Fines content influence on AEV for transitional oil sands tailings.
Geotechnics 04 00056 g009
Figure 10. Volume change influence on AEV for transitional oil sands tailings.
Geotechnics 04 00056 g010
Table 1. Particle size distribution summary.
IDFines (−44 μm)Clay (−2 μm)SFRD10 (μm)
SM 28-3.027.6%12%2.67.5
SM 27-2.327.5%13%2.66.8
SM 37-4.837.5%18%1.76.0
SM 28-3.628.3%16%2.55.7
SMK 43-1.643.0%38%1.30.2
Table 2. Atterberg limits and clay properties.
IDClay (−2 μm)Liquid Limit (%)Plastic Limit (%)Plasticity Index (%)ActivityMBI
SM 28-3.012%23%10%13%1.13.0
SM 27-2.313%22%9%13%1.02.3
SM 37-4.818%29%10%19%1.04.8
SM 28-3.616%21%12%9%0.63.6
SMK 43-1.638%24%12%12%0.31.6
Table 3. Air entry values estimated from saturation-based (s-SWCC) and gravimetric water content-based (w-SWCC) SWCCs.
IDAEV (kPa) from w-SWCCAEV (kPa) from s-SWCC Ratio   A E V   f r o m   s s w c c A E V   f r o m   w s w c c
SM 28-3.02.0200100
SM 27-2.30.4560133
SM 37-4.80.3200667
SM 37-4.8 + 1%S Bentonite-2000-
SM 28-3.61.59060
SMK 43-1.60.327009000
Disclaimer/Publisher’s Note: The statements, opinions and data contained in all publications are solely those of the individual author(s) and contributor(s) and not of MDPI and/or the editor(s). MDPI and/or the editor(s) disclaim responsibility for any injury to people or property resulting from any ideas, methods, instructions or products referred to in the content.

