Article

Dissipation of Energy and Generation of Pore Pressure in Load-Controlled and Displacement-Controlled Cyclic Tests

by
Carmine P. Polito
1,*,
Zhuoyue Zhang
1 and
Henry H. M. Moldenhauer
2
1
Department of Civil and Environmental Engineering, Valparaiso University, 1900 Chapel Drive, Valparaiso, IN 46383, USA
2
Department of Aerospace Engineering, Iowa State University, 537 Bissell Road, Ames, IA 50011, USA
*
Author to whom correspondence should be addressed.
Geotechnics 2024, 4(4), 1026-1047; https://doi.org/10.3390/geotechnics4040052
Submission received: 19 August 2024 / Revised: 1 October 2024 / Accepted: 8 October 2024 / Published: 9 October 2024

Abstract

The amount of energy dissipated in the soil during cyclic loading controls the amount of pore pressure generated under that loading. Because of this, the normalized dissipated energy per unit volume is the basis for both pore pressure generation models and energy-based liquefaction analyses. The pattern of energy dissipation in the soil in load-controlled cyclic triaxial and load-controlled cyclic direct simple shear tests and displacement-controlled cyclic triaxial and displacement-controlled cyclic direct simple shear tests is quite different. As a result, the pattern of pore pressure generation associated with load-controlled tests is markedly different from that in displacement-controlled tests. Pore pressure generation patterns for each of the four test types were proposed based upon the manner in which the load was applied during the test and the soil’s response to that loading. The results of four tests, two load controlled and two displacement controlled, were then used to verify these patterns. Pore pressure generation rates in load-controlled and displacement-controlled tests are different when plotted against their cycle ratios. Conversely, the tests produce nearly identical patterns when plotted against energy dissipation ratio. This occurs because of the relationship between energy dissipation ratio and pore pressure generation is independent of the loading pattern.

1. Introduction

The amount of energy dissipated in the soil during cyclic loading controls the amount of pore pressure generated under that loading. Both load-controlled and displacement-controlled cyclic triaxial and cyclic direct simple shear tests are performed during laboratory-based liquefaction evaluations. While load-controlled and displacement-controlled tests performed on similar specimens require similar amounts of normalized dissipated energy per unit volume (henceforth referred to as “dissipated energy”) to trigger liquefaction, the patterns of energy dissipation and excess pore pressure generation are different.
In this study, energy dissipation patterns were proposed for load-controlled and displacement-controlled cyclic triaxial tests. The same was performed for cyclic direct simple shear tests. Subsequently, cyclic triaxial and cyclic direct simple shear tests were performed and the results were used to verify the proposed energy dissipation patterns. Finally, the patterns of pore pressure generation with respect to both the cycles of loading and the energy dissipated during the test for load-controlled and displacement-controlled cyclic triaxial and cyclic direct simple shear tests were evaluated using the results from the tests.

2. Background

This section will focus on several background topics necessary for the understanding of this paper. These topics are cyclic laboratory tests, pore pressure generation in cyclic laboratory tests, energy dissipation and pore pressure generation as well as some terminology.

2.1. Cyclic Laboratory Tests

The two laboratory tests most commonly used to study pore pressure generation in sands are the cyclic triaxial test and the cyclic direct simple shear tests. Other tests less commonly used to evaluate pore pressure generation under cyclic loading include torsional shear tests [1,2,3,4,5], shake table tests [6,7,8,9,10] and centrifuge tests [11,12,13,14,15].

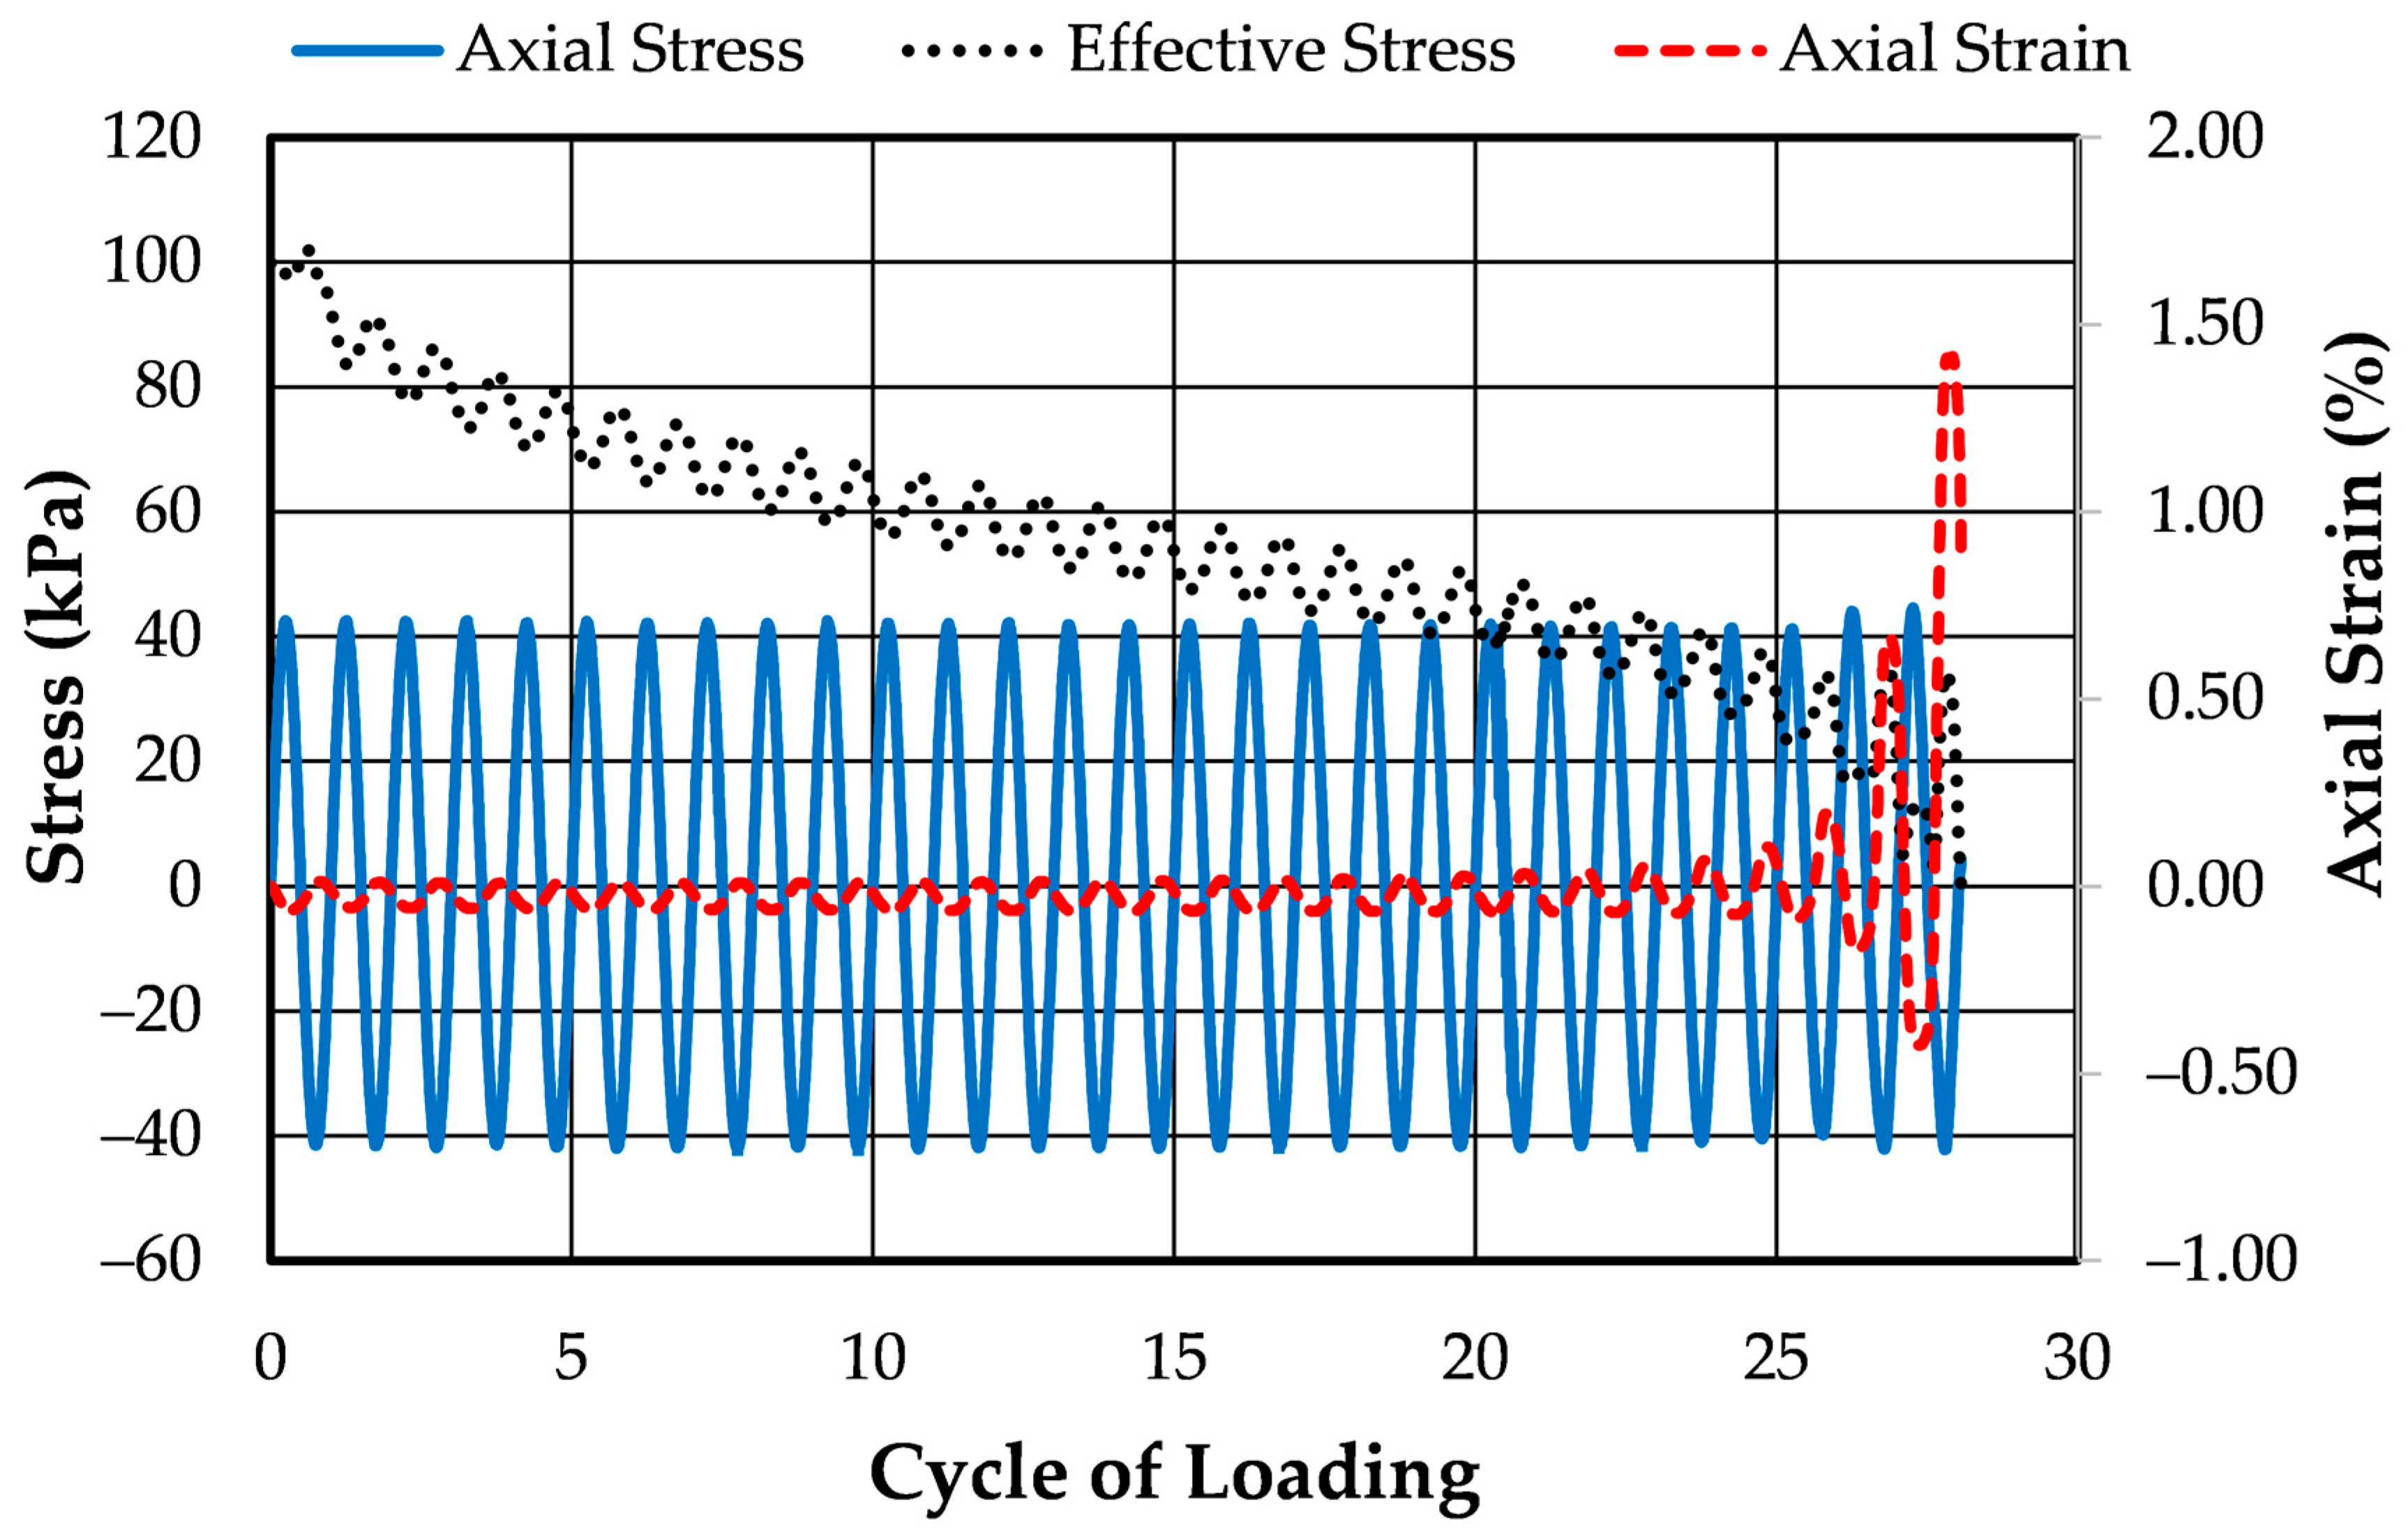
2.1.1. Cyclic Triaxial Tests

Pore pressure generation in a soil is most often measured in the laboratory using reconstituted specimens tested in load-controlled cyclic triaxial tests. The specimen is formed within a latex membrane, placed inside the triaxial cell, saturated, consolidated to some stress condition and then loaded with a pulsating deviator load. As the deviator load cycles, pore water pressure in the specimen increases, effective stress decreases and the specimen undergoes axial straining. The specimen is said to have liquefied when either the pore pressure becomes equal to the initial effective confining stress (i.e., when the effective stress acting on the specimen becomes equal to zero) or when some level of axial strain is achieved.
The manner in which the stresses are applied to an element of soil in the field are quite different than the manner in which the stresses are applied in a cyclic triaxial test. Seed and Lee [16] present the actual shear conditions affecting a soil element in the field under level ground, which consist of a series of horizontal, reversing shear stresses acting on a horizontal plane in conjunction with a constant vertical stress. These shear stresses result from the upward propagation of shear waves through the soil column. Cyclic triaxial tests attempt to model these stress conditions by applying a pulsating deviatoric stress to the specimen while maintaining a constant total confining stress on the specimen and preventing drainage. The stresses on a plane inclined at 45 degrees to the axis of the specimen are similar, though not identical, to the stresses acting on a horizontal plane in the field. These differences in stress conditions are accounted for by applying a correction factor when applying the test results to the field [17]. An idealized representation of these stress conditions is provided in Figure 1 along with the total stress path.

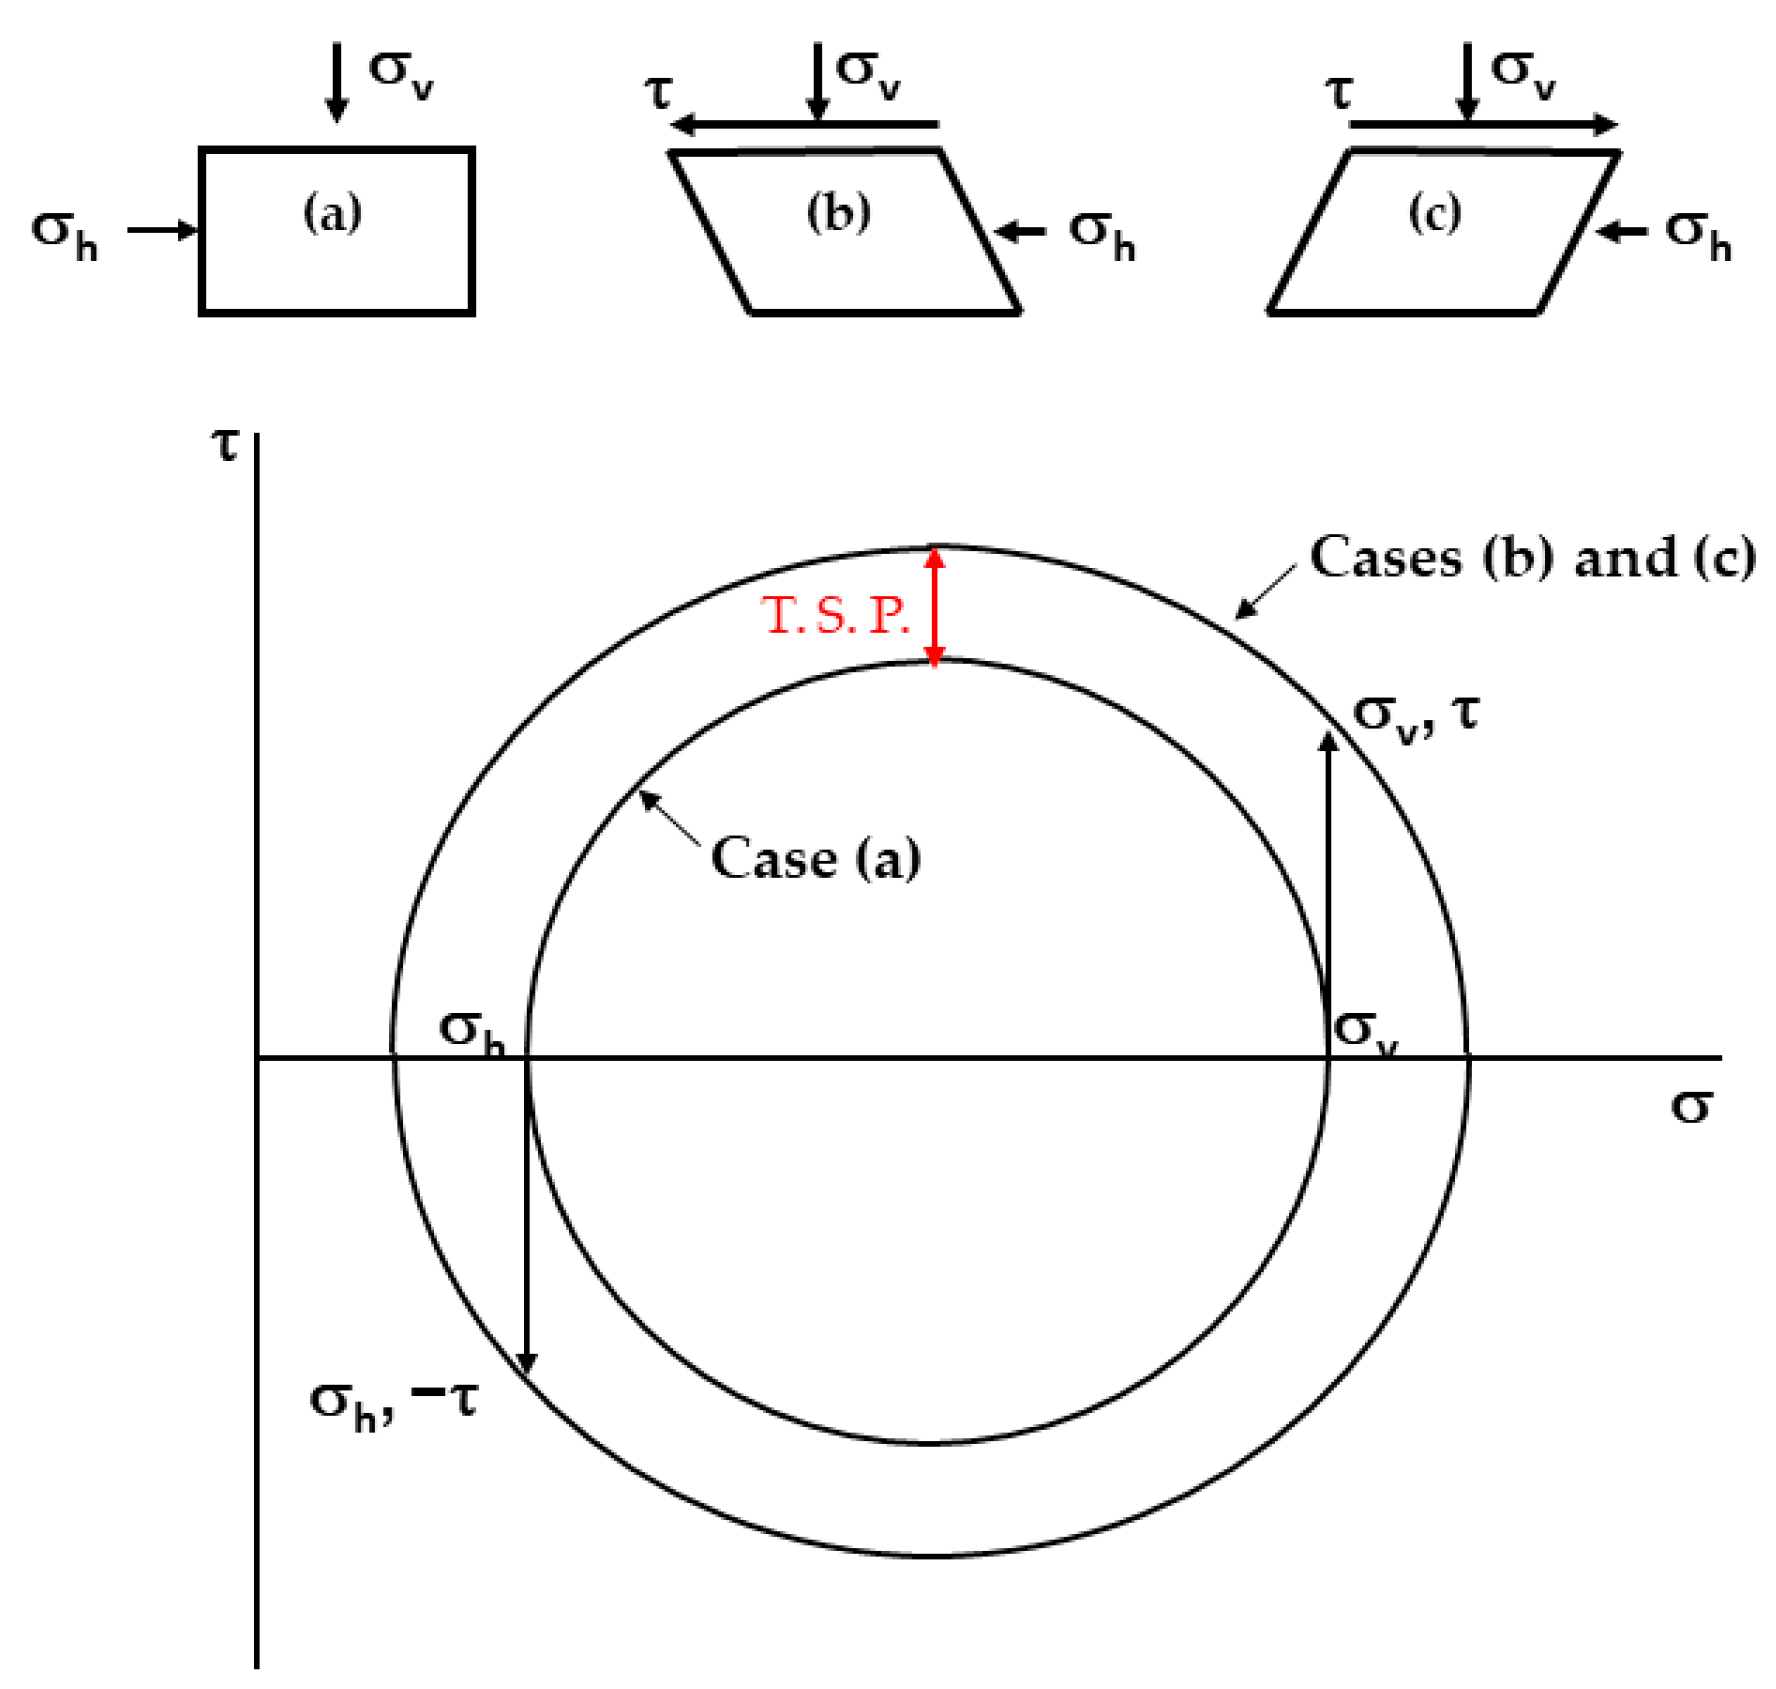
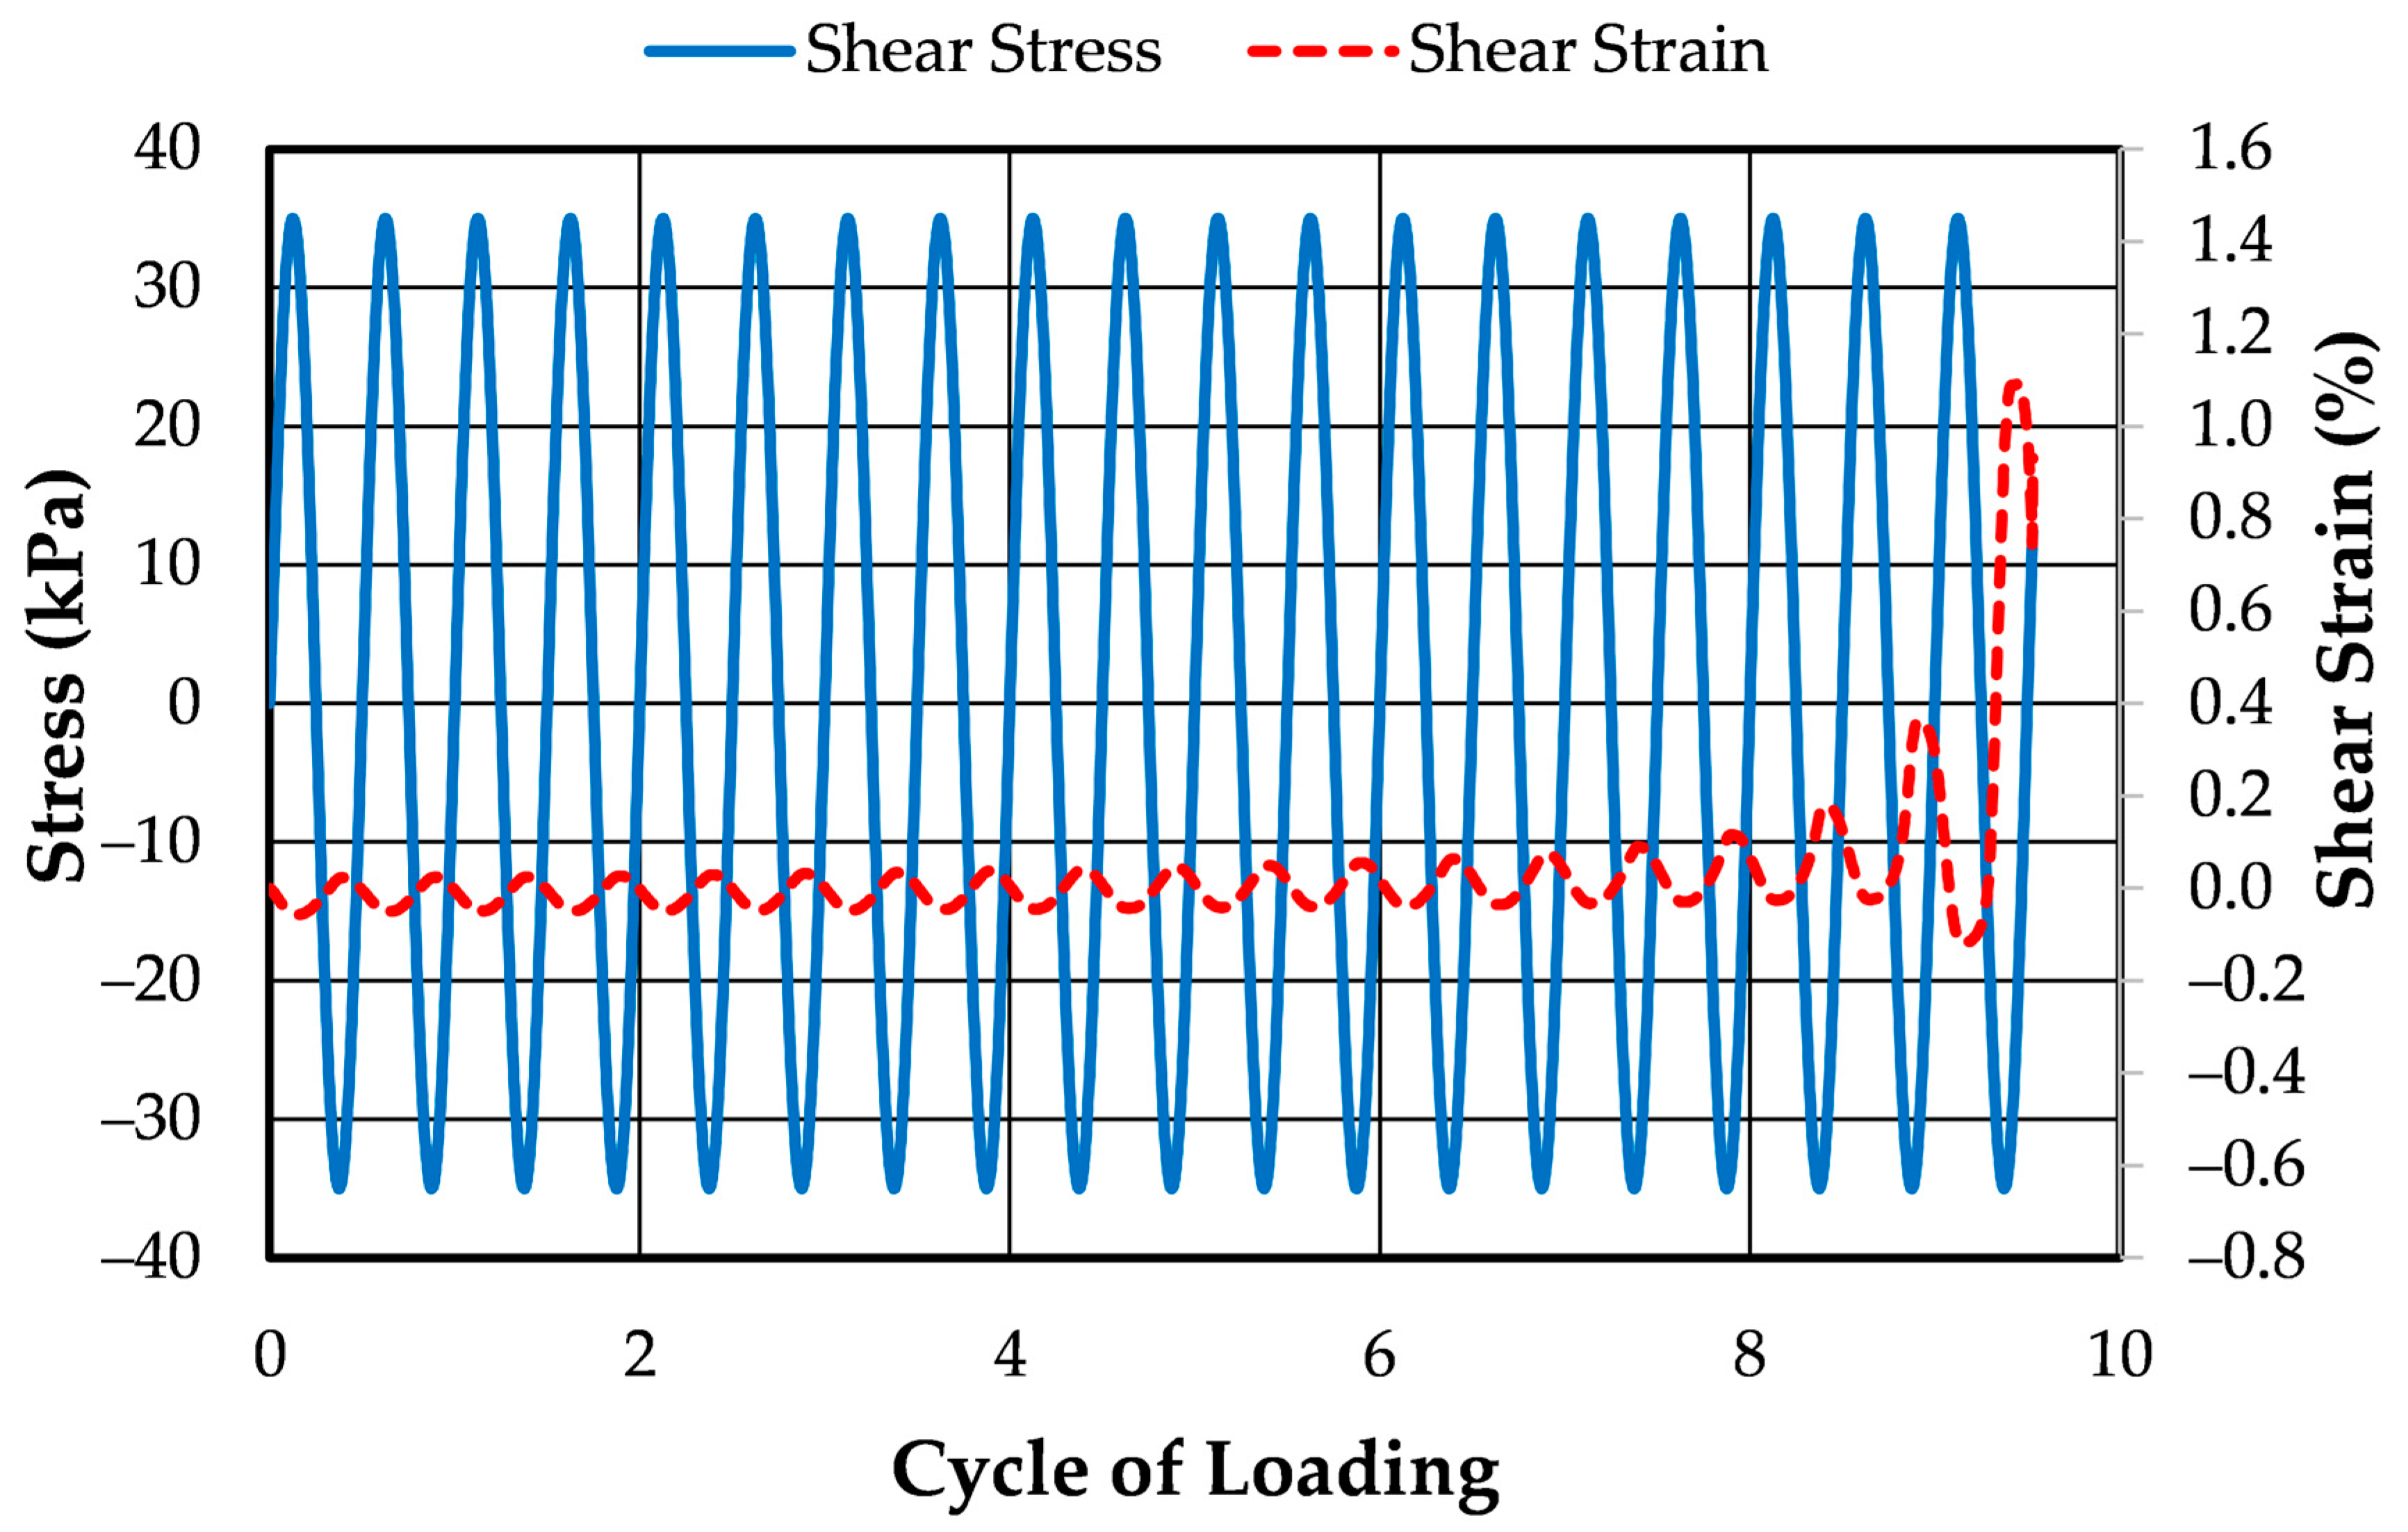
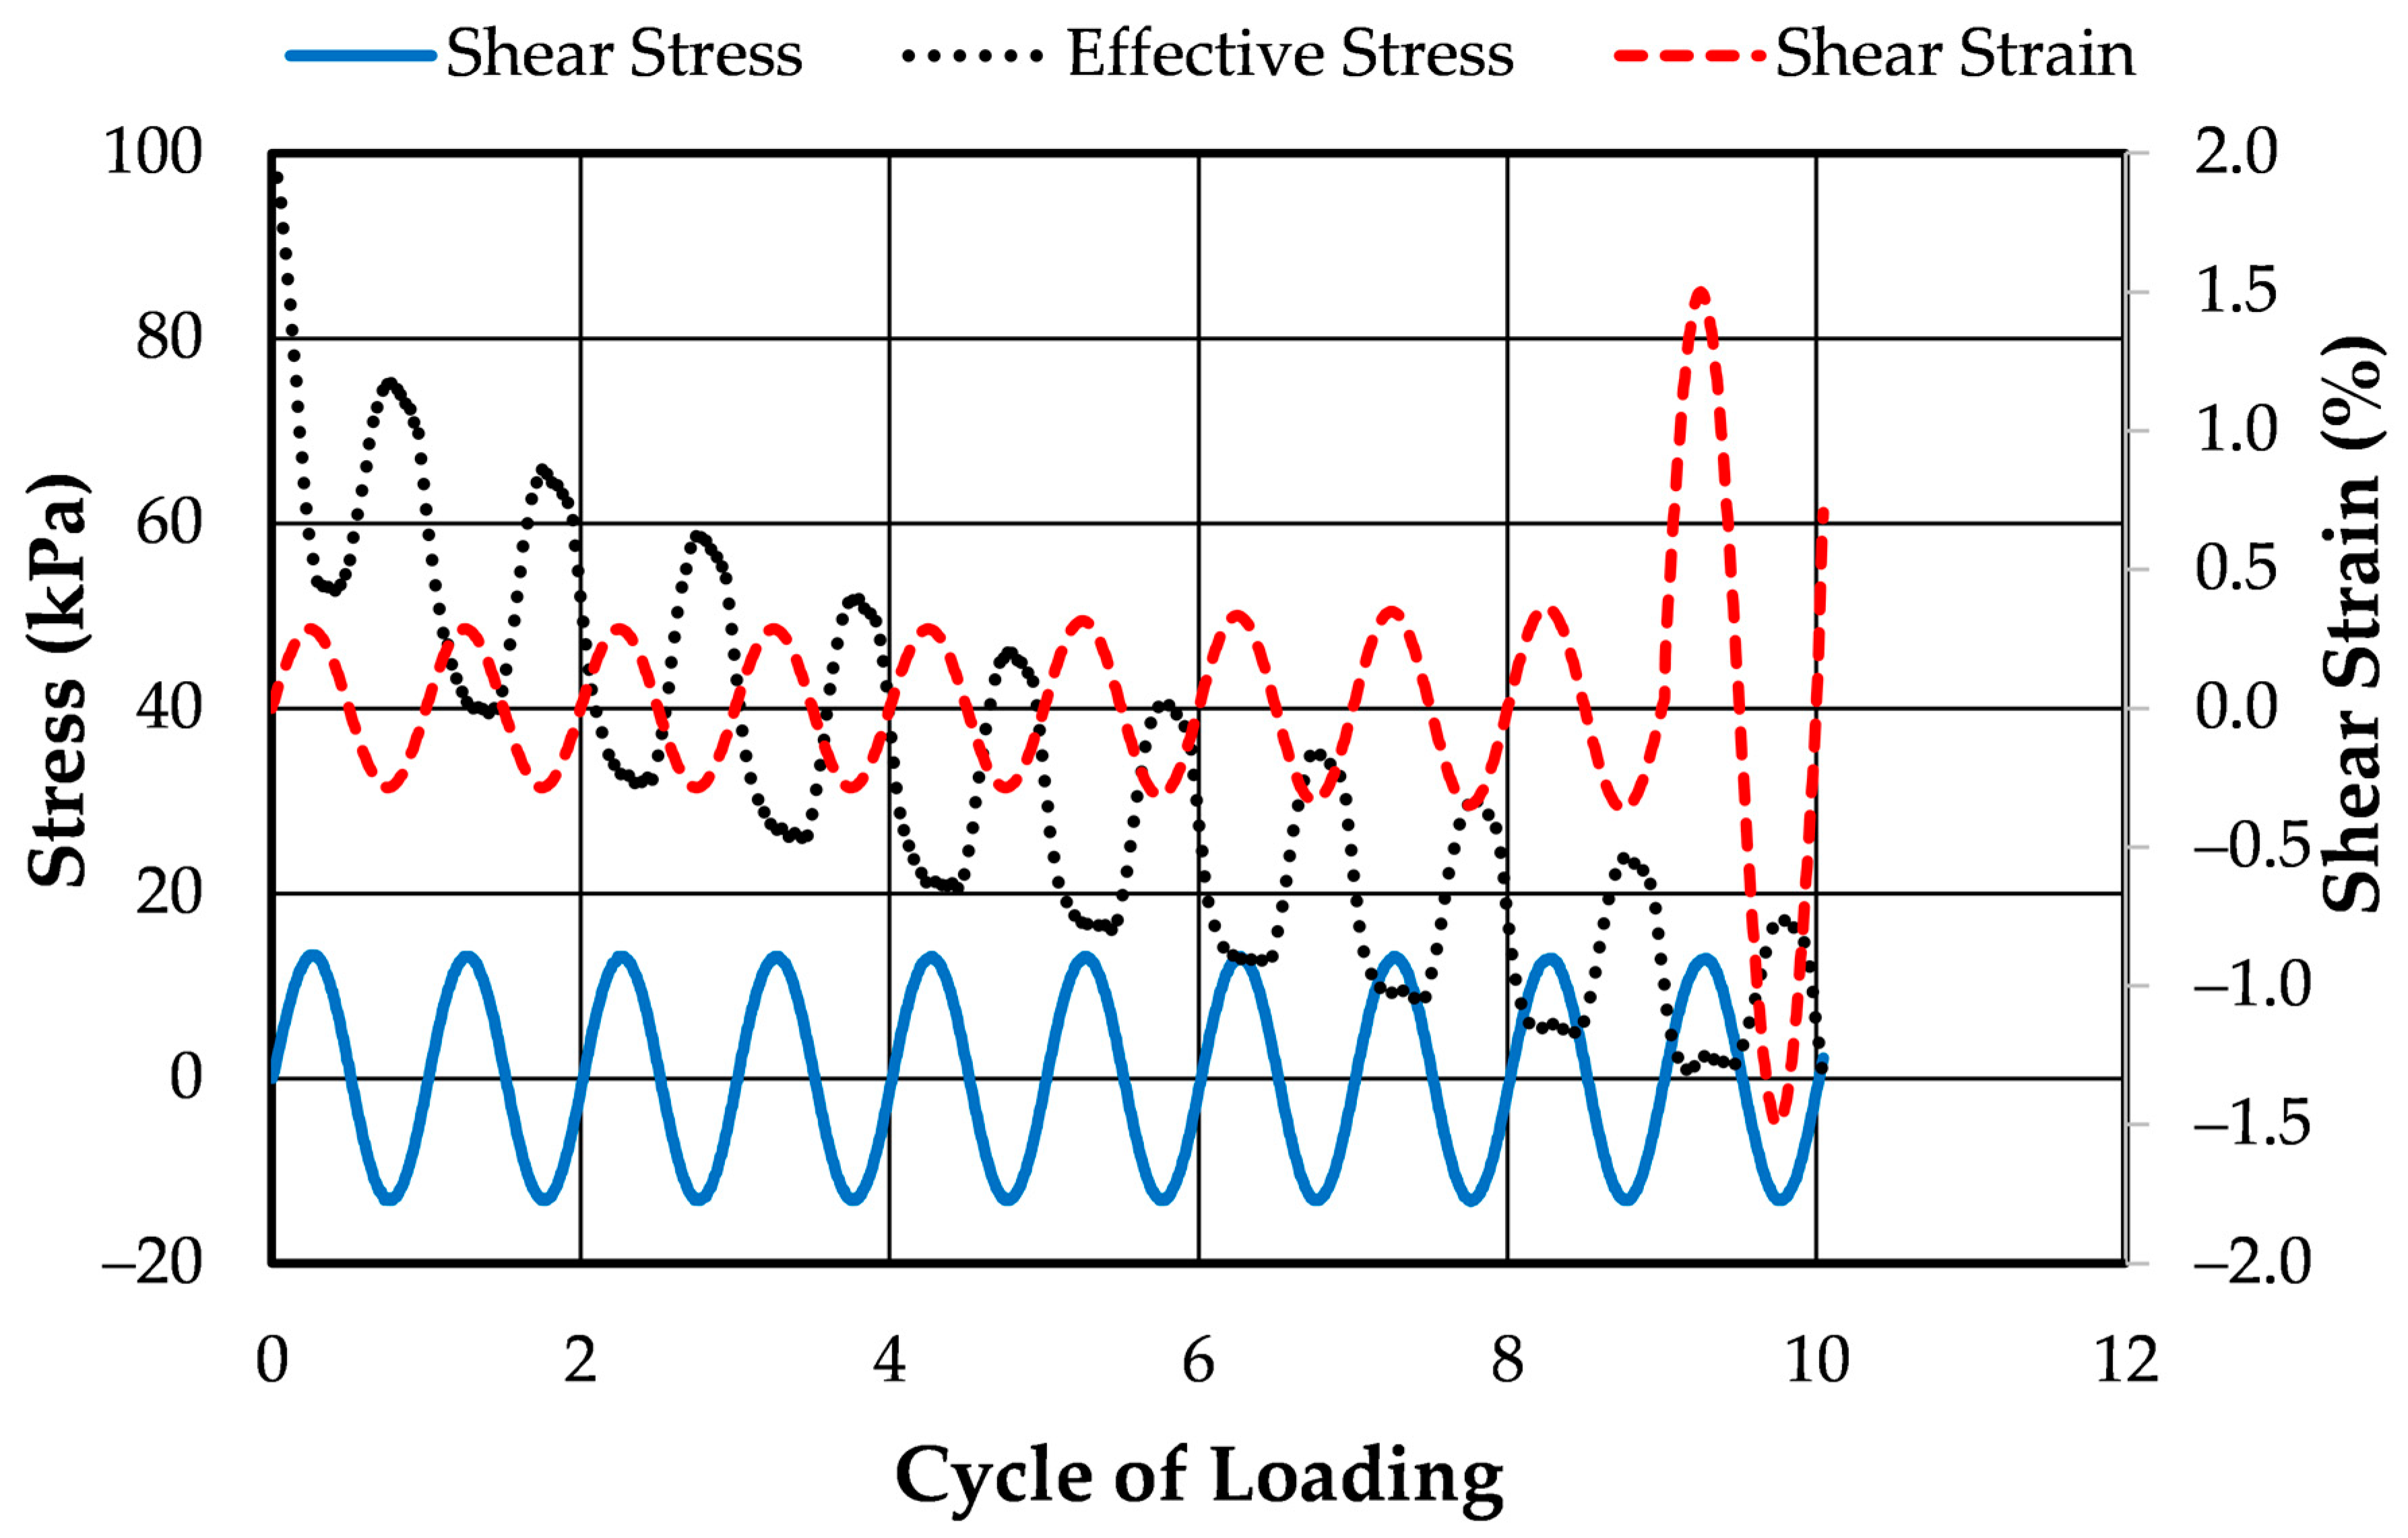
2.1.2. Cyclic Direct Simple Shear Tests

Cyclic direct simple shear tests [18,19] are a subset of cyclic simple shear tests. In each case a short cylinder of soil (typically with a diameter to height ratio of less than four [20]) is subjected to a constant vertical load while a cyclic horizontal shear load is applied. These stress conditions are presented in Figure 2 and are more representative of the stress conditions that exist during earthquake loading in the field than are those found in a cyclic triaxial test.
In cyclic simple shear tests, the specimen is surrounded by a latex membrane, saturated, consolidated to some, typically isotropic, stress state and sheared undrained while stresses, strains and pore pressures are measured. The specimen must be saturated to ensure that it acts truly undrained (i.e., does not change volume).
In cyclic direct simple shear tests, the specimen is neither saturated nor sheared undrained, but, instead, has a condition of constant volume imposed upon it [18,19]. This was performed by surrounding the specimen with brass rings to prevent lateral straining and then locking the top platen in place during shearing to enforce a constant height upon the specimen. During shearing, the change in the vertical stress measured in the cyclic direct simple shear test is equal to the increase in pore pressure and is also equal to the opposite of the change in effective stress that would occur in an identically prepared saturated specimen if it were sheared undrained under the same cyclic direct simple shear loading [18,19].

2.2. Pore Pressure Generation in Cyclic Laboratory Tests

Since the advent of geotechnical earthquake engineering in the mid-1960s, numerous studies have used cyclic triaxial tests [16,21,22,23,24,25,26,27,28] and cyclic simple shear tests [29,30,31,32,33,34,35,36,37] to investigate pore pressure generation under cyclic loadings. These studies are most often performed in the context of examining the liquefaction susceptibility of soils.
Initially, most investigations were performed using load-controlled cyclic triaxial tests [e.g., [16]] for stress-based analyses. These stress-based tests were used to develop pore pressure models such as that developed by Booker et al. [38]. Later, the advent of displacement-controlled cyclic triaxial tests led to the development of strain-based pore pressure models, such as that developed by Dobry et al. [39].
Lee and Albaisa [22] found that for load-controlled cyclic triaxial tests, when plotted against the cycle ratio, the pore pressure ratio fell within a fairly narrow band regardless of sand type, confining pressure, number of cycles to cause liquefaction or the soil’s relative density.
Cyclic simple shear tests and cyclic direct simple shear test have also been used in numerous studies of pore pressure generation under cyclic loads. One advantage that cyclic direct simple shear tests have is they can be relatively easily constructed to handle large specimens such as those required for testing gravels [40].

2.3. Energy Dissipation and Pore Pressure Generation

One of the more difficult problems facing Geotechnical Engineers is predicting porewater pressure changes under cyclic or seismic loading. One solution that has proven effective for solving this problem is the use of energy-based pore pressure models, such as the Green–Mitchell–Polito model [41]. In energy-based pore pressure models, a cyclic laboratory test is used to determine how much energy must be dissipated in the specimen to cause liquefaction. Once this quantity is known, energy-based pore pressure models can then be used to predict pore pressure generation for soils in the field subjected to an earthquake.
Prior to the introduction of energy-based pore pressure generation models in the 1970s, the evaluation of liquefaction and residual excess pore pressure generation were performed using stress-based procedures [42]. Since their introduction, energy-based pore pressure models have continued to be developed (e.g., [43,44,45,46]).
Energy-based pore pressure models work effectively because there is a direct relationship between energy dissipation and pore pressure development in a soil during cyclic loading. Because both energy dissipation and the generation of excess pore pressures both occur as a result of the permanent rearrangement of the soil grains, this relationship can be used as a predictive tool.
The energy dissipated per unit volume of soil is typically normalized by the initial effective confining pressure acting on the soil. This quantity is known as the normalized dissipated energy per unit volume, Ws. Equation (1) can be used to calculate the dissipated energy expended during a cyclic triaxial test [47].
W s = 1 2 σ o i = 1 n 1 σ i + 1 + σ i ε i + 1 ε i  
where i and i + 1 are any two consecutive increments of loading; n is the number of applied load increments; σ is the axial stress acting on the specimen; ε is the axial strain in the specimen and σ′o is the initial mean effective confining stress. Green [47] presents a full derivation of the equation.
During a cyclic direct simple shear test, the dissipated energy can be calculated from the stresses and strains measured in the test using Equation (2) [47].
W s = 1 2 σ o i = 1 n 1 τ i + 1 + τ i γ i + 1 γ i    
where i and i + 1 are any two consecutive increments of loading; n is the number of applied load increments; τ is the shear stress acting on the specimen; γ is the shear strain in the specimen and σ′o is the initial mean effective confining stress. Green [47] presents a full derivation of the equation.
Dissipated energy is a function of the stresses and strains that the specimen experiences under cyclic loading, as may be seen in Equations (1) and (2). It is important to note that the stresses and strains measured in load-controlled and displacement-controlled tests are different, even if the two tests require similar amounts of energy dissipation to trigger liquefaction. As a result of these differences, the energy dissipation and excess pore water generation are also different in load-controlled and displacement-controlled tests.
When performing a load-controlled test, the amplitude of the applied load (typically quantified as a stress) follows a fixed series of values throughout the test; typically those of a repeating sine wave. This may be seen in Figure 3 and Figure 4 for cyclic triaxial and cyclic direct simple shear tests, respectively. Because the applied load maintains a constant pattern, it is the variation in the deformation induced in the specimen (typically quantified as a strain) that controls the amount and timing of the energy dissipated in the specimen and, hence, the amount of pore pressures generated. As pore pressures increase in response to the applied loads, the effective stress acting on the specimen decreases. This decrease in effective stress decreases the specimen’s ability to resist deformation, which results in increasing shear strains in the specimen, even though the pattern of loading does not change. Because of these patterns of load and the resulting displacements, there is little energy dissipated during the early part of the test due to the small levels of deformation in the specimen. Conversely, larger amounts of energy are dissipated in the soil in the later stages of the test, due to the increased displacements.
A different behavior is seen in displacement-controlled cyclic triaxial tests and displacement-controlled cyclic direct simple shear tests. When performing displacement-controlled tests, the amplitude of the applied displacement (typically quantified as a strain) follows a fixed series of values throughout the test; typically, those of a repeating sine wave. This may be seen in Figure 5 and Figure 6 for cyclic triaxial and cyclic direct simple shear tests, respectively. Because the applied displacement maintains a constant pattern, it is the variation in the load induced in the specimen (typically quantified as a stress) that controls the amount of the energy dissipated in the specimen and, hence, the amount of pore pressures generated. As pore pressures increase in response to the applied displacements, the effective stress acting on the specimen decreases. This decrease in effective stress decreases the specimen’s ability to resist deformation, which results in decreasing stresses in the specimen, even though the pattern of loading does not change. Because of these patterns of displacements and the resulting decreasing stresses, most energy is dissipated during the early part of the test due to the specimen’s ability to produce a large resistance to the applied displacement. Conversely, less energy is dissipated in the soil in the later stages of the test, due to the specimen’s decreased ability to resist the applied deformations.
This pattern of large energy dissipation at low cycle ratios and smaller energy dissipation at high cycle ratios observed in the displacement-controlled test is the opposite of the pattern of small energy dissipation at low cycle ratios and larger energy dissipation at high cycle ratios observed in the displacement-controlled test.

2.4. Terminology

When evaluating pore pressure generation under cyclic loading, several ratios are used. These are the cycle ratio, the dissipated energy ratio and the pore pressure ratio.
The cycle ratio, N/NL, is calculated by dividing the cycle of loading, N, by the number of cycles of loading required to liquefy the soil, NL. For example, for the fifth cycle of loading in a test that required twenty cycles of loading to liquefy, N = 5 and NL = 20, thus the cycle ratio would be 5 ÷ 20 = 0.25 [48].
The dissipated energy ratio, Ws/WsL, is calculated by dividing Ws, the cumulative dissipated energy by the amount of dissipated energy required to liquefy the soil, WsL. For example, when 0.0005 kPa of energy has been dissipated in a soil that requires the dissipation of 0.0020 kPa of energy to initiate liquefaction, the dissipated energy ratio would be 0.0005 kPa ÷ 0.0020 kPa = 0.25 [49].
The pore pressure ratio, ru, is calculated by dividing the pore pressure in the specimen, u, by the initial vertical effective stress acting on the specimen, σo′. ru = u/σo′ [48]. In this study, the residual pore pressure ratio will be used as the pore pressure ratio. The residual pore pressure ratio is calculated by dividing the excess pore pressures in the specimen when the applied stress or strain on the sample is zero by the initial effective confining stress.

2.5. Previous Studies

Numerous studies have used cyclic triaxial or cyclic direct simple shear tests to investigate the liquefaction of sands. These studies have used both load-controlled and displacement-controlled tests.
Figure 7 plots the results of two of these studies. In the figure, the pore pressure ratio is plotted against the cycle ratio. Do et al. [50] performed load-controlled tests on Railway sand, a poorly graded clean sand, prepared to a relative compaction of 80%. Polito and Grossman [51] performed displacement-controlled tests on Ottawa C-109 sand, a poorly graded clean sand, prepared to a relative density of 40%.
Two distinct patterns can be seen in Figure 7. The data from the load-controlled tests [50] show pore pressure developing slowly at low cycle ratio but then rapidly as the cycle ratio approaches unity. Conversely, the data from the displacement-controlled tests [51] show pore pressure developing rapidly at low cycle ratios but then less rapidly as the cycle ratio approaches unity.
Similar to Figure 7, Figure 8 plots the results of two of two studies. However, in Figure 8, the pore pressure ratio is plotted against the dissipated energy ratio instead of against the cycle ratio. Khashila et al. [52] performed load-controlled tests on three poorly graded clean sands, prepared to relative densities between 40% and 50%. The data from Polito and Grossman [51] are from the same displacement-controlled tests previously presented in Figure 7.
Only one pattern can be seen in Figure 8. The data from both the load-controlled tests [52] and the displacement-controlled tests [51] show pore pressure developing rapidly at low cycle ratios but then less rapidly as the cycle ratio approaches unity.

3. The Laboratory Testing Program

The laboratory testing portion of this study consisted of index testing, cyclic triaxial testing and cyclic direct simple shear testing. For each cyclic test type, both load-controlled and displacement-controlled tests were performed. Following a brief description of the sand used in this study, the testing procedure utilized will be presented.
Ottawa C-109 sand was used in the test program. It is a poorly graded sand composed predominately of silica. Its index properties are listed in Table 1 [49].
The load-controlled cyclic triaxial tests were performed in accordance with the appropriate ASTM Standard [53]. The displacement-controlled cyclic triaxial tests were performed using the same methodology with the exception of the manner in which the specimen was loaded.
The cyclic triaxial specimens had a diameter of 71 mm, a height of 154 mm and were formed by moist tamping, utilizing undercompaction [54] to ensure uniform density throughout the specimen. The specimens were tested at a relative density of 40%. The specimens were first saturated and then isotropically consolidated to an effective stress of 100 kPa. The specimens were tested by loading them with either a sinusoidally varying axial load or a sinusoidally varying axial displacement at a frequency of 0.10 Hz (a period of 10 s). Liquefaction was defined as occurring at an effective stress acting of 0 kPa.
The cyclic direct simple shear tests were performed in accordance with the appropriate ASTM Standard, which covers both load-controlled and displacement-controlled cyclic direct simple shear tests. [55]. The cyclic direct simple shear specimens had a diameter of 71 mm and a height of 12 mm. The resulting diameter to height ratio of 5.9 is large enough to be considered acceptable in compensating for the absence of the development of complimentary shear stress on the sides of the specimen [20]. The specimens were formed by moist tamping at a water content that produced 25% saturation. This level of saturation was chosen as the water content was high enough to allow consistent specimen formation but not high enough to generate pore pressures during loading. The specimens were tested at a relative density of 40%.
Following specimen preparation, either a shear load or a shear displacement was applied to the specimens at a frequency of 0.10 Hz. Liquefaction was deemed to have occurred when the vertical load applied to the specimen reached 0 kN.

4. Results of Laboratory Testing

Following the completion of the laboratory testing program, the number of loading cycles required to cause liquefaction was determined for each test. Next, the quantity of dissipated energy required to initiate liquefaction was calculated using either Equation (1) or Equation (2). Table 2 contains a brief summary of the results of the laboratory testing. Figure 9, Figure 10, Figure 11 and Figure 12 present the stress and strain data for the tests graphically.
Figure 9 presents the applied axial stresses and the resulting strains from the load-controlled cyclic triaxial test performed. During the test, the specimen was subjected to a single-amplitude cyclic load with a peak of 44 kPa (creating a cyclic stress ratio of 0.22). Liquefaction occurred at 28.1 cycles of loading. During testing, the single-amplitude axial strains varied from 0.06% early in the test to 1.50% near the end of the test. At failure, the total energy that had been dissipated in the specimen was 0.01758.
Figure 10 presents the applied shear stress and the resulting strains from the load-controlled cyclic direct simple test performed. During the test, the specimen was subjected to a single-amplitude cyclic load with a peak of 14 kPa (creating a cyclic stress ratio of 0.07). Liquefaction occurred at 10.0 cycles. During testing, the single-amplitude shear strains varied from 0.01% early in the test to 1.5% near the end of the test. At failure, the total energy that had been dissipated in the specimen was 0.0016.
Figure 11 presents the applied axial strains in the displacement-controlled cyclic triaxial test performed. The resulting stresses are also presented in the figure. The specimen was loaded with a sinusoidally varying single-amplitude shear strain. The shear strain had a maximum value of 0.10%. It took 24.0 cycles of loading to cause liquefaction. During testing, the maximum shear stresses measured varied from 110 kPa early in the test to less than 20 kPa at the end of the test. At failure, the total energy that had been dissipated in the specimen was 0.01767.
Figure 12 presents the applied axial strains in the displacement-controlled cyclic direct simple shear test performed. The resulting shear stresses are also presented in the figure. The specimen was cyclically loaded with a sinusoidally varying single-amplitude shear strain that had a maximum value of 0.10%. It took 9.0 cycles of loading to cause liquefaction. During testing, the maximum shear stresses measured varied from 124 kPa early in the test to 20 kPa at the end of the test. At failure, the total energy that had been dissipated in the specimen was 0.0017.

5. Analysis of Test Results

The data recorded in the lab were examined in two ways. First, a visual comparison of the measured and predicted stress–strain behavior was performed. Next, pore pressure generation was evaluated with a focus on its relationships to the cycle ratio and the dissipated energy ratio.

5.1. Visual Evaluation of Laboratory Test Data

Once the laboratory test data were obtained, they were examined to determine if the measured patterns of stress and strain matched the shapes previously noted in the literature. The pore pressure ratio versus the cycle ratio for the two cyclic triaxial tests performed are plotted in Figure 13. Also plotted in the figure are the data from the literature that were previously plotted in Figure 7. It can be seen that both the load-controlled and the displacement-controlled results match the data from the previous studies well.
The pore pressure ratio versus the cycle ratio for the two cyclic triaxial tests performed are plotted in Figure 14. Also plotted in the figure are the data from the literature that were previously plotted in Figure 8. It can be seen that the displacement-controlled results match the data from the previously studies nicely. The load-controlled data plots above the literature data (i.e., it generates more pore pressures earlier in the loading); however, it shows the same general shape as the literature data.
Once it was established that the test data followed the patterns noted in the literature, the results were then examined to determine if they matched the predicted patterns of stress and strain. This was performed by visually comparing Figure 9, Figure 10, Figure 11 and Figure 12 to Figure 3, Figure 4, Figure 5 and Figure 6.
A comparison of Figure 3 and Figure 9 reveals that the behavior recorded in the lab, presented in Figure 9, closely matched the behavior predicted, shown in Figure 3, for the load-controlled cyclic triaxial test. A similar match can be seen between Figure 4 and Figure 10 for the load-controlled cyclic direct simple shear test.
In the load-controlled tests, as the specimen is loaded, pore pressures are generated. As the pore pressures increase, the effective stress acting on the specimen decreases; this, in turn, decreases the soil’s strength and its ability to resist deformation.
Early on in the loading, while pore pressures are low and effective stress and strength are high, strains are small and little energy is dissipated in the specimen. As loading progresses, pore pressures increase and strains in the specimen also increase, even though the maximum stress amplitude applied to the specimen remains constant. In these later stages of the test, larger amounts of energy are dissipated in the soil due to the increased strains.
A comparison of Figure 5 and Figure 11 reveals that the behavior recorded in the lab, presented in Figure 11, closely matched the behavior predicted, shown in Figure 5, for the displacement-controlled cyclic triaxial test. A similar match can be seen between Figure 6 and Figure 12 for the displacement-controlled cyclic direct simple shear test.
In the displacement-controlled tests, as the specimen is loaded, pore pressures are generated. As excess pore pressures are generated in response to the cyclic loading, the effective stress acting on the specimen decreases. The decrease in effective stress means that the resistance available to resist the applied displacement also decreases. As a result, there is a relatively large amount of energy dissipated during the early part of the test when the resistance to the applied displacement is high. In the later stages of the test, when pore pressures are high and effective stresses are low, the amount of energy dissipated in the soil is lower due to the lower levels of resistance to deformation generated by the specimen.

5.2. Evaluation of Pore Pressure Generation

The results of the load-controlled and the displacement-controlled tests were also examined to ascertain if the differences in loading type resulted in corresponding differences in energy dissipation and pore pressure generation. These analyses were first performed by examining the relationship between the dissipated energy ratio and the cycle ratio for the two test types. Next, the pore pressure ratio and the cycle ratio were evaluated to determine what relationship, if any, existed between them for the two test types. Finally, the pore pressure ratio and the dissipated energy ratio were evaluated to determine what relationship, if any, existed between them for the two test types.
Figure 13 presents the dissipated energy ratio versus the cycle ratio plots for the load-controlled and the displacement-controlled cyclic triaxial tests. Figure 14 presents the residual pore pressure ratio versus the cycle ratio plot for the load-controlled and the displacement-controlled cyclic triaxial tests. Figure 15 presents the residual pore pressure ratio versus dissipated energy ratio plot for the load-controlled and the displacement-controlled cyclic triaxial tests. The stress and strain data from these tests were previously presented in Figure 5 and Figure 7.

6. Discussion of Test Results

In this section the results of the laboratory tests and the pore pressure generation patterns observed will be discussed. Following this discussion, the implications of the finding will be presented.

6.1. Discussion of Pore Pressure Generation Patterns Observed

Figure 15 shows the plot of the dissipated energy ratio versus the cycle ratio for the two cyclic triaxial tests performed. Similarly, Figure 16 shows the plot of the dissipated energy ratio versus the cycle ratio for the two cyclic direct simple shear tests performed. In the load-controlled tests, the dissipated energy ratio increases slowly at low cycle ratios and then increases more rapidly at larger cycle ratios due to the increased level of shear strain that occurs in the specimen towards the end of the test as the effective stress decreases. In the displacement-controlled tests, it can be seen that the dissipated energy ratio increases at a relatively constant rate.
The behaviors observed closely matched to the patterns predicted. Additionally, for the two cyclic triaxial tests, the dissipated energy required for liquefaction differed by less than 1% despite the differences in the loading methods and the patterns of energy dissipation. The dissipated energy required to trigger liquefaction differed by less than 5% for the two cyclic simple shear tests.
Figure 17 presents a plot of the pore pressure ratio vs. the cycle ratio for the load-controlled and displacement-controlled cyclic triaxial tests. The two tests have very different patterns of pore pressure generation. As expected, the displacement-controlled test generated higher excess pore pressures earlier in the loading process when the soil’s ability to resist deformations are greater. Conversely, the load-controlled test generates larger pore pressures in the later phases of loading when the specimen is undergoing high levels of strain. These pore pressure generation patterns also match the expected patterns. In Figure 18, although there is more scatter, the data for the load-controlled and displacement-controlled cyclic direct simple shear tests can be seen to behave in a very similar manner.
In Figure 19, the pore pressure ratio is plotted against the dissipated energy ratio for the cyclic triaxial tests. As can be seen in the figure, the pore pressure generation curves for the load-controlled and displacement-controlled tests are nearly identical when the pore pressure ratio is plotted against the dissipated energy ratio. In Figure 20, although there is more scatter, again, the data from the load-controlled and displacement-controlled cyclic direct simple shear tests can be seen to behave in a similar fashion.
The reason that the load-controlled and displacement-controlled tests yield different pore pressure generation patterns when the pore pressure ratio is plotted against the cycle ratio but yield the same pattern when they are plotted against the dissipated energy ratio is due to the direct relationship between dissipated energy and pore pressure generation. Pore pressure generation is inherently linked to the dissipation of energy into the soil; it is not inherently linked to the number of the cycle of loading or the time at which the energy is dissipated.
Cycles of loading, as reflected in the cycle ratio, can be thought of as a time component, especially for loadings consisting of uniform cycles, such as a repeating sine wave. This means that the pore pressure versus the cycle ratio is essentially a plot of energy dissipation and pore pressure generation with respect to time. Because these factors are linked to time, the pattern of loading, which is also a function of time, affects the pattern of pore pressure generation.
When viewed with respect to time (as quantified by the number of cycles), it matters where in the loading sequence a cycle of loading that produces a larger (or smaller) amount of energy dissipation occurs. A cycle of loading that produces 10% of the energy dissipated and a 10% increase in pore pressure in the test, will result in a very different pore pressure generation patterns if the cycle occurs early in the loading sequence (e.g., at a cycle ratio of 0.1), in the middle of the loading sequence (e.g., at a cycle ratio of 0.5), or late in the loading sequence (e.g., at a cycle ratio of 0.9).
The dissipated energy ratio is independent of time. Because it simply the ratio of the cumulative amount of energy that has been dissipated to the amount of energy that must be dissipated to liquefy the soil, it is independent of both time and the pattern of loading. A cycle of loading that produces 10% of the energy dissipated in the test, simply increases the dissipated energy ratio by 10%; it does not matter when that cycle occurs in the loading sequence due to the dissipated energy ratio not being a function of time.
This is why, when plotted against energy dissipation ratio, load-controlled tests, which dissipate most of their energy late in the loading sequence, produce the same pore pressure ratio pattern as displacement-controlled tests, which dissipate most of their energy early in the loading sequence.
In order to obtain a pore pressure generation curve that is independent of the test type and of the loading conditions, pore pressure generation should be examined in terms of the dissipated energy ratio. When examined this way, a true understanding of a soil’s response to cyclic loading is obtained. The pore pressure generation pattern that is produced will be independent of the details of the loading patterns. Therefore, to obtain a true understanding of a soil’s pore pressure generation response to cyclic loading that is independent of the details of the loading pattern, pore pressure generation should be examined in terms of the dissipated energy ratio or dissipated energy not in terms of the cycle ratio or cycles of loading.

6.2. Implications of This Study’s Findings

The results of this study have three major implication for engineers analyzing pore pressure data produced during cyclic laboratory tests. The first is that whether the laboratory test chosen is load-controlled and displacement-controlled will impact the pore pressure generation patterns observed. These differences in the pore pressure response result solely from the differences in the manner in which the load is applied to the specimen and are independent of properties of the soil being tested.
The second implication is that when examining the test results, one of two different pore pressure generation patterns will be observed when the pore pressure ratio is plotted against either the number of cycles of loading or the cycle ratio. This difference is dependent on whether the test performed was load controlled or displacement controlled.
The third implication of this study’s findings is that by plotting the pore pressure ratio against the dissipated energy ratio, the effect of the type of test control chosen (i.e., either load-controlled or displacement-controlled) is removed and a single pattern of pore pressure generation is observed.
By understanding the effect that the chosen loading type has on the pore pressures measured during the test, the engineer can better able to accurately model pore pressure generation in the field.

7. Conclusions

In this study, energy dissipation patterns were proposed for load-controlled and displacement-controlled cyclic triaxial tests. The same was performed for cyclic direct simple shear tests. Subsequently, these patterns were verified using the results of two cyclic triaxial and two cyclic direct simple shear tests. Finally, the patterns of pore pressure generation with respect to both the cycles of loading and the energy dissipated during the test for load-controlled and displacement-controlled cyclic triaxial and cyclic direct simple shear tests were evaluated using the results from the tests. Finally, an explanation of this behavior was provided.
It was shown that load-controlled and displacement-controlled tests when plotted against the cycle ratio, load-controlled and displacement-controlled tests produced different patterns of pore pressure generation. Conversely, when plotted against the dissipated energy ratio, load-controlled and displacement-controlled tests produced nearly identical patterns of pore pressure generation.
The reason for these different behaviors is that both the cycle ratio and the pattern of loading are functions of time. Because they are both functions of time, pore pressure generation is a function of the loading pattern when examined relative to the cycle ratio.
Conversely, the dissipated energy ratio is solely a function of energy dissipation, and is independent of time. As a result, the pattern of loading, which is a function of time, does not affect the pore pressure generation pattern when the pore pressure ratio is plotted against the dissipated energy ratio. This is because the dissipated energy ratio is only a function of how much energy is dissipated, it is not a function of when the energy is dissipated.

Author Contributions

Analysis, C.P.P.; conceptualization and writing—original draft preparation, C.P.P.; writing—review and editing, C.P.P., Z.Z. and H.H.M.M. All authors have read and agreed to the published version of the manuscript.

Funding

This research received no external funding.

Institutional Review Board Statement

Not applicable.

Informed Consent Statement

Not applicable.

Data Availability Statement

The data used in this study are available by contacting the first author.

Acknowledgments

The first author would like to thank the family of Alfred Sieving and Valparaiso University for the support provided through the Alfred W. Sieving Endowed Chair of Engineering.

Conflicts of Interest

The aforementioned authors declare no conflicts of interest.

References

  1. Umar, M.; Chiaro, G.; Kiyota, T.; Ullah, N. Deformation and cyclic resistance of sand in large-strain undrained torsional shear tests with initial static shear stress. Soils Found. 2021, 61, 765–781. [Google Scholar] [CrossRef]
  2. Zhou, X.Z.; Chen, Y.M.; Li, W.W.; Liu, H.L. Monotonic and cyclic behaviors of loose anisotropically consolidated calcareous sand in torsional shear tests. Mar. Georesources Geotechnol. 2019, 37, 438–451. [Google Scholar] [CrossRef]
  3. Shahnazari, H.; Rezvani, R.; Tutunchian, M.A. Post-cyclic volumetric strain of calcareous sand using hollow cylindrical torsional shear tests. Soil Dyn. Earthq. Eng. 2019, 124, 162–171. [Google Scholar] [CrossRef]
  4. Vargas, R.R.; Ueda, K.; Uemura, K. Influence of the relative density and K0 effects in the cyclic response of Ottawa F-65 sand-cyclic Torsional Hollow-Cylinder shear tests for LEAP-ASIA-2019. Soil Dyn. Earthq. Eng. 2020, 133, 106111. [Google Scholar] [CrossRef]
  5. Chiaro, G.; De Silva, L.I.N.; Koseki, J. Modeling the effects of static shear on the undrained cyclic torsional simple shear behavior of liquefiable sand. Geotech. Eng. J. 2017, 48, 1–9. [Google Scholar]
  6. Wang, J.; Salam, S.; Xiao, M. Evaluation of the effects of shaking history on liquefaction and cone penetration resistance using shake table tests. Soil Dyn. Earthq. Eng. 2020, 131, 106025. [Google Scholar] [CrossRef]
  7. Moss, R.E.S.; Honnette, T.R.; Jacobs, J.S. Large-scale liquefaction and postliquefaction shake table testing. J. Geotech. Geoenviron. Eng. 2020, 146, 04020138. [Google Scholar] [CrossRef]
  8. Ko, Y.Y.; Chen, C.H. On the variation of mechanical properties of saturated sand during liquefaction observed in shaking table tests. Soil Dyn. Earthq. Eng. 2020, 129, 105946. [Google Scholar] [CrossRef]
  9. Jahed Orang, M.; Motamed, R.; Prabhakaran, A.; Elgamal, A. Large-scale shake table tests on a shallow foundation in liquefiable soils. J. Geotech. Geoenviron. Eng. 2021, 147, 04020152. [Google Scholar] [CrossRef]
  10. Basu, D.; Montgomery, J.; Stuedlein, A.W. Observations and challenges in simulating post-liquefaction settlements from centrifuge and shake table tests. Soil Dyn. Earthq. Eng. 2022, 153, 107089. [Google Scholar] [CrossRef]
  11. Ye, B.; Xie, X.; Zhao, T.; Song, S.; Ma, Z.; Feng, X.; Wang, H. Centrifuge tests of macroscopic and mesoscopic investigation into effects of seismic histories on sand liquefaction resistance. J. Earthq. Eng. 2022, 26, 4302–4324. [Google Scholar] [CrossRef]
  12. Ye, B.; Zhang, L.; Wang, H.; Zhang, X.; Lu, P.; Ren, F. Centrifuge model testing on reliquefaction characteristics of sand. Bull. Earthq. Eng. 2019, 17, 141–157. [Google Scholar] [CrossRef]
  13. Darby, K.M.; Boulanger, R.W.; DeJong, J.T.; Bronner, J.D. Progressive changes in liquefaction and cone penetration resistance across multiple shaking events in centrifuge tests. J. Geotech. Geoenviron. Eng. 2019, 145, 04018112. [Google Scholar] [CrossRef]
  14. Gu, X.; Wu, D.; Zuo, K.; Tessari, A. Centrifuge shake table tests on the liquefaction resistance of sand with clayey fines. J. Geotech. Geoenviron. Eng. 2022, 148, 04021180. [Google Scholar] [CrossRef]
  15. Carey, T.; Chiaradonna, A.; Love, N.; Wilson, D.; Ziotopoulou, K.; Martinez, A.; DeJong, J. Effect of soil gradation on embankment response during liquefaction: A centrifuge testing program. Soil Dyn. Earthq. Eng. 2022, 157, 107221. [Google Scholar] [CrossRef]
  16. Seed, H.B.; Lee, K.L. Liquefaction Of Saturated Sands During Cyclic Loading. J. Soil Mech. Found. Div. 1966, 92, 105–134. [Google Scholar] [CrossRef]
  17. Seed, H.B.; Idriss, I.M. Ground Motions and Soil Liquefaction during Earthquakes; Earthquake Engineering Research Institute: Oakland, CA, USA, 1982; p. 134. [Google Scholar]
  18. Finn, W.; Vaid, Y.; Bhatia, S.K. Constant Volume Cyclic Simple Shear Testing. In Proceedings of the Second International Conference on Microzonation for Safer Construction: Research and Applications, San Francisco, CA, USA, 26 November–1 December 1978. [Google Scholar]
  19. Finn, W.D.L. Aspects of constant volume cyclic simple shear. In Proceedings of the Advances in the Art of Testing of Soils Under Cyclic Conditions, Detroit, MI, USA, 24 October 1985; American Society of Civil Engineers: New York, NY, USA; 1985; pp. 74–98. [Google Scholar]
  20. Franke, E.; Kiekbusch, M.; Schuppener, B. A new direct simple shear device. Geotech. Test. J. 1979, 2, 190–199. [Google Scholar] [CrossRef]
  21. Lentini, V.; Castelli, F. Liquefaction resistance of sandy soils from undrained cyclic triaxial tests. Geotech. Geol. Eng. 2019, 37, 201–216. [Google Scholar] [CrossRef]
  22. Zhu, Z.; Zhang, F.; Peng, Q.; Dupla, J.C.; Canou, J.; Cumunel, G.; Foerster, E. Effect of the loading frequency on the sand liquefaction behaviour in cyclic triaxial tests. Soil Dyn. Earthq. Eng. 2021, 147, 106779. [Google Scholar] [CrossRef]
  23. Hwang, B.; Han, J.T.; Kim, J.; Kwak, T.Y. Liquefaction characteristic of Pohang sand based on cyclic triaxial test. J. Korean Geotech. Soc. 2020, 36, 21–32. [Google Scholar]
  24. Liu, J. Influence of fines contents on soil liquefaction resistance in cyclic triaxial test. Geotech. Geol. Eng. 2020, 38, 4735–4751. [Google Scholar] [CrossRef]
  25. Jain, A.; Mittal, S.; Shukla, S.K. Liquefaction proneness of stratified sand-silt layers based on cyclic triaxial tests. J. Rock Mech. Geotech. Eng. 2023, 15, 1826–1845. [Google Scholar] [CrossRef]
  26. Polito, C.P.; Martin, J.R., II. Effects of nonplastic fines on the liquefaction resistance of sands. J. Geotech. Geoenviron. Eng. 2001, 127, 408–415. [Google Scholar] [CrossRef]
  27. Polito, C.; Green, R.A.; Dillon, E.; Sohn, C. Effect of load shape on relationship between dissipated energy and residual excess pore pressure generation in cyclic triaxial tests. Can. Geotech. J. 2013, 50, 1118–1128. [Google Scholar] [CrossRef]
  28. Kokusho, T.; Tanimoto, S. Energy capacity versus liquefaction strength investigated by cyclic triaxial tests on intact soils. J. Geotech. Geoenviron. Eng. 2021, 147.4, 04021006. [Google Scholar] [CrossRef]
  29. Nong, Z.Z.; Park, S.S.; Lee, D.E. Comparison of sand liquefaction in cyclic triaxial and simple shear tests. Soils Found. 2021, 61, 1071–1085. [Google Scholar] [CrossRef]
  30. Mele, L.; Lirer, S.; Flora, A. The effect of confinement in liquefaction tests carried out in a cyclic simple shear apparatus. E3S Web Conf. 2019, 92, 08002. [Google Scholar] [CrossRef]
  31. Jin, H.; Guo, L. Effect of phase difference on the liquefaction behavior of sand in multidirectional simple shear tests. J. Geotech. Geoenviron. Eng. 2021, 147, 06021015. [Google Scholar] [CrossRef]
  32. Porcino, D.D.; Triantafyllidis, T.; Wichtmann, T.; Tomasello, G. Application of critical state approach to liquefaction resistance of sand–silt mixtures under cyclic simple shear loading. J. Geotech. Geoenviron. Eng. 2021, 147, 04020177. [Google Scholar] [CrossRef]
  33. Tomasello, G.; Porcino, D.D. Influence of sloping ground conditions on cyclic liquefaction behavior of sand under simple shear loading. Soil Dyn. Earthq. Eng. 2022, 163, 107516. [Google Scholar] [CrossRef]
  34. Cappellaro, C.; Cubrinovski, M.; Bray, J.D.; Chiaro, G.; Riemer, M.F.; Stringer, M.E. Liquefaction resistance of Christchurch sandy soils from direct simple shear tests. Soil Dyn. Earthq. Eng. 2021, 141, 106489. [Google Scholar] [CrossRef]
  35. Park, S.S.; Nong, Z.Z.; Lee, D.E. Effect of vertical effective and initial static shear stresses on the liquefaction resistance of sands in cyclic direct simple shear tests. Soils Found. 2020, 60, 1588–1607. [Google Scholar] [CrossRef]
  36. Zhou, L.; Chen, J.F.; Peng, M.; Zhu, Y. Liquefaction behavior of fiber-reinforced calcareous sands in unidirectional and multidirectional simple shear tests. Geotext. Geomembr. 2022, 50, 794–806. [Google Scholar] [CrossRef]
  37. Mijic, Z.; Bray, J.D.; Riemer, M.F.; Rees, S.D.; Cubrinovski, M. Cyclic and monotonic simple shear testing of native Christchurch silty soil. Soil Dyn. Earthq. Eng. 2021, 148, 106834. [Google Scholar] [CrossRef]
  38. Booker, J.R.; Rahman, M.S.; Seed, H.B. GADFLEA—A Computer Program for the Analysis of Pore Pressure Generation and Dissipation During Cyclic or Earthquake Loading; EERC 76-24; University of California: Berkeley, CA, USA, 1976. [Google Scholar]
  39. Dobry, R.; Ladd, R.; Yokel, F.; Chung, R.; Powell, D. Prediction of Pore Water Pressure Buildup and Liquefaction of Sands during Earthquakes by the Cyclic Strain Method; NBS Building Science Series 138; National Bureau of Standards, US Department of Commerce: Washington, DC, USA, 1982.
  40. Hubler, J.; Athanasopoulos-Zekkos, A.; Zekkos, D. Monotonic and cyclic simple shear response of gravel-sand mixtures. Soil Dyn. Earthq. Eng. 2018, 115, 291–304. [Google Scholar] [CrossRef]
  41. Green, R.A.; Mitchell, J.K.; Polito, C.P. An energy-based pore pressure generation model for cohesionless soils. In Proceedings of the John Booker Memorial Symposium—Developments in Theoretical Geomechanics, Balkema, Rotterdam, The Netherlands, 16–17 November 2000; pp. 383–390. [Google Scholar]
  42. Seed, H.B.; Idriss, I.M. Simplified Procedure For Evaluation Soil Liquefaction Potential. J. Soil Mech. Found. Div. 1971, 97, 1249–1273. [Google Scholar] [CrossRef]
  43. Nemat-Nasser, S.; Shokooh, A. A Unified Approach to Densification and Liquefaction of Cohesionless Sand in Cyclic Shearing. Can. Geotech. J. 1979, 16, 659–678. [Google Scholar] [CrossRef]
  44. Berrill, J.B.; Davis, R.O. Energy Dissipation and Seismic Liquefaction of Sands: Revised Model. Soils Found. 1985, 25, 106–118. [Google Scholar] [CrossRef]
  45. Tomasello, G.; Porcino, D.D. Energy-Based Pore The prediction of pore pressure build-up by an energy-based model calibrated from the results of in-situ tests. In Proceedings of the Conference on Performance-based Design in Earthquake. Geotechnical Engineering, Beijing, China, 15–17 July 2022; pp. 1622–1629. [Google Scholar]
  46. Green, R.A. Energy-Based Evaluation and Remediation of Liquefiable Soils. Ph.D. Thesis, Department of Civil Engineering, Virginia Polytechnic Institute and State University, Blacksburg, VA, USA, 2001. [Google Scholar]
  47. Karakan, E.; Tanrinian, N.; Sezer, A. Cyclic undrained behavior and post liquefaction settlement of a nonplastic silt. Soil Dyn. Earthq. Eng. 2019, 120, 214–227. [Google Scholar] [CrossRef]
  48. Polito, C.; Martin, J.R. Dissipated Energy and Pore-pressure-generation patterns in Sands and Non-Plastic Silts Subjected to Cyclic Loadings. Geotechnics 2024, 4, 264–284. [Google Scholar] [CrossRef]
  49. Polito, C.; Sibley, E. Threshold Fines Content and the Behavior of Sands with Non-Plastic Silt. Can. Geotech. J. 2020, 57, 462–465. [Google Scholar] [CrossRef]
  50. Do, T.; Laue, J.; Mattson, H.; Jia, Q. Excess pore water pressure generation in fine granular materials under undrained cyclic triaxial loading. Int. J. Geo-Eng. 2023, 14, 8. [Google Scholar] [CrossRef]
  51. Polito, C.; Grossman, J. The Effect off Height to Diameter Ratio on Cyclic Triaxial Tests. In Proceedings of the GeoSaskatoon 2023, Saskatoon, SK, Canada, 1–4 October 2023. [Google Scholar]
  52. Khashila, M.; Hussien, M.N.; Karray, M.; Chekired, M. Liquefaction resistance from cyclic simple and triaxial shearing: A comparative study. Acta Geotech. 2021, 16, 1735–1753. [Google Scholar] [CrossRef]
  53. D5311/D5311M-13; Standard Test Method for Load-Controlled Cyclic Triaxial Strength of Soil. ASTM International: West Conshohocken, PA, USA, 2013.
  54. Ladd, R.S. Preparing Test Specimens Using Undercompaction. Geotech. Test. J. 1978, 1, 16–23. [Google Scholar] [CrossRef]
  55. D8296-19; Standard Test Method for Consolidated Undrained Cyclic Direct Simple Shear Test under Constant Volume with Load Control or Displacement Control. ASTM International: West Conshohocken, PA, USA, 2013.
Figure 1. Stress conditions and total stress path for cyclic triaxial tests. Condition (a) represents the isotropic case, (b) represents a compressive deviator stress and (c) represents a tensile deviator stress.
Geotechnics 04 00052 g001
Figure 2. Stress conditions and total stress path for a cyclic simple test.
Geotechnics 04 00052 g002
Figure 3. Proposed loads and displacements in a load-controlled cyclic triaxial test.
Geotechnics 04 00052 g003
Figure 4. Proposed loads and displacements in a load-controlled cyclic direct simple shear test.
Geotechnics 04 00052 g004
Figure 5. Proposed loads and displacements in a displacement-controlled cyclic triaxial test.
Geotechnics 04 00052 g005
Figure 6. Proposed loads and displacements in a displacement-controlled cyclic direct simple shear test.
Geotechnics 04 00052 g006
Figure 7. The pore pressure ratio vs. the cycle ratio for load-controlled (Do et al. [50]) and displacement-controlled (Polito and Grossman [51]) cyclic triaxial tests.
Geotechnics 04 00052 g007
Figure 8. The pore pressure ratio vs. the cycle ratio for load-controlled (Khashila et al. [52]) and displacement-controlled (Polito and Grossman [51]) cyclic triaxial tests.
Geotechnics 04 00052 g008
Figure 9. Measured stresses and strains in the load-controlled cyclic triaxial test.
Geotechnics 04 00052 g009
Figure 10. Measured stresses and strains in the load-controlled cyclic direct simple shear test.
Geotechnics 04 00052 g010
Figure 11. Measured stresses and strains in the displacement-controlled cyclic triaxial test.
Geotechnics 04 00052 g011
Figure 12. Measured stresses and strains in the displacement-controlled cyclic direct simple shear test.
Geotechnics 04 00052 g012
Figure 13. Comparison of results from this study versus data from the literature in terms of the cycle ratio.
Geotechnics 04 00052 g013
Figure 14. Comparison of results from this study versus data from the literature in terms of the dissipated energy ratio.
Geotechnics 04 00052 g014
Figure 15. The dissipated energy ratio as a function of the cycle ratio for the load-controlled and the displacement-controlled cyclic triaxial tests.
Geotechnics 04 00052 g015
Figure 16. The dissipated energy ratio as a function of the cycle ratio for the load-controlled and the displacement-controlled cyclic direct simple shear tests.
Geotechnics 04 00052 g016
Figure 17. The residual pore pressure ratio as a function of the cycle ratio for the load-controlled and the displacement-controlled cyclic triaxial tests.
Geotechnics 04 00052 g017
Figure 18. The residual pore pressure ratio as a function of the cycle ratio for the load-controlled and the displacement-controlled cyclic direct simple shear tests.
Geotechnics 04 00052 g018
Figure 19. The residual pore pressure ratio as a function of the dissipated energy ratio for the load-controlled and the displacement-controlled cyclic triaxial tests.
Geotechnics 04 00052 g019
Figure 20. The residual pore pressure ratio as a function of the dissipated energy ratio for the load-controlled and the displacement-controlled cyclic direct simple shear tests.
Geotechnics 04 00052 g020
Table 1. Properties of Ottawa C-109 Sand.
Soil PropertyValue
Specific Gravity, Gs2.65
Median Grain Size, D50 (mm)0.39
Coefficient of Uniformity, Cu1.91
Coefficient of Curvature, Cc0.95
Maximum Index Void Ratio, emax0.688
Minimum Index Void Ratio, emin0.436
Table 2. Summary of laboratory test results.
Test
Type
Method of Test ControlCSR or Applied Shear StrainCycles to Cause Liquefaction NLNDEPUV Ws,LProposed
Behavior
Measured Behavior
CTXstress0.2228.10.01758Figure 3Figure 9
strain0.10%24.00.01767Figure 5Figure 11
CDSSstress0.0710.00.0016Figure 4Figure 10
strain0.10%9.00.0017Figure 6Figure 12
Disclaimer/Publisher’s Note: The statements, opinions and data contained in all publications are solely those of the individual author(s) and contributor(s) and not of MDPI and/or the editor(s). MDPI and/or the editor(s) disclaim responsibility for any injury to people or property resulting from any ideas, methods, instructions or products referred to in the content.

