1. Introduction
Geotechnical structures are a key component of almost all infrastructure projects and are therefore of utmost importance to the economy of any country. Geosynthetics are known to be an efficient and cost-effective solution for many geotechnical structures. Geosynthetics are manufactured polymeric materials used with soil, rock, and other earth-related materials as an integral part of a project or system. Reinforcements are used to produce a soil–geosynthetic composite that has improved strength and deformation properties over unreinforced soil. There are many applications (e.g., transportation, environmental, hydraulics) where geosynthetics are used as reinforcement [
1], with economic, performance, and environmental advantages. The design and analysis of structures with geosynthetic-reinforced soil are often carried out using numerical simulations, an approach that nevertheless presents unique challenges. The use of methodologies based on modeling and numerical simulation is grounded in the fact that the conventional design of geosynthetic structures is commonly conservative. For example, one study [
2] showed that the analytic design of geosynthetic-reinforced soil walls using the North American standard was extremely conservative, underestimating the geosynthetic performance by 50%. A more recent comparison [
3] of analytical methods provided by technical standards also showed considerable overestimation of the loads acting on the reinforcement.
There are many recurring difficulties in geosynthetic-reinforced soil (GRS) modeling as reported by the literature. Large deformations in unreinforced and reinforced geotechnical structures can occur in soft soils and, in these cases, the finite element method (FEM) can prove somewhat limited due to mesh distortion issues [
4,
5]. Mesh distortion arises when the elements of the computed mesh become excessively deformed under the presence of large deformations. This distortion leads to several problems. Firstly, the quality of the elements degrades, as elements that are initially well-shaped become skewed or stretched, reducing the accuracy of the model representation. Secondly, distorted elements can cause numerical instability, making the stiffness matrix poorly conditioned and leading to significant errors in the results, because the integration points and finite element shape functions may no longer be appropriately distributed.
Due to the relatively scarce amount of reported large-scale controlled and properly instrumented GRS structures, many numerical modeling attempts are validated with simple limit equilibrium methods, which can lead to a conservative estimation of the forces acting on the reinforcement [
6,
7]. Even fewer studies, e.g., [
8,
9,
10], have proposed a FEM model that was directly compared to experimentally measured data of soil and reinforcement, and there are often disparities in magnitude and tendencies between the predicted and measured values.
Since the construction and monitoring of large-scale and full-scale GRS structures are expensive and time-consuming, reduced-scale experiments have been proposed to analyze the stress distribution within the reinforcement. In [
11], the authors showcased that there are discrepancies when evaluating the stress concentrations and their distributions on reduced-scale structures in comparison with full-scale experimental data from the literature. There are several causes for such discrepancies. For example, the stress level on small-scale models is significantly lower than in full-scale structures. Moreover, their study pointed out several cases where the standards grossly underestimated the stress concentration ratio on the reduced-scale models. This indicates that a high level of non-linearity can be a determining factor in the scalability of a model.
One of the most important aspects of the design of geotechnical structures for both reinforced and unreinforced soils is the selection of failure criteria and the corresponding constitutive models. This applies to both soils and reinforcements. The tensile response of geosynthetics is nonlinear for both the short- and long-term, hence corresponding nonlinear models should be applied to better represent the behavior of these elements [
12]. Geosynthetics can be defined by physical or numerical models, whether there is a correlation between the model parameters and the material properties (physical) or not (numerical). Physical models are of particular interest, since they are derived from equations that can be correlated with material properties. A common modeling approach is to define a linear stiffness from standardized in-isolation wide-width tensile tests, e.g., according to ISO-10319:2015 [
13]. However, the true performance of a geosynthetic reinforcement under in situ operational conditions is unlikely to be reflected by an in-isolation rapid test [
14]. Moreover, it is common to adopt simplifications of the geometry of the reinforcement, namely on geogrids and geonets. To reduce the model complexity when dealing with reinforcements that contain apertures, an equivalent 2D shell/membrane is sometimes adopted [
15,
16].
Geosynthetics are considered elasto-viscoplastic materials; their durability is another key feature of their design. Thus, realistic constitutive models for representing the response of geosynthetics should also allow for the effects of durability issues. For geosynthetic reinforcements, the design is often based on the short-term tensile strength affected by reduction factors that represent the effects of different degradation agents and mechanisms. In GRS structures, mechanical damage associated with field installation is a major aspect of durability. In addition, because of their time-dependent response, in design, it is common to affect the tensile strength of geosynthetics by a reduction factor representing the effect of creep. There are also additional reduction factors that can be applied if needed: seams and dynamic influences; as well as the influence of atmospheric, chemical, and biological agents can also represented by reduction factors. Thus, current design methods apply reduction factors to the ultimate short-term tensile strength, by including relevant reduction factors that represent the effect of a single agent or mechanism affecting the tensile strength of the reinforcement, which results in an allowable tensile strength. However, this approach is known to be conservative, since not only the admissible strength is affected by the combination of reduction factors, but also the serviceability and failure patterns [
17,
18].
This paper aims to provide a comprehensive literature review on the latest (2005–2023) three-dimensional (3D) GRS numerical modeling studies. The proposed review features relevant information on the following:
Whether the available numerical models are backed by experimental data;
The covered simulation goals of each referred approach (e.g., working conditions (SLS), predict ultimate limit state, (ULS), results or carry out parametric analysis);
Relevant constitutive models for geosynthetic and soils;
Consideration of soil–geosynthetic interaction.
4. Literature Review on 3D Modeling of GRS for Reinforcement
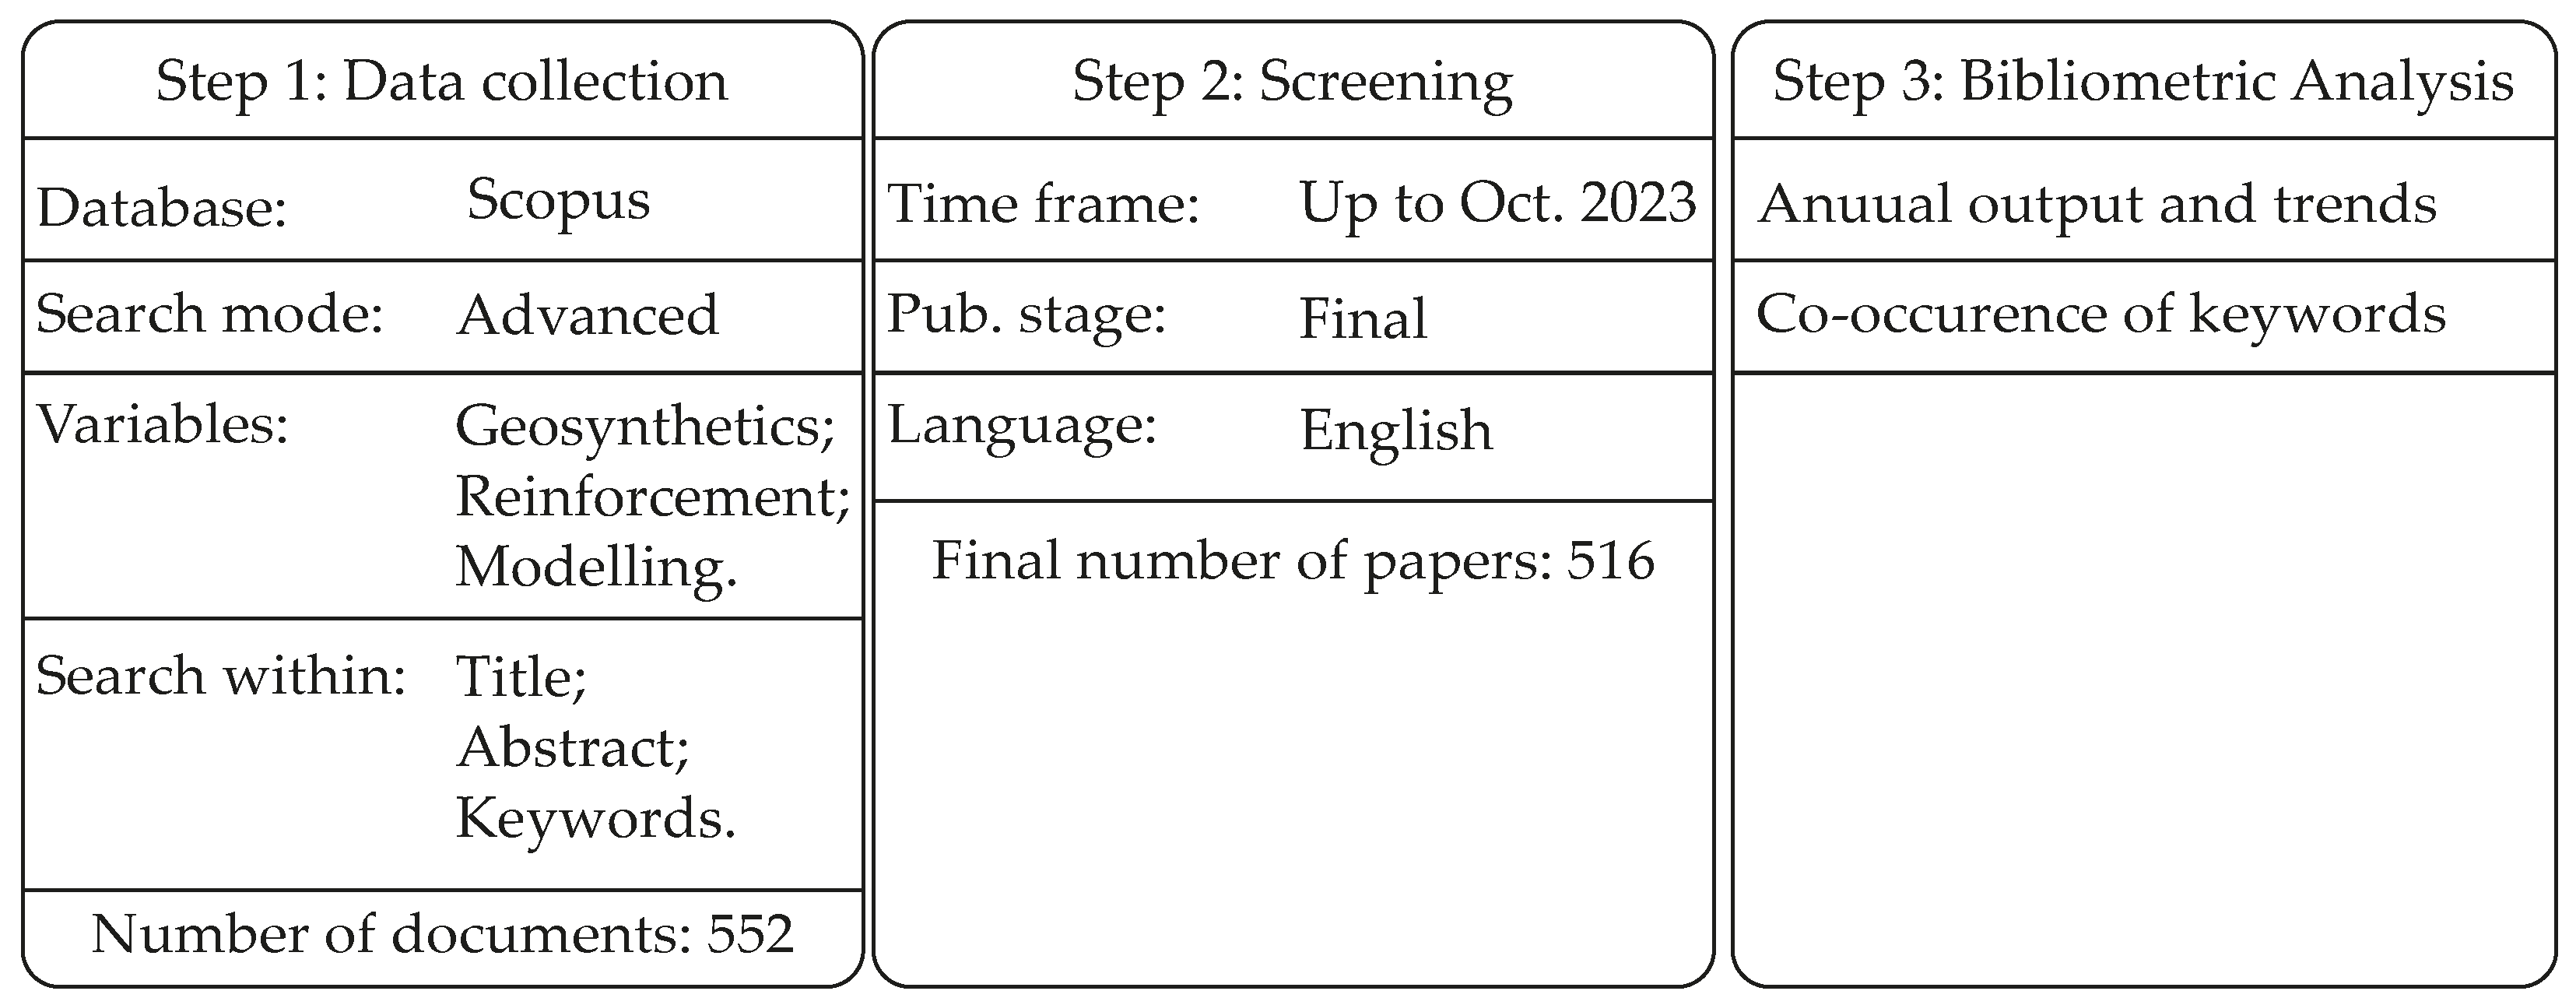
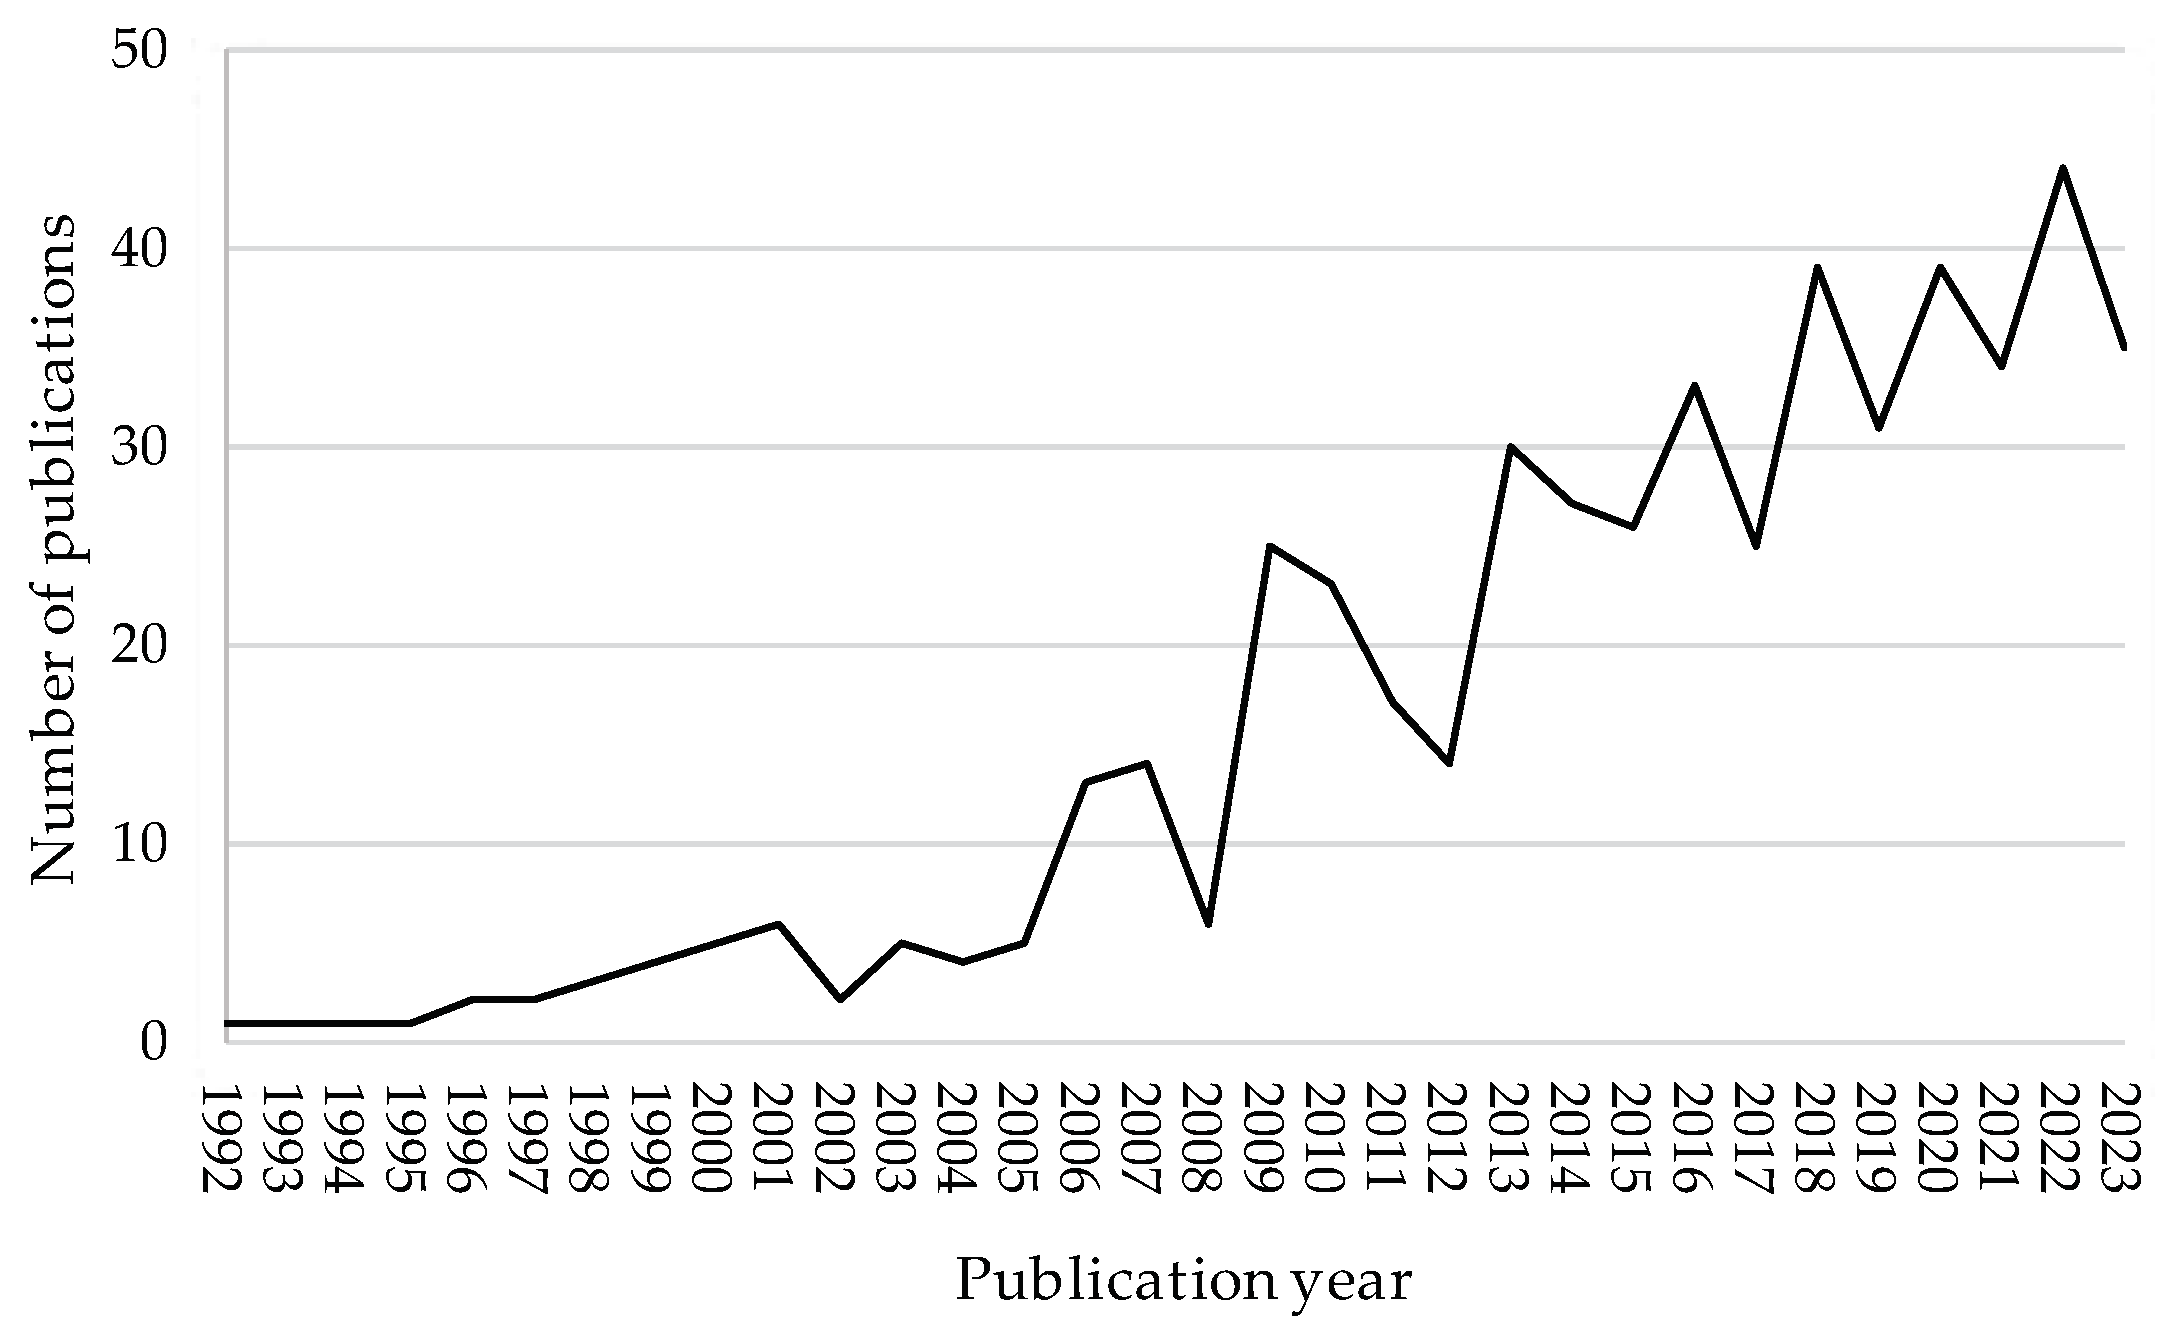
Between 2005 and 2023, 3D numerical modeling in GRS became increasingly significant for understanding soil–structure interactions and predicting the behavior of these systems. This chapter presents a comprehensive literature review on the topic, highlighting key aspects of the papers found in the bibliometric analysis performed. A brief description of each model is hereby presented, highlighting the validity of the numerical models, specifically whether they were supported by the experimental data. Additionally, the review examines the specific objectives of each study, from replicating actual working conditions to predicting ULS outcomes or conducting parametric analyses. A primary focus was given to the choice of constitutive models and numerical formulations for representing both geosynthetics and soil, given its importance in ensuring the accuracy of model predictions. Furthermore, this review evaluated the consideration given to the interactions between soil and geosynthetic materials, whenever such properties were defined.
Huang et al. [
27] reported one of the first 3D modeling attempts to analyze the performance of embankments over soft soil using the Fast Lagrangian Analysis of Continua (FLAC
©) 2.1 package. This model aimed to replicate the working conditions of a real embankment that was instrumented and monitored. The model included a 6-pile embankment, reinforced with three geogrid layers. The EPPMC model was used to represent the soil and fill materials. A custom type of shell element built in the FLAC
© package was used to model the geogrid element, assuming an isotropic response. The soil–geogrid interface was not modeled. The simulation included the construction phases by adding the embankment fill-in layers. The model was able to predict settlement with reasonable accuracy, but predictions of horizontal displacements did not adjust the experimental data. The linear-elastic isotropic model used to represent the geogrid overestimated the distribution of tensile forces acting on the geogrid when compared to the measured data.
In reference [
28], a study of geosynthetics in pavement foundations with the software Automatic Dynamic Incremental Nonlinear Analysis (ADINA
©) is presented. A theoretical (not backed by experimental data) parametric study was carried out to optimize the reinforcement layer position within the pavement composition. Three-dimensional models are particularly useful for pavement analysis, accounting for the complex behavior of the composite structure and allowing the simulation of the rectangular footprint of the loading wheel. The geogrid was layer assumed to act as a linear isotropic elastic material modeled by a membrane element with four nodes and only in-plane tension stresses. The granular base was modeled with a Drucker–Prager (elasto-plastic) envelope, and for the subgrade, the CamClay model (elasto-plastic) was used. The biggest limitation reported was regarding the pullout behavior due to shear stresses, since the model did not account for the slippage/friction between the material layers. The simulation showed that the optimal position of the reinforcement was conditioned to the base stiffness and thickness, with reductions in fatigue strains between 10% and 48%. Although the inclusion of a geogrid for this pavement foundation greatly improved the strain performance, large discrepancies were reported when comparing the fatigue strain reductions with similar results from the literature.
Hello and Villard [
29] focused on the load transfer mechanisms of geosynthetic and pile-reinforced embankments with YADE
© software. Their study featured a coupled FEM and discrete element method (DEM) approach that maximized the accuracy of the response by using finite elements for the structure and geotextile, but discrete elements to simulate the soil. FEM is broadly (and efficiently) used to model not only structural elements but also discrete elements such as soils. However, the discontinuous nature of the soil that interacts with a geogrid could be better explored with DEM elements, that perform well for soil analysis, but cannot fully capture the “continuous” structural components due to micro-voids. The soil particles were modeled in YADE
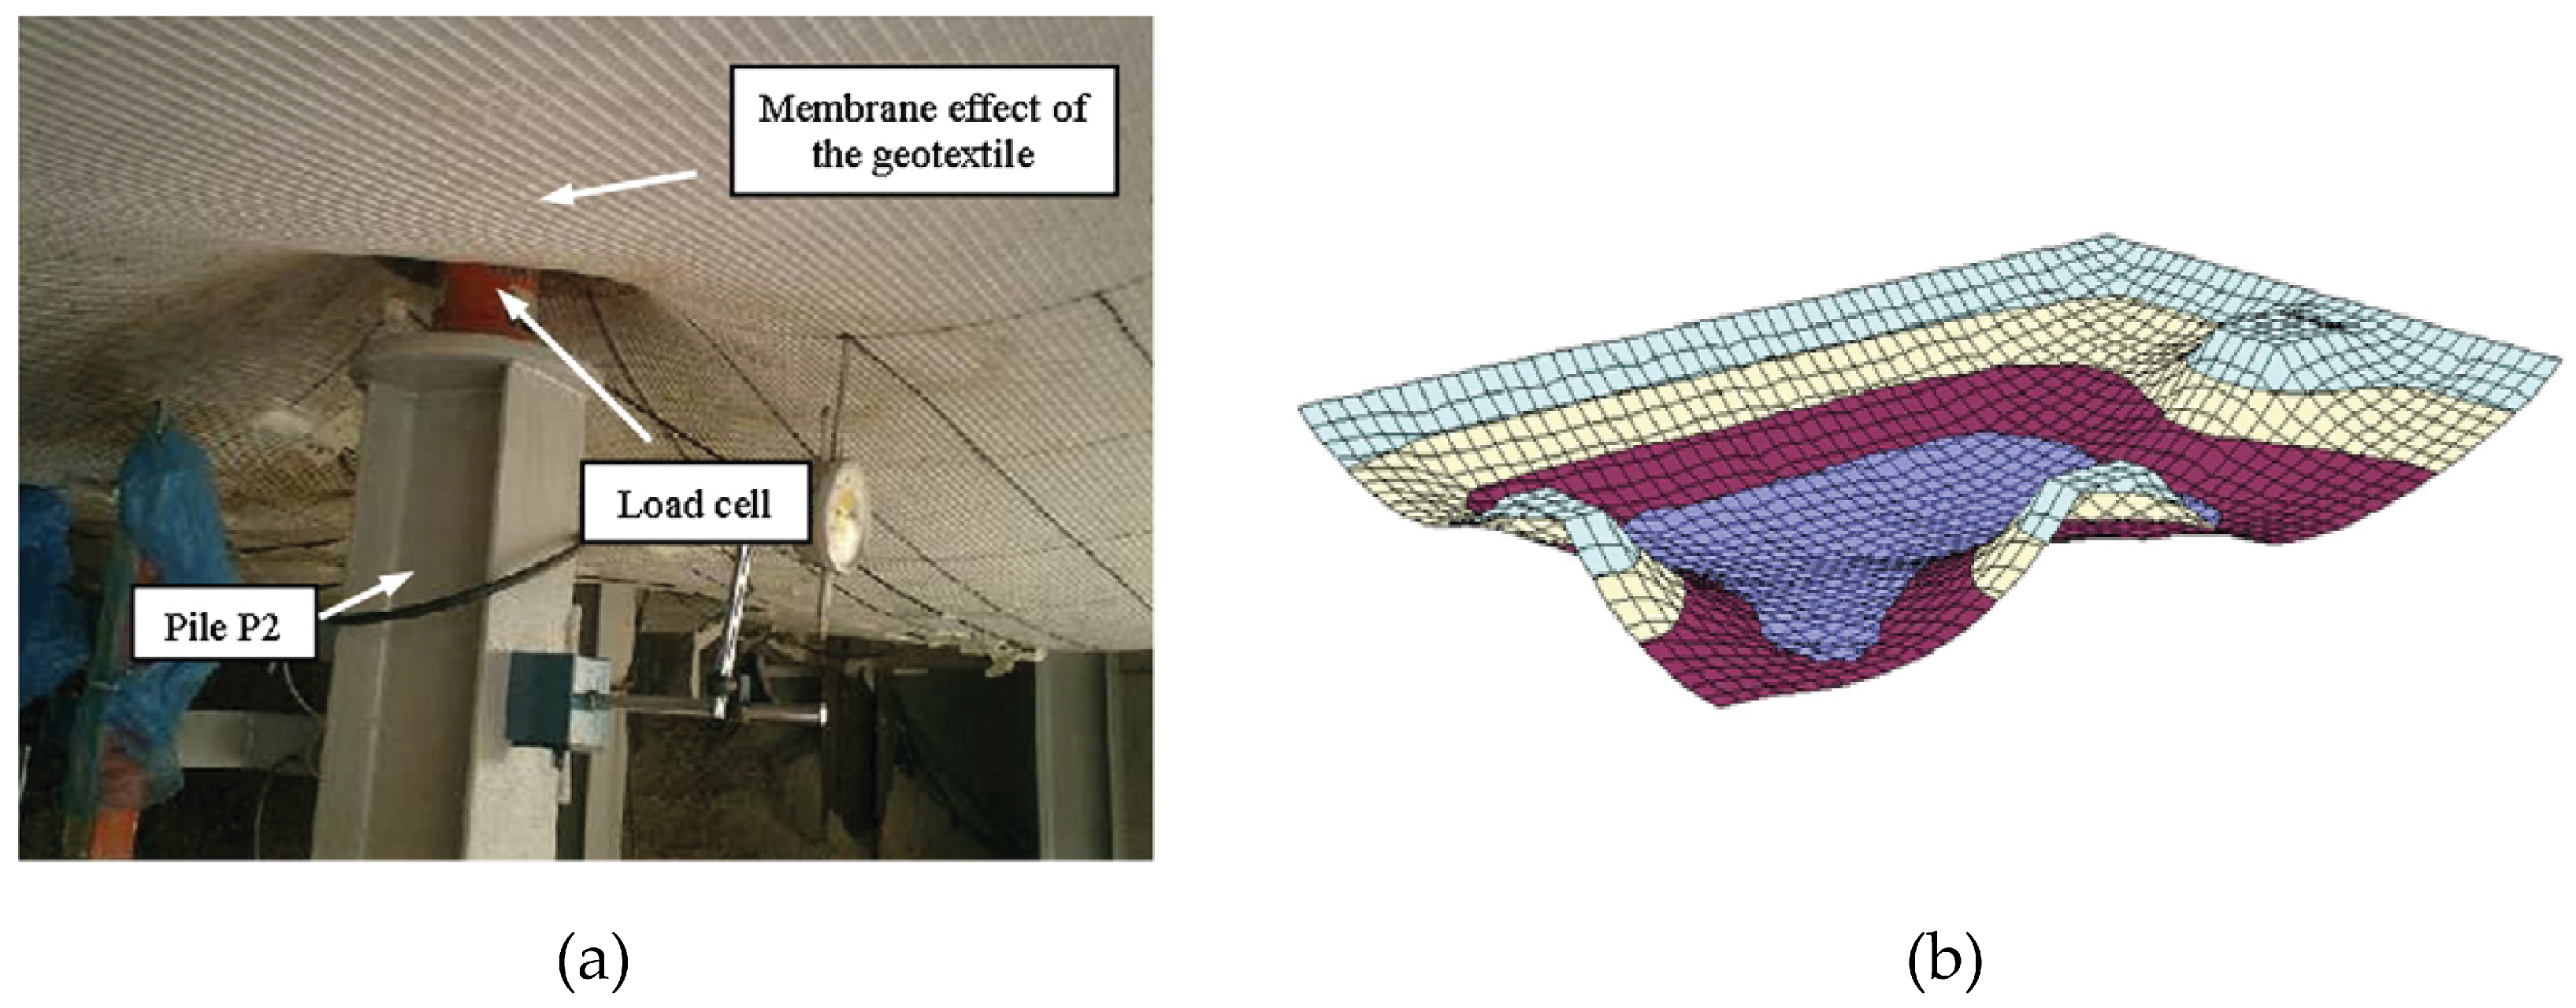
© according to Newton’s laws of motion, requiring the definition of the macro-mechanical parameters (granular distribution and porosity) and micro-mechanical parameters (friction angle, normal, and tangential rigidity). The geotextile was modeled using 3-node finite elements that captured the membrane behavior of tensile strength with no rigidity to bending. Contact laws between particles governed how these two types of components interacted. The micro-mechanical parameters needed to characterize the geosynthetic sheet and its interaction with discrete particles were a normal and tangential rigidity of contact and a friction angle between the geotextile and soil. A parametric study was carried out to evaluate the two main mechanisms of piles, i.e., the arching effect and the membrane effect of the geotextile. The model was also compared against analytical and experimental results. The coupled FEM–DEM analysis was able to successfully represent the arching effect and membrane resistance (
Figure 6) of piles reinforced with geotextiles. The vertical displacements obtained by the numerical model were very close to the experimental results, while the load measured on the piles was slightly higher for the simulation [
29].
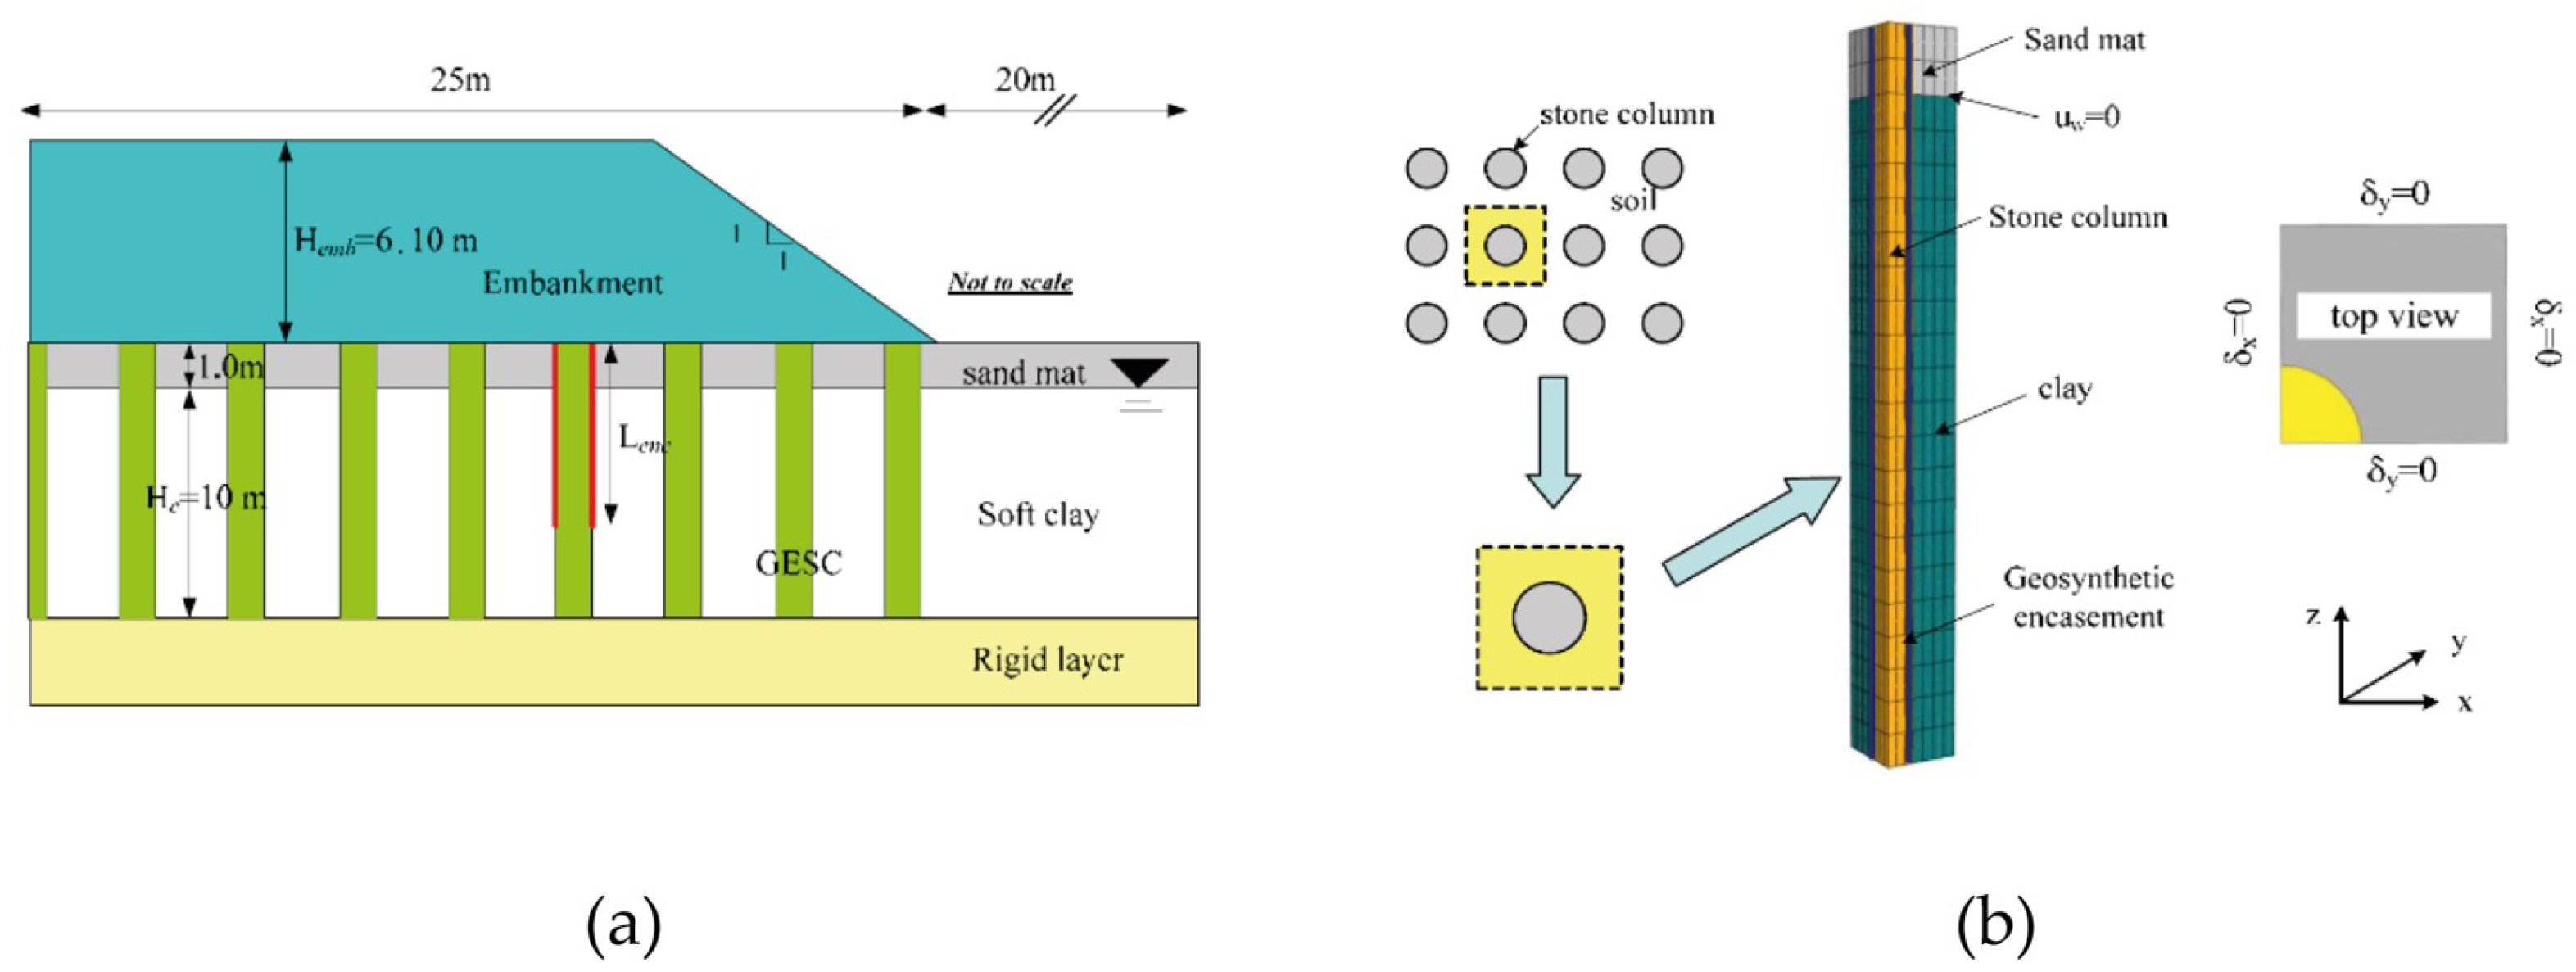
A numerical investigation of the performance of geosynthetic-encased stone columns (GESC) for an embankment was presented in [
30]. The study featured a real GESC embankment to calibrate the numerical model (cross-section
Figure 7, then a parametric analysis was conducted to evaluate the influence of mechanical properties (consistency of soft ground, stiffness of geosynthetic) and geometrical properties (length of encasement, area replacement ratio) on the obtained results. Soil elements, such as clay, stone, and fill, were modeled inABAQUS
© with twenty node pore-pressure elements (designated C3D20RP) using a modified CamClay model (for the clay) and the EPPMC model (stone and fill). The geosynthetic was represented by an 8-node membrane element (designated M3D8R) as a linear-elastic material without bending stiffness. No pore-pressure was assumed to develop between interfaces; thus, no interaction/interface laws were defined. The parametric study demonstrated the impact of the geosynthetic stiffness on the development of the pore pressure, which could be related to the embankment load transfer mechanism (stiffer geosynthetics decreased deformations and increased load bearing). Lateral bulging was also considerably decreased due to confinement by the encasement. The parametric data also suggested that the benefit of a stiffer geosynthetic reached a limit value (for this case, between approximately 1500 and 2000 kN/m), at which no meaningful resistance was added for further increases in stiffness.
A comprehensive 3D FEM analysis of four different embankment solutions validated by field data was reported by [
31]. Four instrumented sections were constructed: (i) an embankment without piles or reinforcement, (ii) an unreinforced pile-supported embankment, (iii) an embankment with pile-support and a geotextile layer reinforced gravel platform, and (iv) an embankment with pile-support and a two-layer geogrid reinforced gravel platform. A 3D representative slice of each of the four embankments was modeled in ABAQUS
©. Piles, embankment fill, and soil above water were modeled with 20-node brick elements (designated C3D20R) and an EPPMC model. The soil below the water was modeled with 20-node brick elements, allowing for the pore pressure parameter (designated C3D20RP). Geosynthetics were represented by membrane elements without bending resistance (designated M3D8R), assuming a linear-elastic regime. Interface elements between pile/soil, embankment-fill/reinforcement, and embankment/subsoil were defined by a master/slave contact with basic Coulomb friction. Settlements were accurately predicted by the model during the whole construction phase, overestimating the settlement by an average of 8%, but the simulated settlement for the end of construction did not adjust the field data. The authors pointed out that changes in hydraulic conductivity and void ratio that were not considered in the model were likely the main reason for the deviation in the prediction. The strains acting on the reinforcement layer were in good agreement with the field data, which could also correctly predict the minimum and maximum strain locations in the reinforcement.
Tran et al. [
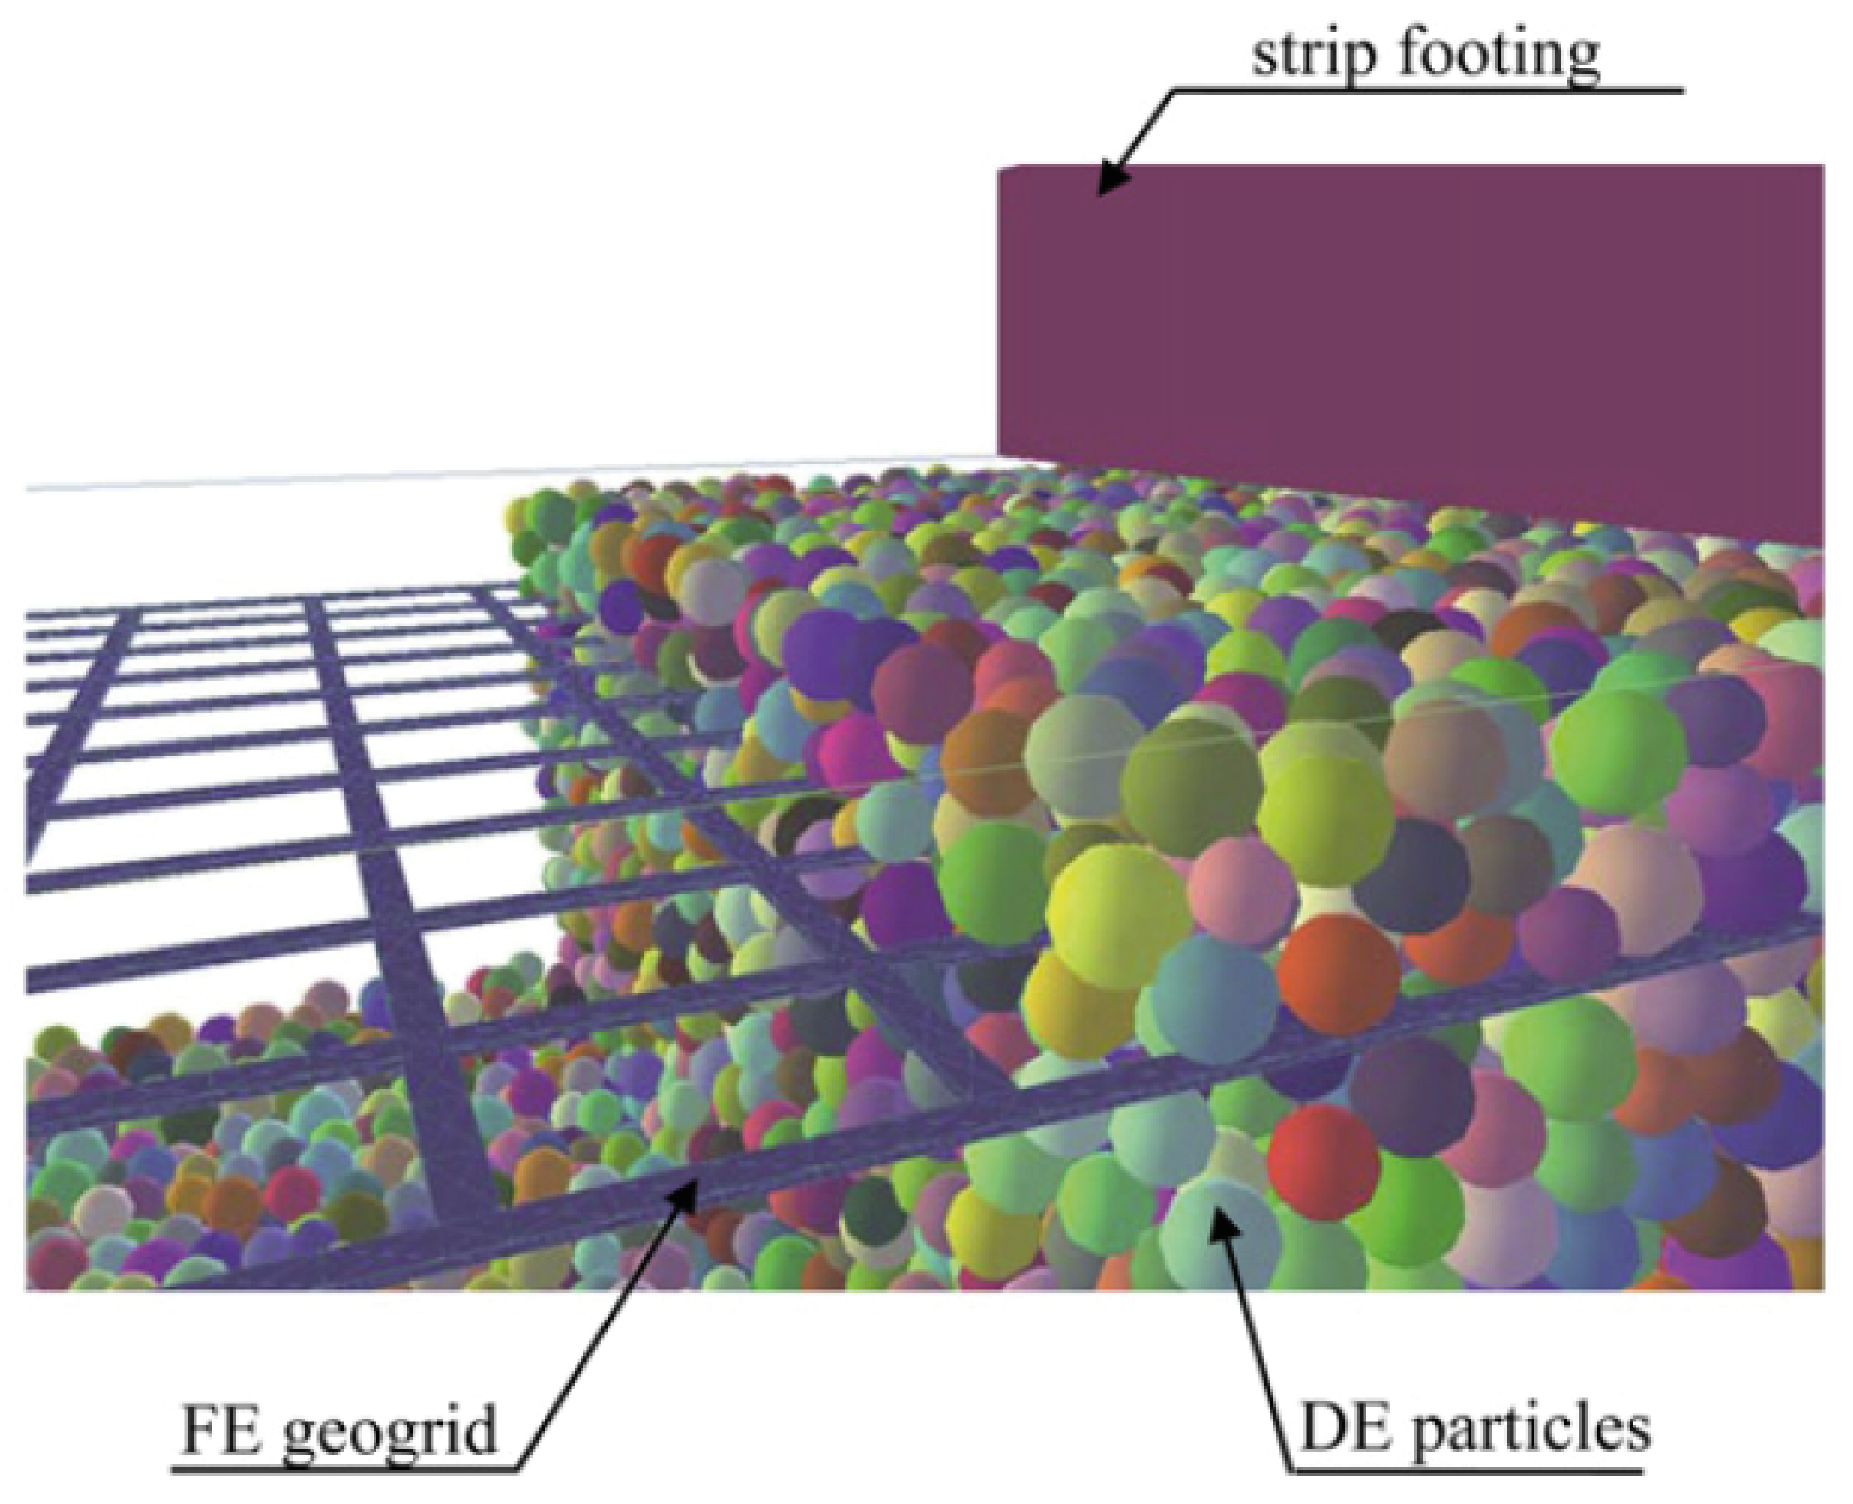
32] used YADE software to analyze the soil–geosynthetic interaction of a geogrid-reinforced strip footing. The soil was defined as discrete elements with classic formulations (Newton’s and Euler’s equations). The biaxial geogrid was modeled as linear-elastic using 8-node brick elements (FE). An illustration of the FE/DE combination is shown in
Figure 8. Although 3D, the geogrid geometry did not include the different thicknesses of ribs and junctions. Interface elements (FE) with a tangential friction angle coefficient were also used to represent the soil–geogrid interaction. According to the authors, this coefficient had to be determined by trial and error. A multiple time-step approach was also required, since FE’s time steps are much larger than DE’s time steps. The procedural steps involved in a typical cycle of calculations can be succinctly summarized as follows: The first step involves determining the potential interactions between discrete element (DE) particles and the interactions between DEs and interface elements. Following this, the contact parameters for each interaction are determined using the appropriate contact laws. Subsequently, the interaction forces between DE particles and between DEs and interface elements are calculated. Finally, the velocities and positions of the particles are determined. The finite element (FE) solver is executed at regular intervals of n time steps, during which the forces acting on the FE nodes are updated to determine the displacements of the nodes. The coupled model was compared to experimental data and showed very good agreement in predicting failure modes and well adjusted the overall soil-reinforcement response. Parametric studies regarding the geogrid position and number of layers, with the simulation of erosion and the inclusion of soil voids, were also reported to agree with literature results.
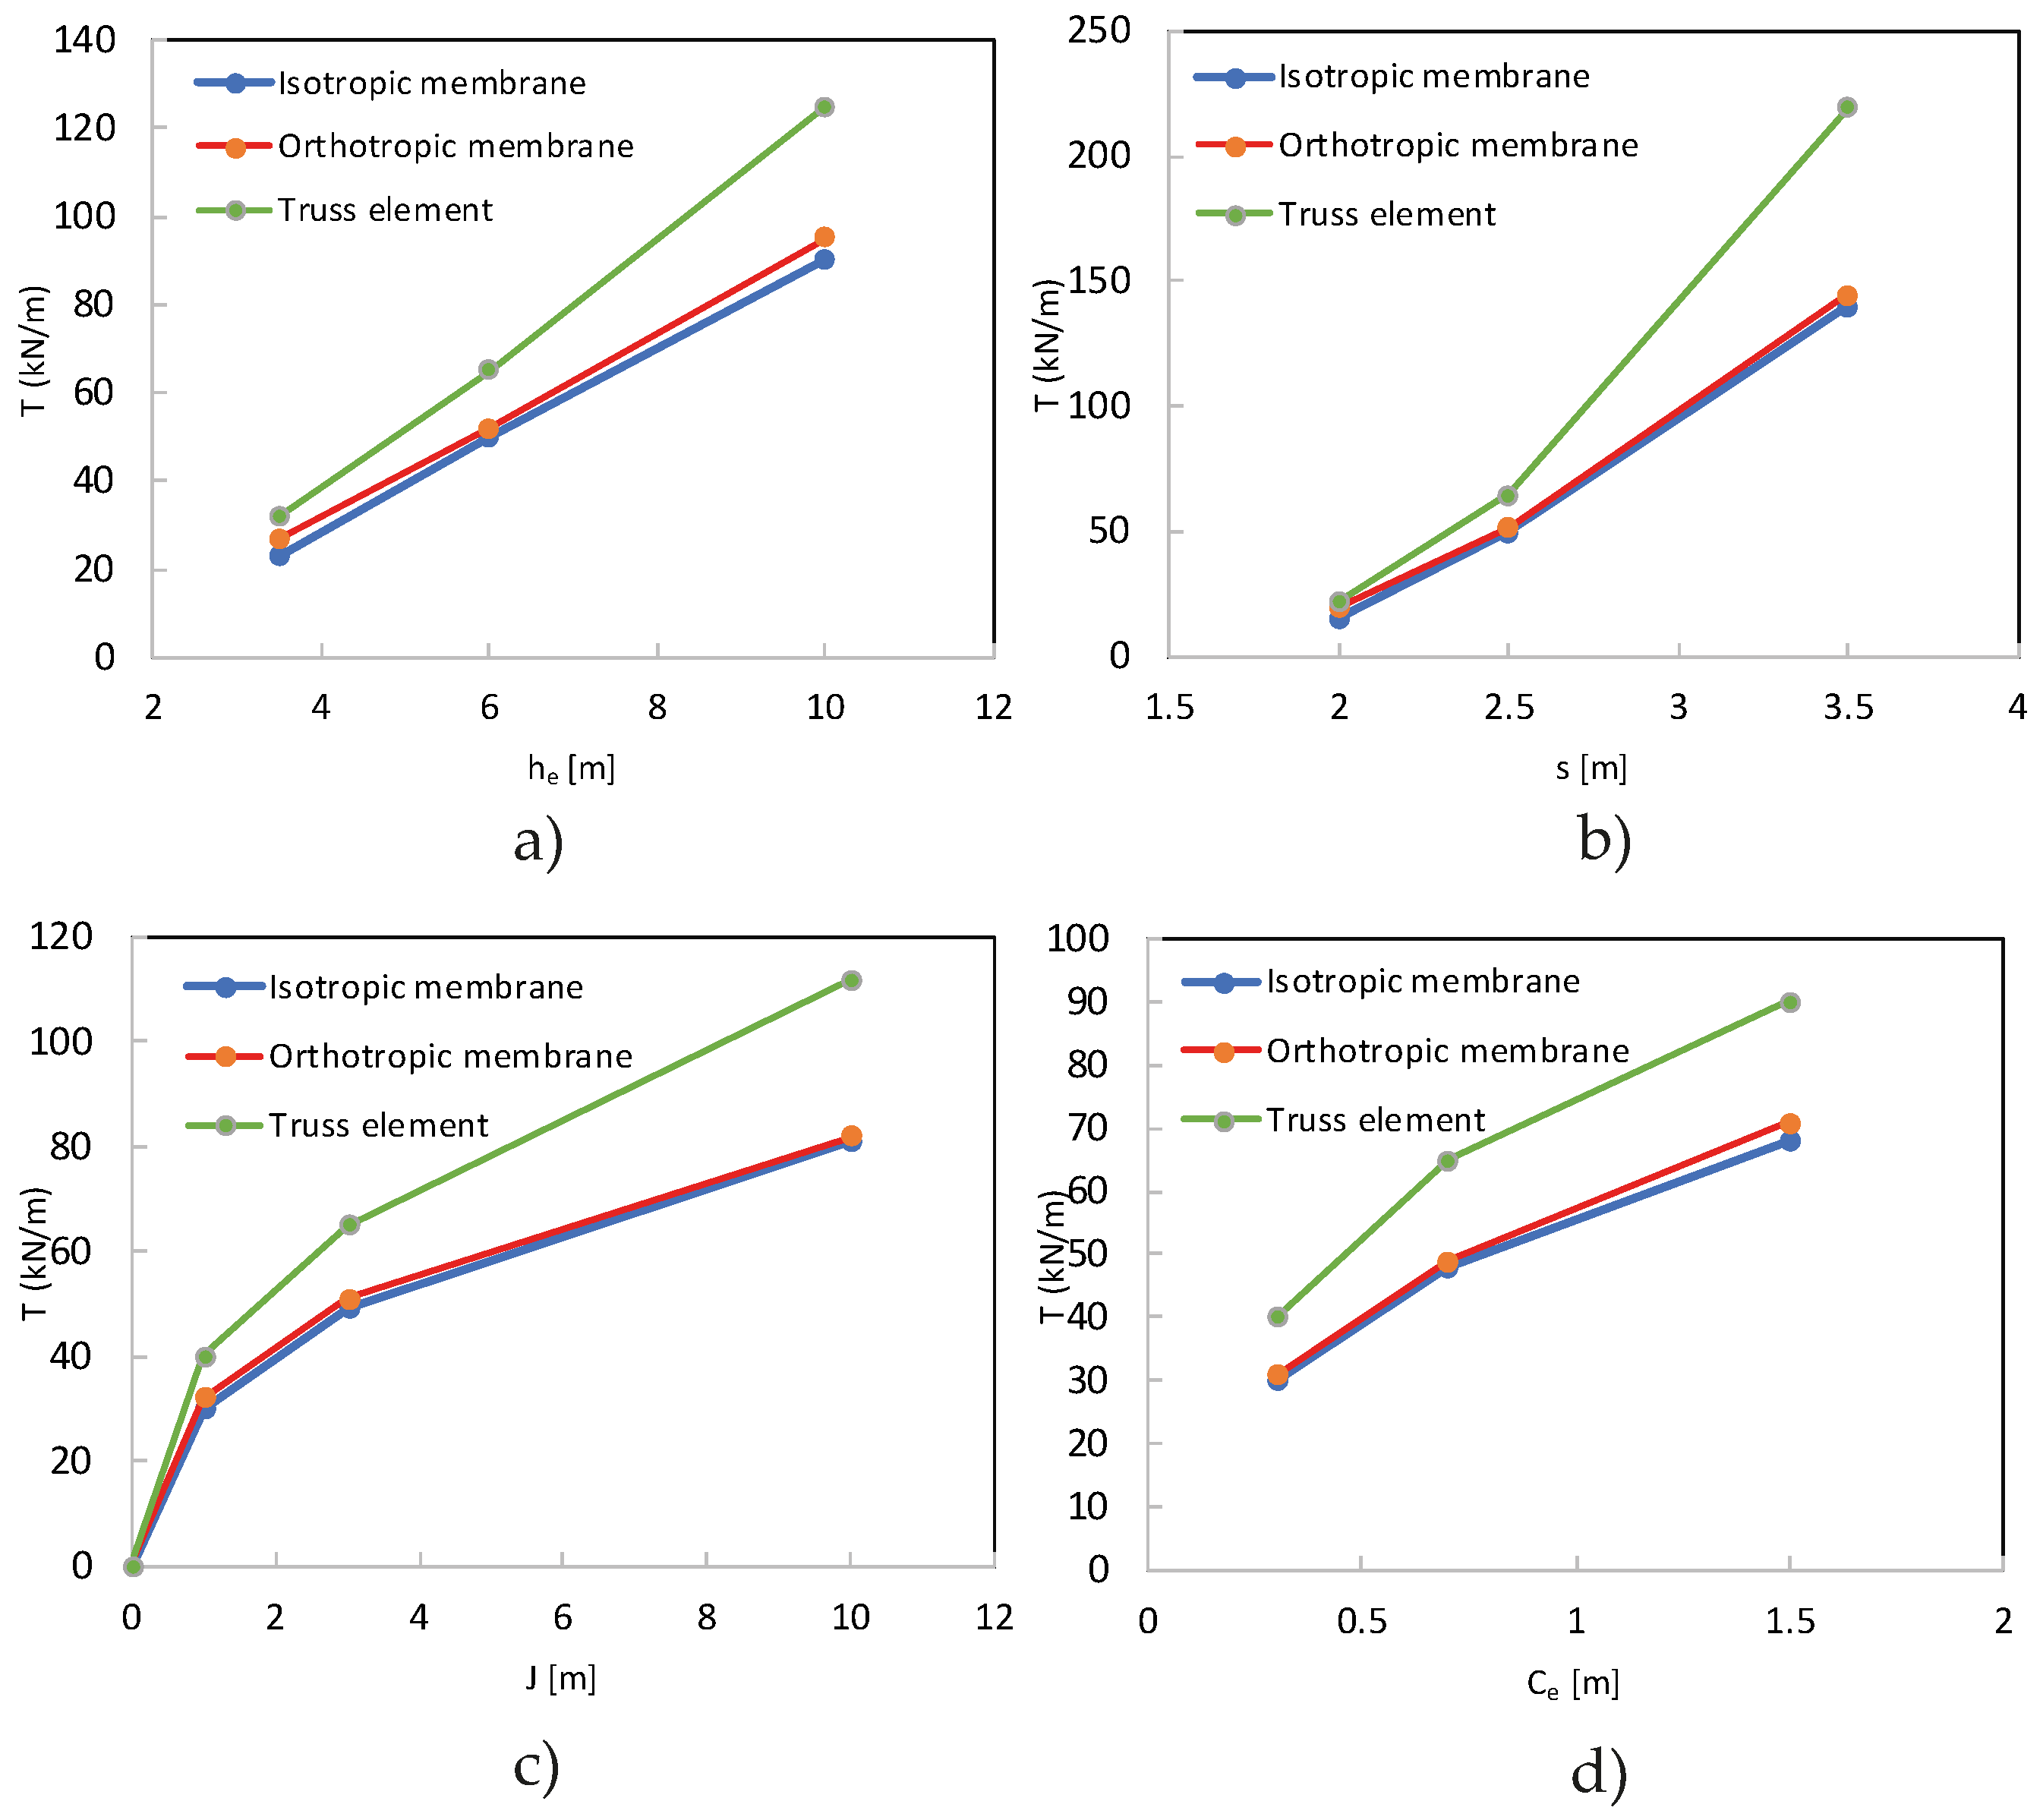
Zhuang and Wang [
33] compared the numerical response of a biaxial geogrid used in a piled embankment when modeled as an isotropic membrane, an orthotropic membrane, and a truss element. A parametric test was carried out on a hypothetical geogrid-reinforced embankment modeled in ABAQUS
©, without validation with experimental data. For the membrane models, a general 4-node quadrilateral membrane (designated M3D4) was used. The truss element model used a 2-node linear displacement element (designated T3D2). The three geogrid models were represented as linear-elastic materials. The results (
Figure 9) showed a good agreement between the orthotropic model and the truss element model, while the isotropic model yielded a considerably higher tensile strength (33% difference). Moreover, in the four parametric tests (influence of embankment height, pile spacing, geogrid stiffness, and compression index of subsoil), the same trend was observed, where the isotropic model diverged from the orthotropic and truss element models (up to 65% difference).
In reference [
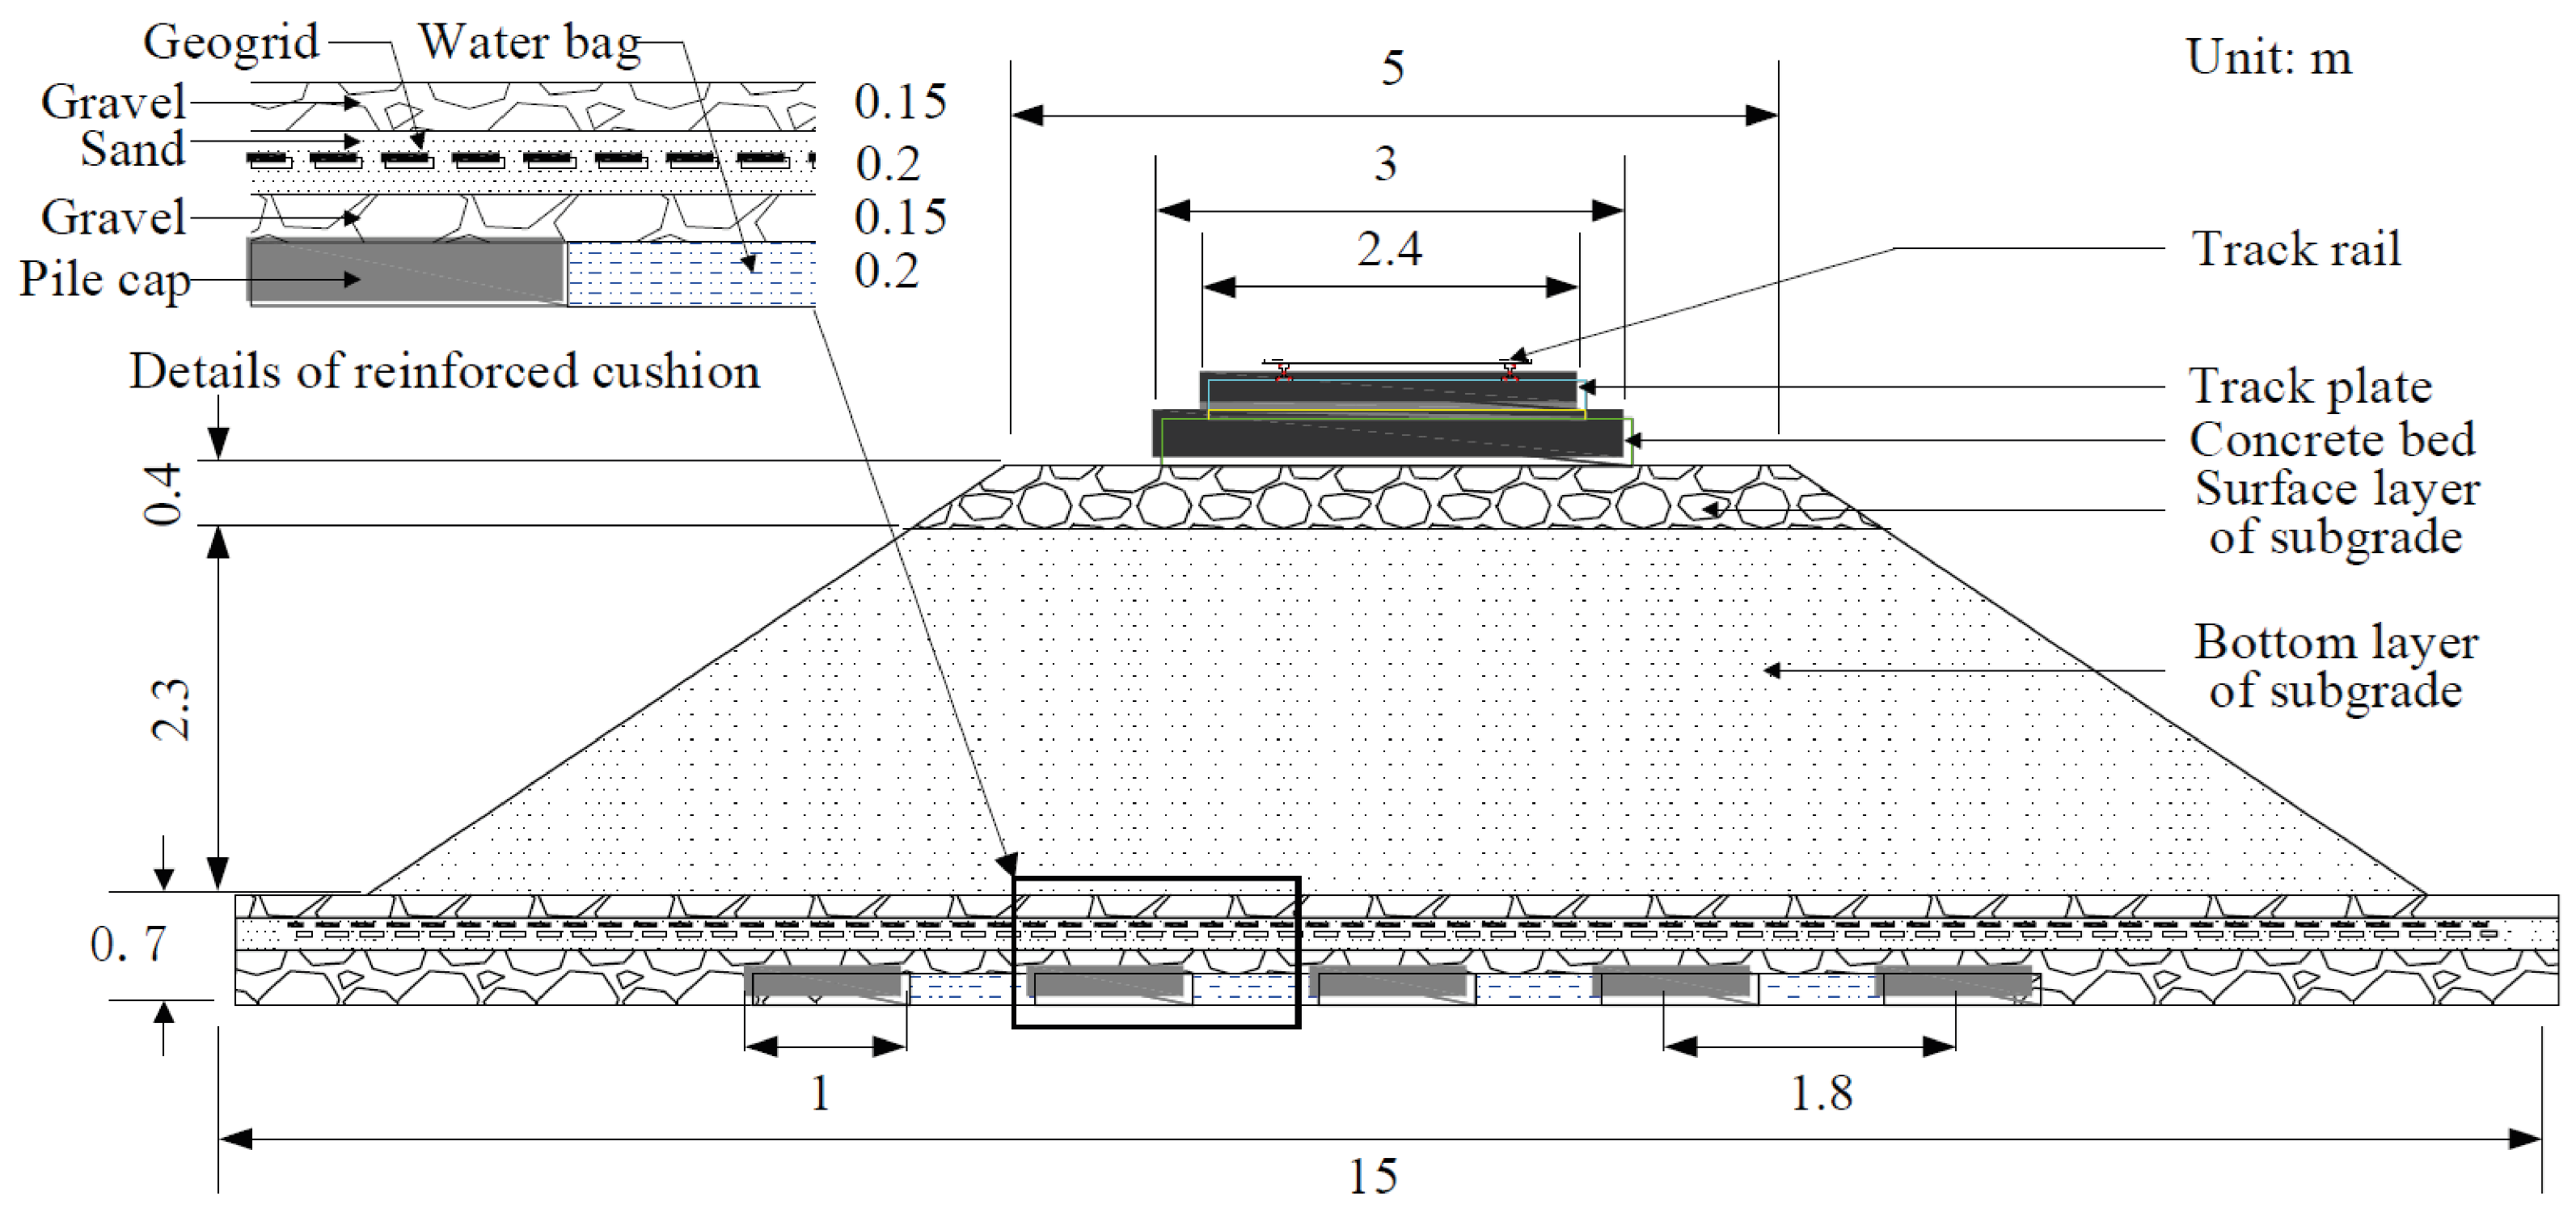
34], the authors reported a 3D model to investigate the soil arching effect on pile-supported embankments reinforced with geogrids. The model consisted of eight-node brick elements to represent the soil particles with the EPPMC model, while the geogrid was represented by a membrane element on an elastoplastic regimen (no rigidity to flexion). The interface between the pile caps and surrounding filler/subsoil was taken as a surface-to-surface with tangential and normal coefficients. In the field data, the subsoil also contained water bags, and the authors reported a large number of attempts to adjust the mechanical properties of the water bags (
Figure 10) that were modeled with the same eight-node brick element as the soil particles. The model also considered the construction phases by adding filler in steps accordingly. The numerical model showed excellent correlation with the deformations and pressures observed in the field, across the initial load and after consolidation. The model was also able to capture the evolution of the arching shape (evaluating the stress distribution over time).
A comparison between using a continuous 2D sheet against the exact 3D geometry of a geogrid was presented in [
15]. Geogrids have a complex geometry (
Figure 11) that is frequently modeled using either a truss, bar, or cable components in 2D, and an equivalent plane sheet. This simplification was explored in their paper.
Although having easier to perform calculations, these geometry-simplified models come at a cost of extensive calibration to adjust the element stiffness through an equivalent thickness. The geogrid was modeled in ABAQUS© as a nonlinear elastoplastic with isotropic hardening to represent the different strength responses in the main directions of the geogrid. For the soil-confined model, the backfill was modeled by the EPPMC model. The soil–geogrid interaction was simulated with contact surface constraints (fully bonded master/slave contact) between the geogrid apertures and the granular soil filling the reinforcement, with no slippage allowed. A finite element comparison was made between hexahedral and tetrahedral formulations, and it was seen that the hexahedral elements provided a better correlation with experimental data. The study demonstrated that using the equivalent plane sheet without the proper calibration could lead to an underestimation in the design loads acting on the geogrid, coming from a stiffer response from the membrane/shell element type. Moreover, if simplifications are required (i.e., for the sake of lowering computation time in large models), then 3D models proved to be a good reference for estimating the equivalent sheet properties, in order to accurately represent the geogrid behavior. The exact geometry also proved appropriate to model the soil interaction, and the 3D model adjusted the experimental data reasonably well.
In reference [
35], the authors utilized the three-dimensional particle flow code (PFC3D) to model single geogrid-encased stone columns under unconfined compression. The study employed the discrete element method (DEM) to investigate the effect of four factors (geogrid stiffness, column length, column diameter, and aggregate size) on the behavior of the columns. The study made use of experimental data to verify the numerical model, which aimed to carry out a parametric analysis. The constitutive models for geosynthetic and soil were determined by simulating tensile tests and flexural bending tests based on the ASTM standards. The soil–geosynthetic interaction was also considered in the model through the introduction of spherical balls with a high coefficient of friction and weak contact bonds. A laboratory test on a geogrid-encased stone column under unconfined compression, was treated as the baseline case for the parametric study. The results showed a good agreement between the numerical model and the corresponding laboratory test (vertical pressure and vertical strains).
Zhou et al. [
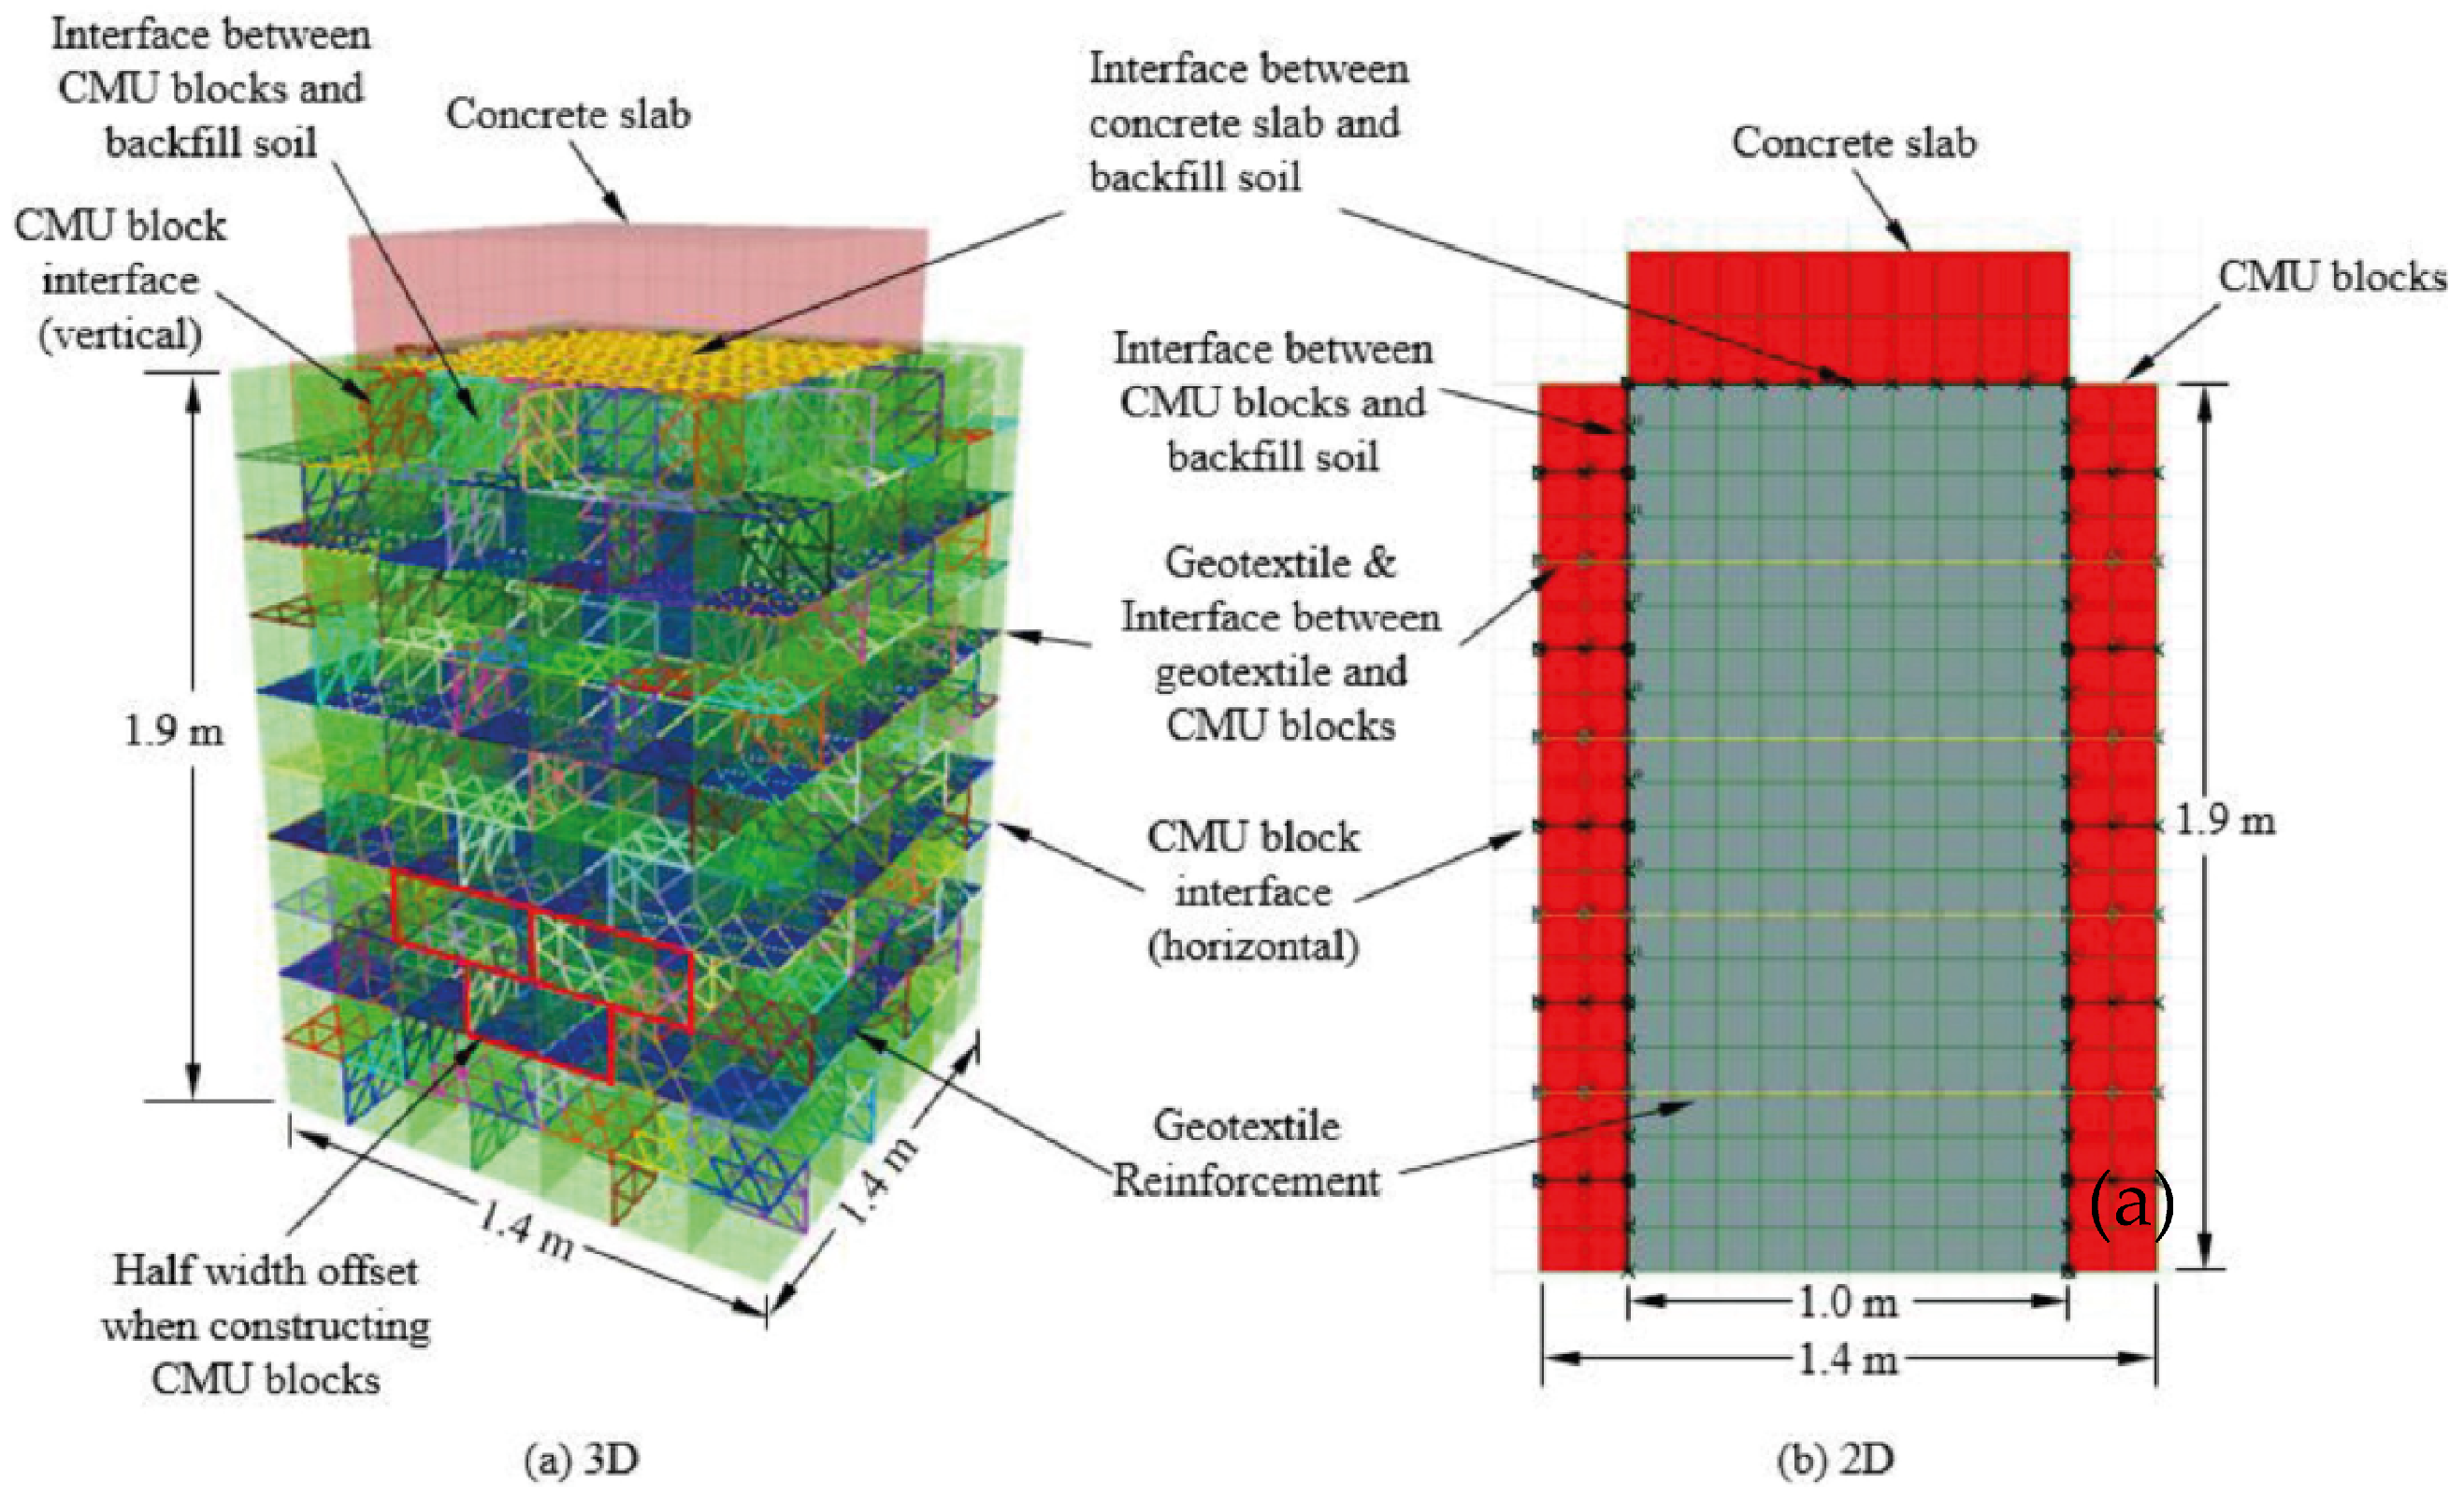
36] compared 2D and 3D models in the analysis of reinforced piers. The study included several types of interfaces, as they represented a major factor in the performance of reinforced piers. The authors discussed the differences in the modeling considerations and the limitations of the 2D model. Only the 3D model could include the facing geometric properties of the concrete masonry units using a typical half-width offset,
Figure 12. The reinforcement was modeled in the FLAC
© package using the proprietary membrane elements for the 3D models and a “cable” element for the 2D model, given that the cable element did not provide bending resistance. The backfill was represented by the EPPMC model. The interfaces also used proprietary elements, i.e., linear-elastic springs with interaction coefficients obtained from the literature. The results indicated that different boundary conditions inherent to the model type (2D/3D) led to incomparable results. Lateral displacements at mid-height were about two times larger in the 2D model, while the peak volumetric strain on the reinforcement was 60% larger. The 2D model was conservative for peak displacements/stresses and presented different overall material responses, influenced by the necessary changes in boundary conditions in the 2D model.
Reference [
37] described a three-dimensional modeling framework to simulate a biaxial geogrid under a pullout loading. The biaxial geogrid was modeled in ABAQUS
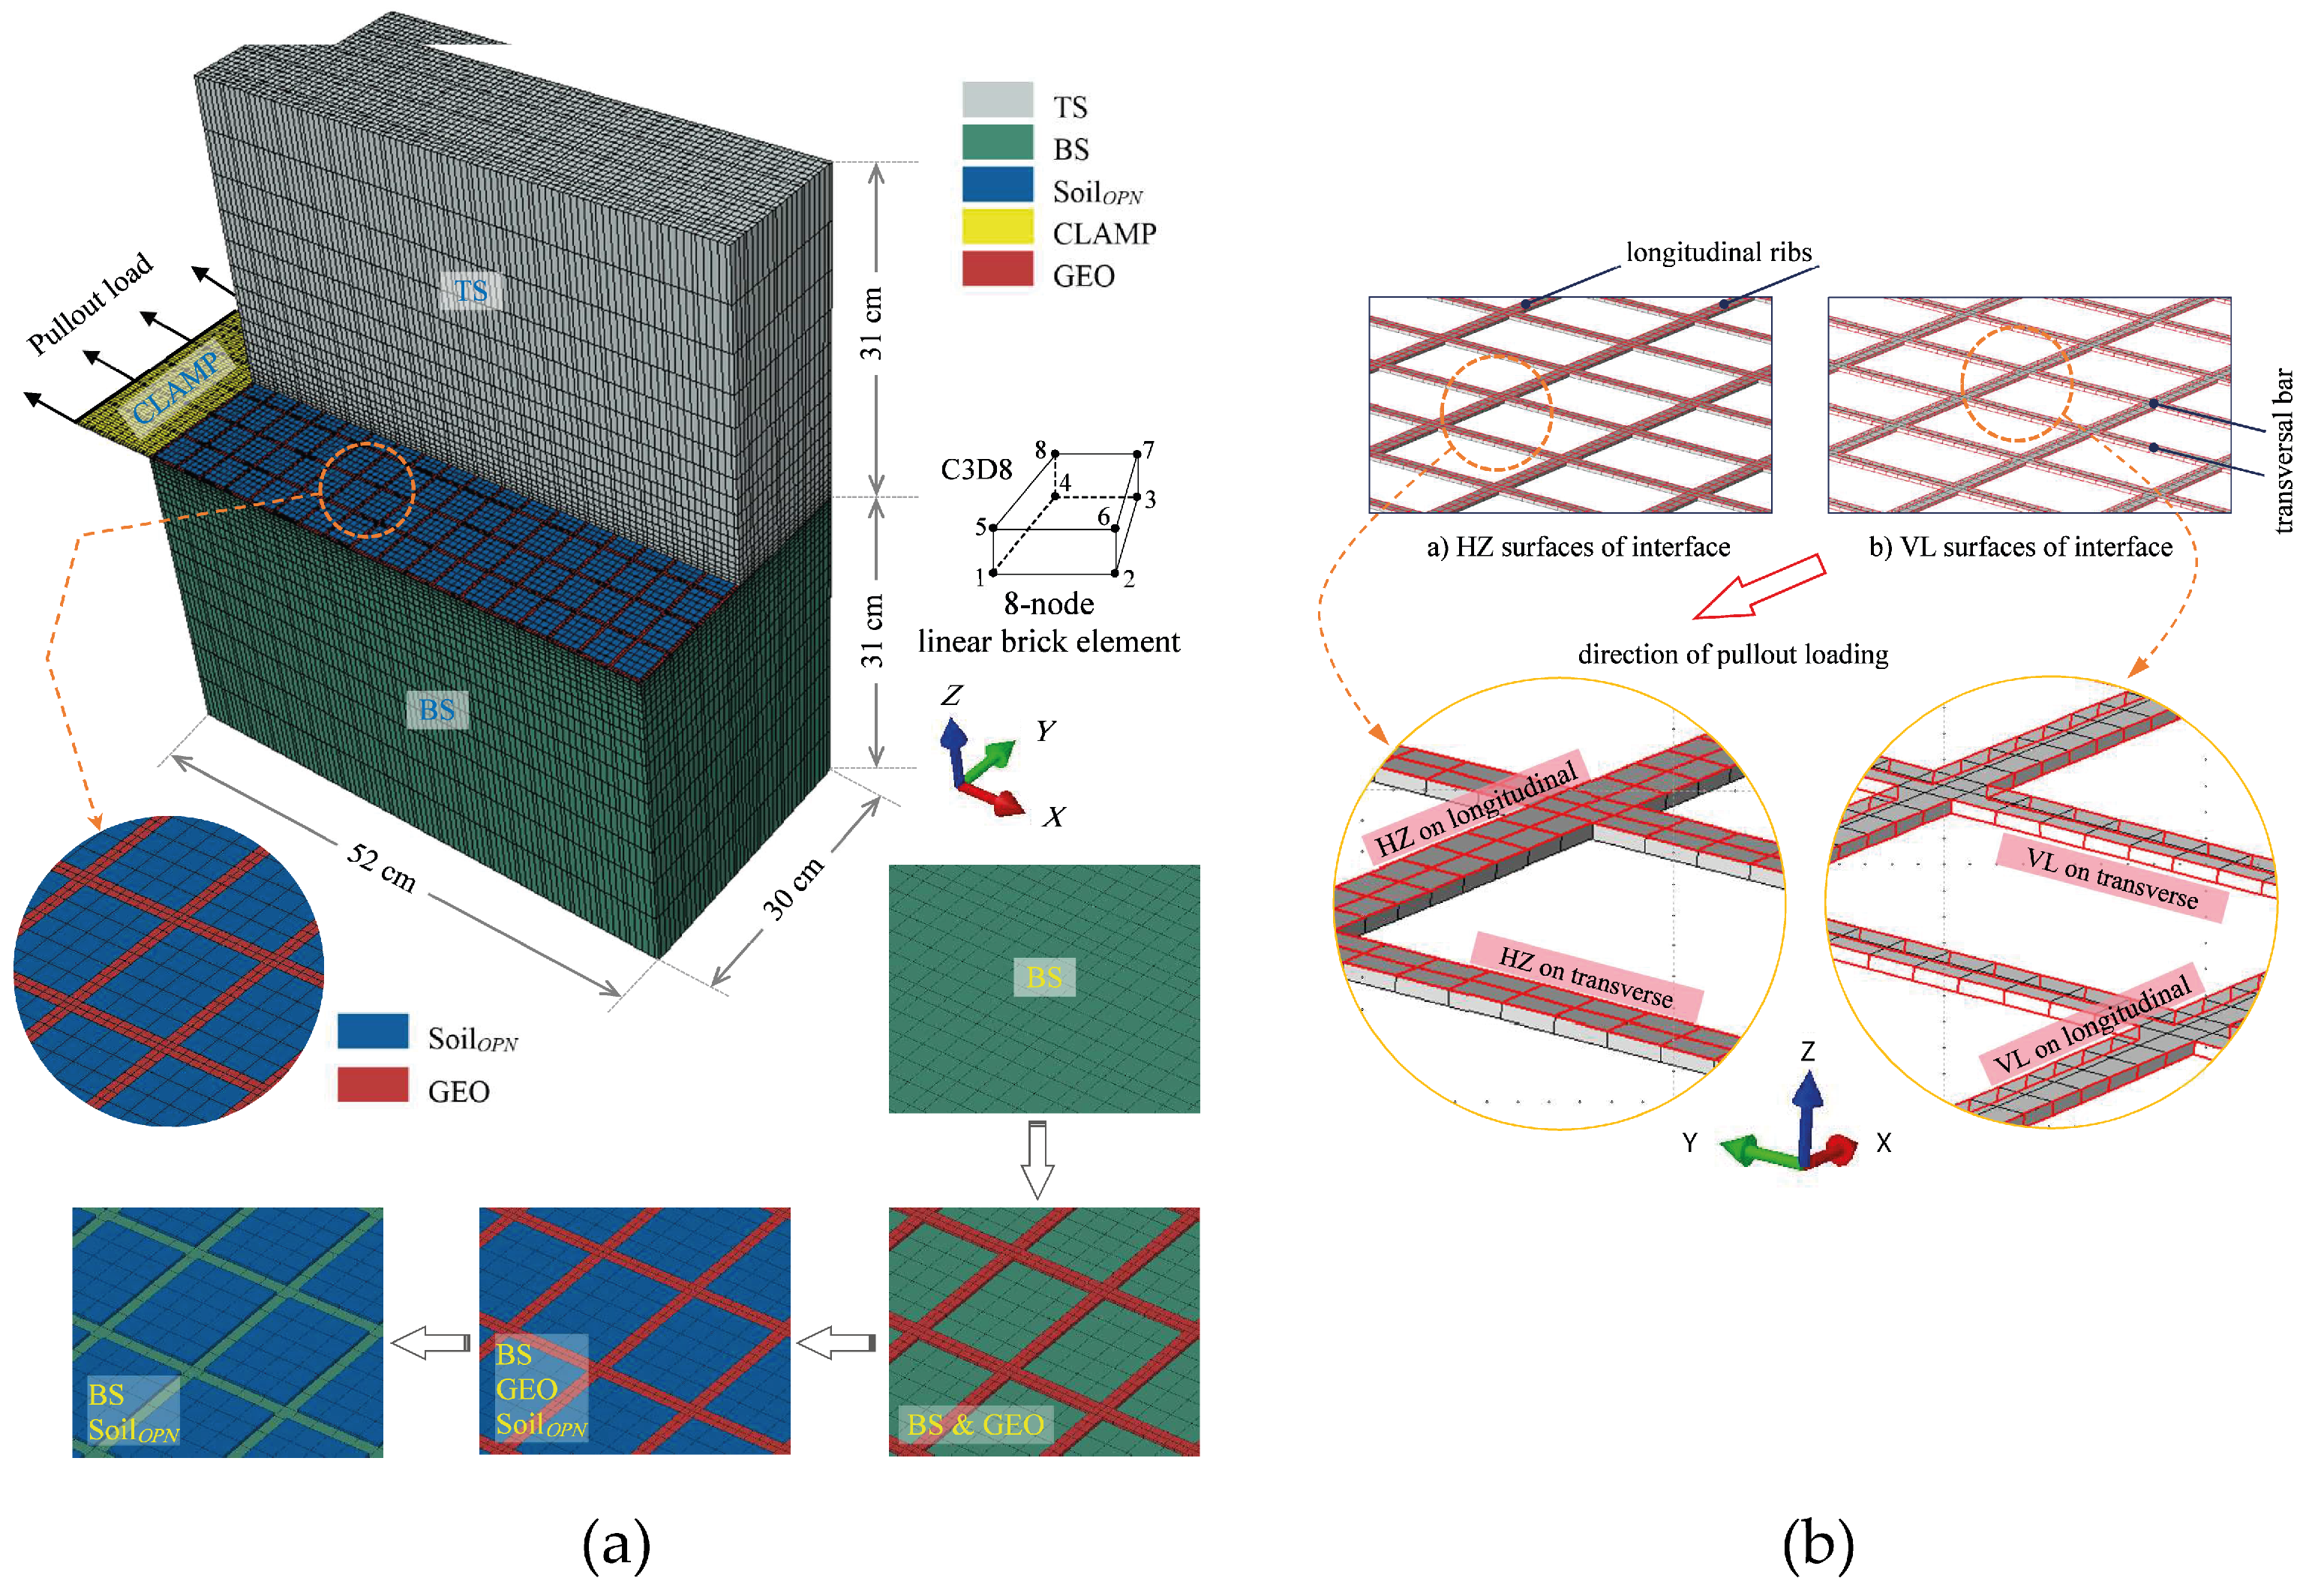
© using an elastoplastic model with 8-node brick elements and the sand was represented by the EPPMC model with non-associated flow rule. The model consisted of a 5-part scheme illustrated in
Figure 13. In the first step, the bottom soil domain (BS) was added in three stages, followed by the corresponding geostatic stresses in each stage. Then, the geogrid (GEO) and the soil at openings (Soil
OPN) were added in another step. The top-soil domain (TS) was then added in 15 steps. With this approach, the soil elements above and below the geogrid were allowed to directly interact with each other through the soil opening elements. To simulate the soil–geogrid interaction, a series of master–slave contacts were defined between the geogrid and the soil components. The horizontal soil-to-geogrid interface (GEO and TS/BS) was modeled as a hard Coulomb friction model; thus, no penetration between the soil and the geogrid was allowed during the pullout process. In the vertical soil-to-geogrid interface, separate friction definitions were made for the interface between the longitudinal and transversal ribs. In the longitudinal ribs, the vertical interfaces were assigned to a hard Coulomb contact (similar to that of the horizontal interface).
An investigation of the cyclic load behavior in pile-reinforced embankments was presented in [
38]. The three-dimensional pile was modeled in ABAQUS
© using 8-node brick elements (C3D8) for the embankment, soft soil, piles, and footing, and a 4-node membrane (M3D4) for the geosynthetic layers. To analyze the cyclic behavior, the granular soil that composed the embankment fill was modeled by a hypoplastic constitutive model. This model accounted for the influence of density and dilatancy (pyknotropy), the pressure level (barotropy), and intergranular strain, requiring a total of 13 parameters. Since the model was not directly validated by experimental data, parameters from the hypoplastic model were retrieved from the literature (with some of them further calibrated by trial and error). The remaining elements followed a traditional linear-elastic formulation, with the soft soil represented by the CamClay model and the piles/geosynthetic modeled by an isotropic linear-elastic model. The soil–geogrid interface was simulated using the traditional surface-to-surface Coulomb friction model. The cyclic loading was modeled by a sinusoidal curve, simulating the cyclic loading of a vehicle wheel load. The parametric study featured a series of loading scenarios of traffic speeds (i.e., variations in amplitude and frequency of the cyclic loading). The hypoplastic model was able to accurately represent the embankment fill under static loading. Although no real data were made available for the cyclic loading scenarios, the numerical model indicated that the geosynthetic reinforcement reduced the soil arching effect and consequently decreased the cumulative settlement.
In [
39], a comprehensive series of 3D and equivalent 2D numerical analyses were performed focusing on the failure mechanisms of column-supported embankments (CSE), using FLAC3D
©. The numerical analyses considered the failure height as the ULS stability metric, to make the models less computationally expensive. Eight scenarios included a base case and seven parametric variations using base case conditions, and the parameters for variation were center-to-center column spacing, column diameter, geosynthetic stiffness, and the clay’s undrained shear strength. The scenarios were related to the base case by altering the column spacing, column diameter, geosynthetic stiffness, and the clay’s undrained shear strength. The undrained-dissipated approach was used to calculate the two limiting conditions for a lateral spreading analysis, an undrained end-of-construction state, and a long-term state after dissipation of all excess pore water pressures, for investigating CSE failure modes. The method of excess pore water pressure dissipation and computed consolidation deformations were validated using a benchmark solution (one-dimensional consolidation and laterally drained consolidation comparison). Material parameters were calibrated such that the system response at the undrained end-of-construction and long-term dissipated conditions agreed with the instrumented case history data. The model was solved for equilibrium and an undrained end-of-construction state after the construction of every lift, and following undrained loading, pore water pressures were returned to the hydrostatic condition, and the model was solved for consolidation and a long-term dissipated state. The soil particles were modeled with traditional linear-elastic formulations and the geosynthetics were modeled as an orthotropic linear elastic material, allowing for mesh element removal when the given transverse strain reached the upper limit defined. The article concluded that, for the global stability analysis of CSEs, the conventional two-dimensional limit equilibrium method (LEM) is not appropriate. A comparison was made between the results of 2D limit equilibrium analyses and those of 3D numerical analyses. The comparison showed that 2D analyses resulted in unconservative factors of safety (FS) because they assumed failure by shear, whereas the columns of CSEs failed not by shear, but by bending and flexural tension. In addition, the 3D model indicated that the geogrid did not provide any resistance during failure, given that the failure was initiated after the geogrid rupture, whereas the 2D analysis could not simulate the same effect order (geogrid was fully mobilized up until failure). The article also showed that the circular failure surface search in LEM would not be able to find the critical failure surface for CSEs, which involves the soil–structure interactions and failure within the foundation. This paper suggested that the LEM only correctly calculated the factor of safety when the failure surfaces were fully specified, and when both the geogrid and columns were excluded from the analysis. However, these conditions could not be met without the feedback output of a full 3D analysis.
Vibhoosha et al. [
40] used ABAQUS
© to evaluate the time-dependent performance of geocell-reinforced encased stone columns (GESC) using a time-dependent 3D stress–pore pressure coupled analysis. A key aspect of this work was to evaluate the influence of the geocell deformation on the response of GESC structures. The infill soil, stone column, embankment soil, and sand blanket used an EPPMC model. Lithomargic clay was modeled with the Modified Cam Clay (MCC) model, with properties calibrated through laboratory tests. The geogrid and geocell were modeled as isotropic linear elastic materials. The model featured the usual method of analyzing a singular column alongside its adjoining soil tributary zone. Leveraging the symmetry, only a quarter of the column and its associated region was simulated. Mesh dimensions were determined after multiple preliminary tests with varying element quantities. To ensure consistency and negate meshing errors, element dimensions were maintained as uniformly vertical. The preliminary time increment was set to 10
−3 days. The lithomargic clay stratum and stone column utilized 20-node stress–pore pressure coupled brick elements with condensed integration (C3D20RP). The embankment substrate, geocell-sand mattress infill, and drainage overlay were constructed using 20-node quadratic brick elements with condensed integration (C3D20R). Lastly, the geogrid sheathing and geocell were depicted through eight-node membrane elements with minimized integration (M3D8R). Even with the use of reduced integration elements, the authors reported that the simulation had an average execution time of 7 h.
The material properties and the modeling approach were validated, aiming at replicating the load test results from the laboratory tests. The stress distribution in the geocell-sand mattress was uneven, peaking at the geocell pockets’ mid-height and decreasing towards its edges. The tensile stress mobilized in the geocell pockets during embankment loading can differ, yet designs typically consider a constant tensile strength. The study further revealed that an increased geocell stiffness enhanced the weight transfer to stone columns and confined the infill material more effectively. This increased stiffness, attributed to the 3D structure of the geocells, resulted in a reduced ground surface settlement and improved weight transfer from the foundation soil to the encased stone column. The findings revealed that the stress concentration ratio (SCR) increased over time, stabilizing after consolidation, with an 85% improvement when a geocell layer was added to the geosynthetic encased stone columns (GESC). Importantly, the geocell-sand mattress reduced the vertical foundation soil settlement by 80% during embankment construction and decreased stone column bulging, especially when aggregates were chosen as the infill material. The numerical model developed in this study accurately represented the shape of the geocell and its relationship with the infill, addressing the shortcomings of the equivalent composite approach. The results suggested that GESC+GEOCELL configurations might offer a more cost-effective alternative to the commonly used geosynthetic reinforced piled embankment systems.
