Article

The Effect of Clay Infill on Strength of Jointed Sandstone: Laboratory and Analysis

by
Chen Cui
* and
Ivan Gratchev
School of Engineering and Built Environment, Griffith University, Gold Coast 4222, Australia
*
Author to whom correspondence should be addressed.
Geotechnics 2024, 4(2), 499-511; https://doi.org/10.3390/geotechnics4020027
Submission received: 19 April 2024 / Revised: 23 May 2024 / Accepted: 24 May 2024 / Published: 25 May 2024

Abstract

:
The strength of jointed rock is a fundamental factor in the slope stability of rock mass. This research investigates the effect of infill thickness on the strength of jointed rock specimens. Unlike previous studies involving artificial rock-like materials and saw-tooth surfaces, this work has been conducted on two natural types of sandstone with various rock surfaces. Natural low-plasticity clay of different thicknesses (1 mm to 3 mm) was used as the infill material. A series of shear box tests with a range of initial normal stresses from 0.5 MPa to 1.5 MPa were performed to obtain high-quality data regarding the shear strength of natural rock and to provide insights into the effect of infill and rock surface roughness on shear strength. The obtained results were also used to improve the current methods of rock strength predictions, which were initially designed to estimate the strength of artificial rock-like material. Based on the obtained laboratory data and the strength estimation using different methods, a newly proposed procedure was proved to provide more accurate estimations of the shear strength of jointed rock.

1. Introduction

Discontinuities in rock mass, including joints, bedding planes, and faults, can significantly affect the rock shear strength, resulting in slope failures [1,2,3,4,5,6,7,8]. In the field, the rock joints are typically filled with natural material such as soil. To study the effect of infill material on the strength of jointed rock mass, a series of laboratory studies under constant normal load (CNL) conditions has been conducted [9,10,11,12,13,14,15,16,17,18,19,20]. In addition, research into the constant normal stiffness (CNS) condition [21,22,23,24,25] has been carried out (see Table 1).
These studies showed that the shear behaviour of the infilled joints depends on the surface roughness, type of infill material, and the ratio of the infill thickness (t) to the asperity height (a), i.e., t/a [10,26,27,28]. This research has shown that when the infill thickness increases, the shear strength of the jointed rock mass tends to decrease.
The t/a ratio seems to have a strong influence on the shear strength of rock. To investigate this, several studies have been conducted using artificial rock joint models, as shown in Figure 1a. It was found that when the t/a ratio is equal to or less than 1, shearing mostly occurs between the joints and the infill material. When the t/a ratio ranges from 0.35 to 0.72, the shear strength of the jointed rock may decrease [29], and it can significantly drop when the t/a ratio becomes less than 0.25. For relatively large values of t/a ratio (more than 1.25), according to Goodman [30] and De Toledo and De Freitas [31], the shear may also occur inside the infill material. Jahanian and Sadaghiani [11] noted that when the t/a ratio is greater than 2, the shear would only occur in the infill material.
Table 1. Summary of the previous research about the t/a ratio and the infill material.
Type of ModelMaterialThickness Over Asperity (t/a)Infill Material
Papaliangas et al.
(1993) [32]
Rough surfacePlaster1, 1.5, 1.14Kaolin, marble dust, dry cohesion soil
Indraratna et al.
(2005) [33]
Saw-tooth modelGypsum plaster0.6, 1.2, 1.8, 3.6Graphite and bentonite
Indraratna and Mylvagnam
(2005) [22]
Saw-tooth modelGypsum plaster0, 1, 2, 3.5Silty clay
Indraratna et al.
(2008) [26]
Saw-tooth modelGypsum plaster0.5, 1, 1.5, 2, 3.5Natural silty clay
Oliveira et al.
(2009) [25]
Saw-tooth modelGypsum plaster0.5, 1, 1.5, 2Sandy clay
Indraratna et al.
(2014) [34]
Saw-tooth modelGypsum plaster0.26, 0.51, 1.53, 2.05Silty clay
Naghadehi
(2015) [27]
Saw-tooth modelSandstone0, 0.2, 0.4, 0.6, 0.8, 1, 1.2, 1.4, 1.6Sand, clay, sandy clay
Jahanian and Sadaghiani
(2015) [11]
Saw-tooth modelGypsum plaster0.3, 0.5, 0.6, 1, 1.2, 2Sandy clay
Liu and Liu
(2017) [35]
Saw-tooth modelSandstone0, 0.05, 0.1, 0.25, 0.25, 0.5, 0.75, 1, 1.5, 2cement
Zhao et al.
(2020) [15]
Rough surfaceCement0.614, 0.725, 1.03, 1.89Sand and clay
Li et al.
(2022) [36]
Saw-tooth modelSandstone, mudstone and cement1 mm (infill)cement
Although the studies above have provided helpful insight into the shear behaviour of joints filled with various materials, they also have some shortcomings:
Firstly, as shown in Table 1, most studies have employed artificial saw-tooth models, while only limited research has been performed on irregular surfaces of natural rock. However, such irregular surfaces are encountered in the field. Figure 1 shows the difference between the artificially created rock surfaces (Figure 1a) and the surface of natural rock (Figure 1b).
Secondly, it is important to note that in experimental studies, the use of rock-like materials, such as plaster and cement, may not fully capture the complex properties of natural rock. This limitation has been underscored by the few studies conducted on natural rocks, which have revealed the significant impact of rock inhomogeneity on engineering properties.
Based on this knowledge gap, this study seeks to investigate the shear behaviour of natural rocks with and without the infill material to improve our understanding of the significant factors that determine the strength of natural rock. A series of shear box tests were carried out on two types of sandstone with irregular rock surfaces. To estimate the effect of infill thickness on shear strength, moist clay was used as the infill. The obtained data were used to refine the existing numerical methods to estimate the effect of infill on the shear strength of jointed sandstone. The newly proposed method has shown more accurate estimations of the shear strength compared to the previous methods, which were mainly designed based on artificial rock-like material, and can offer better insights when designing various solutions such as meshing and anchoring.

2. Materials and Methods

2.1. Analysis Methods

To estimate the effect of infill on the shear strength of jointed rock, a few numerical studies have been conducted [15,22,26,27,28,29,37,38,39]. For jointed rock with no infill, Barton’s equation (Equation (1)) has been widely used.
τ = σ n   t a n   ( φ r + J R C   l o g   ( J C S σ n ) )
where σn is the normal stress on the joint, φr is the residual friction angle, and the joint wall compressive strength (JCS) is equal to the unconfined compressive strength (UCS).
Indraratna [26] combined the normalised shear strength (τpn) with the infill thickness over the asperity height (t/a) to obtain Equations (2)–(4):
( τ p σ n ) o c , n = A n + B n
A n = t a n   ( φ b + i 0 ) × ( 1 K o c , n ) a n
B n = t a n   φ f i l l × O C R α × ( 2 1 + 1 K o c , n ) b n
where Koc,n is the factor of the t/a ratio of the testing sample over the critical t/a ratio. Also, in the present study, the interfering zone was estimated as proposed by Indraratna [28]. i0 is the initial asperity angle and an, bn are the empirical constants. Indraratna took the consolidation ratio into consideration with an idealised joint roughness. These equations were modified to correlate with the degree of saturation of the infilled material. The algebraic function (τpn) was applied (Equations (5) and (6)),
A = [ σ n × t a n   ( φ b + J R C × l o g   ( J C S σ n ) ] × ( 1 k s ) α
B = C t + [   ( σ n u a   ) × t a n   φ   ] × ( 2 1 + 1 k s ) β
τ = [ σ n × t a n   ( φ b + J R C × l o g   ( J C S σ n ) ] × ( 1 k s ) α + C t + [   ( σ n u a   ) × t a n   φ   ] × ( 2 1 + 1 k s ) β   ( k s = ( t / a ) ( t / a ) c r < 1 )
τ = c t + ( σ n u a ) t a n φ
The boundary of the interfering zone is based on the ratio of the critical t/a ratio and the given t/a ratio, both at the same consolidation rate. As for the interfering and non-interfering conditions, Equation (7) applies only when ks is less than 1, which means it is under the interfering zone. When ks is greater than 1, the shear strength is calculated using Equation (8).
Note that in Equations (7) and (8), ua is the pore air pressure which is normally taken to be the normal air pressure. Thus, for a relatively thicker infilled joint, the shear mostly happens in the filling material instead of both the rock joint and the infill.
Lama [29] proposed a method that only considered the infill thickness, without separately taking into account the asperity height or the joint roughness (Equation (9)).
T p = 7.25 + 0.46 × σ n 0.3 × l n ( f ) × σ n 0.745
where Tp is the shear strength (MPa), σn is the normal strength (MPa), and f is the thickness of infill material.
Papaliangas [32] and Jahanian and Sadaghiani [11] made some modifications that linked the shear strength with the t/a ratio, which has been proposed as Equations (10)–(13):
μ = μ m i n + ( μ m a x μ m i n ) n
μ m i n = T m i n σ × 100
μ m a x = T m a x σ × 100
n = ( 1 1 c × t a ) m
where μ is the shear strength, c and m are the experimentally derived constant, Tmax is the maximum shear strength of unfilled joints and Tmin is the potential minimum shear strength of the system for the critical thickness of the infill. In order to minimise the use of empirical constants, Zhao et al. [15] proposed incorporating the friction angle of the infilled joint and the cohesion of the infill material, thus modifying Barton and Choubey’s theory to obtain a new method (Equations (14) and (15)):
τ p = σ n × t a n   {   [   J R C × l o g   ( J C S σ n ) + φ b   ] × e x p   ( β × t a )   } + c i n f i l l
τ p = σ n × t a n   φ i n f i l l + c i n f i l l
In Equations (14) and (15), the friction angle of the rock joint has been modified using the original joint with a new function related to the t/a ratio. The coefficient in the new friction angle, which is the infilled joint friction angle β, is a decay coefficient. β is the correlation to the friction angle of the infilled material and the joint roughness coefficient (JRC) value, presented in the studies by [15,27,33,36,40]. As with Indraratna’s approach, there is still a boundary condition between the interfering and the non-interfering zones, and the t/a ratio is compared with the critical t/a ratio.
From the studies mentioned above, it can be concluded that most previous research converges on using the saw-tooth model and rock-like material. The influences of natural rock and a rough surface have yet to be adequately investigated. The present study examines the effect of infill with different thicknesses on a natural rock with a rough surface. The differences in numerical calculations based on these two factors were investigated and the procedure for the analysis was also refined.

2.2. Joint Sample and Infill Sample

Two types of fresh borehole core sandstone (diameter 50 mm) were collected from the Gold Coast area, Australia. They were part of the Marburg Formation and Neranleigh-Fernvale Beds [41,42]. Sandstone 1 (S1) was light-yellow and relatively soft. Sandstone 2 (S2) was light grey with layers of fine material (Figure 2).
To limit the impact only from the jointed rock and infill material, only fresh rocks with different thicknesses of the same infill material were selected. As a result, the shear strength was a function of the strength between the rock specimen and the strength of the infill material. It is assumed that the thicker the infill is, the greater contribution it has to the overall strength.
Figure 2 shows the cross-section of these two rock samples: S1 had a greater particle size range, from 600 μm to 3000 μm, while S2’s range is only 300 μm to 600 μm. Figure 3 presents the mineral composition of both rocks. S1 contains quartz, kaolinite and feldspar, while S2 is made of quartz, calcite, and kaolinite. S1 had a relatively high porosity of 16.7%, a lower density of 1.99 g/cm3 and a UCS of 18.7 MPa. Sandstone 2 had a porosity of 8.4%, a density of 2.57 g/cm3 and a UCS of 47.5 MPa.
Infill clay (classified as CL) was collected as a disturbed sample from the local area where the rock was acquired. To rebuild the soil strength of the infilled material, a dry density of 1.8 g/cm3 and a moisture content of 25% [43], along with the clay for infilling giving the friction angle of 27.3° and a cohesion of 17.4 kPa, needed to be reached.
The core rock specimens were undisturbed rocks with intact rock structures. It is noted that obtaining a borehole rock core with intact infilled material is challenging. The reason is that during drilling, the infill material is typically washed away. Also, specimen preparation requires cutting the core to a certain size and placing it in plaster before shearing.
From Table 1, all different ratios of the infill thickness and asperity height have been discussed. When the infill is relatively thicker than the asperity height, the influence of infill will mainly dominate the shear strength of the joint. Therefore, in this study, compared to the JRC of the rock joint, a 1, 2, 3 mm infill have been placed in between the jointed rock.

2.3. Experimental Program

Barton’s comb was used to measure the rock surface roughness. A tilt test was used to estimate the residual friction angle of the rock [44]. To estimate the strength of the rock, a series of unconfined compression tests were conducted on cylindrical samples (diameter of 50 mm and height of 100 mm) following the Australian standard [45]. A portable shear box SL 900 was used for the direct shear test, with a sample diameter of 50 mm (Figure 4). Through presented research [43,46], the stresses used for the shear tests would represent the stress conditions acting in rock mass at depths of 20–50 m, commonly for large-size rockslides and opened cuts; a range of normal stresses (from 0.5 MPa to 1.5 MPa) [46] was used. Strain-controlled shear box tests were conducted on several rock specimens with and without clay infill. Three different infill thicknesses, 1mm, 2mm, and 3mm, were used for both sandstones.
Each specimen’s top and bottom sections were secured together with twine. A mixture of cornice cement and water in a 1:2 ratio was then prepared and poured into moulds tailored for direct shear testing, with the sample partly submerged (as shown in Figure 4a). The other half of the sample was inverted and put into a second mould with a fresh batch of cement mixture after the cement had adequately hardened (Figure 4b). The specimens were then removed from the moulds and dried in an oven at 100 °C after being sealed with cement.

3. Results and Discussion

3.1. Shear Strength of Joints without Infill

Table 2 shows the results of the direct shear test and the estimated shear stress through using the Barton and Choubey method. As Table 2 indicates, the shear strength of S2 is greater than S1 under various kinds of normal stress, which is the same as the UCS result.
Figure 5 and Figure 6 show the direct shear test results for S1 and S2 with different infill thicknesses.
It is evident from Figure 5 and Figure 6 that for both S1 and S2, the shear strength of the jointed specimens was significantly greater without the infill material, except for the normal stress of 0.5 MPa. When the clay infill was used, the shear strength decreased by twofold, which can be attributed to the effect of the softer clay. This finding indicates that the presence of clay on the rock surface tends to decrease the rock’s strength. Interestingly, the opposite effect was observed for the same rock with a greater normal stress of 1 MPa. As shown in Figure 5b and Figure 6b, the shear strength of the jointed rock specimens without the infill material was lower for both sandstones.
To better understand the effect of infill and the initial normal stress, the laboratory data were replotted in Figure 7 as the peak shear strength against the infill thickness. For S1 under the normal stress of 0.5 MPa, the shear strength of the infilled joints was observed to be relatively low compared to the specimens with no infill. Also, an increase in the infill thickness had the opposite effect on shear strength. For example, for S1, under a relatively low normal stress of 0.5 MPa, the shear strength tended to slightly increase with the infill thickness increase from 1 mm to 3 mm. However, under the greater normal stress of 1 MPa, the shear strength slightly decreased as the infill thickness increased.
Equation (1) demonstrated that during shear, JRC can be associated with shear strength. It has also been studied that after shear failure, due to the relatively low strength of the rock or applied high normal stress, the joint surface characteristics (including JRC) can be changed, and this will affect the overall shear strength of jointed rock [5,41].
Visual observations and obtained data demonstrated that three primary factors may affect the shear strength of the jointed rock with infill. Firstly, for the range of the infill thicknesses tested in this study, an increase in the infill thickness tends to decrease the shear strength of jointed rock slightly. Secondly, the 1mm infill can slightly increase the shear strength of the jointed rock. Finally, rock inhomogeneity and surface roughness can contribute to the shear strength. Typically, the infill would decrease the shear strength of jointed rocks [15,22,25,26,33,34]. However, most studies dealt with artificial specimens that would produce homogeneous rock-like material made of concrete or plaster. However, natural rocks are considered inhomogeneous with defects in different pore spaces and thus would also affect the strength of jointed rocks.

3.2. Formular Analysis of the Obtained Results

A formular-based analysis of the obtained laboratory data was conducted using the methods proposed through Equations (7) and (14), the results of which are summarised in Table 3.
The difference observed between the laboratory data and the estimated values using Equations (7) and (14) can be attributed to the fact that both methods employed plaster gypsum material with a tooth-saw surface, while the current study used real rock with irregular surfaces. Figure 8 summarises the test data and estimated results for S1 and S2.
It is evident from this figure that the existing methods tend to underpredict the shear strength of natural rocks with infill for both sandstones. The results presented in Table 3 suggest that the discrepancy between the measures and estimated results increases with increasing infill thickness. Although considering the infill cohesion, these methods do not include the friction component of the infill in the shear strength analysis. This is thought to be a reasonable assumption for the saw-tooth model or smooth joints, where the inter-friction between the infill material and the joint surface can be neglected.
However, for irregular rock surfaces like the ones used in this study, there may be a more significant effect of the friction between the rock surface and infill, especially when the thickness of the infill material increases [27]. Under relatively large normal stresses, friction occurs between the rock surface and the infill material. Considering this, the existing methods can be refined by including the friction component, as shown in Equations (16) and (17).
τ = σ n tan φ + c
τ p = σ n × t a n   {   [   J R C × l o g   ( J C S σ n ) + φ b   ] × e x p   ( β × t a )   } + τ
where, φ′ is the friction angle between the joint surface and the infill material, and c′ is the cohesion of the infill material.
Figure 9 compares the laboratory results and the estimated data using the revised formula Equation (17). It is clear that Equation (17) produces more accurate estimates of the shear strength of both sandstones with a different infill thickness. The formula-based analysis suggests that more accurate estimations can be obtained when the t/a ratio is less than 1.2 (for S1) and 1.5 (for S2). It is noted that, unlike artificially made rock-like specimens, natural rocks may contain voids and defects that are not visible during testing but still affect their overall strength. This should also be considered when Equation (17) is used to estimate the shear strength of rock.

4. Conclusions

A series of shear box tests on natural sandstone samples were conducted to study the effect of clay infill on the shear strength of natural rock. Formular-based methods were employed to estimate the shear strength of infilled rock specimens. Based on the obtained results, the following conclusions can be drawn:
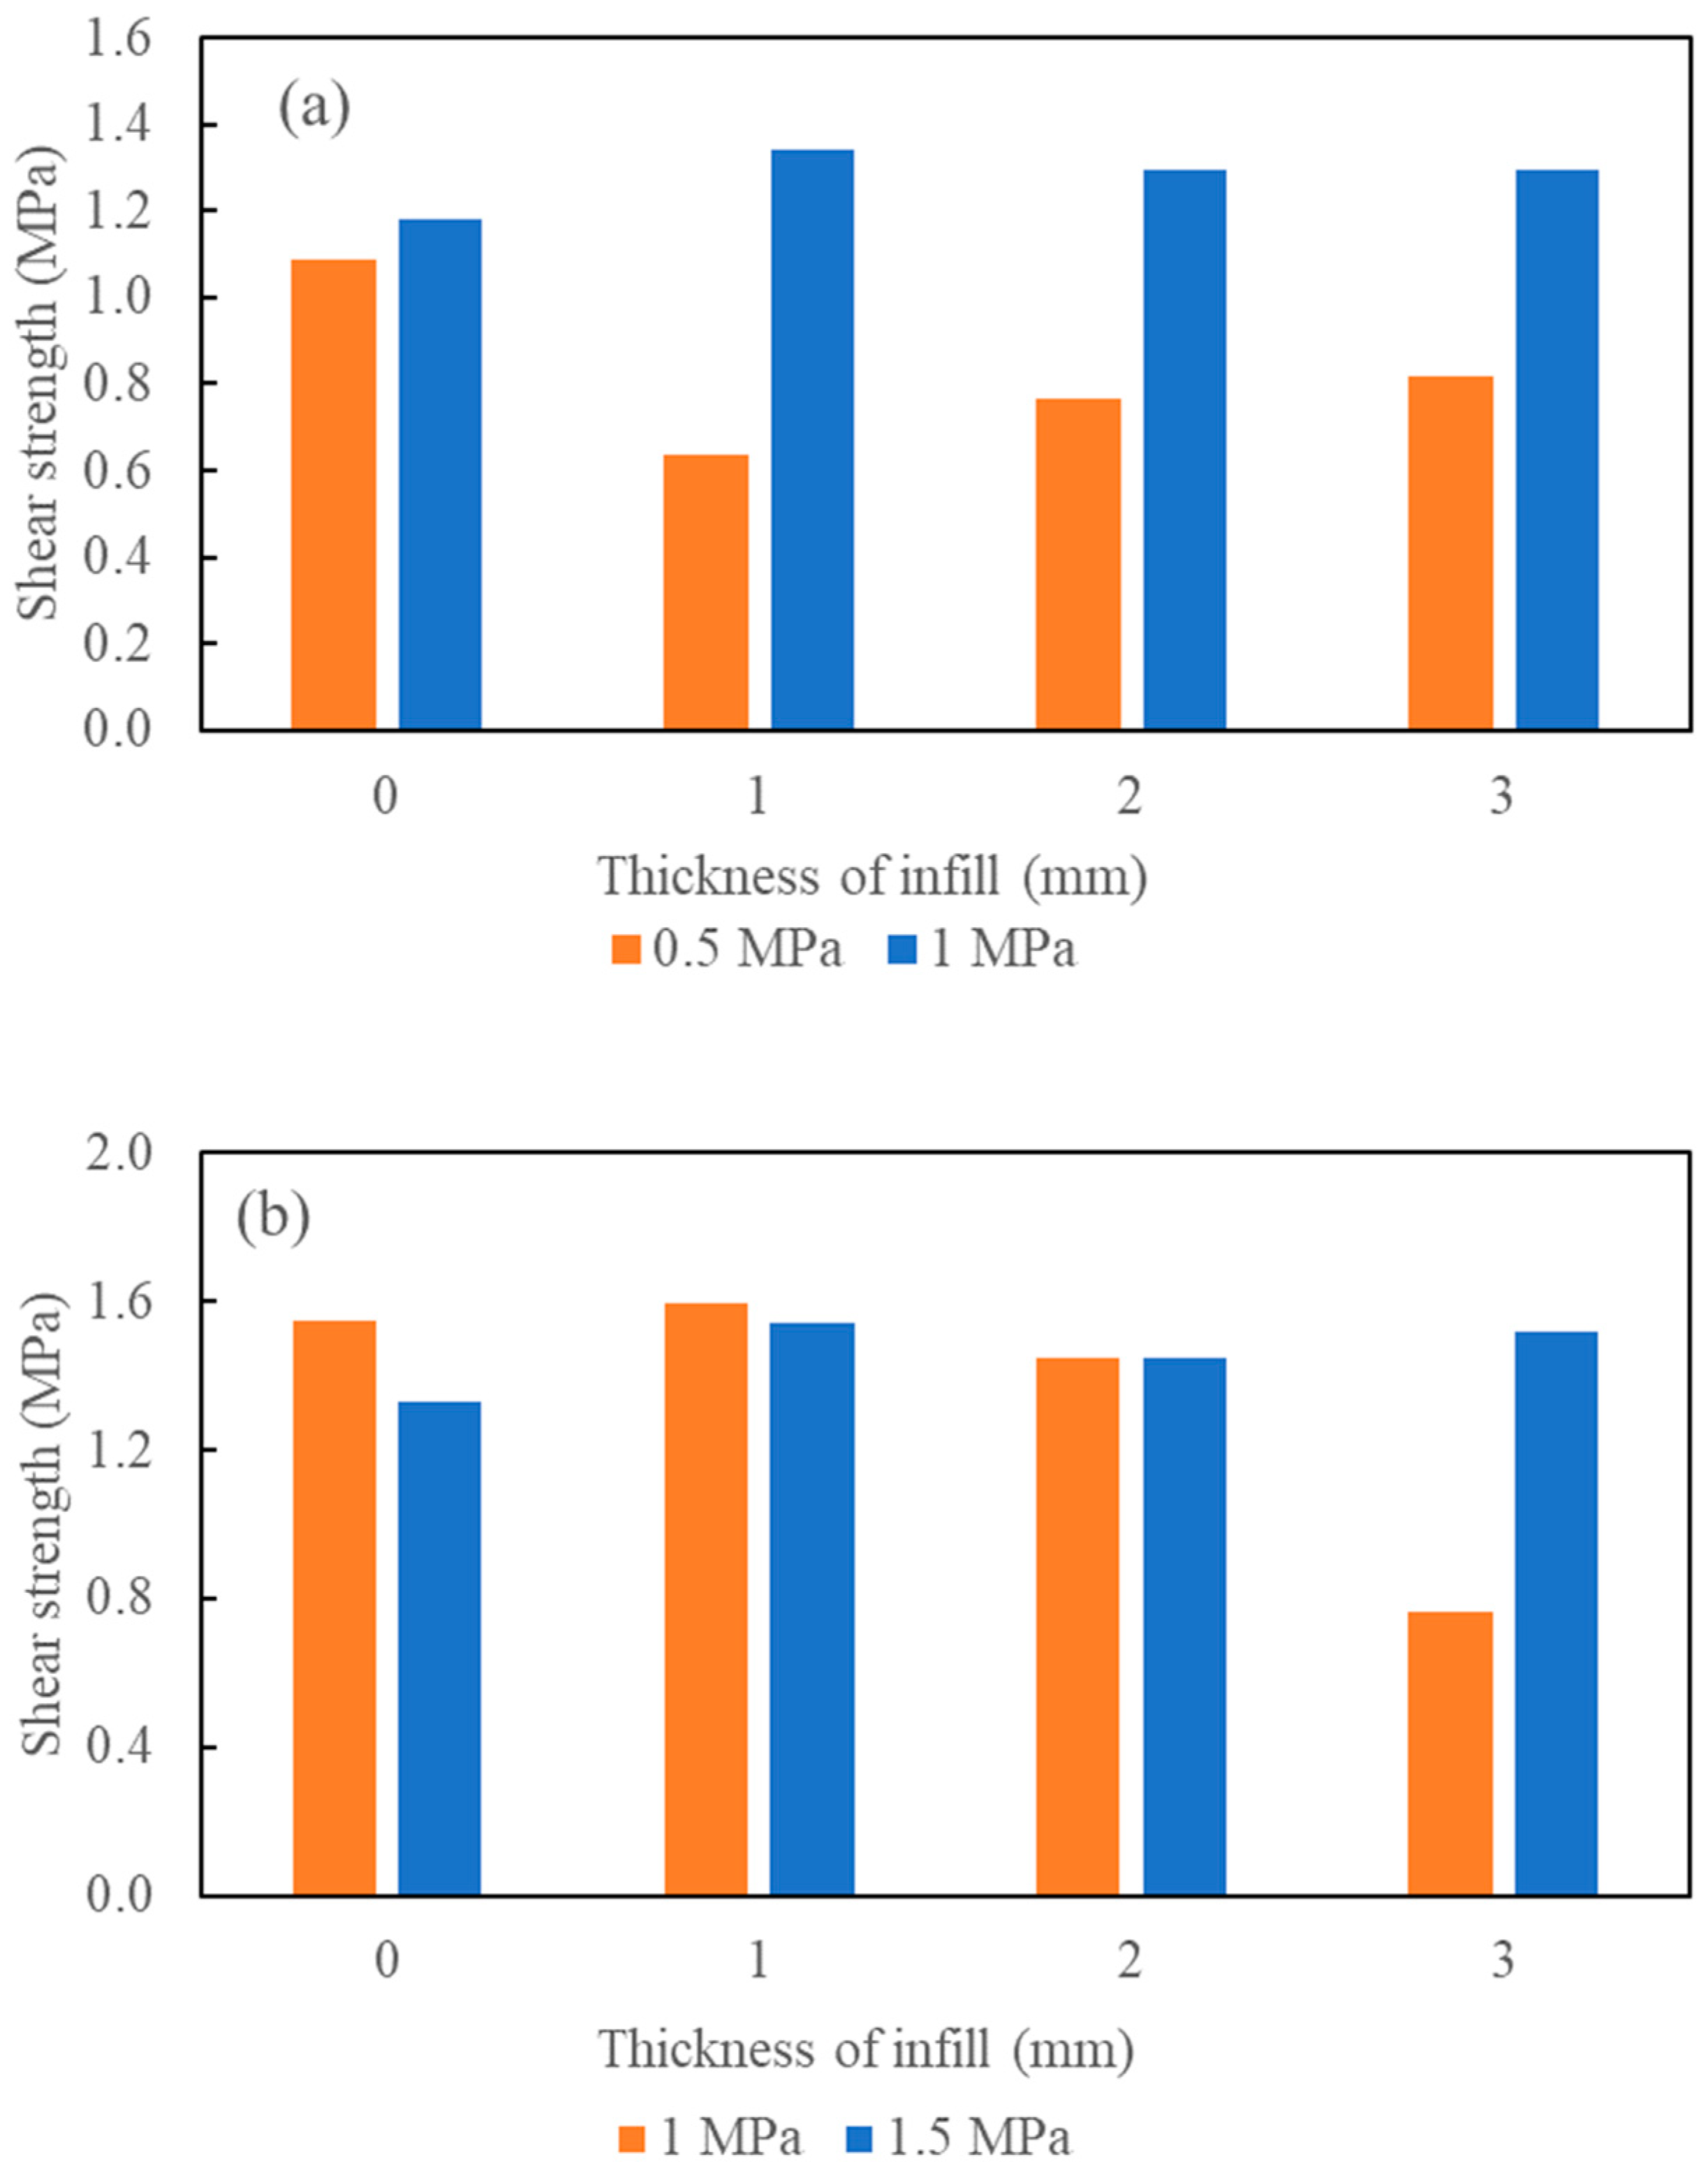
  • Although the effect of the infill is commonly associated with the decrease in the overall strength of jointed rock, the obtained data indicated that an increase in infill thickness from 1mm to 3 mm could slightly increase the shear strength of natural rock. This can be attributed to the rock inhomogeneity, which is impossible to observe in the rock-like material.
  • The critical ratio of t/a is related to the type of rock. In this study, the critical ratio obtained for S1 and S2 is relatively lower (1.2 and 1.5, respectively) than the one proposed by other researchers using artificial rock-like material such as gypsum plaster and cement. The t/a ratio may vary due to the irregular shape of the joint surface, which highlights the limitation of the commonly used saw-tooth models.
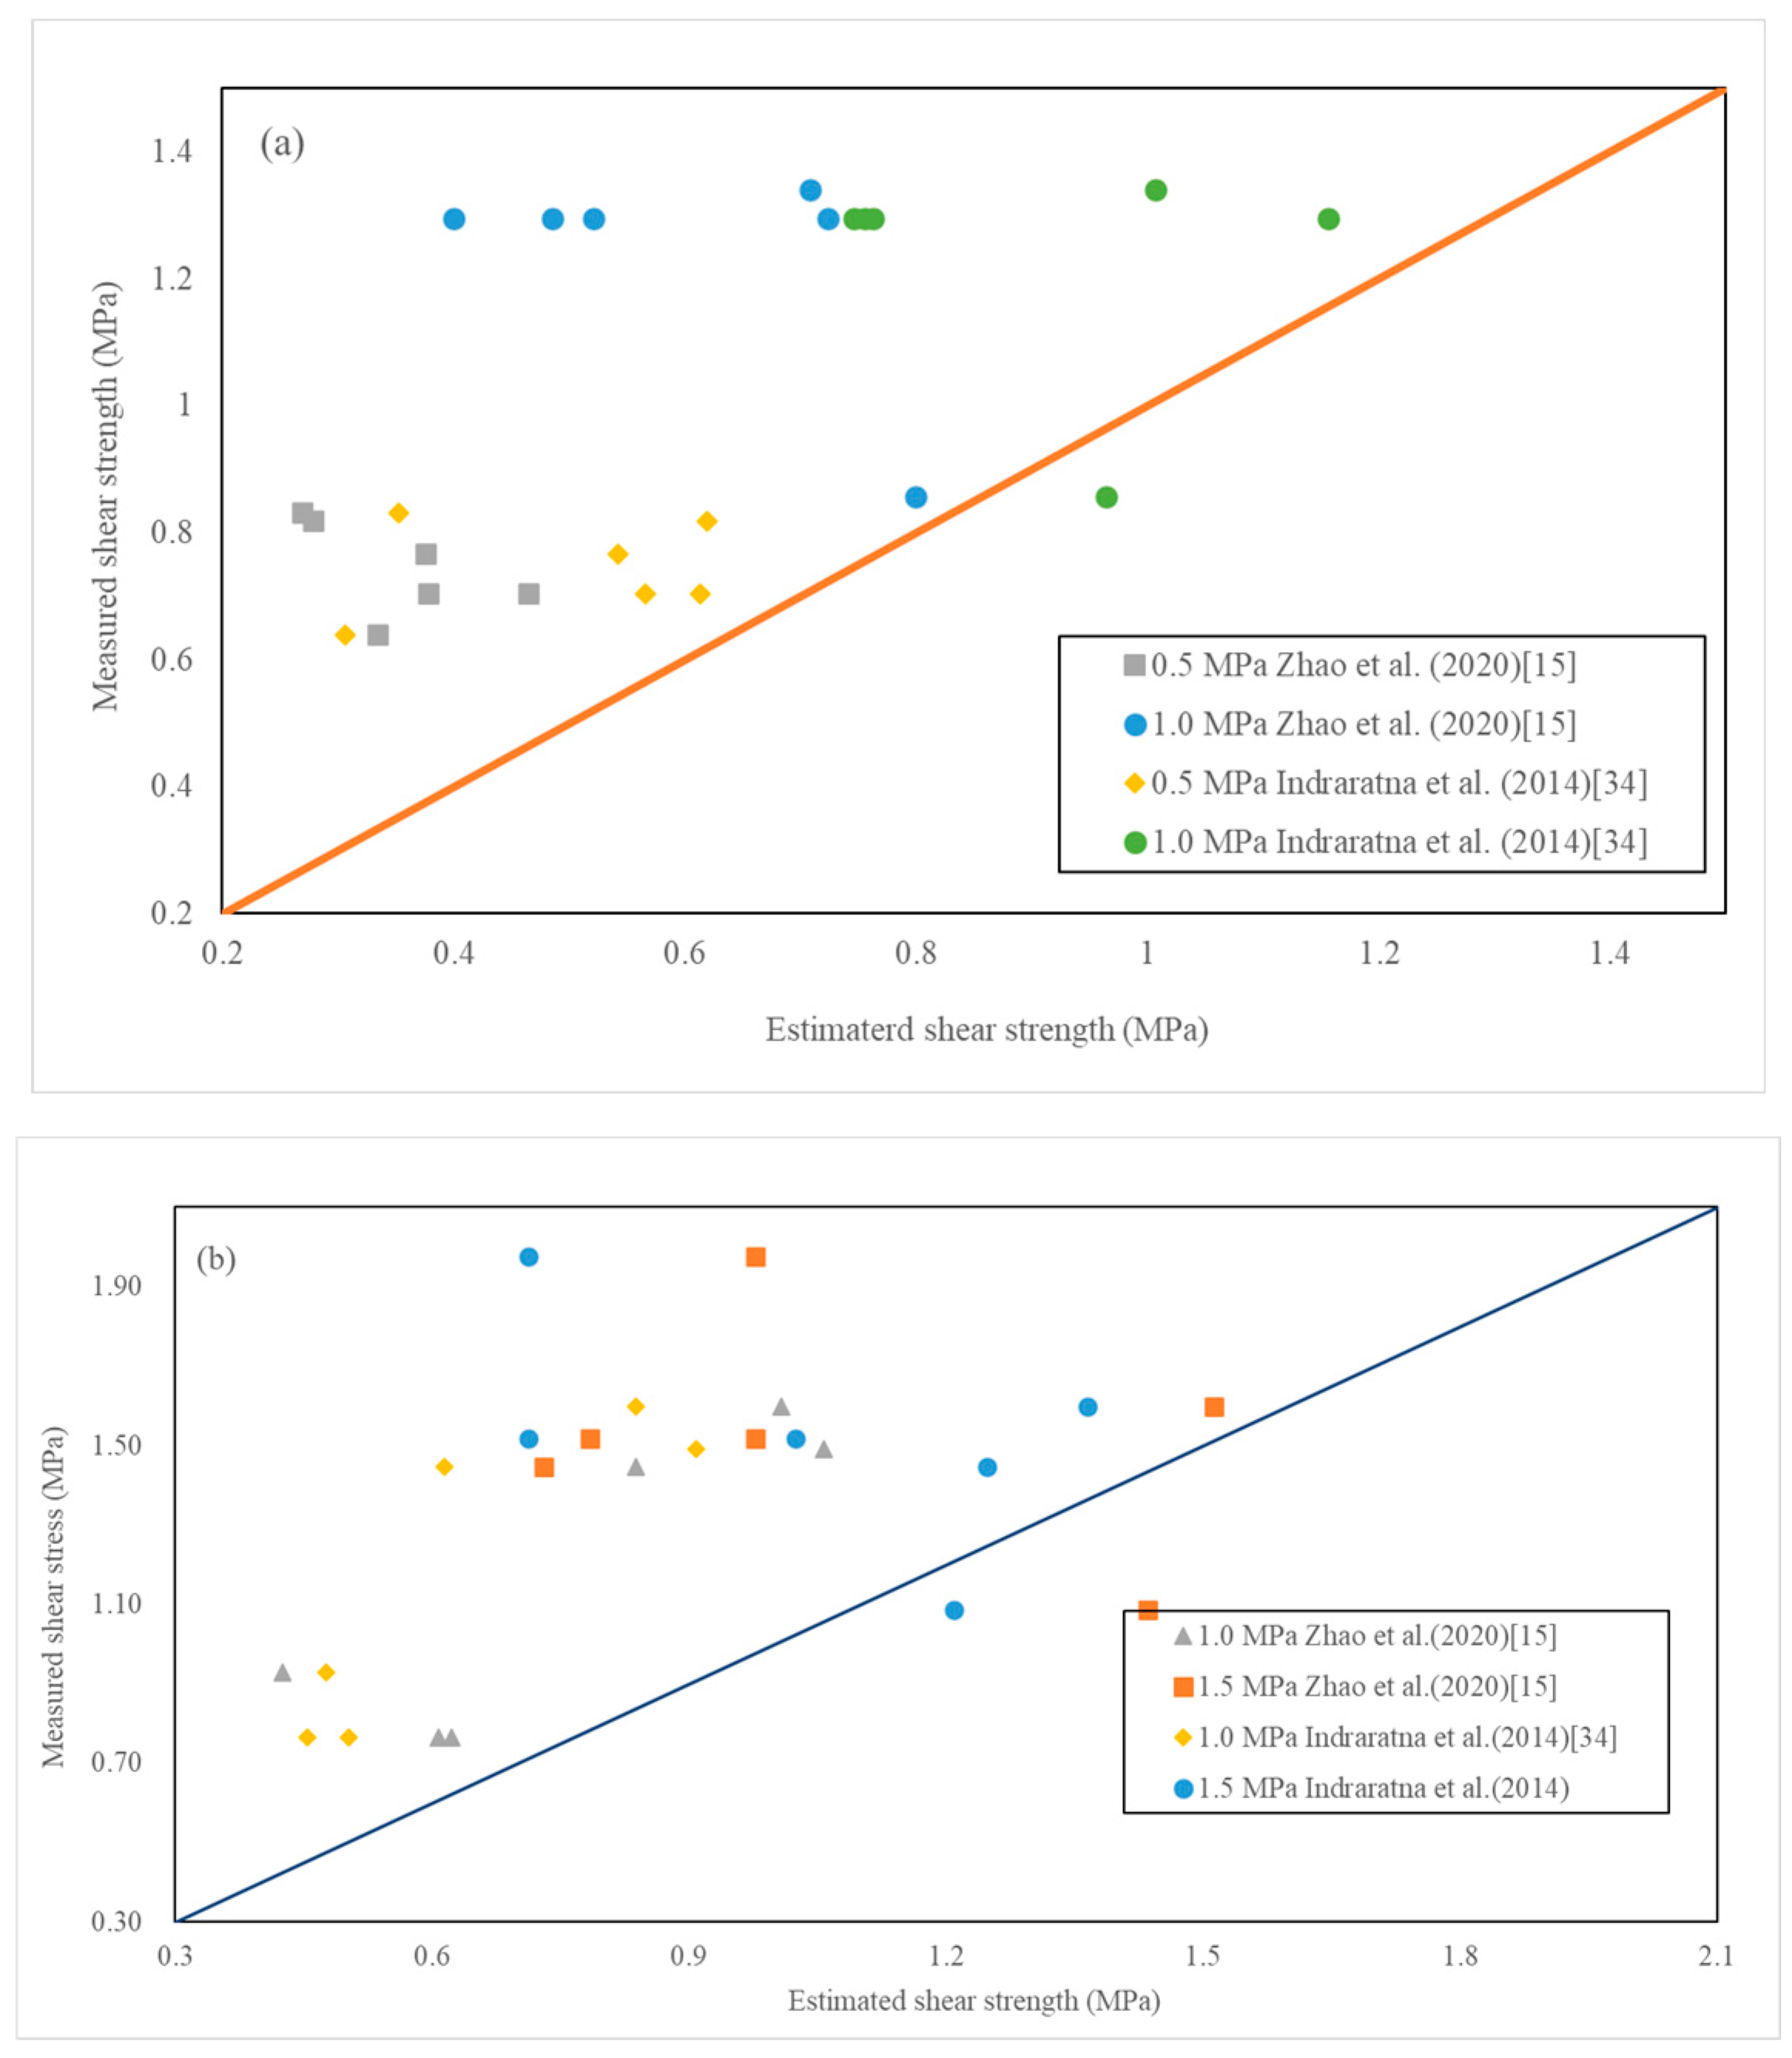
  • The existing methods of shear strength prediction may not accurately estimate the shear strength of rock specimens with irregular surfaces. The revised method considers the interaction between the rock surfaces and the infill material, which provides a more accurate estimation of the strength of this type of rock and infill material.

Author Contributions

Conceptualization, C.C. and I.G.; methodology, C.C. and I.G.; validation, C.C. and I.G.; formal analysis, C.C. and I.G.; investigation, C.C.; resources, I.G.; data curation, writing—original draft preparation, C.C. and I.G.; writing—review and editing, C.C. and I.G.; supervision, I.G. All authors have read and agreed to the published version of the manuscript.

Funding

This research received no external funding.

Data Availability Statement

The data presented in this study are openly available in article.

Conflicts of Interest

The authors declare no conflicts of interest.

References

  1. Patton, F.D. Multiple Modes of Shear Failure in Rock. In Proceedings of the 1st ISRM Congress, Lisbon, Portugal, 25 September–1 October 1966. [Google Scholar]
  2. Hoek, E.; Brown, E.T. Empirical strength criterion for rock masses. J. Geotech. Eng. Div. 1980, 106, 1013–1035. [Google Scholar] [CrossRef]
  3. Gratchev, I.; Shokouhi, A.; Kim, D.H.; Stead, D.; Wolter, A. Assessment of rock slope stability using remote sensing technique in the Gold Coast area, Australia. In Proceedings of the 18th Southeast Asian Geotechnical & Inaugural AGSSEA Conference, Singapore, 29 May–1 October 2013. [Google Scholar]
  4. Raghuvanshi, T.K. Plane failure in rock slopes–A review on stability analysis techniques. J. King Saud Univ. Sci. 2019, 31, 101–109. [Google Scholar] [CrossRef]
  5. Cui, C.; Gratchev, I.; Chung, M.; Kim, D.-H. Changes in joint surface roughness of two natural rocks during shearing. GEOMATE J. 2019, 17, 181–186. [Google Scholar] [CrossRef]
  6. Ram, B.K.; Basu, A. Shear Behavior of Unfilled-Planar Quartzitic Rock Joints with Reference to Weathering Grade of Joint Surfaces. Rock Mech. Rock Eng. 2019, 52, 4113–4121. [Google Scholar] [CrossRef]
  7. Saadat, M.; Taheri, A. A cohesive discrete element-based approach to characterizing the shear behavior of cohesive soil and clay-infilled rock joints. Comput. Geotech. 2019, 114, 103109. [Google Scholar] [CrossRef]
  8. Xia, D.; He, C.; Tang, H.; Ge, Y.; Ma, J.; Zhang, J. An Efficient Approach to Determine the Shear Damage Zones of Rock Joints Using Photogrammetry. Rock Mech. Rock Eng. 2022, 55, 5789–5805. [Google Scholar] [CrossRef]
  9. Kanji, M. Unconventional laboratory tests for the determination of the shear strength of soil-rock contacts. In Proceedings of the 3rd Congress of the International Society of Rock Mechanics, Denver, CO, USA, 1–7 September 1973. [Google Scholar]
  10. Phien-Wej, N.; Shrestha, U.B.; Rantucci, G. Effect of infill thickness on shear behavior of rock joints. In Proceedings of the International Symposium on Rock Joints, Loen, Norway, 4–6 June 1990; pp. 289–294. [Google Scholar]
  11. Jahanian, H.; Sadaghiani, M.H. Experimental study on the shear strength of sandy clay infilled regular rough rock joints. Rock Mech. Rock Eng. 2015, 48, 907–922. [Google Scholar] [CrossRef]
  12. Cheng, T.-C.; Chern, S.-G.; Wu, S.-R.; Lin, Y. Effect of infill moisture content and thickness on shear behavior of planar and rough rock joints. Geo. Eng. 2013, 47, 130–135. [Google Scholar]
  13. Lu, Y.; Wang, L.; Li, Z.; Sun, H. Experimental Study on the Shear Behavior of Regular Sandstone Joints Filled with Cement Grout. Rock Mech. Rock Eng. 2017, 50, 1321–1336. [Google Scholar] [CrossRef]
  14. Wu, X.; Zheng, H.; Wang, G.; Zhou, Y.; Guan, Z. Effect of Joint Roughness and Infill Thickness on Shear Characteristics of Rock Mass. Adv. Civ. Eng. 2022, 2022, 1991188. [Google Scholar]
  15. Zhao, Y.; Zhang, L.; Wang, W.; Liu, Q.; Tang, L.; Cheng, G. Experimental study on shear behavior and a revised shear strength model for infilled rock joints. Int. J. Geomech. 2020, 20, 04020141. [Google Scholar] [CrossRef]
  16. Zhao, Y.; Zhang, C.; Wang, Y.; Lin, H. Shear-related roughness classification and strength model of natural rock joint based on fuzzy comprehensive evaluation. Int. J. Rock Mech. Min. Sci. 2021, 137, 104550. [Google Scholar] [CrossRef]
  17. Zhao, Z.; Lin, T.; Chen, Y.; Zhao, X.; Chen, L.; Wang, J. Shear behaviors of natural rock fractures infilled with cemented calcite. Comput. Geotech. 2022, 141, 104493. [Google Scholar] [CrossRef]
  18. Kasyap, S.S.; Senetakis, K. Small-scale size effects on the shearing behavior and sliding stiffness reduction-displacement curves of rock-plastic gouge simulant under low normal stresses. J. Struct. Geol. 2022, 157, 104553. [Google Scholar] [CrossRef]
  19. Hu, H.; Zhang, X.; Cheng, Y. Experimental Study on the Rheological Shear Mechanical Behavior of Bolted Joints. Geotech. Geol. Eng. 2022, 40, 4183–4194. [Google Scholar] [CrossRef]
  20. Berisavljević, D.; Berisavljević, Z.; Melentijević, S. The shear strength evaluation of rough and infilled joints and its indications for stability of rock cutting in schist rock mass. Bull. Eng. Geol. Environ. 2022, 81, 1–15. [Google Scholar] [CrossRef]
  21. Indraratna, B.; Haque, A.; Aziz, N. Shear behaviour of idealized infilled joints under constant normal stiffness. Géotechnique 1999, 49, 331–355. [Google Scholar] [CrossRef]
  22. Indraratna, B.; Jayanathan, M. Measurement of pore water pressure of clay-infilled rock joints during triaxial shearing. Géotechnique 2005, 55, 759–764. [Google Scholar] [CrossRef]
  23. Indraratna, B.; Welideniya, H. Shear behaviour of graphite infilled joints based on constant normal stiffness (CNS) test conditions. In Proceedings of the 10th ISRM Congress, Sandton, South Africa, 8–12 September 2003. [Google Scholar]
  24. Brown, E. The mechanics of discontinua: Engineering in discontinuous rock masses. John Jaeger Memorial Lecture. In Proceedings of the 9th Australia New Zealand Conference on Geomechanics, Auckland, New Zealand, 8–11 February 2004; Volume 1, pp. 51–72. [Google Scholar]
  25. Oliveira, D.A.; Indraratna, B.; Nemcik, J. Critical review on shear strength models for soil-infilled joints. Geomech. Geoengin. Int. J. 2009, 4, 237–244. [Google Scholar] [CrossRef]
  26. Indraratna, B.; Jayanathan, M.; Brown, E.T. Shear strength model for overconsolidated clay-infilled idealised rock joints. Géotechnique 2008, 58, 55–65. [Google Scholar] [CrossRef]
  27. Naghadehi, M.Z. Laboratory Study of the Shear Behaviour of Natural Rough Rock Joints Infilled by Different Soils. Period. Polytech. Civ. Eng. 2015, 59, 413–421. [Google Scholar] [CrossRef]
  28. Indraratna, B.; Oliveira, D.; Brown, E. A shear-displacement criterion for soil-infilled rock discontinuities. Géotechnique 2010, 60, 623–633. [Google Scholar] [CrossRef]
  29. Lama, R. Influence of Clay Fillings on Shear Behaviour of Joints; International Association of Engineering Geology: Madrid, Spain, 1978. [Google Scholar]
  30. Goodman, R. The deformability of joints. In Determination of the In-Situ Modulus of Deformation of Rock; ASTM International: West Conshohocken, PA, USA, 1970. [Google Scholar]
  31. De Toledo, P.; De Freitas, M.; Gcol, C. Laboratory testing and parameters controlling the shear strength of filled rock joints. Géotechnique 1993, 43, 1–19. [Google Scholar] [CrossRef]
  32. Papaliangas, T.; Hencher, S.R.; Lumsden, A.C.; Manolopoulou, S. The effect of frictional fill thickness on the shear strength of rock discontinuities. Int. J. Rock Mech. Min. Sci. Geomech. Abstr. 1993, 30, 81–91. [Google Scholar] [CrossRef]
  33. Indraratna, B.; Welideniya, H.; Brown, E. A shear strength model for idealised infilled joints under constant normal stiffness. Géotechnique 2005, 55, 215–226. [Google Scholar] [CrossRef]
  34. Indraratna, B.; Premadasa, W.; Brown, E.T.; Gens, A.; Heitor, A. Shear strength of rock joints influenced by compacted infill. Int. J. Rock Mech. Min. Sci. 2014, 70, 296–307. [Google Scholar] [CrossRef]
  35. Liu, M.; Liu, E. Dynamic mechanical properties of artificial jointed rock samples subjected to cyclic triaxial loading. Int. J. Rock Mech. Min. Sci. 2017, 98, 54–66. [Google Scholar] [CrossRef]
  36. Li, W.-S.; Jiang, B.-Y.; Gu, S.-T.; Yang, X.-X.; Shaikh, F.U.A. Experimental study on the shear behavior of grout-infilled specimens and micromechanical properties of grout-rock interface. J. Cent. South Univ. 2022, 29, 1686–1700. [Google Scholar] [CrossRef]
  37. Barton, N.; Choubey, V. The shear strength of rock joints in theory and practice. Rock Mech. 1977, 10, 1–54. [Google Scholar] [CrossRef]
  38. Pereira, J.P. Rolling friction and shear behaviour of rock discontinuities filled with sand. Int. J. Rock Mech. Min. Sci. 1997, 34, e241–e244. [Google Scholar] [CrossRef]
  39. Singh, R.; Hassani, F.; Elkington, P. The application of strength and deformation index testing to the stability assessment of coal measures excavations. In Proceedings of the 24th US Symposium on Rock Mechanics (USRMS), College Station, TX, USA, 20–23 June 1983; OnePetro: Richardson, TZ, USA, 1983. [Google Scholar]
  40. Xu, D.-P.; Feng, X.-T.; Cui, Y.-J. An experimental study on the shear strength behaviour of an interlayered shear weakness zone. Bull. Eng. Geol. Environ. 2013, 72, 327–338. [Google Scholar] [CrossRef]
  41. Gratchev, I.; Kim, D.H.; Yeung, C.K. Strength of rock-like specimens with pre-existing cracks of different length and width. Rock Mech. Rock Eng. 2016, 49, 4491–4496. [Google Scholar] [CrossRef]
  42. Gratchev, I.; Pathiranagei, S.V.; Kim, D.H. Strength properties of fresh and weathered rocks subjected to wetting–drying cycles. Geomech. Geophys. Geo-Energy Geo-Resour. 2019, 5, 211–221. [Google Scholar] [CrossRef]
  43. Gratchev, I.; Ravindran, S.; Kim, D.H.; Cui, C.; Tang, Q. Mechanisms of shallow rainfall-induced landslides from Australia: Insights into field and laboratory investigations. In Progress in Landslide Research and Technology; Springer International Publishing: Cham, Switzerland, 2022; Volume 1, pp. 113–122. [Google Scholar]
  44. Barton, N. Review of a new shear-strength criterion for rock joints. Eng. Geol. 1973, 7, 287–332. [Google Scholar] [CrossRef]
  45. AS 1141-1996; Methods for Sampling and Testing Aggregates. Method 51: Unconfined Compressive Strength of Compacted Materials. SAI Global: Adelaide, Australia, 1996.
  46. Gratchev, I. Mechanisms of earthquake-induced landslides: Insights in field and laboratory investigations. In Proceedings of the Conference on Performance-Based Design in Earthquake. Geotechnical Engineering, Beijing, China, 15 August 2022; Springer International Publishing: Cham, Switzerland, 2022; pp. 428–436. [Google Scholar]
Figure 1. Cross-section (a) saw-tooth model with infill, (b) natural core rock joint.
Geotechnics 04 00027 g001
Figure 2. Rock sample: (a) Sandstone 1, (b) Sandstone 2.
Geotechnics 04 00027 g002
Figure 3. X-ray diffraction (XRD) for two sandstones: (a) Sandstone 1, (b) Sandstone 2.
Geotechnics 04 00027 g003
Figure 4. Experiment set up and specimens: (a) half test specimen, (b) whole test specimen.
Geotechnics 04 00027 g004
Figure 5. S1 shear strength vs. displacement with different thicknesses of infill (a) σ n = 0.5 MPa, (b) σ n = 1.0 MPa.
Geotechnics 04 00027 g005
Figure 6. S2 shear strength vs. displacement with different thicknesses of infill (a) σ n = 1   M P a , (b) σ n = 1.5 MPa.
Geotechnics 04 00027 g006
Figure 7. Shear strength vs. different infill thickness: (a) Sandstone 1, (b) Sandstone 2.
Geotechnics 04 00027 g007
Figure 8. Experiment data and the theoretical results: (a) S1, (b) S2.
Geotechnics 04 00027 g008
Figure 9. Tested result and the modified result (a) S1 (b) S2.
Geotechnics 04 00027 g009
Table 2. Direct shear test results.
Sample NumberJRCNormal Stress
(MPa)
Peak Shear Stress
(MPa)
Estimated Shear Stress
(MPa) [Equation (1)]
Sandstone 1A1170.250.720.52
A2180.51.090.89
A3150.751.131.01
A41211.181.01
A5121.251.011.31
A6101.752.102.01
A71621.991.80
Sandstone 2B1170.250.720.71
B2180.51.091.21
B3150.751.131.25
B41411.551.45
B6131.51.331.88
B7131.752.102.13
B81522.802.62
Table 3. Summary of the numerical analysis using different methods.
Sample No.Normal Stress (MPa)Infill Thickness (mm)t/aEstimated Shear Strength [Equation (7)] (MPa)Estimated Shear Strength [Equation (14)] (MPa)Experiment Tested Shear Strength (MPa)
A80.511.000.460.340.64
A910.360.310.470.70
A1020.570.570.380.77
A1120.500.540.380.70
A1230.670.610.280.82
A1331.500.620.270.83
A141.010.501.010.711.342
A1510.400.960.800.858
A1620.401.160.721.295
A1721.330.760.521.295
A1831.500.760.401.295
A1931.500.750.481.295
B91.010.290.911.061.490
B1010.350.841.011.597
B1120.590.610.841.447
B1221.190.480.430.929
B1331.060.450.610.767
B1431.260.500.620.767
B151.510.281.361.511.597
B1610.331.211.441.086
B1721.701.250.731.447
B1821.541.020.781.517
B1930.860.710.981.517
B2030.860.710.981.977
Disclaimer/Publisher’s Note: The statements, opinions and data contained in all publications are solely those of the individual author(s) and contributor(s) and not of MDPI and/or the editor(s). MDPI and/or the editor(s) disclaim responsibility for any injury to people or property resulting from any ideas, methods, instructions or products referred to in the content.

