Article

Measurements of Shear Wave Velocity for Collapsible Soil

1
Civil and Environmental Engineering Department, Rensselaer Polytechnic Institute, Troy, NY 12180, USA
2
Civil and Environmental Engineering, College of Engineering and Computing, University of South Carolina, Columbia, SC 29208, USA
3
Department of Civil and Urban Engineering, New York University Abu Dhabi, Abu Dhabi P.O. Box 129188, United Arab Emirates
*
Author to whom correspondence should be addressed.
Geotechnics 2024, 4(2), 430-446; https://doi.org/10.3390/geotechnics4020024
Submission received: 24 March 2024 / Revised: 19 April 2024 / Accepted: 26 April 2024 / Published: 28 April 2024

Abstract

:
This paper examines the effects of collapsible soil structure on shear wave velocity. The study attempts to simulate hydraulic fill sand deposits, which represent a natural soil deposition process that can result in a collapsible soil structure. A series of resonant column tests and bender element tests on Ottawa sand was conducted on sand specimens and prepared by dry pluviation and simulated hydraulic fill methods subjected to various confining pressures. Shear wave velocities measured from both methods of deposition are compared and discussed. Results from this study show that for soil specimens with the same void ratio, samples prepared by simulated hydraulic fill have a lower shear modulus and shear wave velocity than the specimens prepared by dry pluviation, and the differences are more pronounced at higher confining pressures. The resonant column test results performed in this study were consistent with results from the discrete element analysis, full-scale testing, and centrifuge testing. The discrete element analysis suggests that soil fabric and number of particle contacts are the key factors affecting the shear wave velocity. These factors are dependent on the methods of deposition. Results from this study examining hydraulic fill collapsible structure shear wave velocity provide a step forward toward a better correlation between soil dynamic properties measured in field and laboratory tests.

1. Introduction

A large amount of shear wave velocity data for clean sand measured in field tests has been published in the last few decades. This data is widely used to evaluate the liquefaction susceptibility of soil deposits. While this approach works well, the research needed to better understand pore pressure buildup and ground deformation due to earthquake shaking relies on laboratory measurements. Researchers typically correlate the shear wave velocity measured in the field to laboratory measurements using void ratio or relative density parameters. Other factors, including soil fabric created during deposition, preshaking, and overconsolidation, play important roles in affecting the shear wave velocity. A better understanding of how these factors affect the shear wave velocity of a soil deposit is the key to correlating field and laboratory data for clean sands.
The dry pluviation method is the most common method for preparing sand specimens for laboratory testing. A comprehensive resonant column and torsional shear test were conducted in [1] on clean sand specimens prepared by four different methods: air-pluviation, wet tamping, wet vibration, and water vibration. It was concluded in [1] that the effect of these preparation methods on shear wave velocity was insignificant.
Collapsible soils are defined as soils that remain in a stable state in unsaturated conditions but are susceptible to a large volume change induced by water infiltration alone or water infiltration combined with external loading and dynamic forces at full saturation or near saturation. In addition, collapsible soils have typical features that contribute to collapse, including an open (metastable) structure, which results in low bulk density, a high void ratio, and high porosity. In addition, these soils typically have a geologically young deposit, a lately altered deposit, significant sensitivity, and weak inter-particle bonding [2]. Hydraulic fill is a natural deposition of loose sand alluvial deposits and loose artificial fills in ports and other underwater construction sites [3]. Due to the depositional processes, hydraulic fill generally falls in the category of collapsible soils. According to the work done in [4,5], collapse in hydraulic fill mainly occurs from external loading, which causes a loss of bonds between the grains in a wet state [6,7]. Hydraulically deposited sands are among the most sensitive to liquefaction and lateral spreading during earthquakes [8,9]. The effect of sample preparation on shear wave velocity measured by various methods was studied in [10]; it was found that the samples prepared by moist tamping have different dynamic properties compared to samples prepared by dry tamping and air pluviation. The work done in [11] investigated the correlation between soil unit weight and shear wave velocity by void-ratio function.
The shear wave velocities of hydraulically deposited Ottawa sand measured in full-scale tests were compared with those of dry pluviated Ottawa sand measured in a series of centrifuge tests [12,13]. These tests were conducted as part of the George E. Brown Network for Earthquake Engineering Simulation (NEES) located at the Rensselaer Polytechnic Institute (RPI). The primary research in the lab is the study of liquefaction and lateral spreading of saturated loose sand. A 6 m-high soil column was prepared using Ottawa F#55 deposited by the hydraulic fill method for the full-scale tests. The physical model for the full-scale tests was simulated in the centrifuge. These centrifuge models were prepared using the dry pluviation method, followed by saturation. The void ratio of soil for both full-scale and centrifuge tests was approximately 0.74. Characterization of soil in both full-scale and centrifuge tests was the key to fully understanding the importance of soil permeability and stiffness.
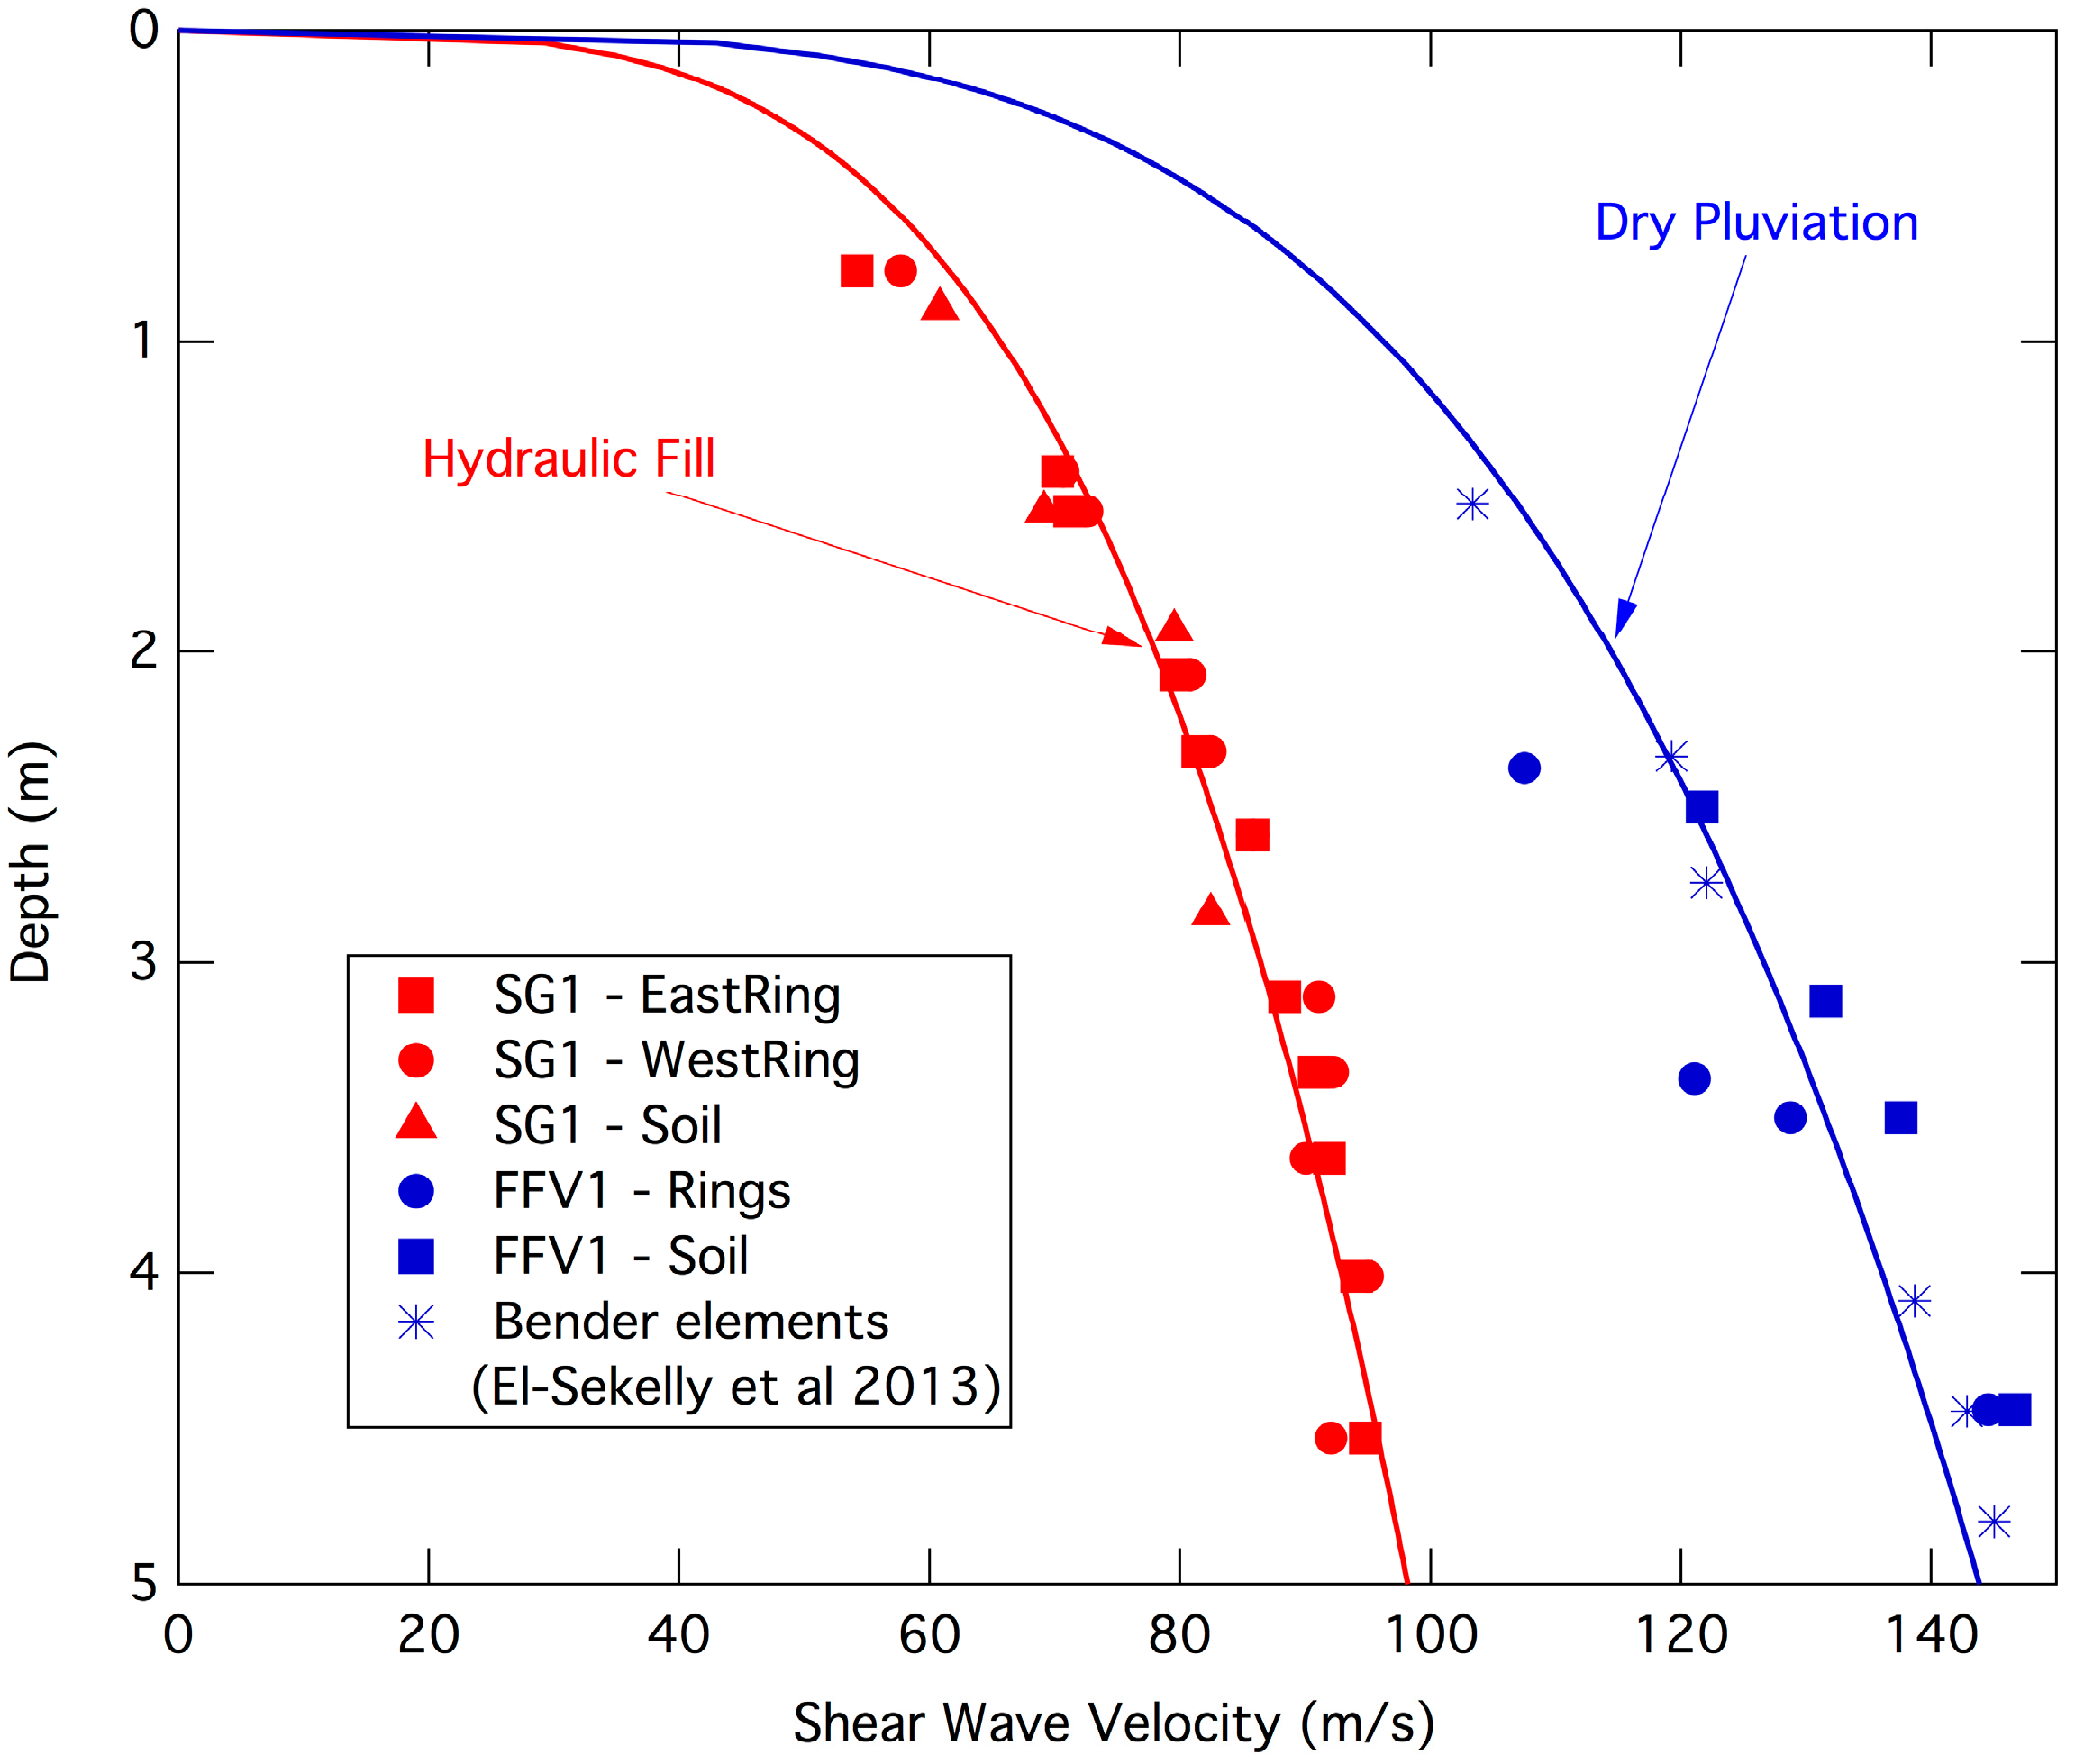
The results shown in Figure 1 reveal the effect of soil fabric (deposition method) on shear wave velocities. The use of shear wave velocity in the liquefaction chart and factors affecting shear wave velocity were discussed in [14,15]. These factors are void ratio, effective confining pressure, and coefficient of lateral stress (Ko), which can be verified from laboratory tests on dry pluviated clean sand. The shear wave velocity also increases with time under pressure [16,17]. However, the influence of fabric created by the method of sand deposition is unclear and requires further study. Effects of the deposition method become a concern because shear wave velocities measured in the laboratory are mainly based on dry pluviated specimens and may not fully reflect lower shear wave velocities of hydraulic fills measured in the field and used to evaluate the liquefaction susceptibility.
Further discussion in [15] illustrated the effect of overconsolidation and preshaking on dry pluviated sand deposits [18]. These factors cause a rapid increase in the lateral stress and Ko acting on soil, decreasing pore pressure buildup and increasing liquefaction resistance. This should also be investigated for hydraulic fill sand deposit. Recently, the work in [19] aimed to evaluate the shear wave velocity dependency on the packing density of binary mixtures with varying size ratios. The reduction of the void ratio and shear wave velocity for soil using cone penetration tests was conducted in [20], and the work in [21] aimed to evaluate the liquefaction resistance of sandy soil using the P-wave velocity. These recent studies emphasize the importance of linking the soil structure to the soil’s dynamic properties.
Based on previous studies, a better estimation of the dynamic properties of hydraulic fill is needed to bridge the gap between laboratory tests and actual field conditions in which soil fabric may change. This study examines the effects collapsible soil structure created by simulating hydraulic fill deposition has on shear wave velocity. Measurements of shear wave velocity for soil specimens prepared by two methods of soil deposition, dry pluviation and simulated hydraulic fill methods, were conducted using resonant column and bender element tests.
In this study, a sample preparation technique was developed to represent best a collapsible soil structure created by hydraulic deposition. The specimens may not entirely represent the structure of a hydraulic fill deposit in the field. Still, significant differences were intended in soil fabric and structure compared with dry pluviated specimens having the same void ratio. These differences included nonuniform layers and voids within the sample. A series of resonant column and bender element tests were performed to measure the shear wave velocities of dry pluviated and simulated hydraulic fill specimens at several void ratios. The preliminary results from the discrete element simulation were compared with the experimental test results.
Figure 1. Shear wave velocity measured from a full-scale test prepared by hydraulic fill and a centrifuge test prepared by dry pluviation (modified from [22]).
Geotechnics 04 00024 g001

2. Material Properties and Sample Preparation

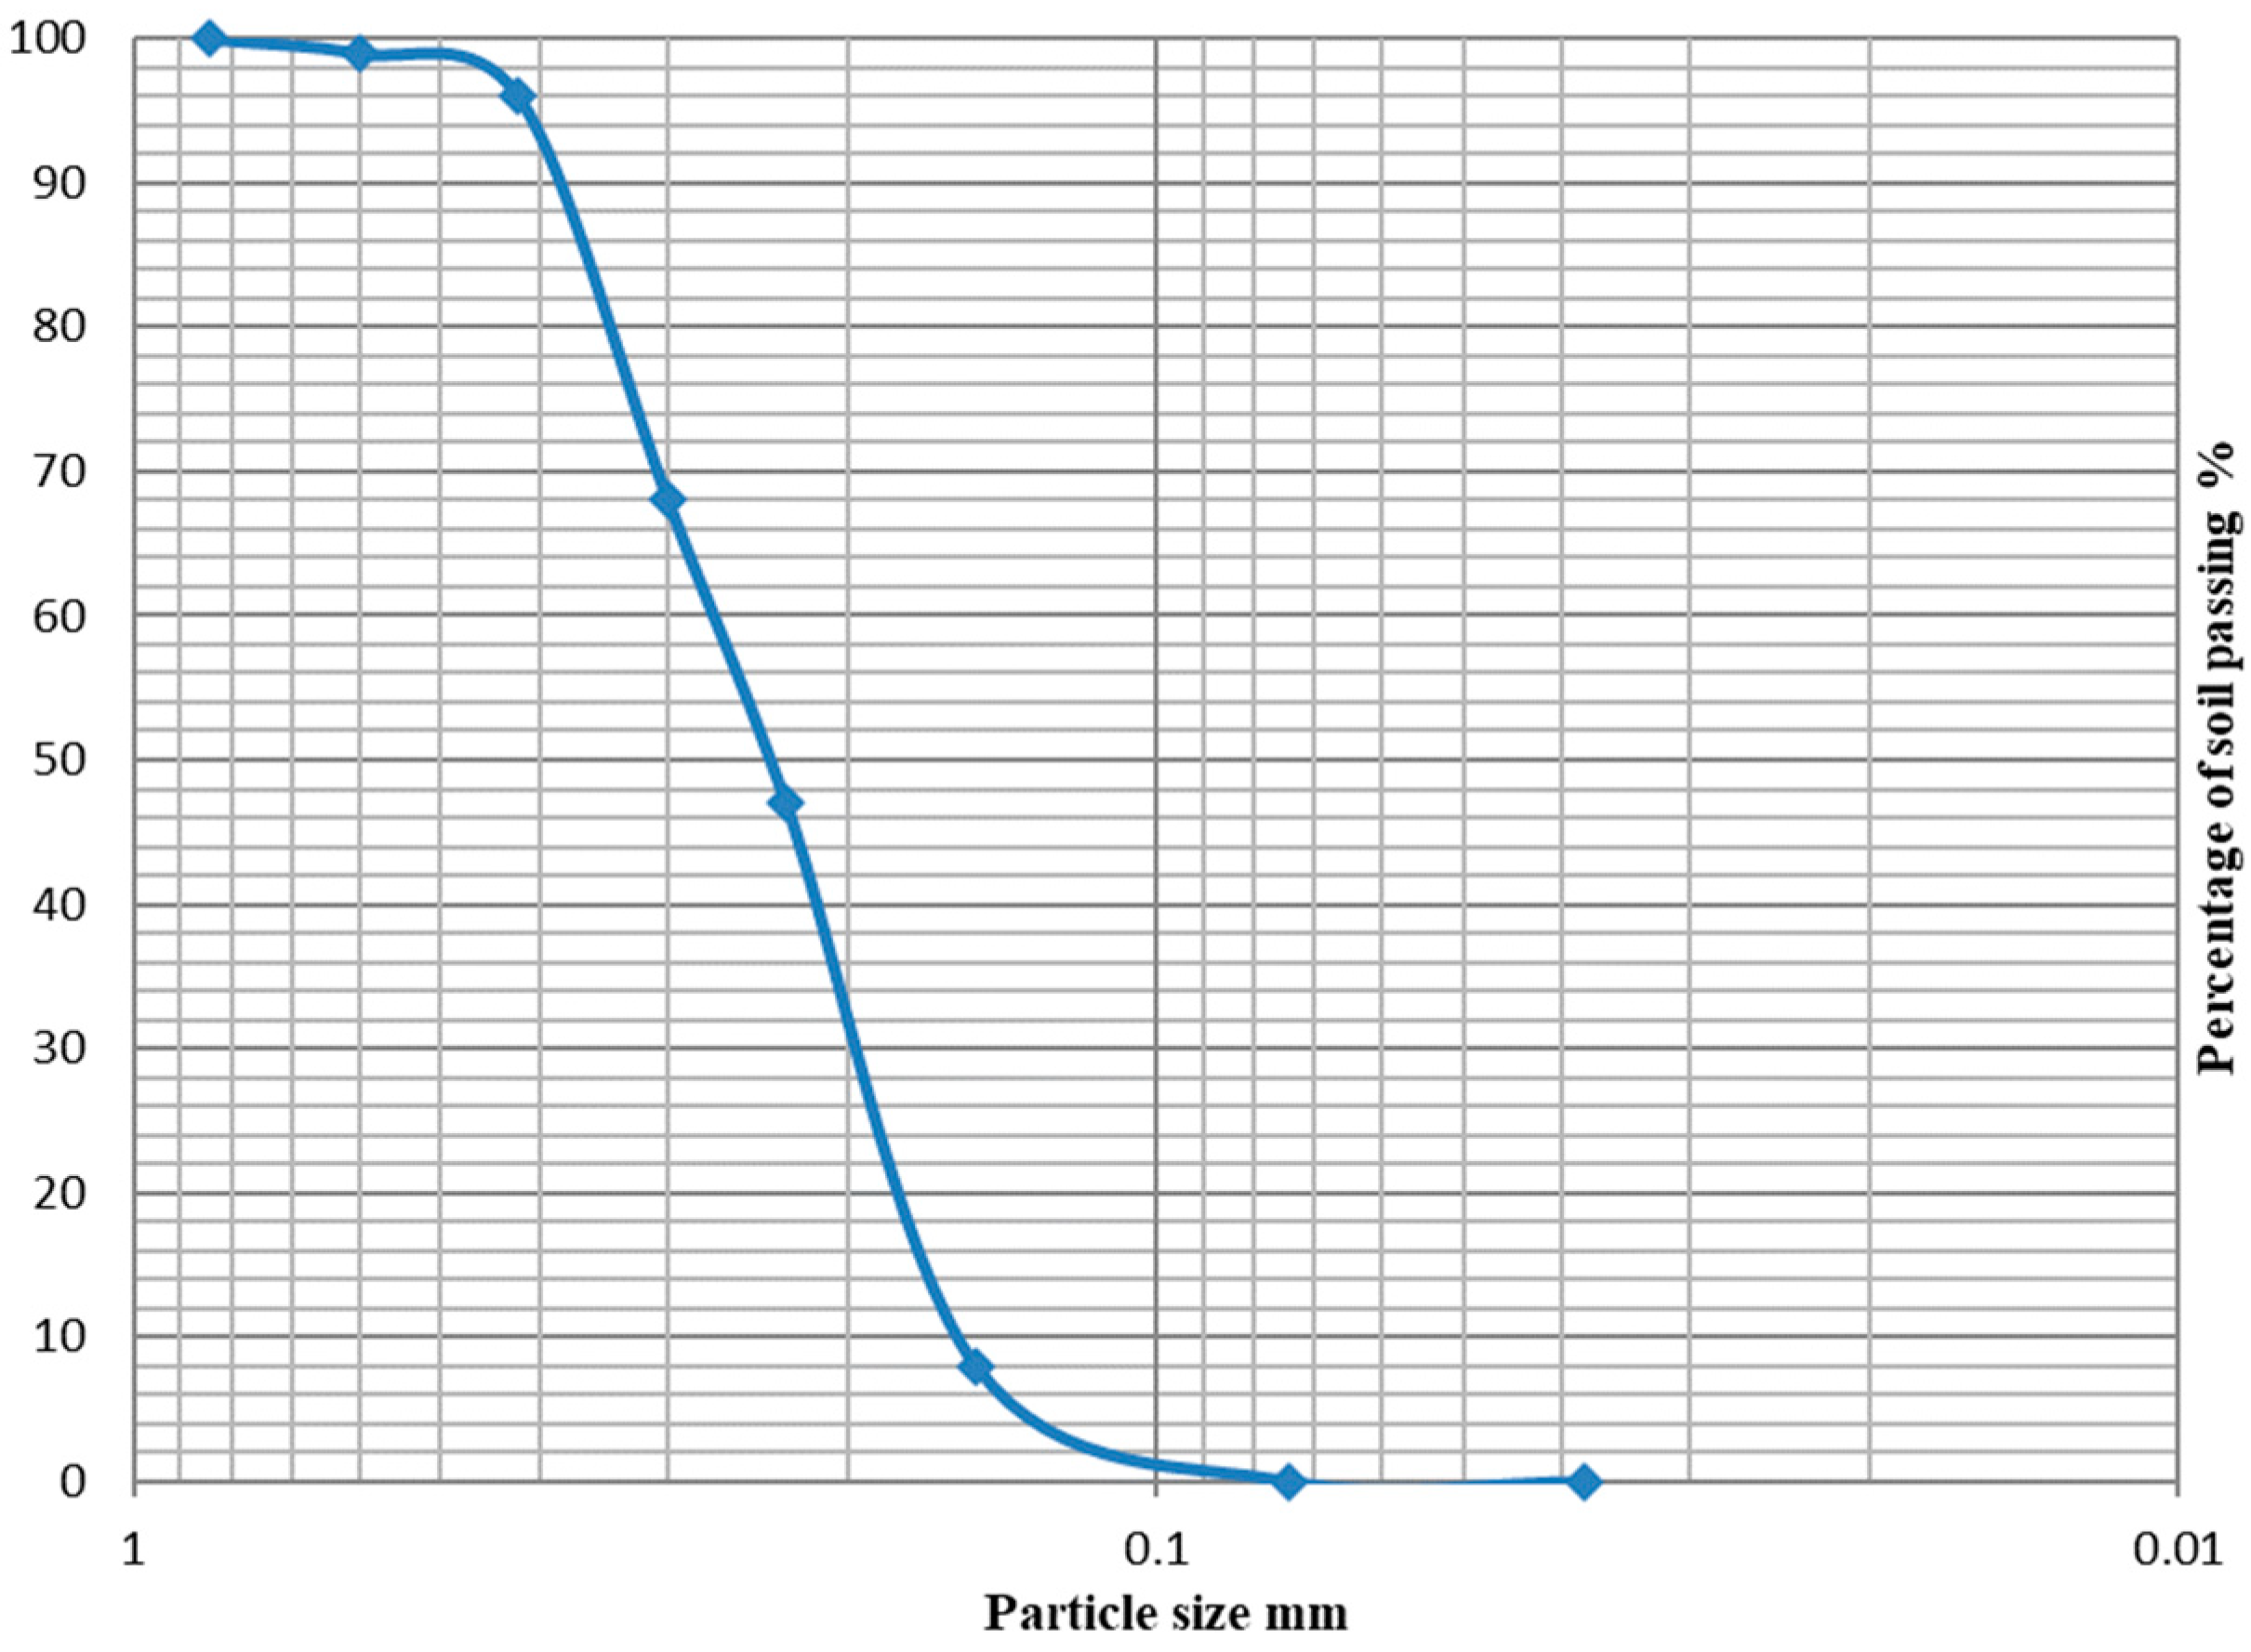
Material properties of Ottawa sand F#55 used in this study are presented in Table 1. Ottawa sand typically has round, clear, and colorless quartz grains, as shown in the microscopic image presented in Figure 2. The Ottawa sand used in this study has a range of void ratios from 0.6 to 0.8 and a range of densities from 1476 to 1650 kg/m3. This sand has a low-percent fines content (0.1%). Figure 3 shows the gradation curves of Ottawa sand F#55. Considering the parameters obtained from the gradation curve, it is uniform and well-graded. The Uniformity Coefficient (Cu) is 2, and the Coefficient of Gradation (Cg) is 1.

2.1. Dry Pluviation Specimen Preparation

A split mold and latex membrane were assembled around the base pedestal of the resonant column device, and vacuum pressure was applied to the mold and membrane. The sand was then pluviated using a typical plastic funnel in approximately seven layers with an average thickness of 20 mm. The lower layers of sand are expected to become denser due to the weight of the upper layer. To ensure that the specimen has uniform density throughout, the thickness of each lower layer is slightly more significant than the upper layers. The density of each sand specimen was controlled by adjusting the drop height from the tip of the funnel to the surface of the sand specimen. This study’s approximate drop heights were 127 mm (5 in) and 76 mm (3 in) for the void ratios of 0.62 and 0.72, respectively. For the specimen with a void ratio of 0.77, the funnel tip was positioned just above the sand surface but not allowed to contact the surface. The drop heights were determined based on several trials to reach the desired void ratio. After the sand specimen was formed in the split mold and the top cap was placed, the vacuum was applied to the specimen. The top cap and based pedestal with attached bender sensors were used for the bender element test. After removing the mold, the resonant column drive plate and other components, such as proximitors and a LVDT sensor, were installed. The cell chamber was installed, and the cell pressure was gradually increased to the target confining pressure while reducing the vacuum pressure in the specimen. During this time, the settlement of the specimen was monitored using the LVDT. In this study, the RC test was performed under fully drained conditions.

2.2. Simulated Hydraulic Fill Specimen Preparation

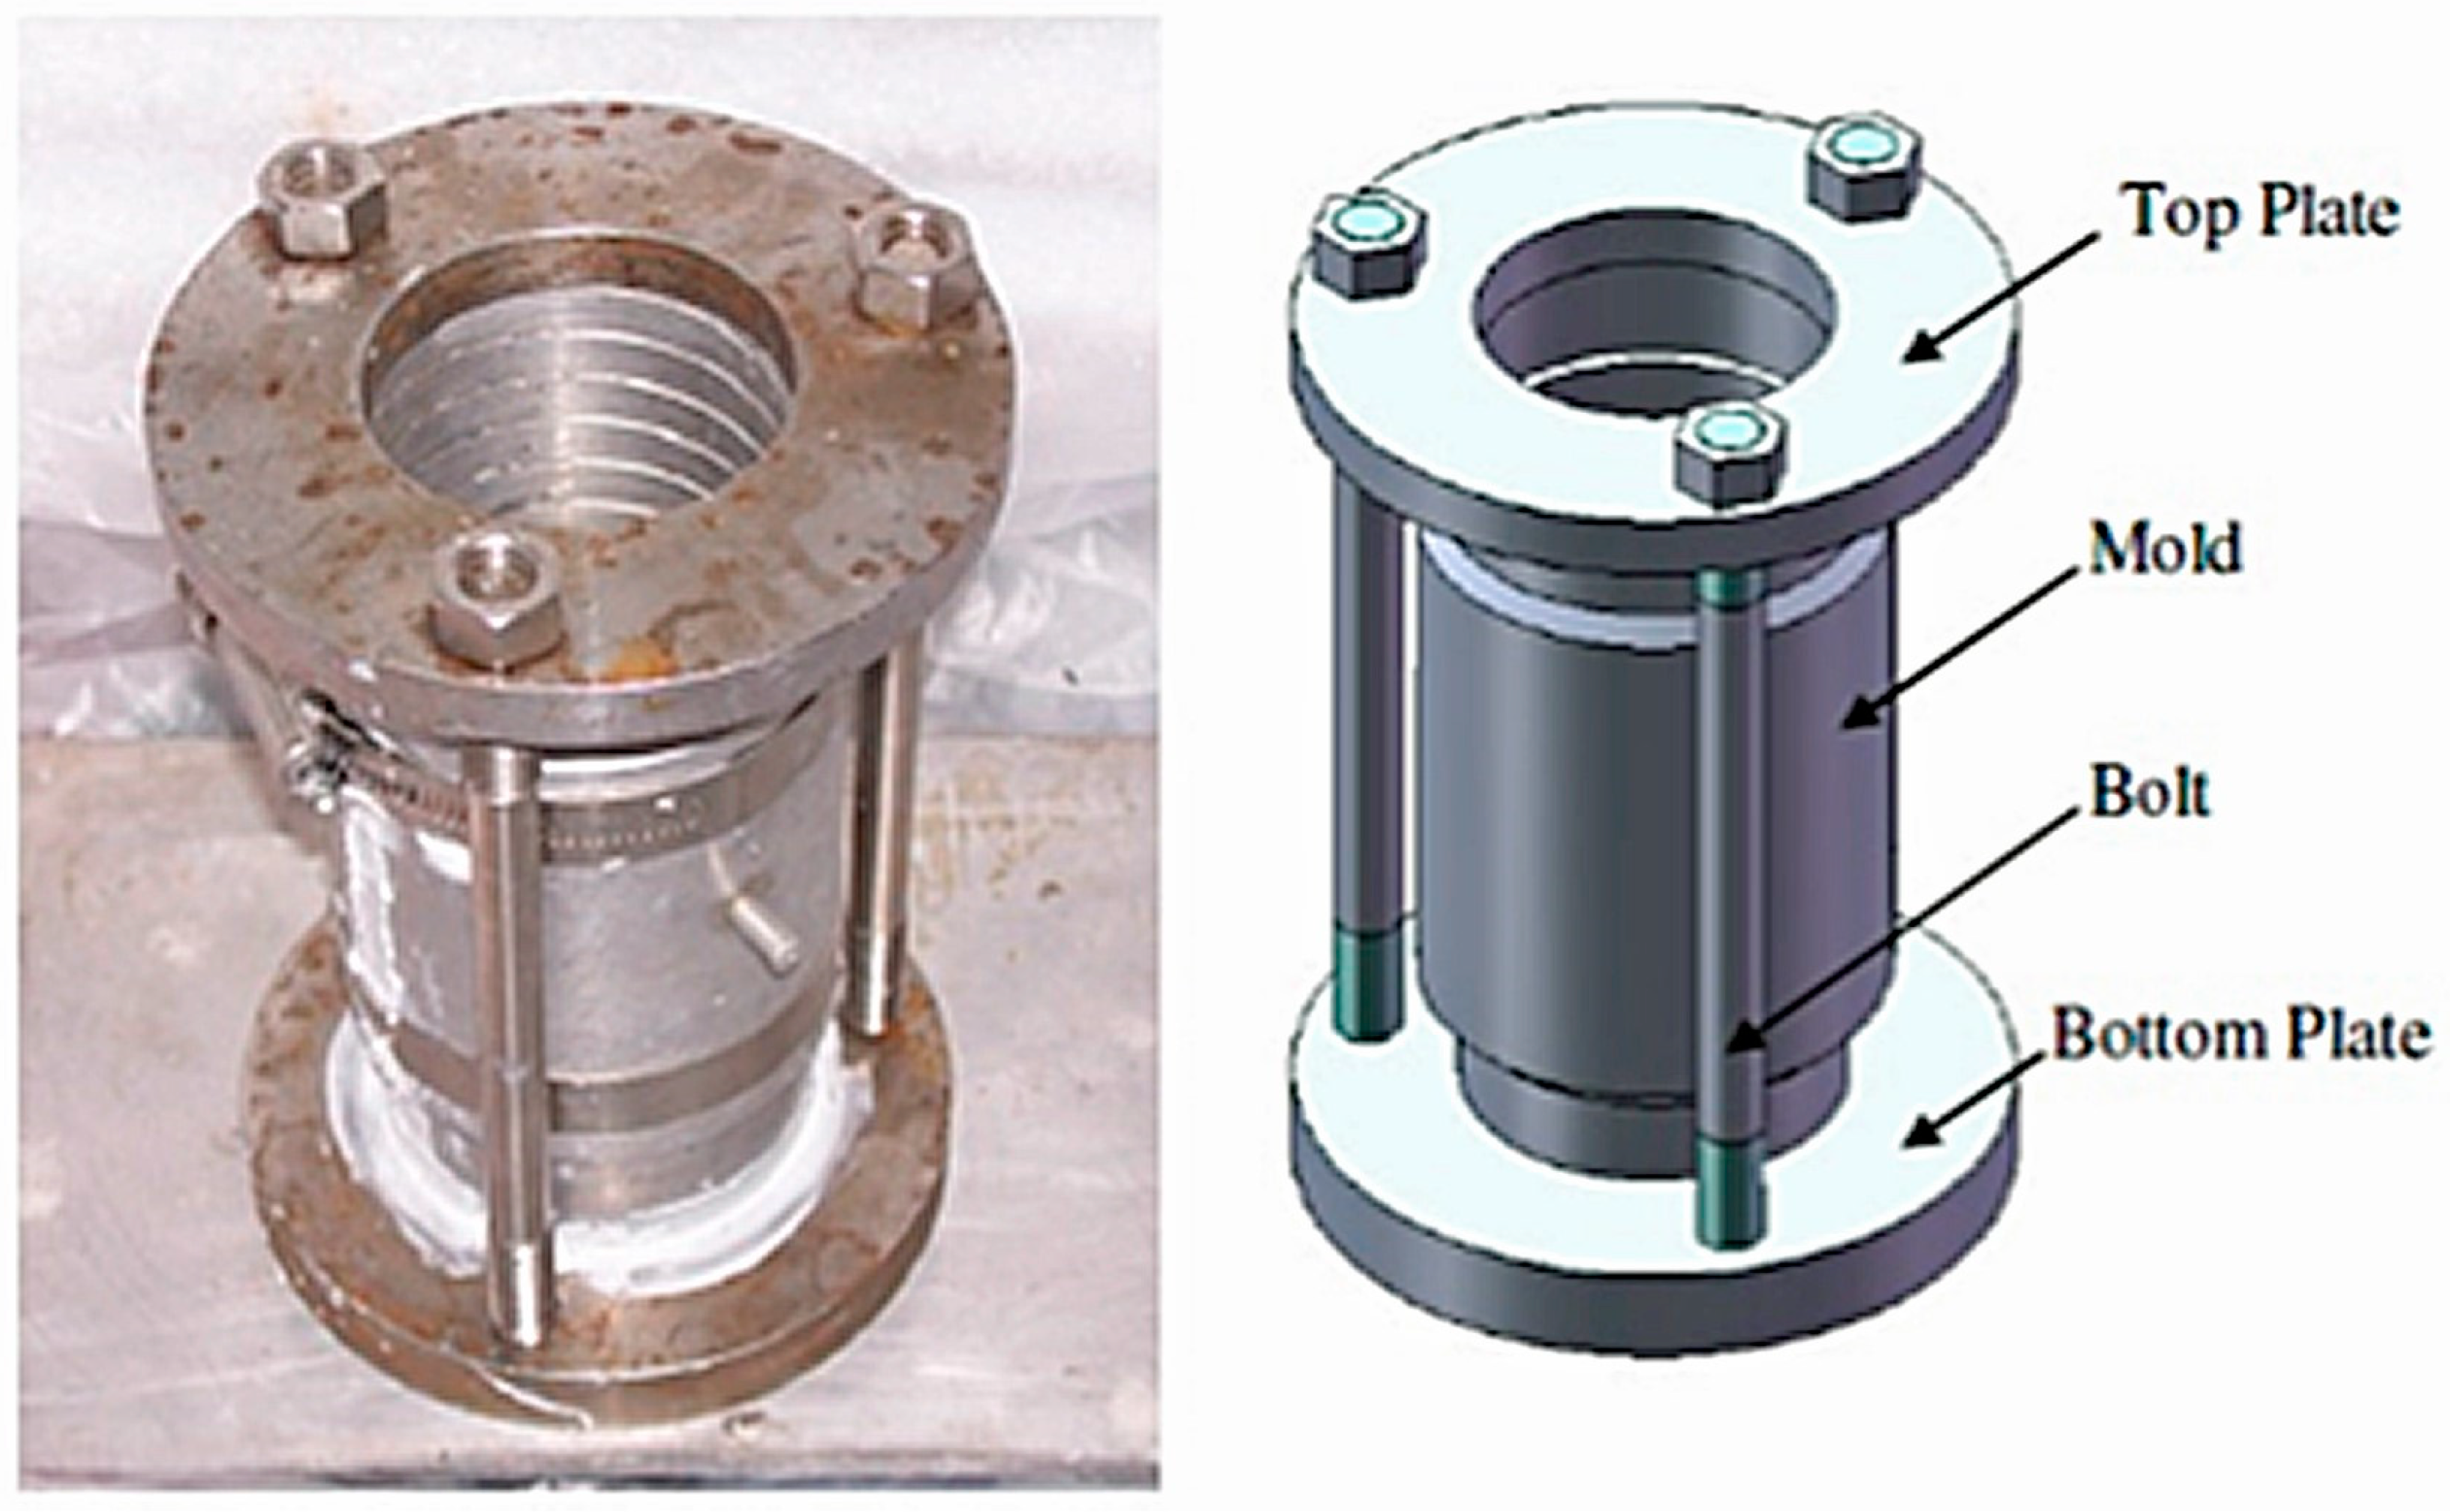
A typical split mold was modified to prepare a simulated hydraulic fill specimen, as shown in Figure 4. This mold was constructed from a typical two-part split mold, top and bottom steel plates, and three steel rods and nuts. The top and bottom plates were designed to seal against the top and bottom of the mold. The top and bottom plates were connected securely using three threaded steel rods tightened by nuts. A rubber gasket was used to seal the mold at the bottom. Silicone was applied to help seal the gap between the two pieces of the split mold, as well as the top and bottom plates. This system was completely sealed while preparing the hydraulic fill specimen.
In this study, frozen hydraulic fill soil specimens were used to ease measuring and test setups. An important aspect of testing saturated soils is the capillary effect on the shear modulus. It was shown in [24] that there was little difference in the small strain shear modulus (Gmax) over the degree of saturation (Sr) range between 70 and 100%, and the value of Gmax was the same for Sr = 0% and Sr = 100%.
The simulated hydraulic fill specimen was prepared following the procedure presented in Figure 5. Dry Ottawa sand was thoroughly mixed with water in a cup and poured into the mold in multiple lifts. The quantity of added water varied depending on the target void ratio of the specimen. For a specimen with a target void ratio of 0.60, water was added until the mixture had a texture of soft mud. The volume of water added to the sand was decreased for higher target void ratios. For a specimen with a void ratio of 0.74 or higher, a very small amount of water was added until the mixture just began to stick together and easily form a clump.
The proper amount of water and observed texture of the soil–water mixture were accomplished by several trials. When preparing the specimen in a mold for the specimens with void ratios of 0.60 and 0.70, the sand mixture was dropped into the mold in one-inch lifts. For the specimens with a void ratio of 0.74 or higher, the sand mixture was slowly placed gently into the mold to avoid any compaction or change of specimen texture. After each lift, additional water was gently added into the mold by pouring down at the side of the mold until the sand layer was inundated with water. Pouring water slowly at the side of the mold is critical as this minimizes the development of air bubbles that can be trapped between the soil particles. This process was repeated until the mold was filled. The mold was then kept in the freezer at −20 °C for approximately 24 h. Samples were only allowed to expand vertically during the freezing process [23]. More details regarding the use of frozen samples in RC testing and preparation techniques can be found in the work discussed in [25,26,27].
The frozen specimen was then trimmed, removed from the mold, and carefully placed on the bottom platen of the resonant column device. The latex membrane was then placed over the specimen. The rest of the setup procedure is similar to that of the dry pluviation specimen. The whole process is done as quickly as possible to avoid the specimen thawing out. The specimen drainage was permitted during the entire testing sequence. A burette system connected to the drainage line at the base plate was used to maintain specimen water level and saturation. Testing was performed under drained conditions. After the cell pressure was applied, the frozen specimen was left to thaw for approximately 4 to 6 h [23]. Low-amplitude RC tests were performed periodically to monitor the decreasing resonant frequency of the specimen. The specimen was completely thawed when there was no further reduction of the resonant frequency.
It is important to note that the volume of water increased by approximately 9% during freezing. When using frozen samples, as the sample thaws, the ice contracts as it melts to water, and the volume of the specimen decreases. The void ratio of the completely thawed sample was calculated by two assumptions: the volume of air remained unchanged during freezing, and the thickness of the thawed surface around the specimen was constant. In this study, the change in sample height (and diameter) during thawing was observed to be very small. As a result, the void ratio changes due to the freezing process could be neglected. After all measurements were complete, the device was disassembled, and the final weight of the specimen was measured to determine the final total unit weight and void ratio of the soil.

3. Testing Procedure

Resonant column and bender element tests were performed to measure the dynamic properties of these Ottawa sand specimens, with void ratios ranging from 0.6 to 0.8 at confining pressures of 15, 30, and 60 kPa. Those pressures were chosen to be compared with the work done in [16]. All the tests were performed at the NEES facility located at RPI. The measured dynamic properties were modulus reduction, damping curves, and low-strain shear wave velocities. These specimens were prepared using two different methods: dry pluviation and simulated hydraulic fill. To verify the repeatability of the test results and specimen preparation, these tests were performed on two identically prepared specimens at each void ratio.
In addition to the dynamic properties’ measurements, preshaking was performed on the hydraulic fill specimens at void ratios of 0.75, 0.76, and 0.77 at a confining pressure of 60 kPa. Preshaking is a testing procedure performed by applying a low-frequency, medium-to-high strain cyclic loading to the soil without significant change of the initial relative density or void ratio [18]. The confining pressure of 60 kPa was chosen because, at lower confining pressures, preshaking can easily alter the high void ratio of the sand. In this study, the preshaking was performed by applying 10 cycles of a 1 Hz cyclic torsional loading to the simulated hydraulic fill sand specimens. The settlement of sand specimens was monitored during this process to ensure that there was minimal change in the void ratio. The amplitude of the torsional loading gradually increased until the change of low-strain shear wave velocity was observed. Table 2 shows a summary of sand specimens tested and the methods of testing performed in this study.

4. Results and Discussion

4.1. Modulus Reduction and Damping Curves

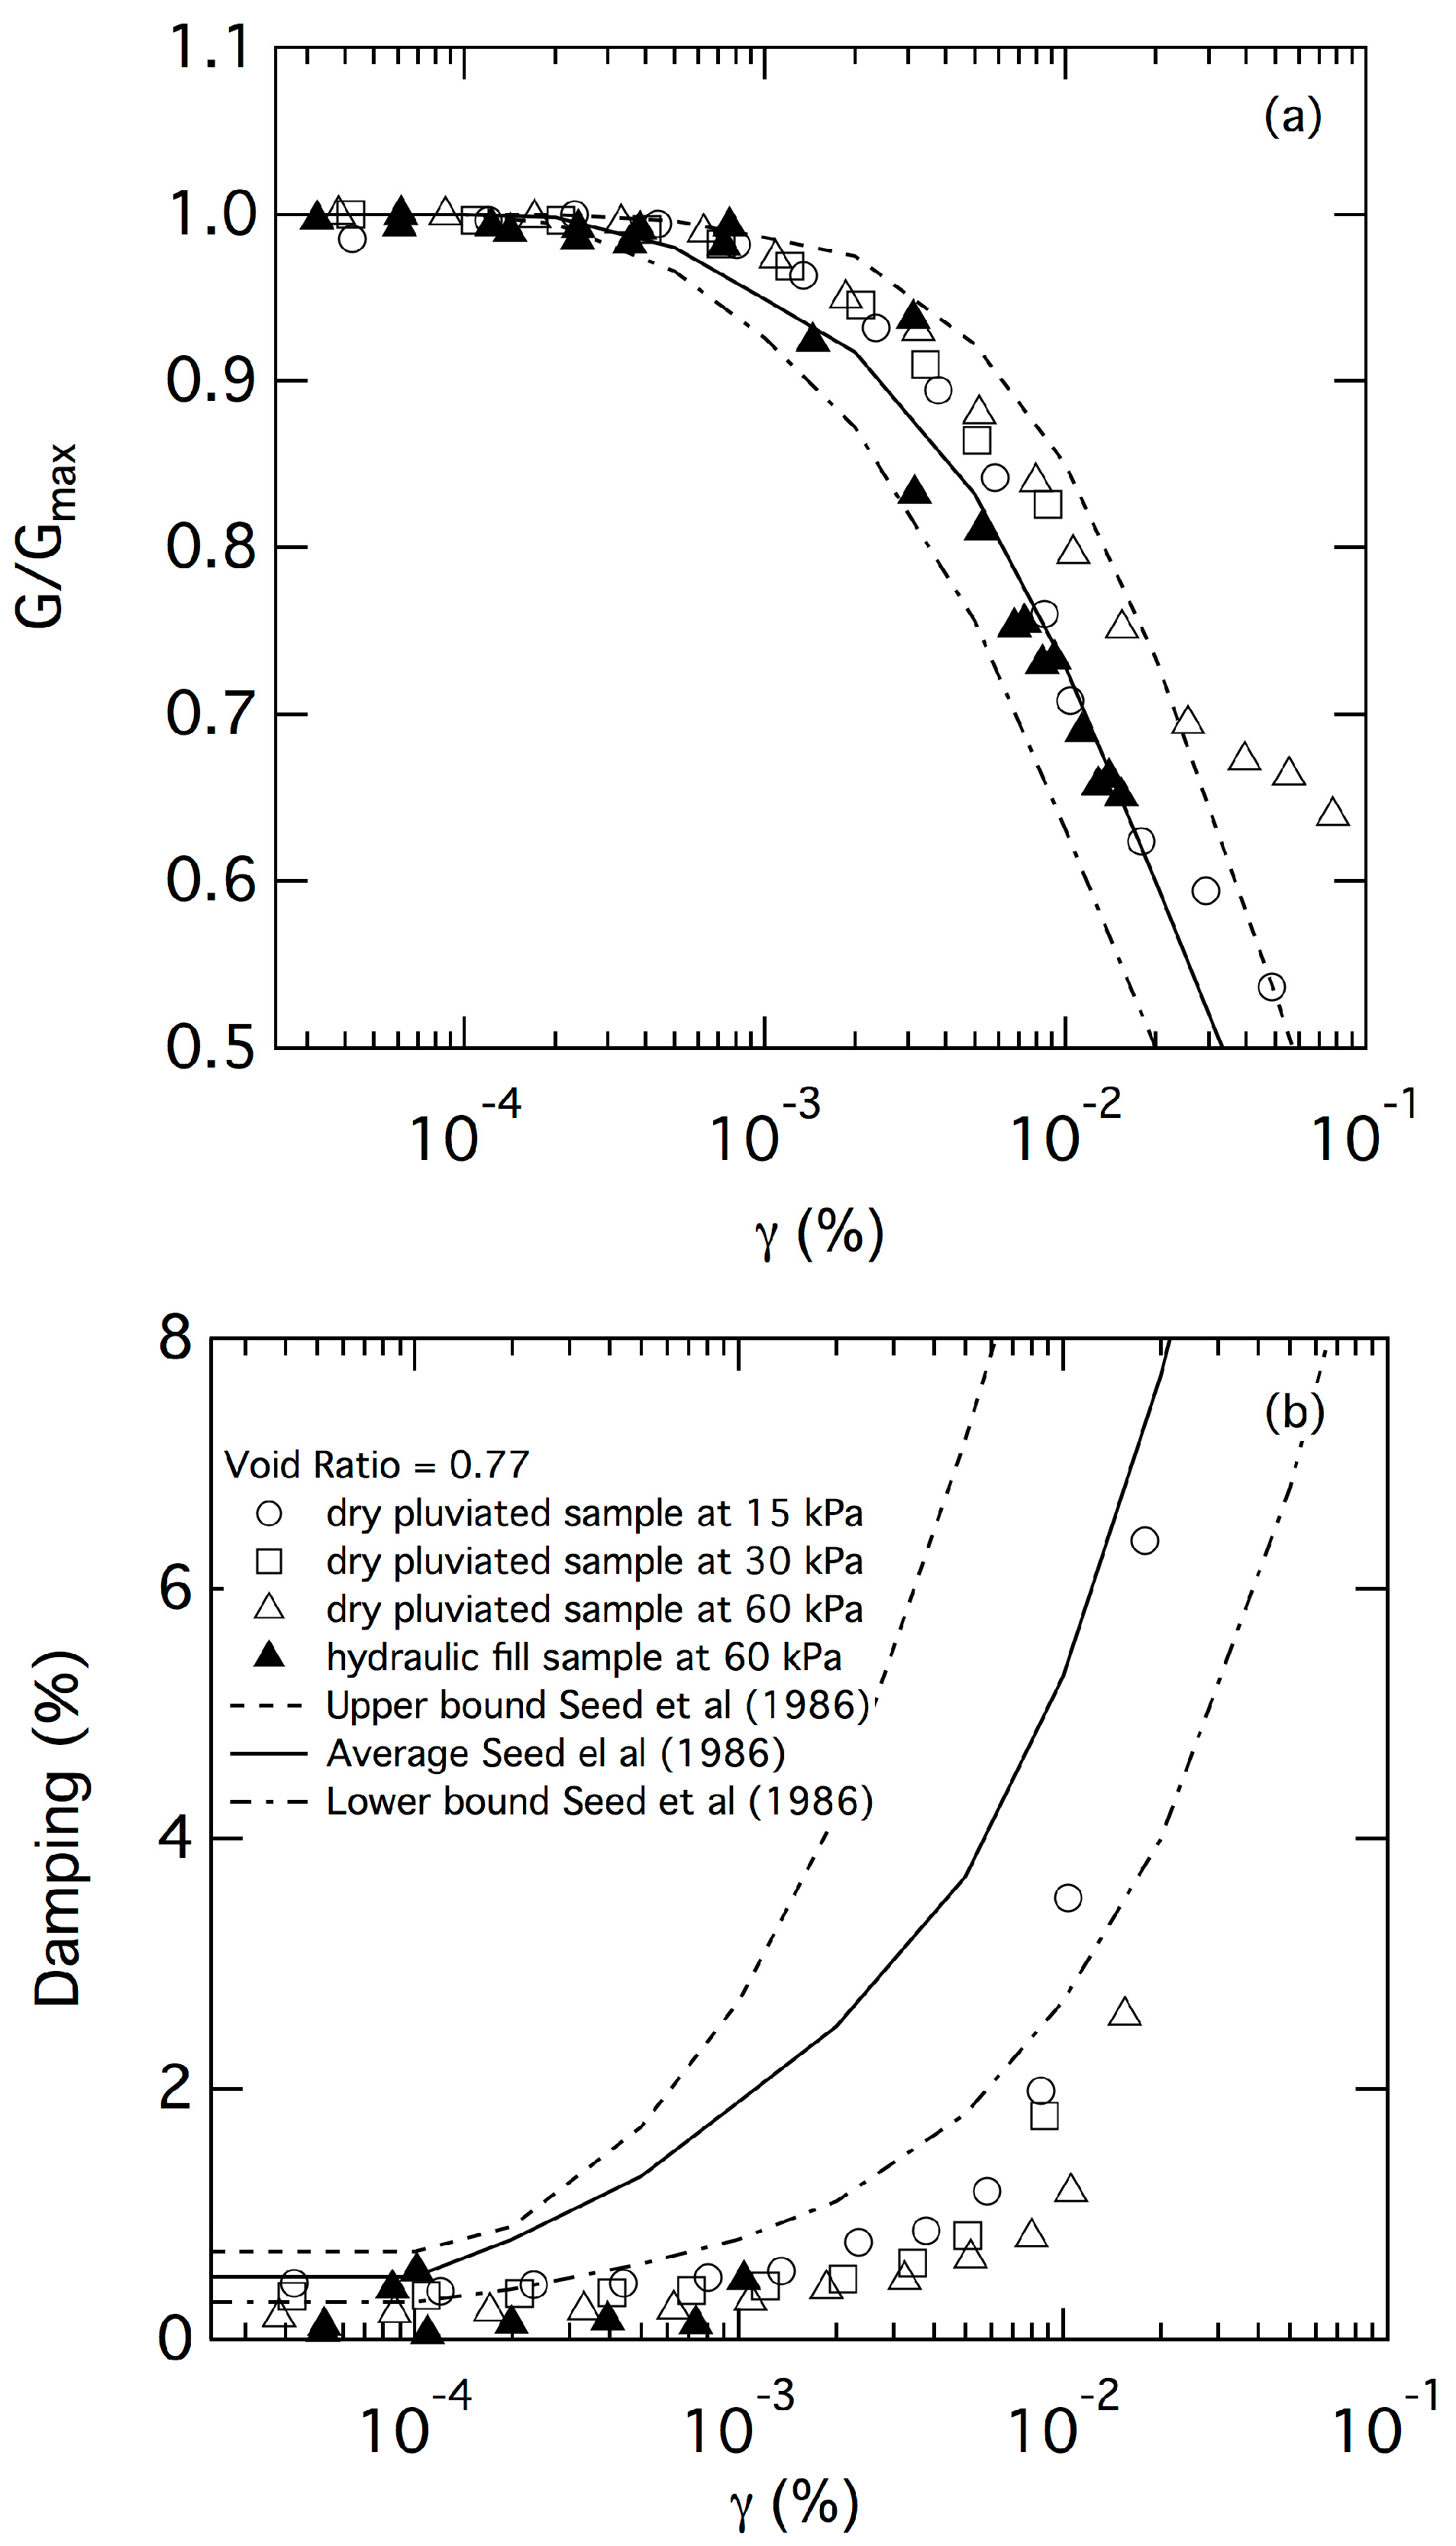
Figure 6 and Figure 7 show a comparison of the normalized modulus reduction (G/Gmax) curves and the damping curves for sand specimens prepared by dry pluviation and simulated hydraulic fill deposition for the soil samples with void ratios of 0.6 and 0.77, respectively. The G/Gmax and damping curves for the simulated hydraulic fill sample for the confining pressure of 15 and 30 kPa were not available due to an unfortunate error in data processing. Therefore, only the results for confining pressure of 60 kPa are included in Figure 6 and Figure 7. For the soil sample with a void ratio of 0.6, the G/Gmax and damping curves for both methods of deposition showed good agreement. The G/Gmax curve for the simulated hydraulic fill specimen with a void ratio of 0.77 is slightly lower than that of the G/Gmax curve for the dry pluviation specimen. That difference can be attributed to the higher instability of the hydraulic fill specimen compared to the dry pluviated specimen with the same void ratio. Also, it should be noted that the effects of confining stress on the G/Gmax and damping for the dry pluviated specimen are minimal. Comparisons of modulus reduction curves and damping curves to the empirical curves proposed by [28] are presented in Figure 6 and Figure 7. The Seed’s modulus reduction curves show good agreement with the curves of sands prepared by both methods of deposition. Seed’s damping curves lie above the damping curves measured for dry pluviated and simulated hydraulic fill specimens. Based on the results of this study, the method of preparation had a very small effect on the normalized modulus and damping curves.

4.2. Low-Strain Shear Wave Velocities

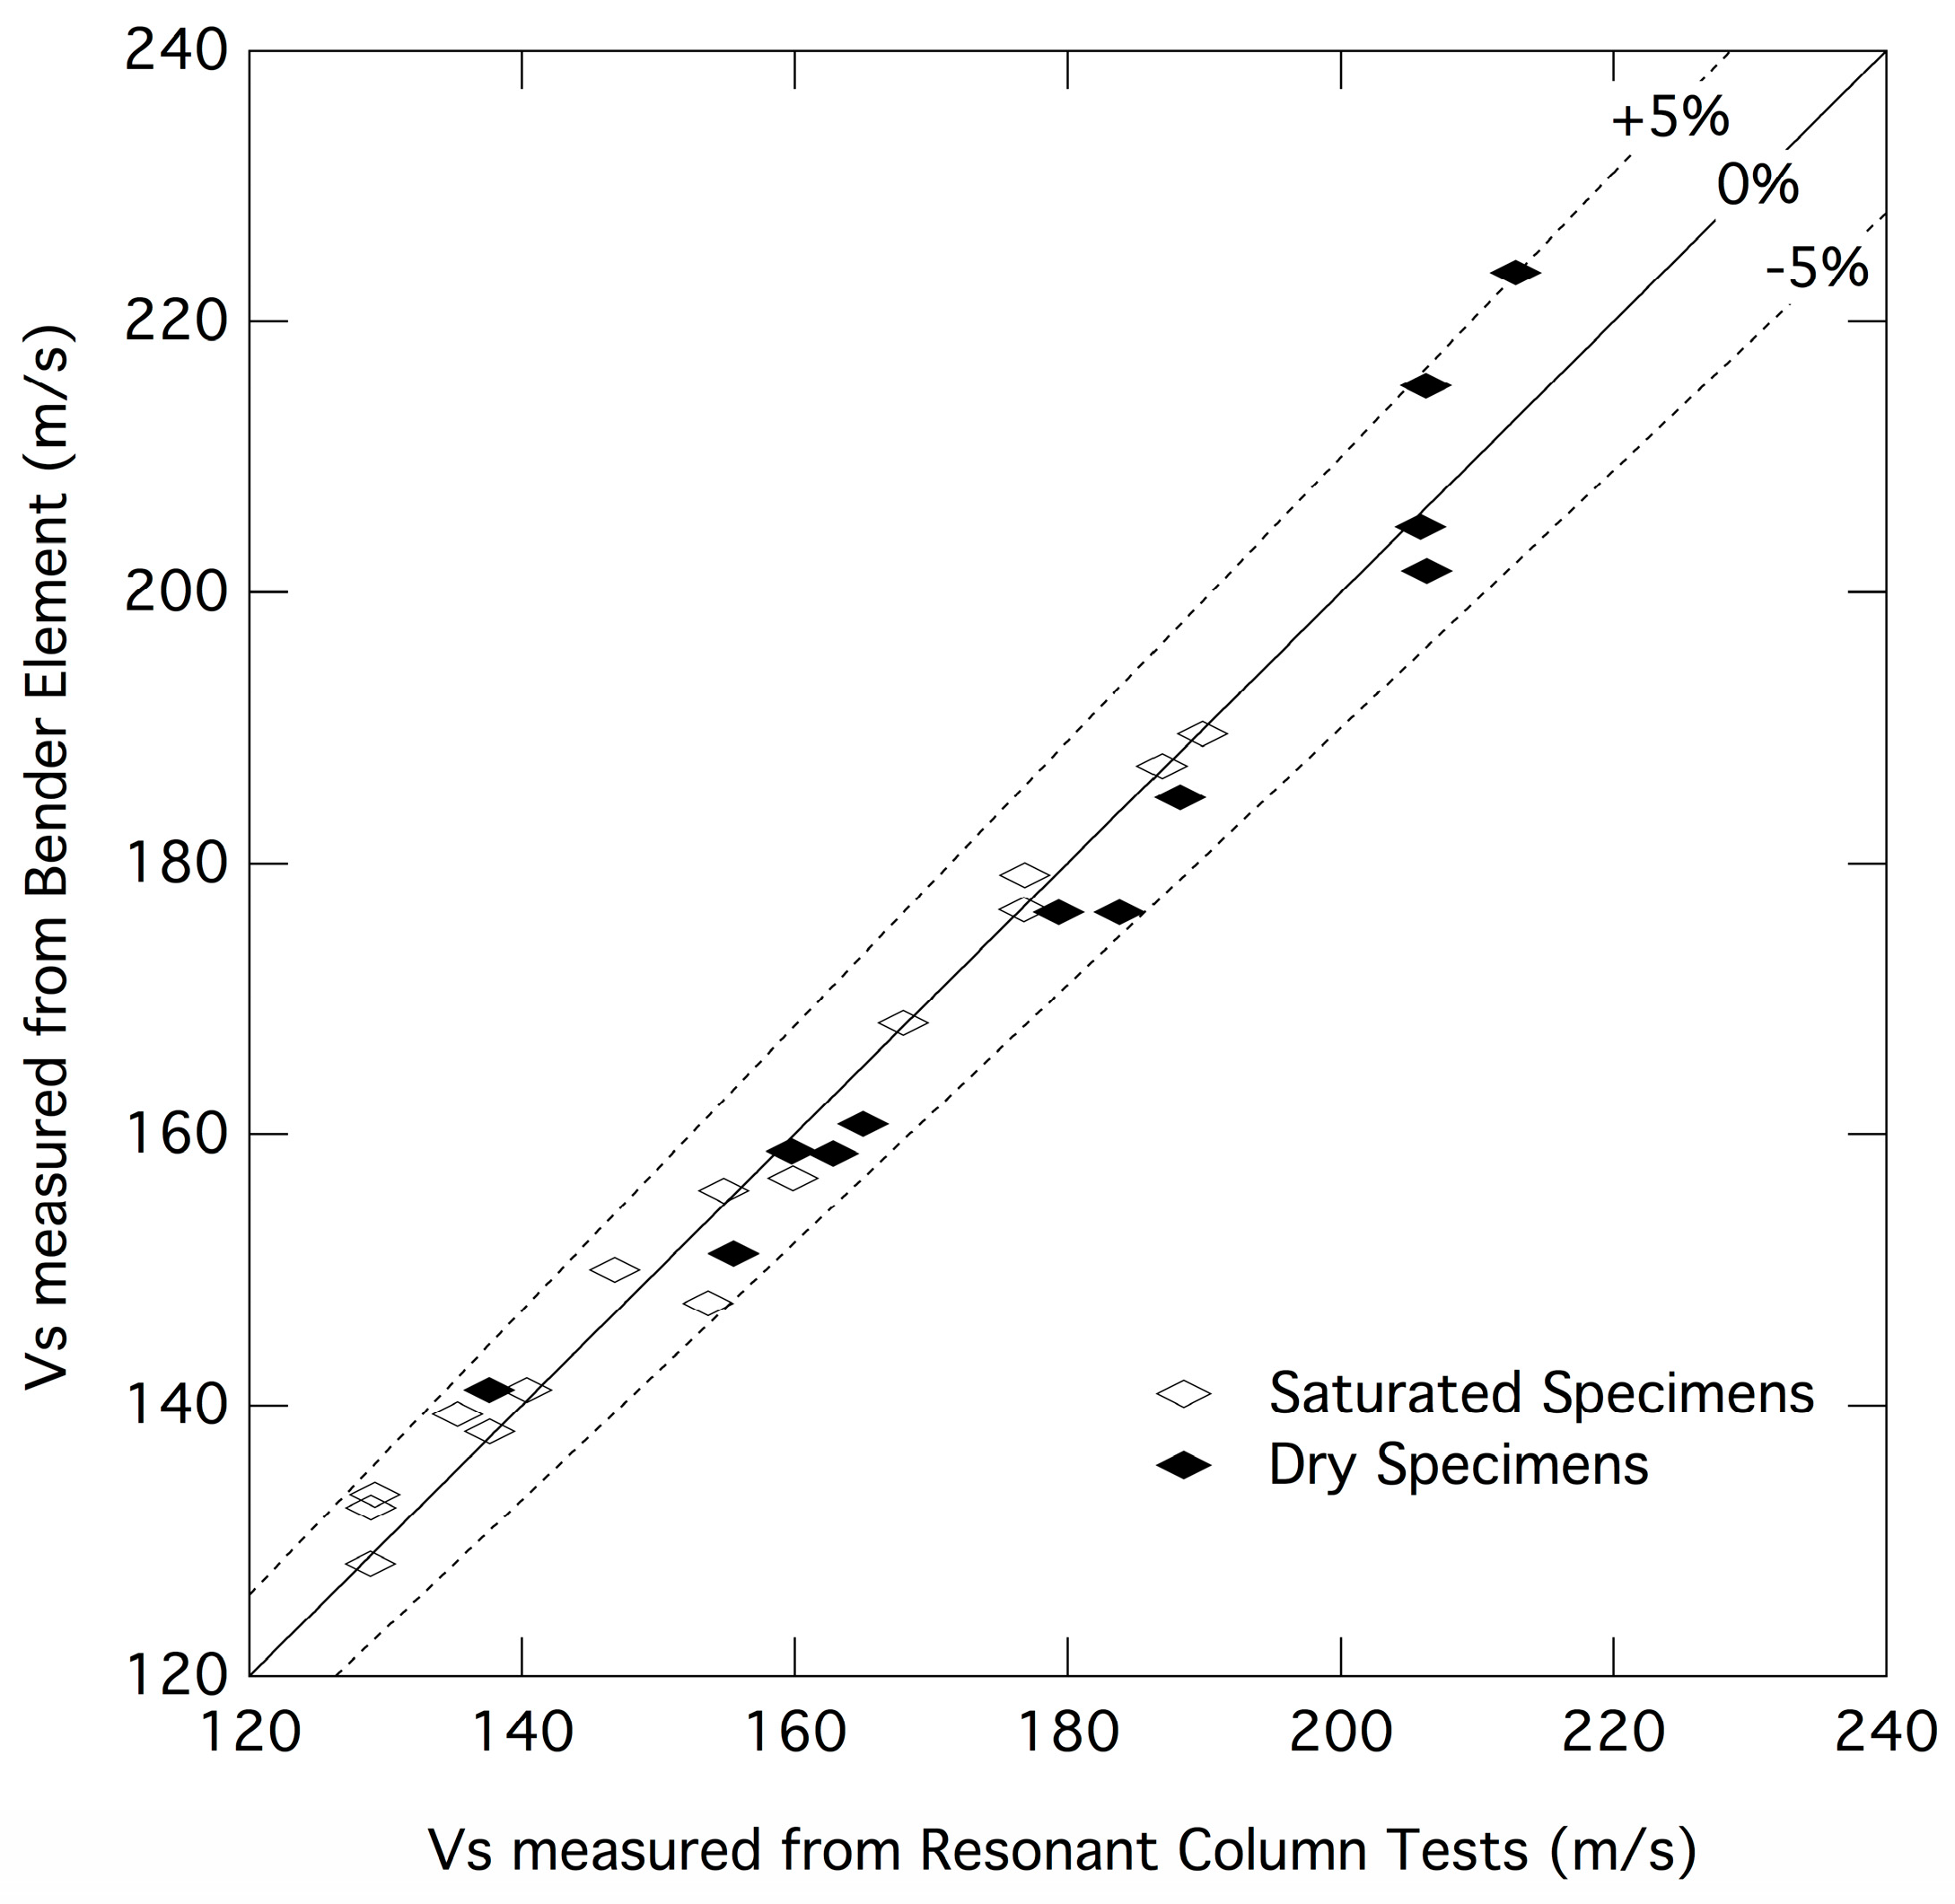
In this study, two methods were used to measure low-strain shear wave velocities. These methods are the resonant column test and the bender element test. Most of the tests were performed on the same soil specimen (unless otherwise noted). Results from both methods of testing show a very good agreement, as shown in Figure 8.
The shear wave velocity measured at a low strain on the dry pluviated Ottawa sand and the simulated hydraulic fill Ottawa sand at the confining pressures of 15, 30, and 60 kPa is presented in Table 2. These results were compared with an approximate expression for the low-strain shear wave velocity (Vs) (or low-strain shear modulus, Gmax) of clean rounded sands proposed by [16,29]. For isotropic conditions, Vs (in SI units) is calculated from:
V s = 51 ( 2.17 e ) σ o 0.25 ( m / s )
where e = void ratio, σo = isotropic confining pressure.
The shear modulus was then calculated by the following equation:
G max = ρ V s 2
where ρ = mass density of dry sand.
Based on the same experimental results and the generic curves for the low-strain shear modulus proposed in [16], this expression is presented below:
G max = 6900 ( 2.17 e ) 2 1 + e σ ¯ o 0.5 ( kPa )
where σ o ¯ = mean effective stress.
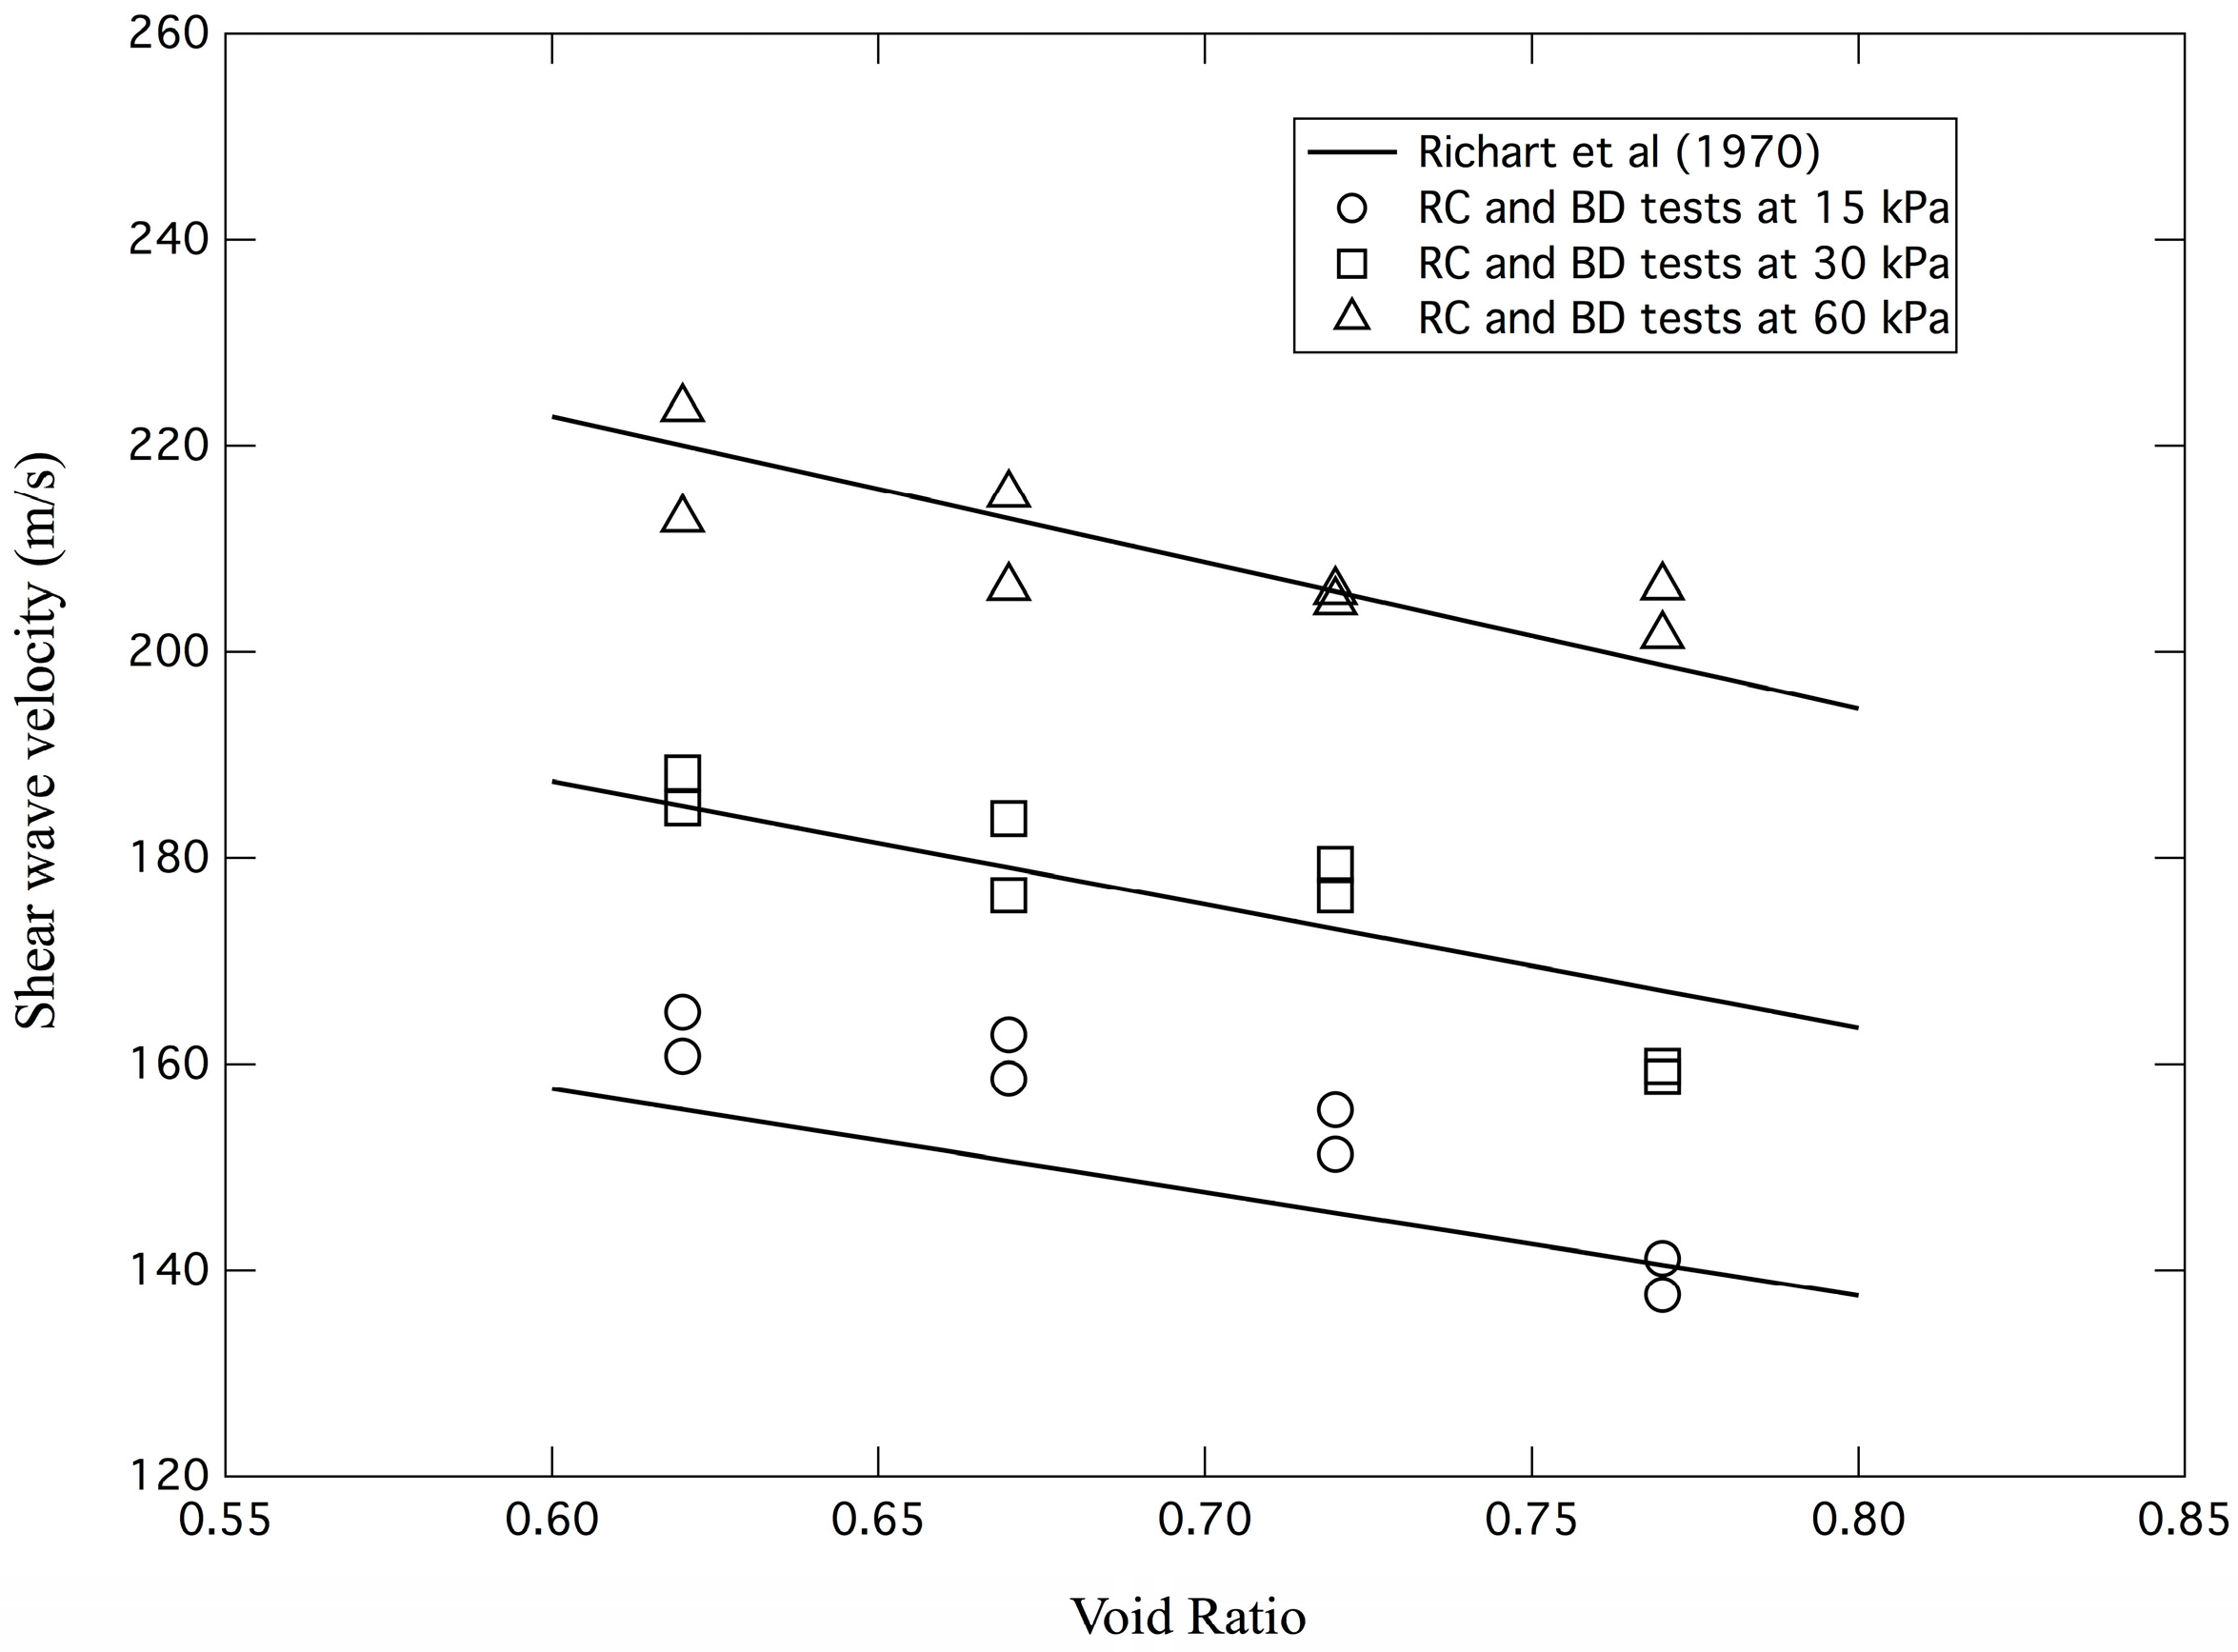
Figure 9 presents a comparison of measured Vs of Ottawa sand specimens prepared by dry pluviation and by calculations using Equation (1) as proposed by [16]. For this method, Vs decreases as the void ratio increases and increases as confining pressure increases. The values of dry pluviation Vs measured in this study show good agreement with values computed by [16] curves for the confining pressures of 30 and 60 kPa. For the confining pressure of 15 kPa, Vs was higher than the Richart curve with a maximum difference of 8%. It should be noted that the Richart curve at 15 kPa was developed from a calculation of Equation (1), and there was no empirical data obtained by [16] at a confining pressure of less than 24 kPa. As a result, some deviation from the empirical equation may be expected.
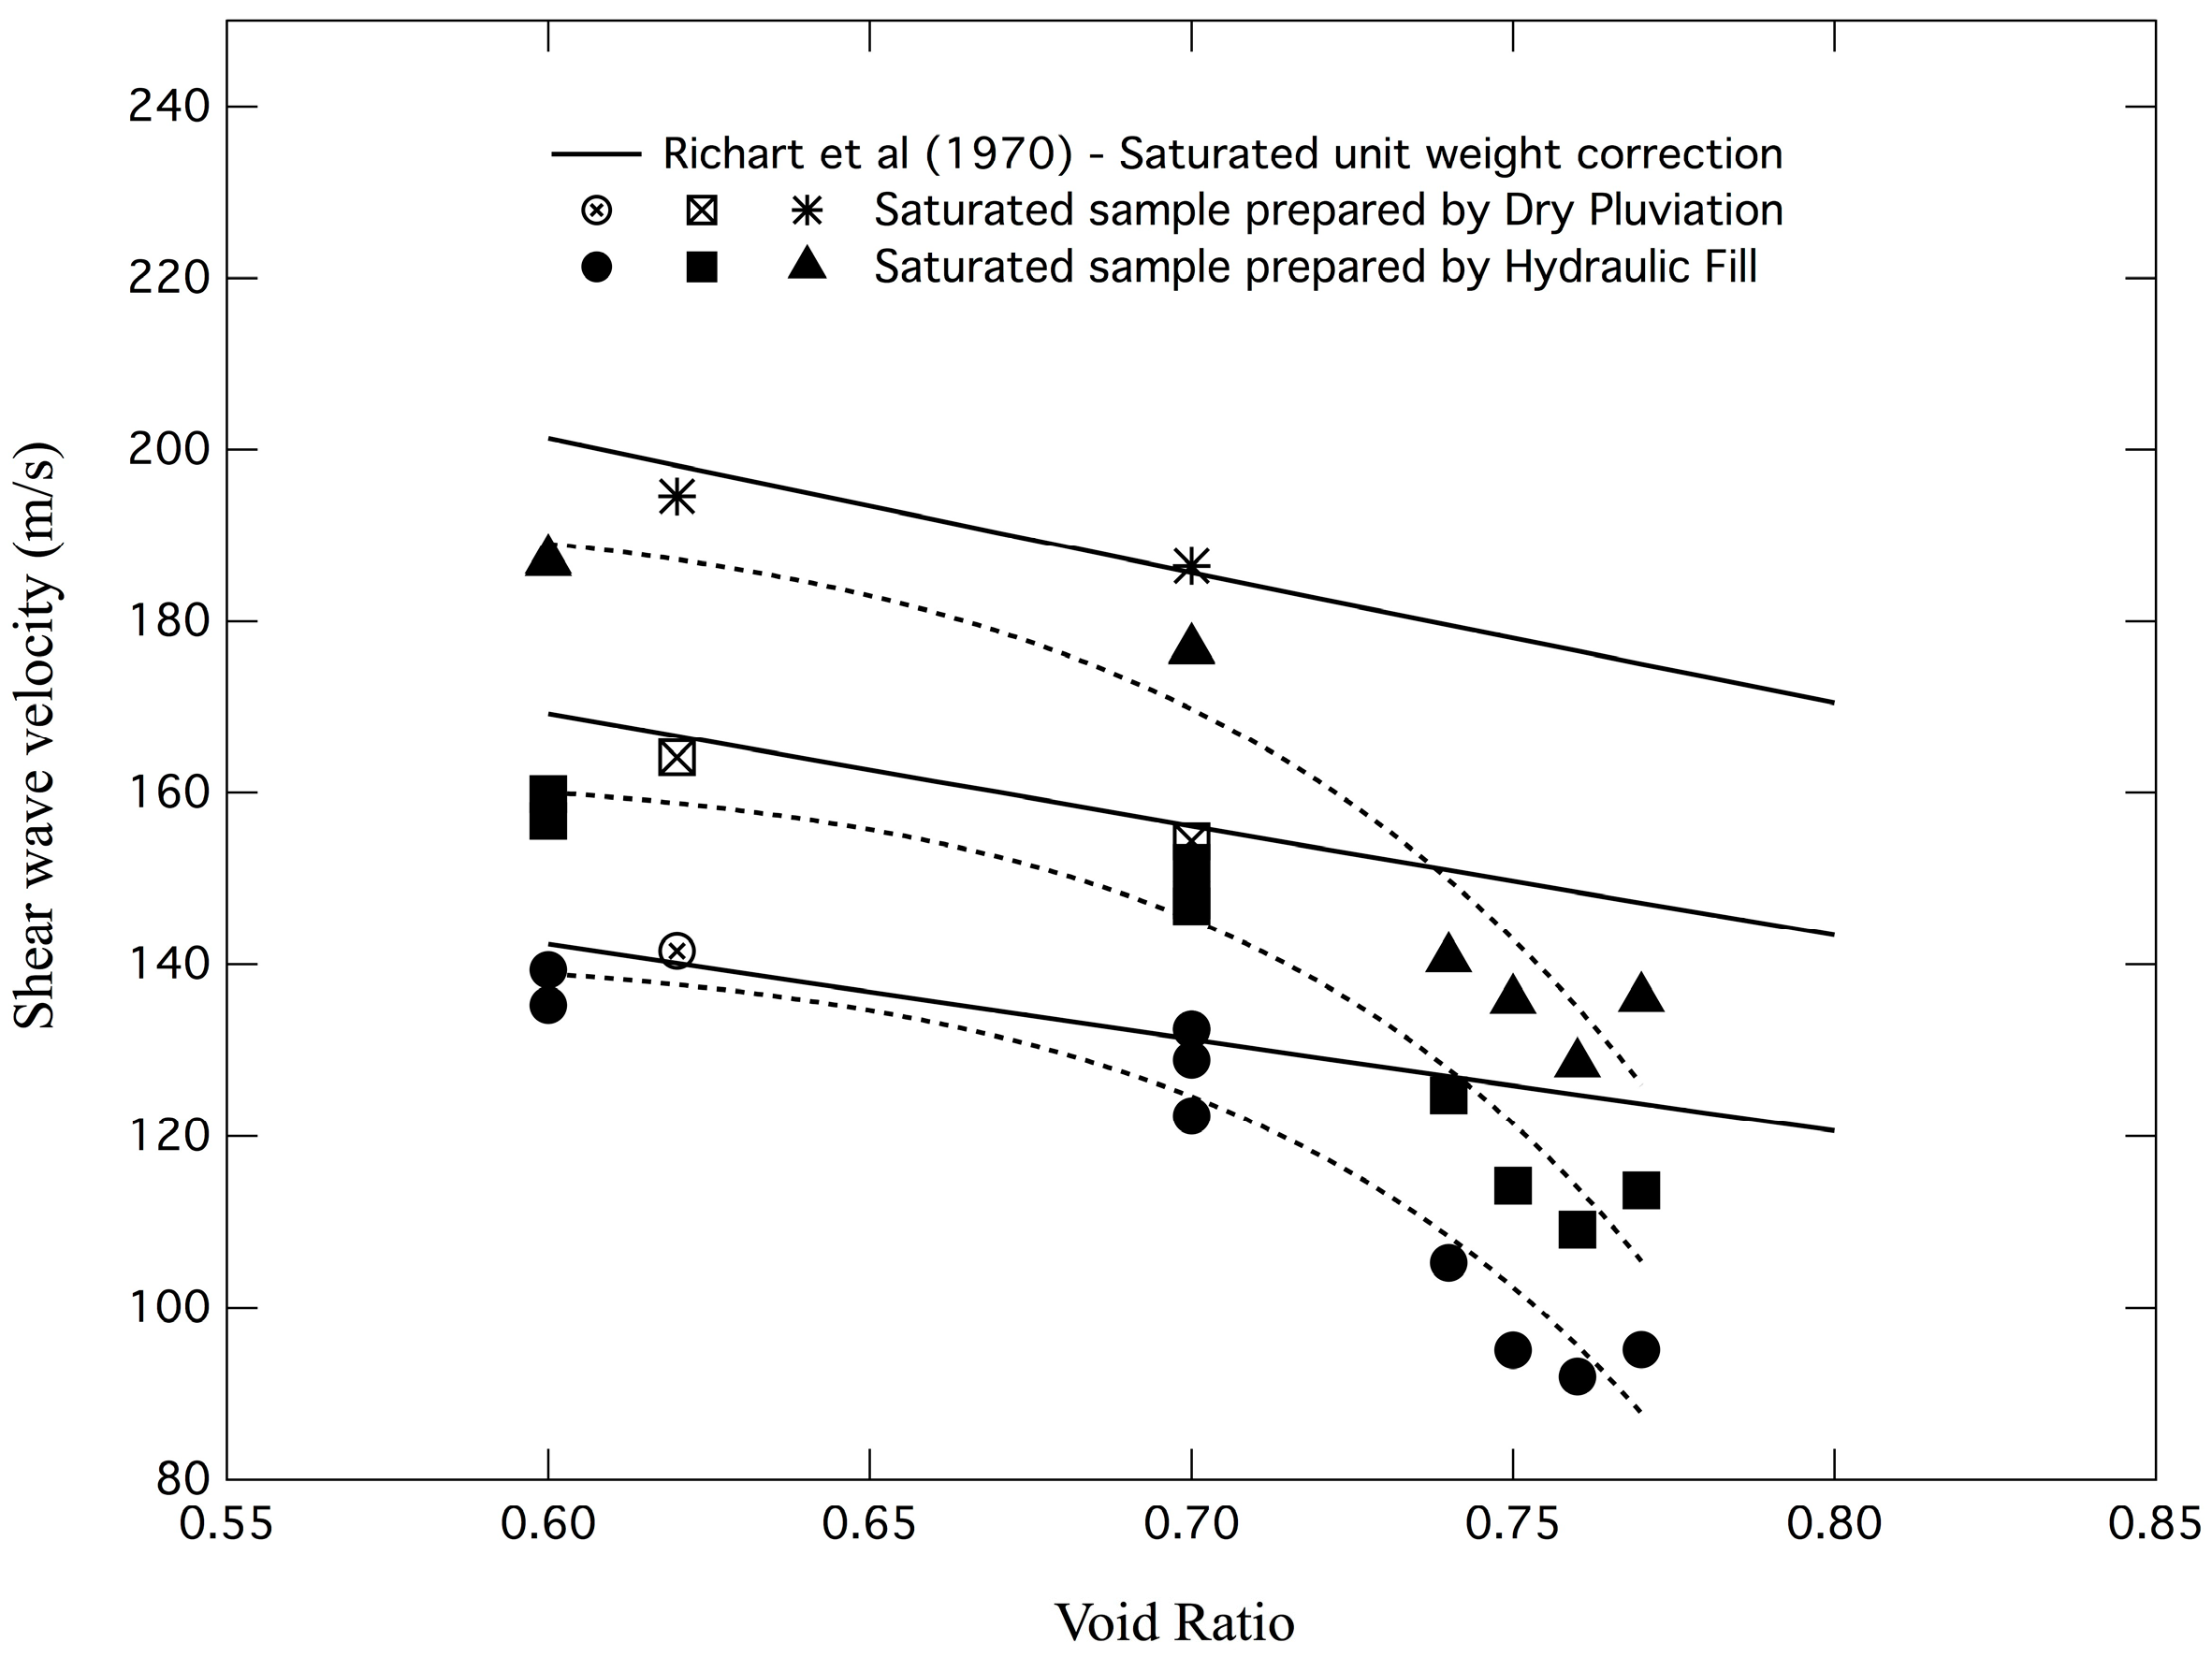
For the simulated hydraulic fill specimens, Vs also decreases as the void ratio increases and increases as confining pressure increases. A comparison between the measured Vs prepared by the simulated hydraulic fill and calculations proposed in [16] is shown in Figure 10. The Richart curves presented in Figure 10 were generated using Equation (3) to calculate Gmax, and Vs was derived from Equation (2) using saturated soil density. In this case, it was observed that all of the measured Vs values are lower than the empirical curves. For the soils with a void ratio of 0.6 and 0.7, the overall difference ranges from 4% to 8%. For the soils with a void ratio greater than 0.74, the overall difference ranges from 20% to 37%. These results imply that the method of soil deposition plays a major role in influencing the shear wave velocity of soils, especially in loose soils with a void ratio above 0.74.
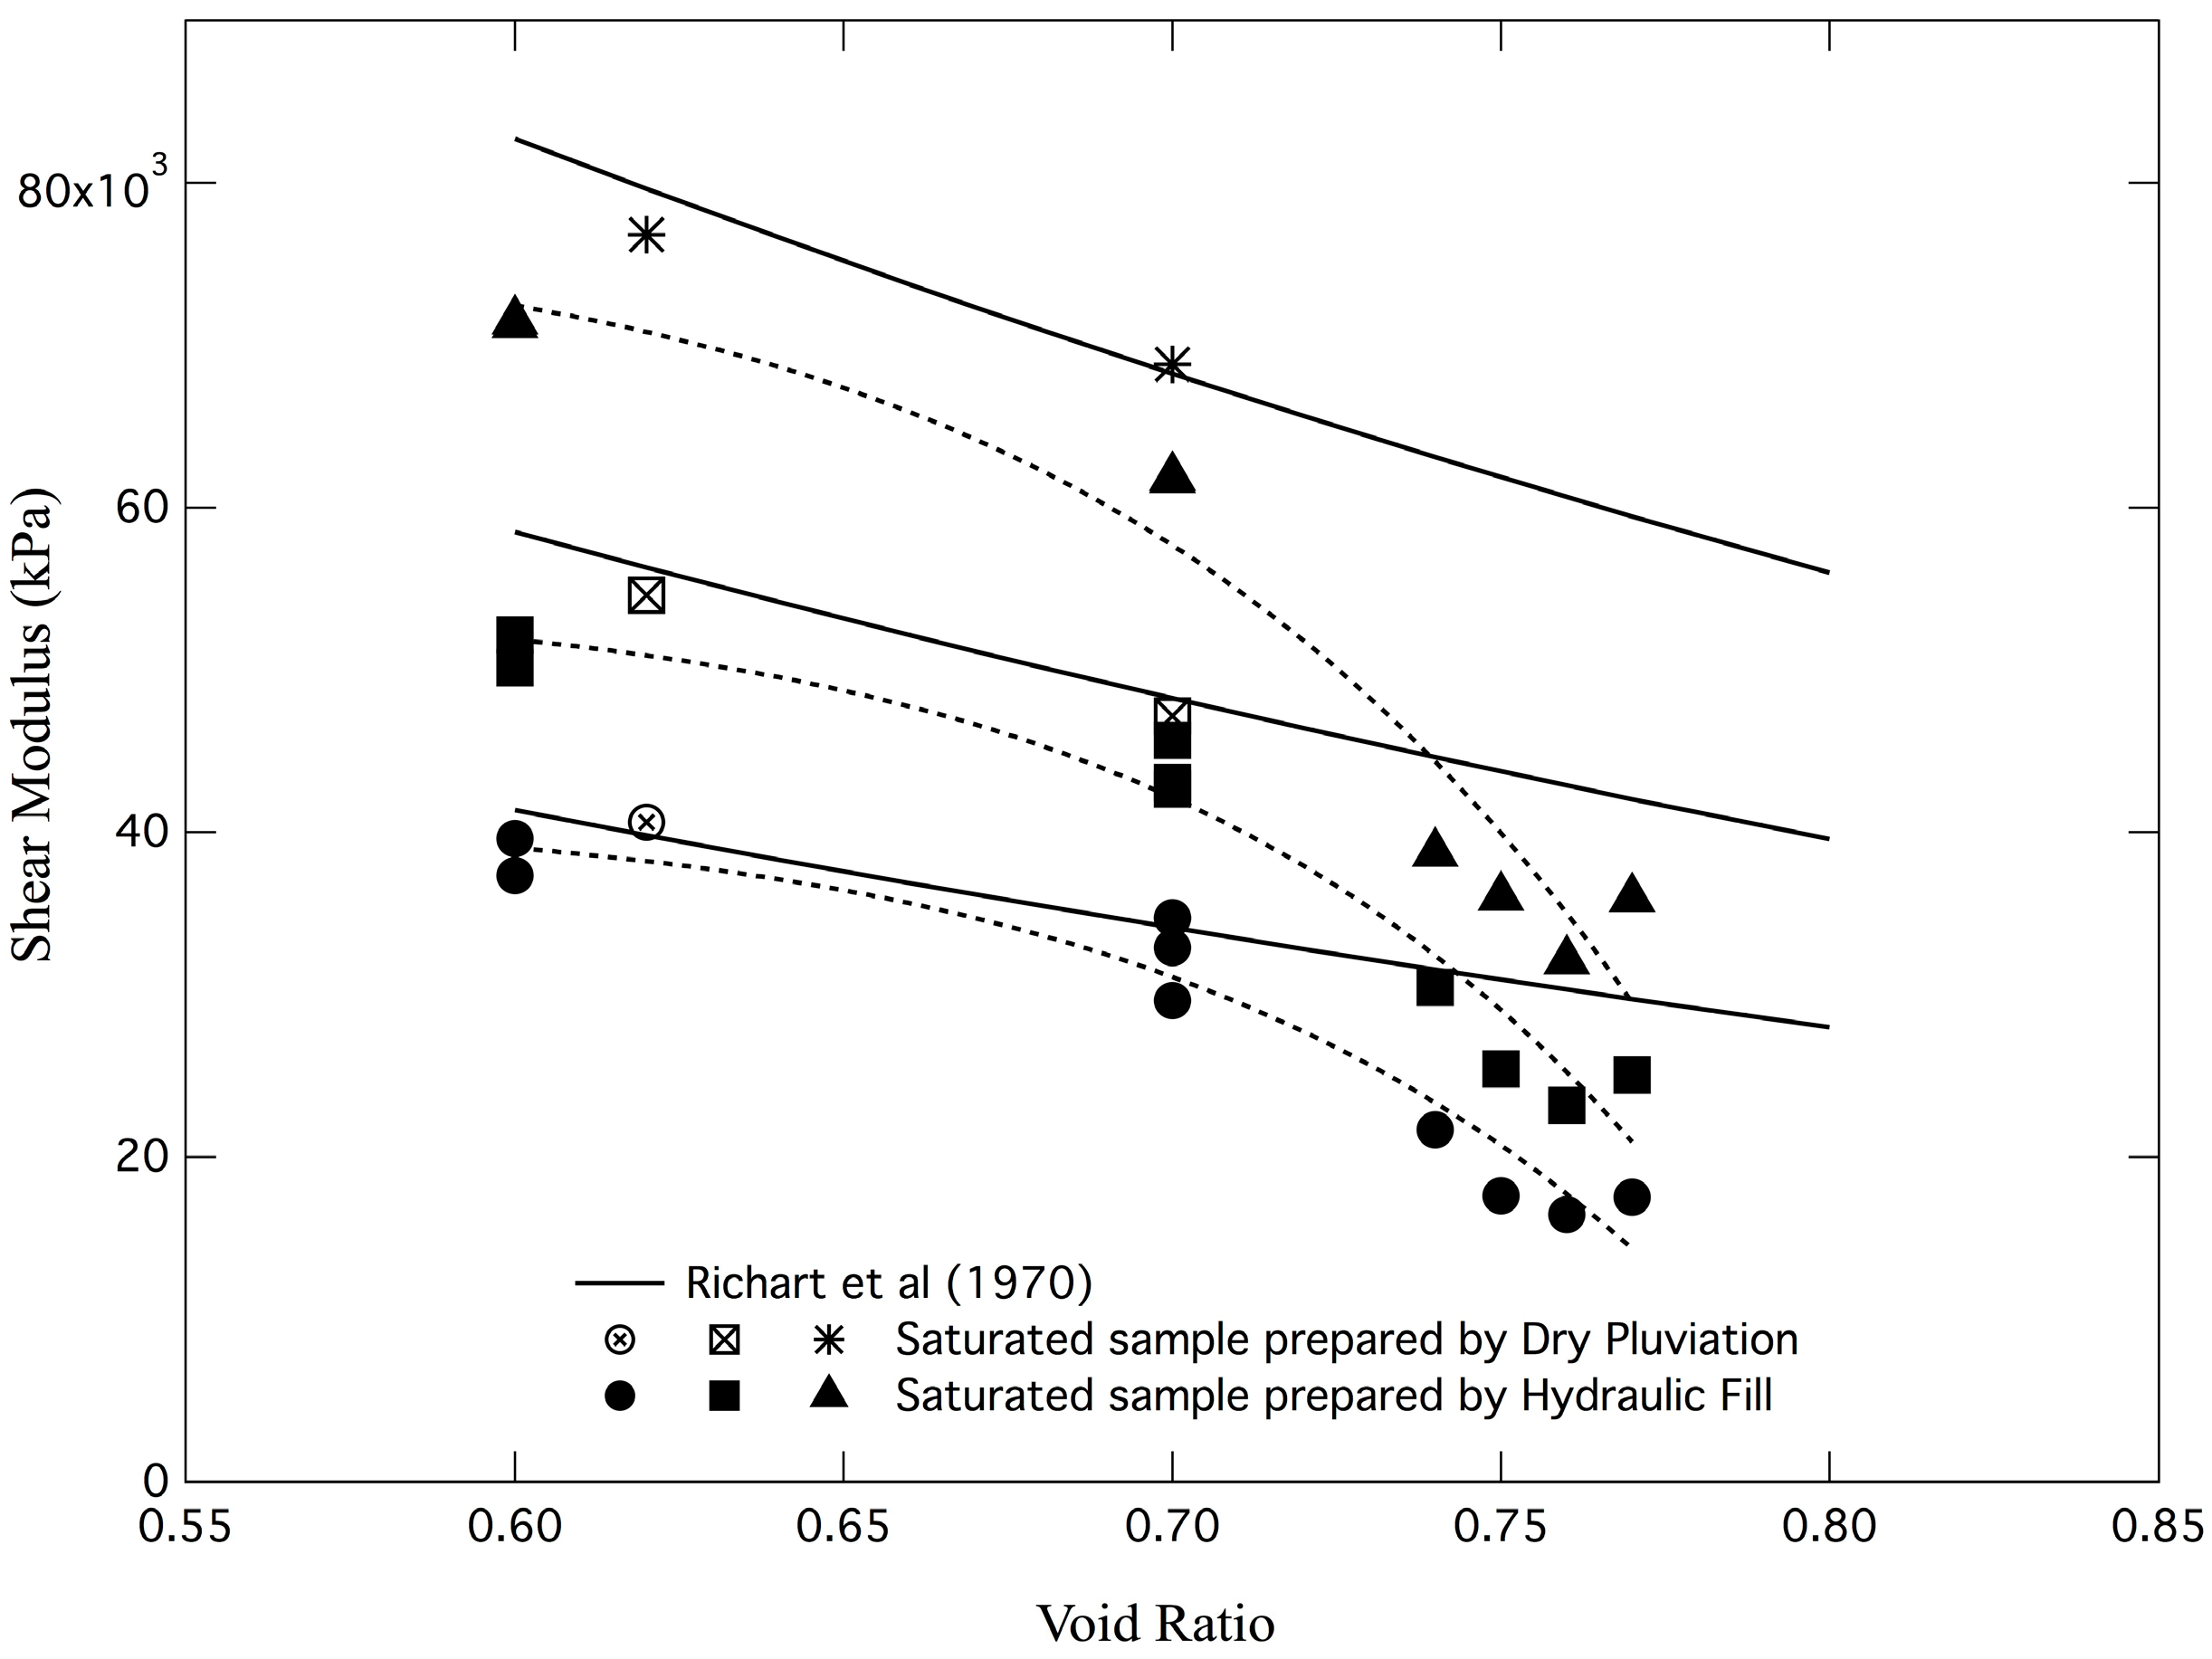
The simulated hydraulic fill specimens were prepared using the frozen sample technique; the effect of freezing and thawing on the specimen may have contributed to the measured values of shear wave velocity. As a result, the frozen sample technique was investigated. Two soil specimens, at void ratios of 0.62 and 0.70, were prepared by dry pluviation, then saturated, frozen, thawed, and tested following the same procedure used for the simulated hydraulic fill specimens. Shear wave velocity measurements were performed on these specimens, and shear modulus was calculated from Equation (2). The values of the shear wave velocity of the saturated sample prepared by the dry pluviation method were compared with those in [16], and the results from the simulated hydraulic fill sample are shown in Figure 10. The values of shear modulus from saturated soil specimens prepared by dry pluviation are compared with the generic shear modulus developed from Equation (3), as presented in Figure 11. The open symbols represented the saturated soil specimen prepared by dry pluviation and show good agreement with the generic shear modulus curves proposed in [16]. These results indicate that the effect of the frozen sample technique is negligible.
Figure 12 shows a comparison between the shear modulus obtained for soil specimens prepared by dry pluviation and simulated hydraulic fill. The same data were used to generate a plot of shear wave velocity comparing the two different methods of preparation, as shown in Figure 10. All of the results plotted in Figure 10 and Figure 12 are from saturated specimens. From these results, it is clear that values of the simulated hydraulic filled Vs are generally lower than the values of dry pluviated Vs. The difference increases as the confining pressure increases. These results agree with other findings with a larger scale and centrifuge test results [13,14], as well as numerical simulation using discrete element analysis [30,31].
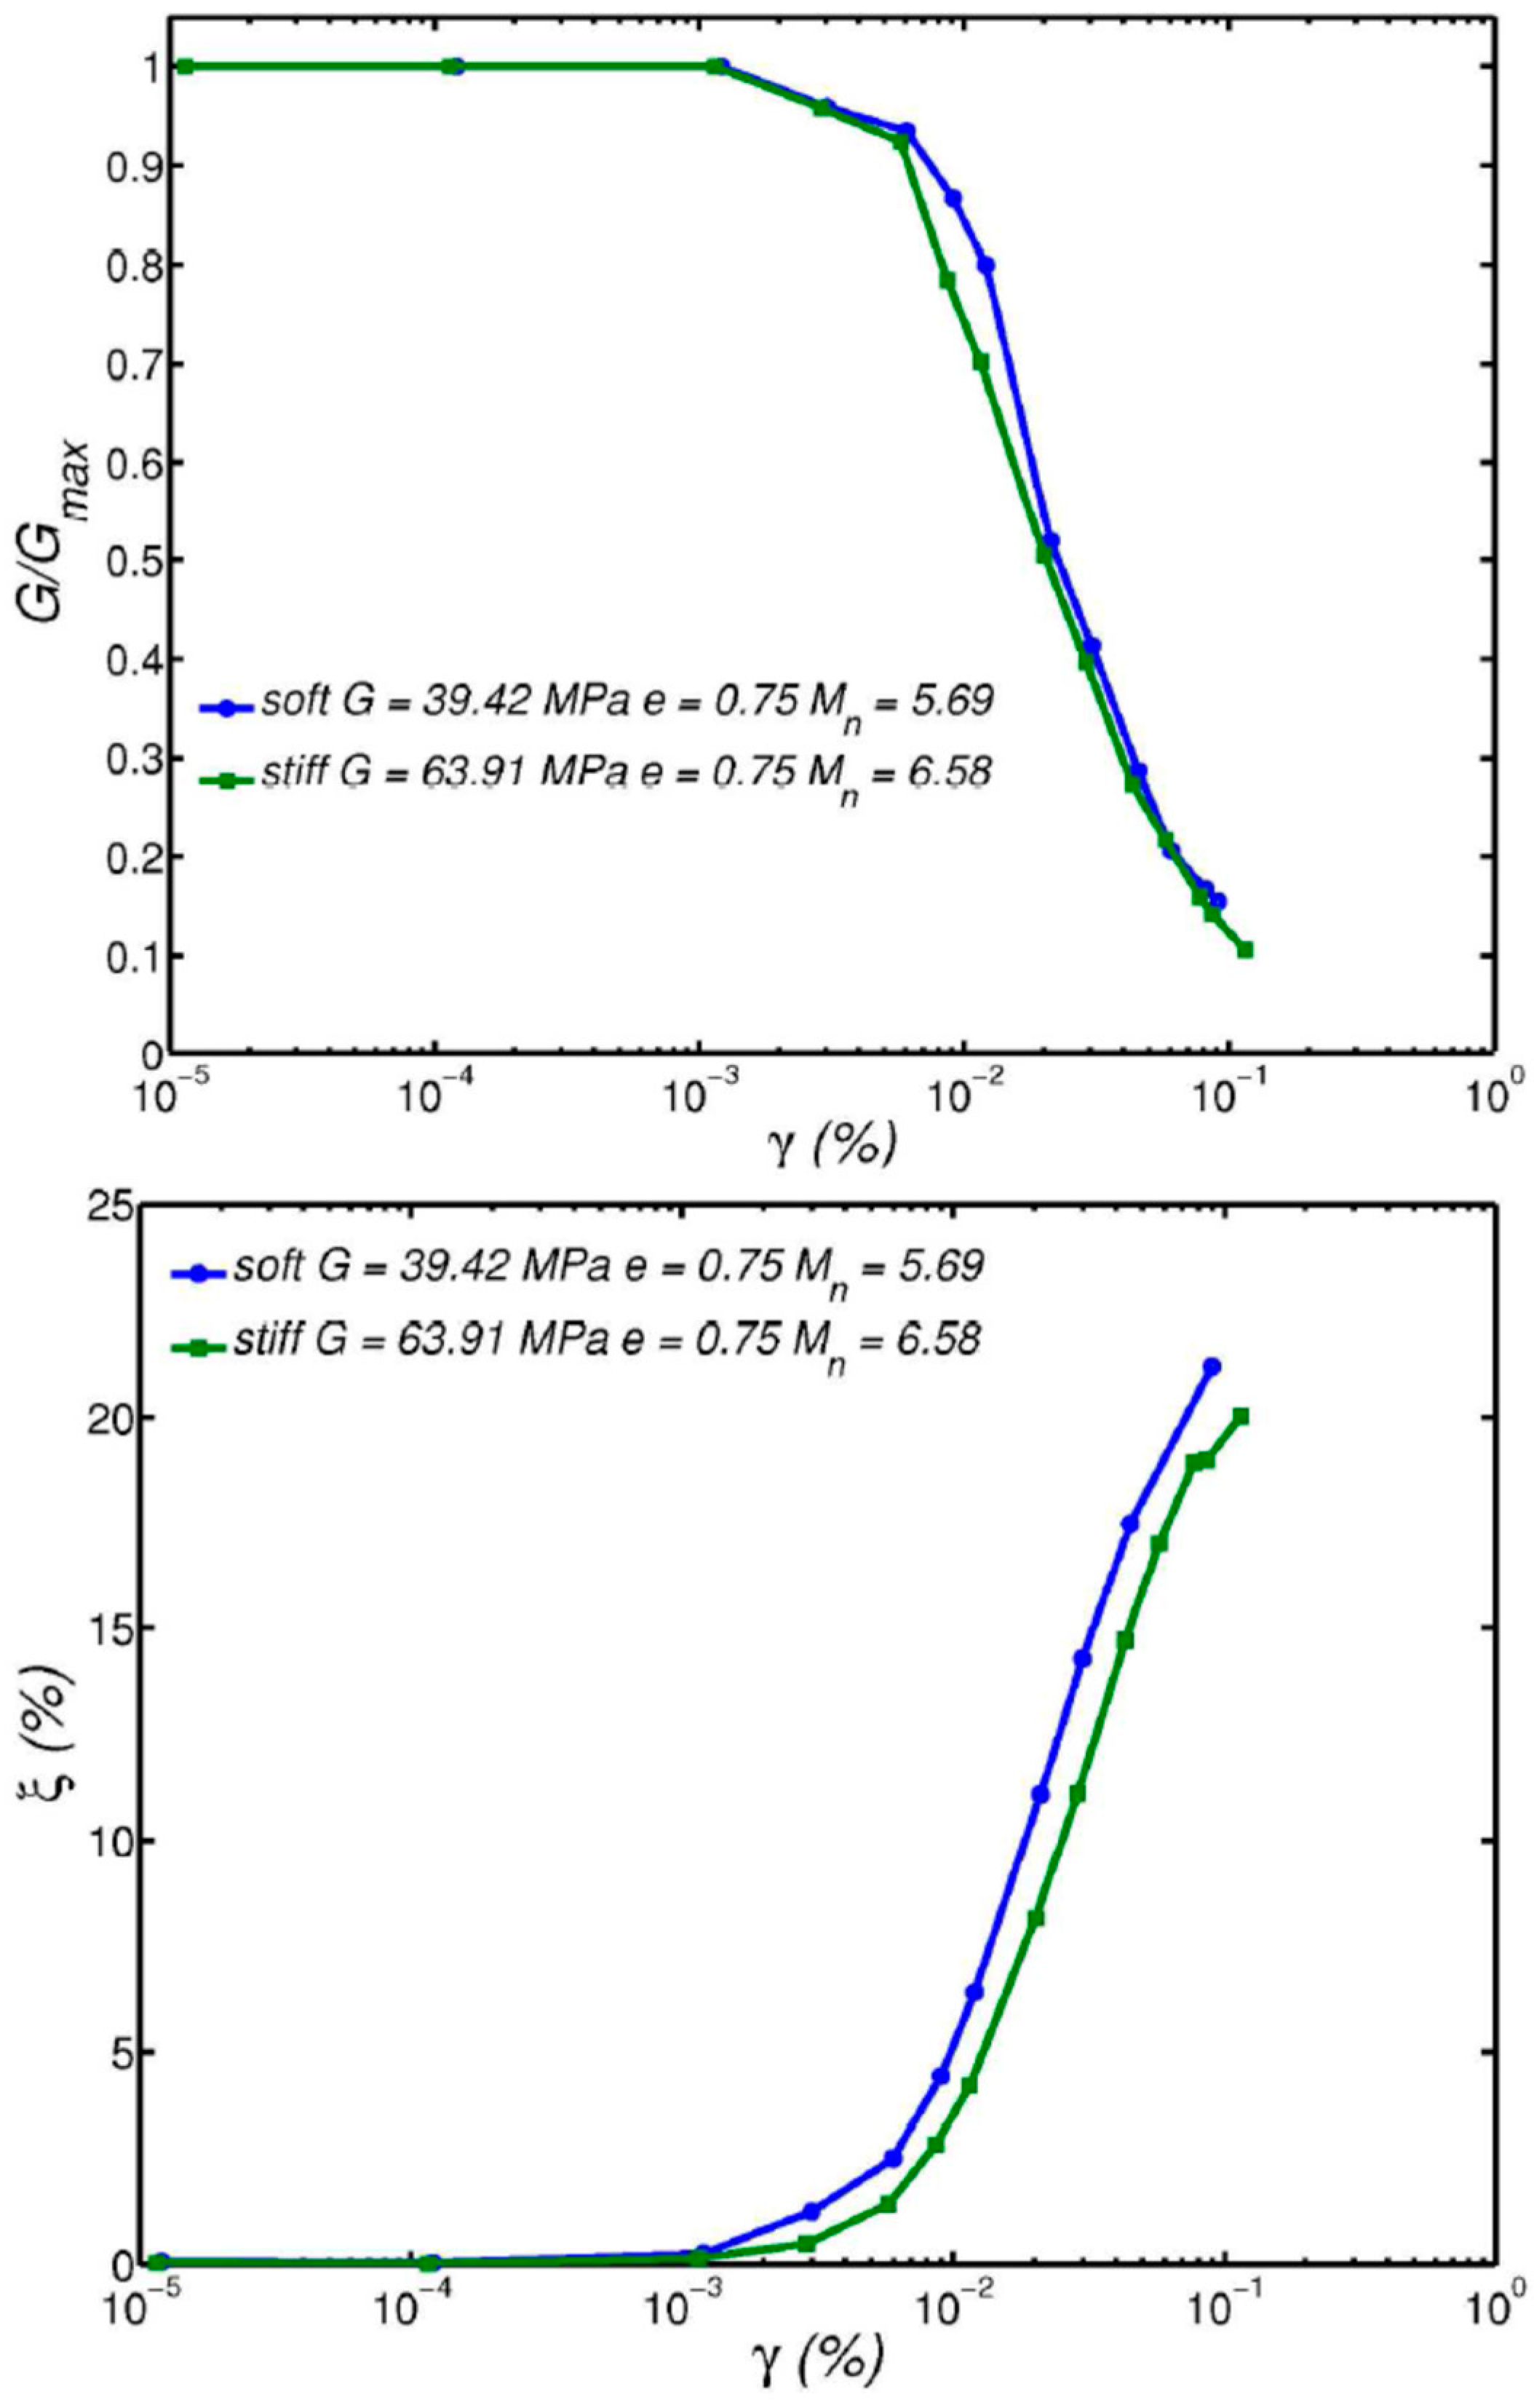
The effect of fabric on low-strain shear modulus of granular soils using Discrete Element simulation was examined in [31]. Two synthetic soils made of non-spherical particles with different fabrics were created. The associated shear moduli of these soils were evaluated for various levels of isotropic triaxial confining stress conditions. The results from [30,31] show that soil with a given void ratio may have various fabrics (soft or regular fabrics) associated with noticeably different low-strain shear moduli. These results are shown in Figure 13. The behavior of the synthetic soils presented is very similar to the behavior of the simulated hydraulic fill soils plotted in Figure 12, with the exception that the behavior of soils with soft and regular fabrics tends to merge at a void ratio of less than 0.7. In addition, the numerical simulation results show that the effects of soil fabric on G/Gmax and damping curves are very small, as shown in Figure 14. These results are consistent with the curves measured from resonant column testing presented in Figure 6 and Figure 7.
In discrete element analysis, it was found that the mechanical coordination number (i.e., the average number of contacts for particles that effectively participate in load transmission through the contact force chains), particle shape, and interparticle contact law were found to be the main factors that dictate the soil’s low-strain stiffness properties. For a specific level of confining stress, the shear modulus of a particular soil is shown to be linked to the mechanical coordination number by a unique relation, as shown in Figure 15. This finding provides a possible explanation for the lower shear wave velocity measured for the simulated hydraulic-filled soil sample. Two soils deposited by the hydraulic fill and dry pluviation methods yielded different soil fabrics and number of particle contacts, and they were expected to have a different shear modulus or shear wave velocity. As a result, engineering judgment must be exercised when predicting shear wave velocity by using the relationships proposed in [16,29], especially for loose soil with void ratios larger than 0.70.

4.3. Effect of Preshaking

Preshaking on centrifuge modeling tests was performed as described in [18,32]. They suggested that the preshaking should be performed without changing more than 10% of the original relative density. In this study, three simulated hydraulic fill sand specimens were subjected to strain levels of 0.077, 0.089, and 0.348% when the change of low amplitude shear wave velocity was observed. It is noted that these strain levels are higher than the volumetric threshold strain, which is typically in the order of 10−2% [9]. The threshold strain defines a fundamental property of granular soils related to the minimum level of strain needed to start gross sliding and rearrangement of the individual particles. Figure 16 presents the shear wave velocity after preshaking for the three specimens tested.
Shear wave velocities increased by approximately 35%. The changes in relative density were 8.6, 3.0, and 9.2% for the soil specimen with void ratios of 0.75, 0.76, and 0.77, respectively. These changes in relative density are well below 10%, as suggested in [19]. The new value of shear wave velocity becomes similar to or higher than the shear wave velocity predicted in [16], which is equivalent to the soil specimen prepared by the dry pluviation method. These results suggest that the fabric of sand, prepared by the simulated hydraulic fill method, was disturbed by preshaking and increased the number of particle contacts, resulting in an increase in shear wave velocity.

5. Conclusions

This paper presented an experimental investigation of the effects of the method of deposition on the shear wave velocity. A sample preparation technique was developed to simulate hydraulic fill soil deposition and the resulting collapsible soil structure. Resonant column and bender element tests were performed, and the measured Vs of soil specimen prepared by the hydraulic fill and conventional dry pluviation method were compared. The results showed that values of the simulated hydraulic filled Vs are generally lower than the values of dry pluviated Vs. The difference increases as the confining pressure increases. The findings from this study agreed with the large-scale and centrifuge test results in [13,14] and the discrete element simulation in [31]. One possible explanation is that different soil fabrics can have the same void ratio but a different number of particle contacts. The dry pluviation method yields a higher number of particle contacts, hence the higher shear wave velocity, while the simulated hydraulic fill method yields a lower number of particle contacts and lower shear wave velocity. Preshaking with a minimum change in the sand density at some level of strain may disturb the soil fabric and could result in an increase in the shear wave velocity. While further investigation of the dynamic properties of hydraulic fill and other soils with similar fabric is required, the current findings of this study pave the way for a better understanding of the dynamic properties of hydraulic fill. This knowledge is helpful to practitioners using hydraulic fill in underwater construction and other similar applications in seismically active regions.

Author Contributions

Conceptualization, I.S., T.A. and M.Z.; methodology, M.Z.; validation, O.E.-S.; formal analysis, O.E.-S.; investigation, O.E.-S.; resources, I.S.; data curation, O.E.-S.; writing—original draft preparation, O.E.-S. and I.S.; writing—review and editing, O.E.-S.; visualization, M.Z.; supervision, I.S. and T.A.; project administration, I.S. and T.A.; funding acquisition, I.S. and T.A. All authors have read and agreed to the published version of the manuscript.

Funding

This research received no external funding.

Data Availability Statement

The raw data will be made available from the corresponding author upon reasonable request. The data are not publicly available due to privacy.

Acknowledgments

The authors of the paper would like to thank Prompat Kasantikul for her help with data processing and regenerating some of the figures used in the paper.

Conflicts of Interest

The authors declare no conflicts of interest.

References

  1. Tatsuoka, F.; Iwasaki, T.; Yoshida, S.; Fukushima, S.; Sudo, H. Shear Modulus and Damping by Drained Tests on Clean Sand Specimens Reconstituted by Various Methods. Soils Found. 1979, 19, 39–54. [Google Scholar] [CrossRef]
  2. Rogers, C.D.F.; Dijkstra, T.A.; Smalley, I.J. Hydroconsolidation and subsidence of loess: Studies from China, Russia, North America and Europe. Eng. Geol. 1994, 37, 83–113. [Google Scholar] [CrossRef]
  3. Whitman, R.V. On liquefaction. In Proceedings of the 11th International Conference on Soil Mechanics and Foundation Engineering, San Francisco, CA, USA, 12–16 August 1985; A.A. Balkema: Rotterdam, The Netherlands, 1985; pp. 1923–1926. [Google Scholar]
  4. Opukumo, A.W.; Davie, C.T.; Glendinning, S.; Oborie, E. A review of the identification methods and types of collapsible soils. J. Eng. Appl. Sci. 2022, 69, 17. [Google Scholar] [CrossRef]
  5. Al-Rawas, A.A. State-of-the-art-review of collapsible soils. Sultan Qaboos Univ. J. Sci. [SQUJS] 2000, 5, 115–135. [Google Scholar] [CrossRef]
  6. Eslami, A.; Alimirzaei, M.; Aflaki, E.; Molaabasi, H. Deltaic soil behavior classification using CPTu records—Proposed approach and applied to fifty-four case histories. Mar. Georesources Geotechnol. 2017, 35, 62–79. [Google Scholar] [CrossRef]
  7. Loukidis, D.; Bardanis, M.; Lazarou, G. Classification, soil-water characteristic curve and swelling/collapse behaviour of the Nicosia marl, Cyprus. E3S Web Conf. 2016, 9, 11009. [Google Scholar] [CrossRef]
  8. Youd, T.L.; Perkins, J.B. Map showing liquefaction susceptibility of San Mateo County, California, 1987 (No. 1257-G). Available online: https://pubs.usgs.gov/publication/i1257G (accessed on 25 April 2024).
  9. Youd, T.L.; Hansen, C.M.; Barlett, S.F. Revised Multilinear Equations for Prediction of Lateral Spread Displacement. J. Geotech. Geoenvironmental Eng. 2002, 128, 1007–1017. [Google Scholar] [CrossRef]
  10. Gu, X.; Yang, J.; Huang, M.; Gao, G. Bender element tests in dry and saturated sand: Signal interpretation and result comparison. Soils Found. 2015, 55, 951–962. [Google Scholar] [CrossRef]
  11. Moon, S.W.; Ng, Y.C.; Ku, T. Global semi-empirical relationships for correlating soil unit weight with shear wave velocity by void-ratio function. Can. Geotech. J. 2018, 55, 1193–1199. [Google Scholar] [CrossRef]
  12. González, M.A. Centrifuge Modeling of Pile Foundation Response to Liquefaction and Lateral Spreading: Study of Sand Permeability and Compressibility Effects Using Scaled Sand Technique. Ph.D. Thesis, Rensselaer Polytechnic Institute, Troy, NY, USA, 2008. [Google Scholar]
  13. Abdoun, T.; Gonzalez, M.A.; Thevanayagam, S.; Dobry, R.; Elgamal, A.; Zeghal, M.; Mercado, V.; El Shamy, U. Centrifuge and Large Scale Modeling of Seismic Pore Pressures in Sands: A Cyclic Strain Interpretation. ASCE J. Geotech. Geoenvironmental Eng. 2013, 139, 1215–1234. [Google Scholar] [CrossRef]
  14. Dobry, R. Comparison Between Clean Sand Liquefaction Charts Based on Penetration Resistance and Shear Wave Velocity. In Proceedings of the 5th International Conference on Geotechnical Earthquake Engineering and Soil Dynamics and Symposium in Honor of Professor, I.M. Idriss, San Diego, CA, USA, 24–29 May 2010. [Google Scholar]
  15. Dobry, R.; Abdoun, T. An Investigation into Why Liquefaction Charts Work: A Necessary Step Toward Integrating the States of Art and Practice. Ishihara Lecture. In Proceedings of the 5th International Conference on Earthquake Geotechnical Engineering, Santiago, Chile, 10–13 January 2011. [Google Scholar]
  16. Richart, F.E.; Hall, J.R.; Woods, R.D. Vibrations of Soils and Foundation; Prentice Hall: Englewood Cliffs, NJ, USA, 1970. [Google Scholar]
  17. Anderson, D.G.; Stokoe II, K.H. Shear Modulus: A Time-Dependent Soil Property. Dynamic Geotechnical Testing, American Society of Testing and Materials; ASTM STP 654: Baltimore, MD, USA, 1978; pp. 66–90. [Google Scholar]
  18. Sharp, M.K.; Dobry, R.; Abdoun, T. Centrifuge Modeling of Liquefaction and Lateral Spreading of Virgin, Over-consolidated and Pre-Shaken Sand Deposits. Int. J. Phys. Model. Geotech. 2003, 3, 11–23. [Google Scholar]
  19. Choo, H.; Lee, C. Inverse effect of packing density on shear wave velocity of binary mixed soils with varying size ratios. J. Appl. Geophys. 2021, 194, 104457. [Google Scholar] [CrossRef]
  20. Mishra, P.; Chakrabortty, P. Prediction of void ratio and shear wave velocity for soil in quaternary alluvium using cone penetration tests. Bull. Eng. Geol. Environ. 2024, 83, 88. [Google Scholar] [CrossRef]
  21. Zuo, K.; Gu, X.; Gao, G. Evaluating liquefaction resistance of partially saturated sandy soil using the P-wave velocity. Soil Dyn. Earthq. Eng. 2024, 178, 108521. [Google Scholar] [CrossRef]
  22. El-Sekelly, W.; Mercado, V.; Abdoun, T.; Zeghal, M.; El-Ganainy, H. Bender elements and system identification for estimation of Vs. Int. J. Phys. Model. Geotech. 2013, 13, 111–121. [Google Scholar] [CrossRef]
  23. El-Shafee, O.O. Measurement of Shear Wave Velocity of Soil Specimen Prepared by Different Methods Using Resonant Column Device and Bender Elements. Master’s Thesis, Rensselaer Polytechnic Institute, Troy, NY, USA, 2011. [Google Scholar]
  24. Wu, S.; Gray, D.H.; Richart, F.E., Jr. Capillary effects on dynamic modulus of sands and silts. J. Geotech. Eng. 1984, 110, 1188–1203. [Google Scholar] [CrossRef]
  25. Bosscher, P.J.; Nelson, D.L. Resonant column testing of frozen Ottawa sand. Geotech. Test. J. 1987, 10, 123–134. [Google Scholar] [CrossRef]
  26. Al-Hunaidi, M.O.; Chen, P.A.; Rainer, J.H.; Tremblay, M. Shear moduli and damping in frozen and unfrozen clay by resonant column tests. Can. Geotech. J. 1996, 33, 510–514. [Google Scholar] [CrossRef]
  27. Chen, Y.C.; You, P.S. Evaluation of liquefaction potential by the test results of in-situ frozen samples. In Proceedings of the ISOPE International Ocean and Polar Engineering Conference, Toulon, France, 23–28 May 2004; ISOPE: Mountain View, CA, USA; p. ISOPE-I. [Google Scholar]
  28. Seed, H.B.; Wong, R.T.; Idriss, I.M.; Tokimatsu, K. Moduli and Damping Factors for Dynamic Analysis of Cohesionless Soils. J. Geotech. Eng. ASCE 1986, 112, 1016–1032. [Google Scholar] [CrossRef]
  29. Hardin, B.O.; Richart, F.E. Elastic Wave Velocities in Granular Soils. J. Soil Mech. Found. Div. Proc. Am. Soc. Civ. Eng. 1963, 89, 33–65. [Google Scholar] [CrossRef]
  30. Tsinginos, C. A Micromechanical Investigation of the Effect of Fabric and Particle Shape on the Response of Granular Soils. Ph.D. Thesis, Rensselaer Polytechnic Institute, Troy, NY, USA, 2012. [Google Scholar]
  31. Zeghal, M.; Tsinginos, C. A Micromechanical Analysis of the Effect of Fabric on Low-strain Stiffness of Granular Soils. Soil Dyn. Earthq. Eng. 2015, 70, 153–165. [Google Scholar] [CrossRef]
  32. Sharp, M.K. Development of Centrifuge Based Prediction Charts for Liquefaction and Lateral Spreading from Cone Penetration Testing. Ph.D. Thesis, Rensselaer Polytechnic Institute, Troy, NY, USA, 1999. [Google Scholar]
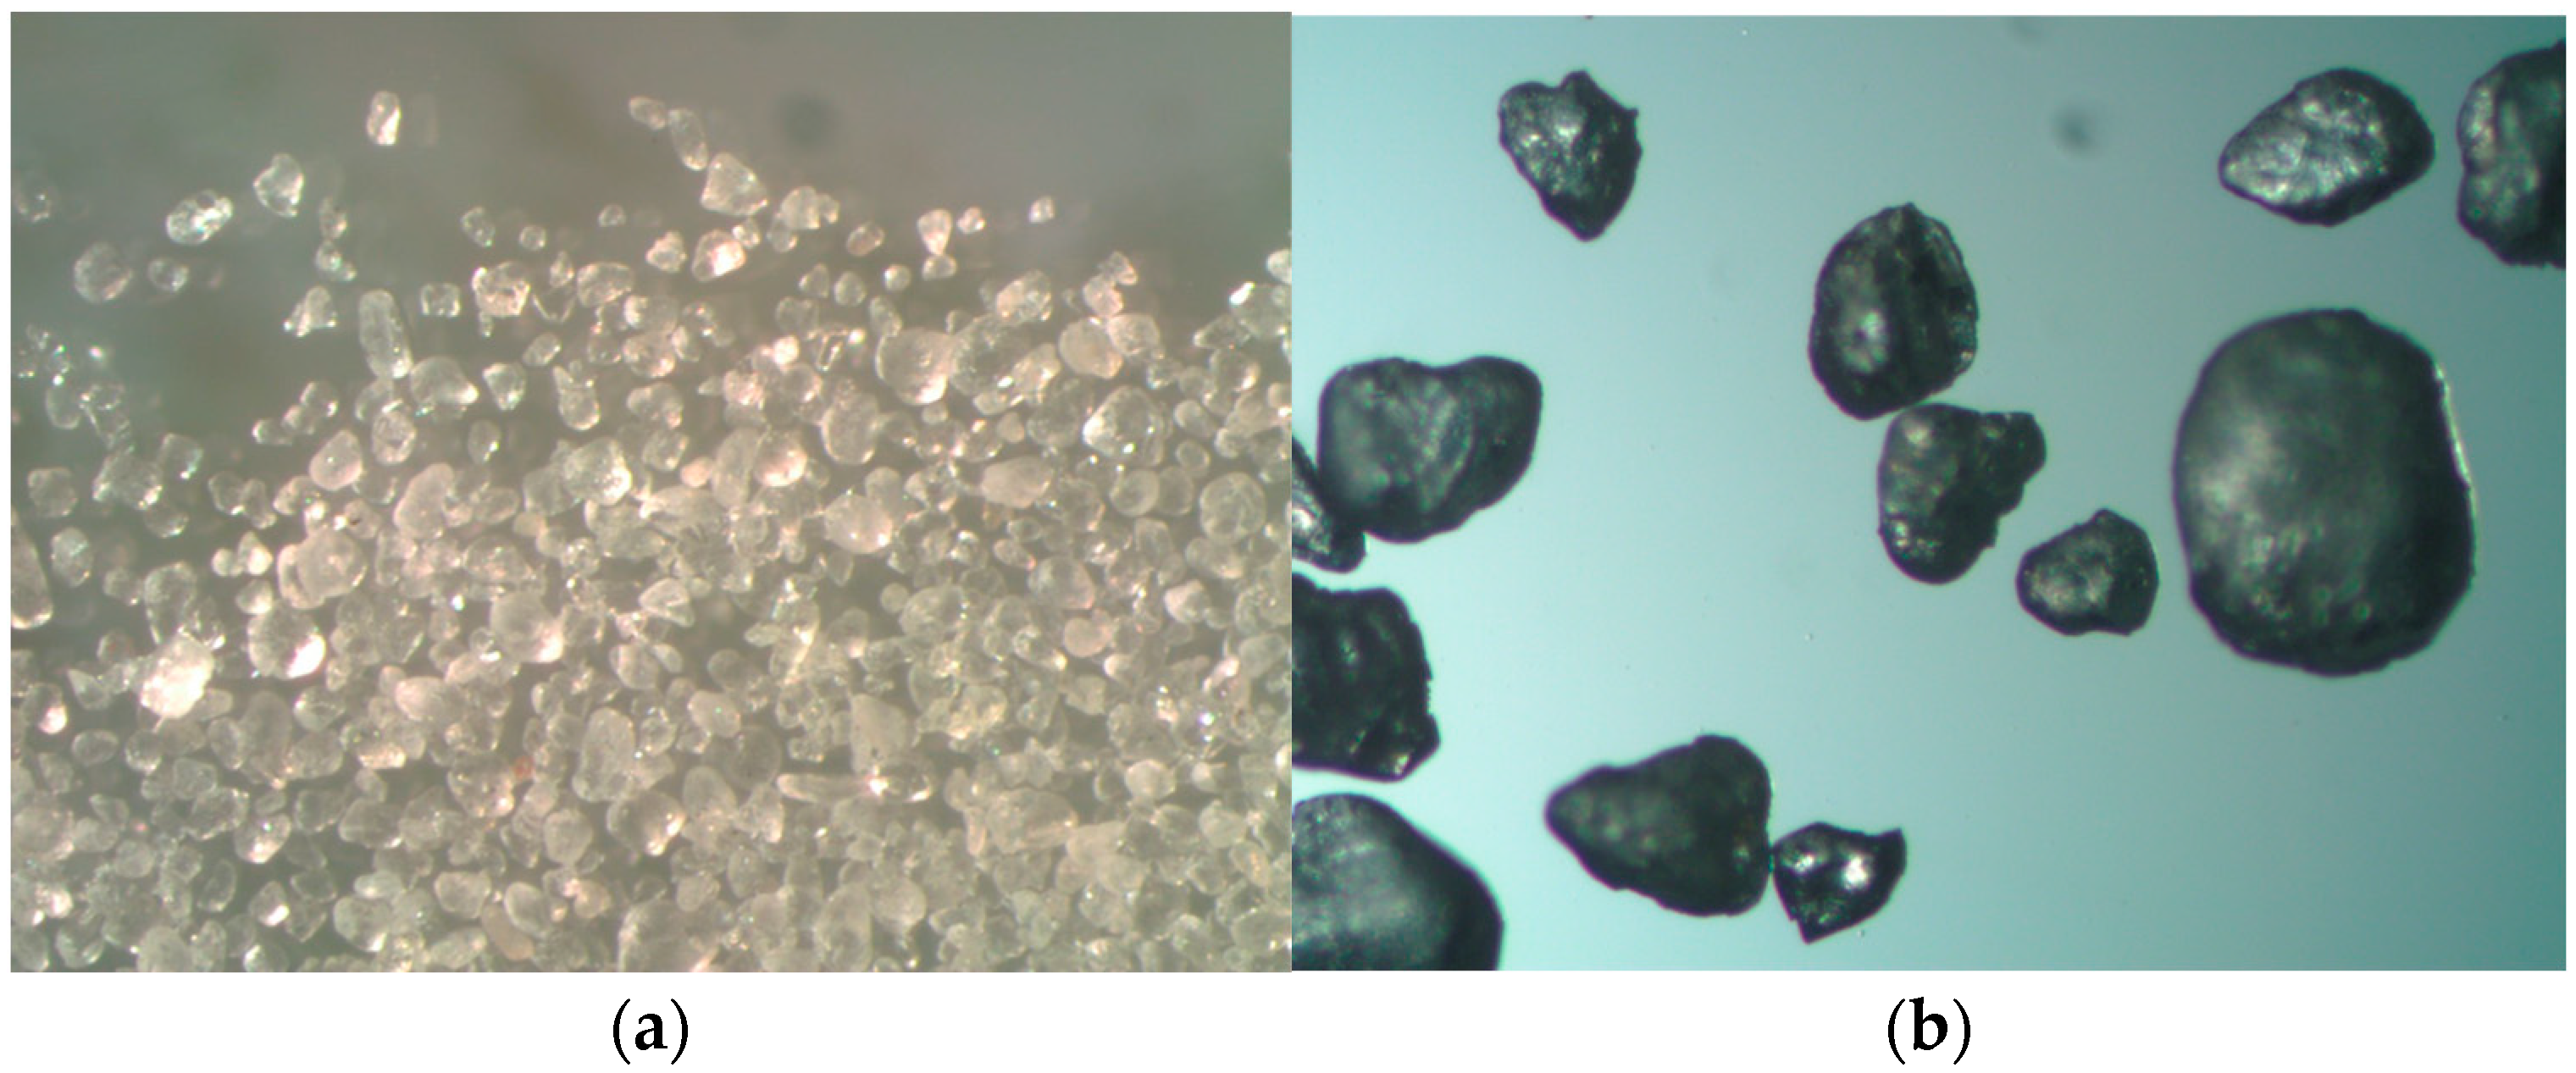
Figure 2. Microscopic images of Ottawa sand particles; (a) general view of Ottawa sand particles; (b) detailed view of dispersed Ottawa sand particles [23].
Geotechnics 04 00024 g002
Figure 3. Gradation curve of Ottawa Sand F#55 [12].
Geotechnics 04 00024 g003
Figure 4. Modified mold for the simulated hydraulic fill preparation [23].
Geotechnics 04 00024 g004
Figure 5. Simulated hydraulic fill procedure for 5.5” sample [23].
Geotechnics 04 00024 g005
Figure 6. Modulus reduction (a) and damping curves (b) for Ottawa sand with a void ratio of 0.6 at confining pressures (15, 30, and 60 kPa) [28].
Geotechnics 04 00024 g006
Figure 7. Modulus reduction (a) and damping curves (b) for Ottawa sand with a void ratio of 0.77 at confining pressures (15, 30, and 60 kPa) [28].
Geotechnics 04 00024 g007
Figure 8. Comparison of Vs measured by resonant column and bender element tests.
Geotechnics 04 00024 g008
Figure 9. Comparison of Vs for dry pluviation with similar results from [16].
Geotechnics 04 00024 g009
Figure 10. Comparison of Vs from dry pluviation and simulated hydraulic fill from [16].
Geotechnics 04 00024 g010
Figure 11. Comparison of shear modulus for dry pluviation for saturated and dry samples from [16].
Geotechnics 04 00024 g011
Figure 12. Comparison of shear modulus for dry pluviation and simulated hydraulic fill from [16].
Geotechnics 04 00024 g012
Figure 13. Variation of the low-strain shear modulus of two synthetic soil samples [31].
Geotechnics 04 00024 g013
Figure 14. Variation of normalized shear modulus and the damping of two synthetic soil samples [31].
Geotechnics 04 00024 g014
Figure 15. Correlation of shear modulus and number of particle contact, Mn for synthetic soils with different fabrics [31].
Geotechnics 04 00024 g015
Figure 16. Effect of preshaking on shear wave velocity of simulated hydraulic soil specimen [16].
Geotechnics 04 00024 g016
Table 1. Ottawa F#55 Soil Properties.
D50
(mm)
D10
(mm)
FC
%
Minimum Void Ratio 1Maximum Void Ratio 2GsMaximum Dry Density
(kg/cm3)
Minimum Dry Density
(kg/cm3)
0.2580.1550.1 0.610.82.66516501476
1 Minimum void ratio (ASTM D1557). 2 Maximum void ratios (ASTM D4254 method C).
Table 2. Testing Program.
Void Ratioσo
(kPa)
Sample Preparation Method 1Test Method 2Remarks
0.6015HFRC, BE
30HFRC, BE
60HFRC, BE
0.6215DP, DPsRC, BE
30DP, DPsRC, BE
60DP, DPsRC, BE
0.6715DPRC, BE
30DPRC, BE
60DPRC, BE
0.7015HF, DPsRC, BE
30HF, DPsRC, BE
60HF, DPsRC, BE
0.7215DPRC, BE
30DPRC, BE
60DPRC, BE
0.7415HFRC
30HFRC
60HFRC
0.7515HFRC
30HFRC
60HFRCPreshaking at σo’ of 60 kPa
0.7615HFRC
30HFRC
60HFRCPreshaking at σo’ of 60 kPa
0.7715HF, DPRC, BEBender element was only performed on a dry pluviated sample.
30HF, DPRC, BE
60HF, DPRC, BEPreshaking at σo’ of 60 kPa
1 HF—Hydraulic Fill, DP—Dry Pluviation, DPs—Saturated Sample prepared by Dry Pluviation. 2 RC—Resonant Column Test, BE—Bender Element Test.
Disclaimer/Publisher’s Note: The statements, opinions and data contained in all publications are solely those of the individual author(s) and contributor(s) and not of MDPI and/or the editor(s). MDPI and/or the editor(s) disclaim responsibility for any injury to people or property resulting from any ideas, methods, instructions or products referred to in the content.