Abstract
Over the past decades, numerical modelling has become a powerful tool for rock mechanics applications. However, the accurate estimation of rock mass input parameters remains a significant challenge. Machine learning (ML) tools have recently been integrated to enhance and accelerate numerical modelling processes. In this paper, we demonstrate the novel use of ML tools for calibrating a state-of-the-art three-dimensional (3D) finite-element (FE) model of a kinematic structurally controlled failure event in an open-pit mine. The failure event involves the detachment of a large wedge, thus allowing for the accurate identification of the geometry of the rock joints. FE models are automatically generated according to estimated ranges of joint input parameters. Subsequently, ML tools are used to analyze the synthetic data and calibrate the strength parameters of the rock joints. Our findings reveal that a relatively small number of models are needed for this purpose, rendering ML a highly useful tool even for computationally demanding FE models.
1. Introduction
Over the past decades, numerical modelling has emerged as a powerful tool for geological engineering researchers and practitioners. Machine learning (ML) tools have recently been integrated to enhance and accelerate the modelling process. While automated calibration is not a novel idea, applying these tools in geotechnical back-analysis tasks is still nascent [1].
Irrespective of the modelling method applied, representative material properties must be entered for numerical models to produce useful predictions of ground behavior. Compared to the mechanics of human-made materials, the heterogeneity and complexity of geological materials translate into low predictive power. Therefore, only a range can be estimated for material properties [2]. Particularly, it is difficult to assess the shear strength of discontinuities, or rock joints, as they consist of irregular geometry and are influenced by several factors. Intact rock properties can be estimated empirically or from physical and laboratory testing [3]. In contrast, rock joint strength cannot be measured directly. Intact rock bridges within the rock joints are assumed to have a crucial impact on the stability of rock slopes but cannot be quantified and analyzed pre-failure [4]. Considering these difficulties, kinematic failure events are an invaluable source for deepening the understanding of rock joints as they allow for assessing joint properties via back-analysis.
Accurate slope stability assessment in open-pit mines is paramount for several reasons, including safety, operational considerations, economic efficiency, and environmental concerns. The rock joints’ geometry and shear strength largely govern the stability of the slope. Monitoring devices are often employed to detect the onset of slope failure [5]. Following the detachment of a rock wedge, the geometry of the rock joints can be observed and identified with greater accuracy. Nevertheless, a rigorous back-analysis study is still required to ensure that the proper strength properties are obtained. The modelling of wedge failure requires a 3D model so that the open-pit geometry and intersecting rock joints are accounted for. These models require a long solving time, rendering the back-analysis tasks laborious and time-consuming.
ML algorithms can recognize patterns, which are used to make predictions [6]. ML can be used to develop empirical relationships that can be used to better assess rock properties [7,8]. It has been demonstrated that ML can also be incorporated into numerical modelling tasks [9,10]. This can be achieved by generating models and analyzing the numerical data with ML tools [11]. The coupling of ML with engineering models is sometimes referred to as surrogate models. An overview of different possible applications of surrogate models is given by [12]. These applications include rapid prediction, solving inverse problems, and anomaly detection. Guidelines for ML and data analysis practice have been given by [13].
This paper presents a case study where ML enhances the back-analysis of a failure event to refine a range of possible material strengths for the most important features. In this case, the application of ML, using python functions that interface with the FE models, eliminates the manual iterations of sensitivity analysis traditionally carried out by the user. The paper is organized as follows: (1) a review of slope stability analysis methods, (2) the background information of the case study, (3) the FE model technical details and joint properties, (4) the application of ML, and (5) back-analysis results.
2. Slope Stability Analysis
Historically, limit equilibrium (LE) methods calculating a factor of safety (FoS) have been the most common analysis method applied to assess slope stability [3].
Following the advent of numerical codes, Ref. [14] developed the shear strength reduction (SSR) method, which calculates a strength reduction factor (SRF). The SRF is the factor to which material strengths applied in the model are reduced to elicit non-convergence (i.e., failure) in the model, and it is designed to be equivalent to the LE FoS. Researchers have modified this technique for various scenarios [15,16]. When the failure is assumed to be kinematic, the SSR option can be applied solely to the rock joints.
Compared to LE methods, FE codes with the SSR feature present significant advantages for solving slope stability problems. First, no specific failure shape (e.g., circular) has to be assumed, and complex failure mechanisms can be identified. Second, no a priori assumptions are needed for the inclination and locations of interslice forces. Third, in LE, the shear failure is assumed to be fully mobilized along the failure surface at the time of failure. In contrast, in FE models gradual failure development can be simulated. Finally, in contrast to LE methods, in FE codes the strains and displacements are computed, and these can be compared to in situ monitoring results, ultimately allowing for a more accurate analysis [17].
However, when attempting to back-analyze a failure event with SSR, there are two apparent drawbacks. Firstly, SSR models are computationally demanding, requiring the baseline FE model to be solved multiple times until the critical SRF is identified. For large 3D models with anisotropic material behavior, computation can take several days.
Second, the range of potential strength values that could result in an SRF of one (assumed to represent meta-stable conditions) varies significantly depending on the number of lithological units in the model and the material model applied. For example, a one material model applying Mohr–Coulomb material properties requires a combination of at least different cohesions, friction angles, Young’s modulus, and Poisson’s ratios to be tested. Typical open-pit mines would have at least five different lithological units, equating to at least 20 different parameters to be modified within a reasonable range to calculate an SRF of one.
Considering these drawbacks, we propose an automated process using ML for calibrating material strengths. A wedge failure event in an open-pit mine is used to demonstrate the proposed methodology, as outlined in Section 5.
3. Open-Pit Mine Case Study
The case study applied in this study is sourced from an open-cut coal mine. Due to confidentiality and non-disclosure agreements, the location of the case study cannot be disclosed. Non-identifying features of the mine are described below.
The case study bench scale slope angles range between 48 and 65 degrees. The bench heights range between approximately 12 and 23 m, with an overall slope height of 95 to 105 m of the focus area. The case slope intersects Permian age sedimentary strata of interbedded siltstones and sandstones. Typical bedding ranges in size from 1 to 5 m. The upper bench consists of weathered Permian strata conformably overlying fresh Permian units. The weathered and fresh Permian units have different rock mass properties. However, the current assessment has grouped them into one rock mass domain, fresh overburden, which is a typical model assumption applied by the geotechnical engineers at the case study mine. Figure 1 shows a photo of the case study slope. Small debris curtains, not exceeding single bench widths, are observed. These are attributed to surficial face weathering over time. The stability of the case study is driven by the intersection of three sub-vertical faults and a basal sub-horizontal (H15) shear plane. Figure 2 shows the faults in the FE model as projected from the site geological model. The orientations of structures are summarized in Table 1. Figure 3 shows a plan view map of the case study slope.
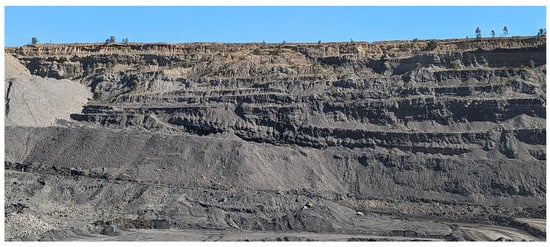
Figure 1.
Perspective photo of the open-pit slope, showing interbedded sandstone and siltstone units.
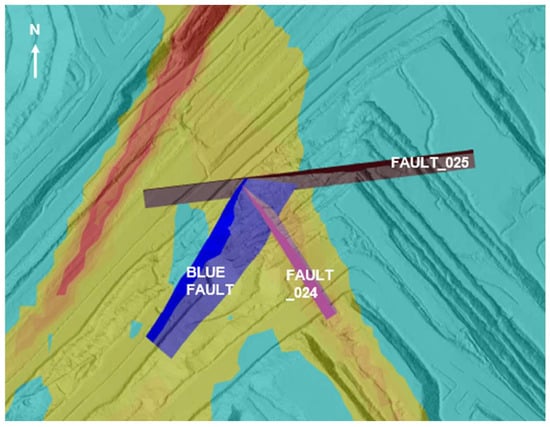
Figure 2.
Plan view map showing orientations of fault surfaces intersecting the case study wall and contours of H15 floor dip. Floor dip legend: blue = floor dip < 6 degrees, yellow-orange = floor dip 6 to 14 degrees, red = floor dip > 14 degrees.

Table 1.
Summary of major structures intersecting case study slope.
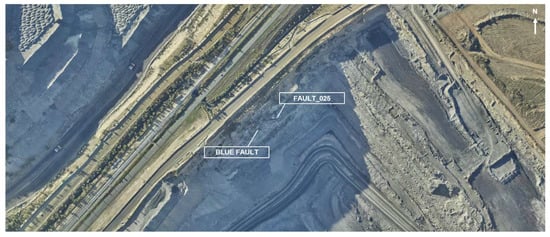
Figure 3.
Plan view map of the case study slope showing major fault traces per Figure 2, annotated in text.
4. Three-Dimensional Finite-Element Model
The case study slope was modelled using 3D FE code, RS3 [18]. While many of the earlier studies of slope stability problems have been conducted assuming 2D plane-strain conditions, it has been shown that 3D models provide a more comprehensive representation of real-world scenarios [3]. Advancements in computing and image processing allow for creating accurate high-resolution models from ariel imagery and topographical surveying [19]. This technology was used for building the geometry of the current FE model.
Three-dimensional models consist of a significantly larger number of elements and degrees of freedom compared to 2D models, thus requiring a long solving time. The graphical rendering of 3D models is also computationally demanding, which can negatively impact the user experience during post-processing. To balance the tradeoff between model complexity and computational efficiency, two simplifications were applied to the FE models:
- Rather than modelling the full open-pit mine, only a representative 3D section was simulated (see Figure 4).
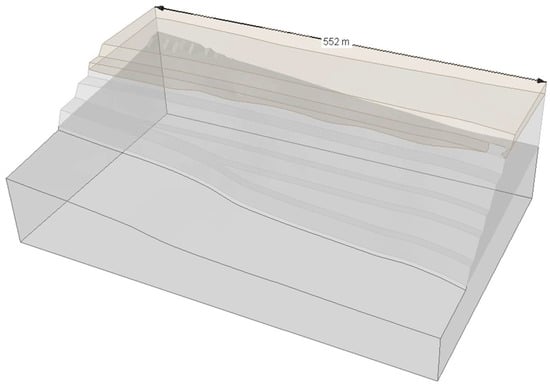 Figure 4. The external geometry of the 3D FE model.
 - The intact rock materials were modelled as elastic materials to reduce the number of iterations required for equilibrium convergence.
These two simplifications are assumed to be acceptable, given that the wedge failure mechanism is localized within the 3D model boundaries and the slope failure is predominantly structurally controlled. Nonetheless, even after applying these simplifications, the model requires several hours of comparably long solving time.
Persistent structures intersecting the case study slope, as shown in Figure 2, were included in the model as explicit, zero-thickness, joint elements [20]. Material properties applied to explicit joints are summarized in Table 2, with all joints assigned the same strength.

Table 2.
Estimated ranges of joint properties.
The ranges of friction and cohesion are considered to vary by ±50% relative to the mean values. The shear stiffness of the joints is regularly assumed to be significantly less than the normal stiffness [21]. To examine the effect of the ratio of shear to normal stiffness, a ratio of one-tenth is assumed and varied as well by ±20%.
After the baseline FE model was created in RS3, a Python function was written to duplicate the model files and alter the joint properties according to the estimated ranges in Table 2. A random generator assigns the joint properties according to a uniform distribution. Assigning normal distributions to geological material properties is standard practice when undertaking probabilistic analysis. However, a uniform distribution is more suitable for the current application, as ML models perform better when trained on evenly distributed data [22]. Furthermore, a uniform distribution allows equal opportunity for a value to be selected within the user-defined range.
5. Application of ML for Back-Analysis
Following the generation of modified FE models using Python code, the models were solved via RS3’s Compute engine.
The dataset the Python code was applied to is a matrix that consists of input and output columns. This function retrieves the varied input parameters for each model from the model files, which sum to a total of eight columns: the joint normal stiffness Kn, the joint shear stiffness Ks, and the friction angle and cohesion for two joint sets: joint set #1, which refers to the basal shear, and joint set #2, which refers to the sub-vertical joints. The output data consist of the results of interest, which can be found in the RS3 Result files. These results include:
- The maximum computed displacement.
- The convergence of the model.
Large displacements and non-convergence both serve as an indicator of failure and instability. Note that the second result is not a numerical value but a binary classification, i.e., 1 indicates convergence, and 0 indicates non-convergence. For any ML analysis, selecting the model that best fits the task at hand is important. The current analysis necessitates a supervised learning algorithm, i.e., an ML model that correlates the input parameters with the results. ML models can generally be divided into regression and classification-type models. The first returns a continuous numerical prediction, and the second predicts a discrete class number. A regression model is more suitable for correlating with the displacement results, and a classification model is required for the convergence results. Another class of ML models is multi-output models, which are capable of simultaneously training on both regression and classification outcomes.
To select the optimal ML model, it is standard practice to compare the performance of different models and choose the best model. Several metrics are available for evaluating model performance, including mean square error and root-mean-square error (RMSE). For classification-type models, the results can be presented as a confusion matrix. The confusion matrix is organized so that its rows represent the true classes, and the columns represent predicted classes. Performance metrics measure the deviation between actual and expected results. This process is carried out by splitting the data into two sets, one for training the ML model and the second for testing it. The train–test split is a fundamental part of ML analysis [23]. For the current work, the datasets for training and testing have been split to a ratio of 70% and 30%, respectively.
The ML models used for this study are regression, classification, and multi-output random forest (RF) models. Decision trees are ML models that predict the value of a target variable by learning simple decision rules inferred from data features. The tree is built by splitting the data, constituting the tree’s root node, into subsets. This process is repeated recursively. The number of splits in a decision tree is called the tree depth. RF models consist of multiple decision trees. RFs outperform decision trees and other ML models, such as support vector machines and extreme gradient boosting. For this paper, RFs were chosen because of their robust and interpretable nature and their ability to perform well with minimal hyperparameter tuning [24]. A maximum tree depth of 60 was chosen for the RF models, and no hyperparameter tuning was carried out. Hyperparameters are parameters that control the learning process of ML and are not part of the problem. The Scikit-Learn library was imported into Python for the execution of the RF models.
A Python function was written so that as RS3 is solving the FE models, the function is executed to assess the acceptability of the ML model results. This simultaneous evaluation is beneficial because, in the realm of ML, determining the requisite amount of data for model calibration a priori remains an unresolved challenge [25]. The real-time assessment facilitates an adaptive approach, allowing the computational process to be terminated once the ML model performance is deemed satisfactory. This streamlined process ensures both accuracy and efficiency.
Due to the significant consideration of computational time in studies like the current one, cross-validation was used to evaluate the performance of different ML models. Cross-validation is a robust statistical technique used to assess the generalizability of predictions made by a model. In this method, the dataset is partitioned into multiple subsets; the model is trained on some subsets and tested on others, iteratively. This process provides a comprehensive assessment of the model’s performance and helps mitigate the risk of overfitting, especially in the context of limited data. For smaller datasets, the importance of cross-validation is accentuated. It ensures that every data point is utilized for training and validation, maximizing the information extracted from the limited data and providing a more reliable performance estimate [23].
Once the cross-validation results are deemed acceptable, we compute the feature importance. Feature importance refers to techniques that assign a score to input features based on their relative impact on results. Feature importance provides valuable insight into the engineering problem, as the inputs that trigger the failure mechanism can be identified and quantified. In random forests, the feature importance can be computed based on the number of times each feature is used to split the data, weighted by the improvement it brings [24].
According to the methodology undertaken for this study, the model calibration is not executed directly by the ML analysis, as the SRF is only computed with the SSR option. Instead, the proposed process allows for narrowing the range of inputs and validating the back-analysis process by adding additional models with the SSR option. Figure 5 shows a flowchart that summarizes the back-analysis methodology. As shown in this figure, the input ranges estimation is used as input for the ML model, and the automated computation of results is defined as output. Following the learning process, the performance of the ML model is assessed. If the accuracy results are shown to be satisfactory, the feature importance is computed, and the input parameters are re-estimated accordingly. Finally, FE models are computed with the SSR option in order to select the set of parameters that best match the failure scenario, i.e., SRF = 1. The results and the efficiency of this process are further discussed in detail in the following section.
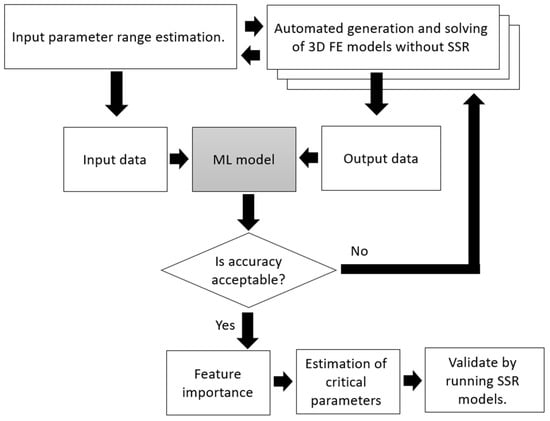
Figure 5.
Flowchart of proposed back-analysis methodology.
6. Results and Discussion
After completing the solving of 30 files, the RF models were found to yield acceptable predictions. Figure 6 shows a sample of the actual vs. predicted results of the maximum displacement for an example of seven models. The RMSE in the cross-validation scores were generally low. However, the different scores exhibited a high variance and the RMSE for displacements ranged from 1.5 to 3 m. This high variance can be understood considering the displacements of the non-converging FE models. While these large displacements generally indicate slope failure, the actual computed displacement in non-converging FE models is not accurate. Figure 7 shows the confusion matrix for the classification model for 10 models. This demonstrates that the RF classification model can predict model convergence based on the joint properties. As discussed in the previous section, the multi-output RF model was built by correlating joint properties with displacement and convergence results. In some cases, the combination of several types of output data is found to boost ML model performance [23]. However, the current ML multi-output model performed less effectively than the single-output regression and classification models. Nonetheless, all types of RF models performed similarly.
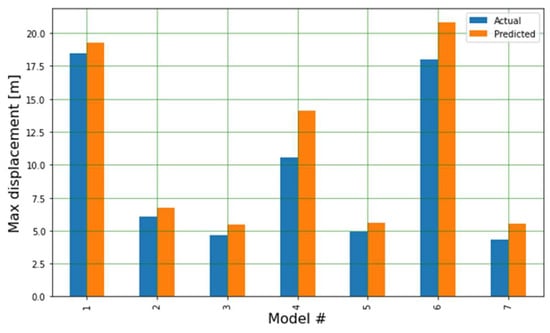
Figure 6.
A sample of actual vs. predicted results for the RF regression model.
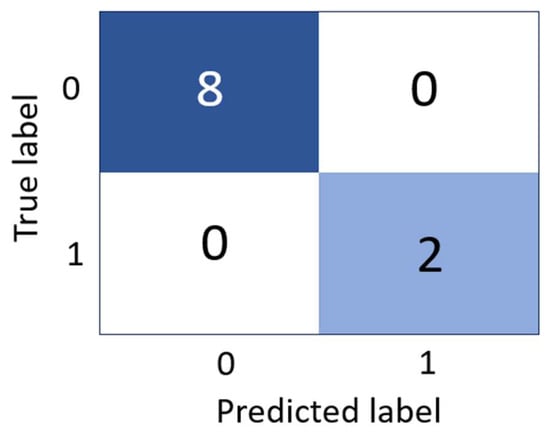
Figure 7.
Confusion matrix for the RF classification model.
In terms of judging ML model performance, it is essential to bear in mind that ML model metrics can only be understood within the specific context of the problem being studied [11]. The objective of the ML model in the current study is not to build a surrogate model that accurately predicts displacements, as these can be regarded as meaningless, as discussed. Instead, ML is used to accelerate and enhance the back-analysis process, which in the current problem means finding the combination of joint parameters that yield an SRF = 1. As shown in Figure 5, the ML model is used to compute the feature importance to gain insight into the effect of the parameters. Given the consistent accuracy across different models, it can be confidently inferred that the feature importance results are meaningful and informative.
Figure 8 shows feature importance results. All ML models consistently find that the sub-vertical joints’ friction angle is the single impactful parameter, while other parameters have a negligible contribution to slope failure. This finding is indeed specific to the current case study, considering its unique geometry, engineering assumptions, and ranges of input parameters defined for the FE models. This result greatly simplifies the remainder of the back-analysis process as it indicates that efforts can be focused solely on the calibration of the sub-vertical joints’ friction angle, while other parameters can be ignored.
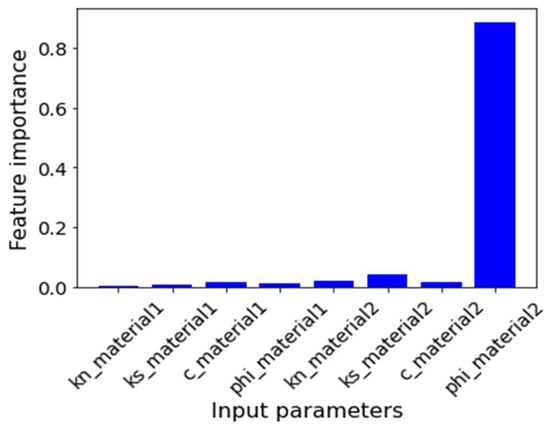
Figure 8.
Feature importance results. Materials 1 and 2 refer to the basal and sub-vertical joints, respectively.
Figure 9 shows a plot of the model displacements and convergence results versus the friction angle of the sub-vertical joints. A polynomial fit to these data points is added to the plot. It can be observed that the smaller the friction angle, the more the maximum displacement results diverge. An exception to the trend is apparent in one model that stops converging under a friction angle of seven. This result is possible in FE models, as randomness and inaccuracies are part of the iterative solving process. The apparent reason for this is that displacement results become less accurate as the instability effect increases. For SSR analysis, it is regularly assumed that the transition point to a non-linear increase in the maximum displacement indicates the onset of failure.
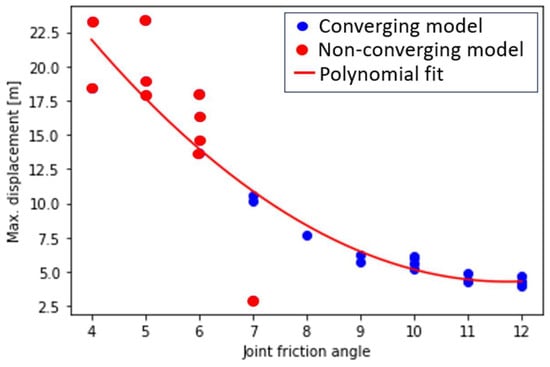
Figure 9.
Plot of max. Model displacement vs. joint friction angle.
Based on the feature importance results and the plot shown in Figure 9, a few additional FE models were generated, this time with the SSR option enabled. These models consist of varying friction angles for the subvertical joints in the range of 7 to 10 degrees. The other previously varied parameters are made constant and equal to the mean values in Table 2. Figure 10 shows the SRF results for these models. Figure 11 shows the displacement contours for the FE model with a friction angle equal to 10. The resultant SRF for this model is 1.02. This indicates that according to the assumptions made for the current analysis, a representative friction angle for the sub-vertical joints is between 9 and 10 degrees.
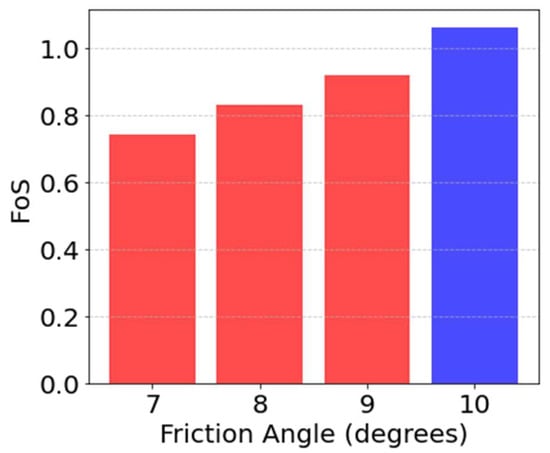
Figure 10.
SRF results for SSR models with varied friction angle of the sub-vertical joints. The blue bar represents the calibrated model, whereas the red bars represent the non-calibrated models.
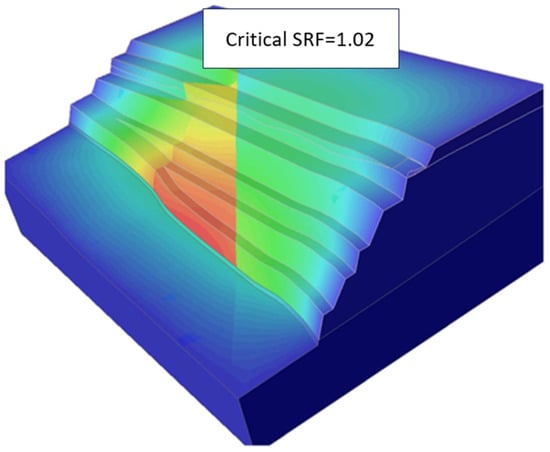
Figure 11.
Three-dimensional FE results showing relative displacement contours applying a joint friction angle of 10 degrees; critical SRF = 1.02. Contour legend: red (warmer) colors represent regions of higher calculated displacement, blue (cooler) colors represent regions of lower calculated displacement.
It is emphasized that the proposed methodology could be made more efficient in terms of both computational demand and user intervention. Codes can be created where the back-analysis process is further optimized and/or automated. For example, optimization algorithms can be used to dynamically update input parameters of the FE models concurrent to the solving process. This could reduce solving time and allow for a fully automated back-analysis process. At the current state, implementing this approach would require developments within the RS3 program to allow it to interface with external programs. However, beyond the technical limitations, it is argued that fully automated methodologies should be cautiously treated. Over-reliance on automation might diminish human supervision to a point where the user-engineer does not detect erroneous FE and ML analyses results.
7. Summary and Conclusions
A kinematic (structurally controlled) failure case study in a large open-pit was back-analyzed using a state-of-the-art 3D FE model. The application of ML tools for the enhancement and acceleration of the back-analysis tasks was demonstrated. It was found that a relatively small number of 30 models achieved a reasonable performance of RF models. This finding indicates that ML tools can be useful and within feasibility even for computationally demanding FE models.
According to the proposed methodology, slope models are computed at the first stage without the SSR option to reduce FE model solving time. In the second stage, fewer additional FE models with SSR are generated based on the results of feature importance studies. Calibration was achieved within a reasonable time frame, with minimal user manual intervention.
It is important to note the limitations of the current work. Every engineering problem requires its unique set of assumptions and simplifications. For example, if the failure is assumed to be a mechanism involving the shearing of rock bridges, the simplification adopted here of treating the intact rock as elastic would not be valid. In contrast, for other slope failures, it is possible that 2D models would be adequate for capturing the failure mechanism. This paper focuses on the application of ML for the back-analysis of structurally controlled slope failure. The results demonstrate the potential of ML for enhancing numerical analysis, even for complex and computationally demanding models. Ultimately, it is imperative to recognize that the choice of the numerical modelling approach dramatically impacts the manner in which ML could best be implemented to enhance human learning.
Author Contributions
Conceptualization, A.M. (Amichai Mitelman), A.M. (Alison McQuillan), and D.E.; methodology, A.M. (Amichai Mitelman); software, A.M. (Amichai Mitelman) and A.M. (Alison McQuillan); validation, A.M. (Amichai Mitelman) and A.M. (Alison McQuillan); formal analysis, A.M. (Amichai Mitelman) and A.M. (Alison McQuillan); investigation, A.M. (Amichai Mitelman) and A.M. (Alison McQuillan); resources, A.M. (Alison McQuillan); data curation, A.M. (Alison McQuillan); writing—original draft preparation, A.M. (Amichai Mitelman) and A.M. (Alison McQuillan); writing—review and editing, D.E. All authors have read and agreed to the published version of the manuscript.
Funding
This research received no external funding.
Data Availability Statement
Data sharing is not applicable to this article due to confidentiality and non-disclosure constraints.
Acknowledgments
The authors would like to acknowledge Dan Payne, Jiwoo Ahn, and Jayson Summerville of BHP Coal for their contribution of the case study. Sina Moallemi of Rocscience Inc. is also acknowledged for his assistance with program functionality as Product Manager of RS3.
Conflicts of Interest
The authors declare no conflict of interest.
References
- Mitelman, A.; Sherzer, G.L. Coupling numerical modeling and machine-learning for back analysis of cantilever retaining wall failure. Comput. Concr. 2023, 31, 307–314. [Google Scholar]
- Mitelman, A.; Yang, B.; Elmo, D.; Giat, Y. Choosing between prediction and explanation in geological engineering: Lessons from psychology. In Interdisciplinary Science Reviews; Taylor & Francis: Abingdon, UK, 2023; pp. 1–18. [Google Scholar]
- Wyllie, D.C.; Mah, C. Rock Slope Engineering; CRC Press: Boca Raton, FL, USA, 2004. [Google Scholar]
- Elmo, D.; Donati, D.; Stead, D. Challenges in the characterisation of intact rock bridges in rock slopes. Eng. Geol. 2018, 245, 81–96. [Google Scholar] [CrossRef]
- Mohmmed, M. A review on slope monitoring and application methods in open pit mining activities. Int. J. Sci. Technol. Res. 2021, 10, 181–186. [Google Scholar]
- Kelleher, J.D.; Tierney, B. Data Science; MIT Press: Cambridge, MA, USA, 2018. [Google Scholar]
- Li, D.; Faradonbeh, R.S.; Lv, A.; Wang, X.; Roshan, H. A data-driven field-scale approach to estimate the permeability of fractured rocks. Int. J. Min. Reclam. Environ. 2022, 36, 671–687. [Google Scholar] [CrossRef]
- Huang, L.; Asteris, P.G.; Koopialipoor, M.; Armaghani, D.J.; Tahir, M.M. Invasive weed optimization technique-based ANN to the prediction of rock tensile strength. Appl. Sci. 2019, 9, 5372. [Google Scholar] [CrossRef]
- Mitelman, A.; Yang, B.; Urlainis, A.; Elmo, D. Coupling Geotechnical Numerical Analysis with Machine Learning for Observational Method Projects. Geosciences 2023, 13, 196. [Google Scholar] [CrossRef]
- Morgenroth, J.; Khan, U.T.; Perras, M.A. An overview of opportunities for machine learning methods in underground rock engineering design. Geosciences 2019, 9, 504. [Google Scholar] [CrossRef]
- Mitelman, A.; Yang, B.; Elmo, D. Implementation of Surrogate Models for the Analysis of Slope Problems. Geosciences 2023, 13, 99. [Google Scholar] [CrossRef]
- Furtney, J.K.; Thielsen, C.; Fu, W.; Le Goc, R. Surrogate Models in Rock and Soil Mechanics: Integrating Numerical Modeling and Machine Learning. Rock. Mech. Rock. Eng. 2022, 55, 2845–2859. [Google Scholar] [CrossRef]
- Morgenroth, J.; Unterlaß, P.J.; Sapronova, A.; Khan, U.T.; Perras, M.A.; Erharter, G.H.; Marcher, T. Practical recommendations for machine learning in underground rock engineering—On algorithm development, data balancing, and input variable selection. Geomech. Tunn. 2022, 15, 650–657. [Google Scholar] [CrossRef]
- Zienkiewicz, O.C.; Humpheson, C.; Lewis, R.W. Associated and non-associated visco-plasticity and plasticity in soil mechanics. Geotechnique 1975, 25, 671–689. [Google Scholar] [CrossRef]
- Matsui, T.; San, K.-C. Finite element slope stability analysis by shear strength reduction technique. Soils Found. 1992, 32, 59–70. [Google Scholar] [CrossRef]
- Yang, Y.; Xia, Y.; Zheng, H.; Liu, Z. Investigation of rock slope stability using a 3D nonlinear strength-reduction numerical manifold method. Eng. Geol. 2021, 292, 106285. [Google Scholar] [CrossRef]
- Kardani, N.; Zhou, A.; Nazem, M.; Shen, S.-L. Improved prediction of slope stability using a hybrid stacking ensemble method based on finite element analysis and field data. J. Rock. Mech. Geotech. Eng. 2021, 13, 188–201. [Google Scholar] [CrossRef]
- Rocscience. Rocscience Software Products: Dips, Slide, Phase2; Rocscience: Toronto, ON, Canada, 2004. [Google Scholar]
- Bar, N.; McQuillan, A.; Ma, T.; Wai, D.; Hammah, R.; Corkum, B.; Yacoub, T.; Cobián, J.C.; Mojica, B. A geotechnical evaluation of the Cumba Pit Slope Failure, Dominican Republic. In IOP Conference Series: Earth and Environmental Science; IOP Publishing: Helsinki, Finland, 2023; p. 012009. [Google Scholar]
- Cundall, P.A.; Hart, R.D. Numerical modelling of discontinua. Eng. Comput. 1992, 9, 101–113. [Google Scholar] [CrossRef]
- Hammah, R.E.; Yacoub, T.; Corkum, B.; Curran, J.H. The practical modelling of discontinuous rock masses with finite element analysis. In ARMA US Rock Mechanics/Geomechanics Symposium; ARMA: San Francisco, CA, USA; p. ARMA-08.
- Alves, G.; Amblard, M.; Bernier, F.; Couceiro, M.; Napoli, A. Reducing unintended bias of ml models on tabular and textual data. In Proceedings of the 2021 IEEE 8th International Conference on Data Science and Advanced Analytics (DSAA), Porto, Portugal, 6–9 October 2021; pp. 1–10. [Google Scholar]
- Géron, A. Hands-On Machine Learning with Scikit-Learn, Keras, and TensorFlow; O’Reilly Media, Inc.: Sebastopol, CA, USA, 2022. [Google Scholar]
- Breiman, L. Random forests. Mach. Learn. 2001, 45, 5–32. [Google Scholar] [CrossRef]
- Amirabadi, A.; Levman, J.; Martel, A.L.; Emersic, Z.; Meden, B.; Garcia-Pedrero, A.; Ramirez, S.C.; Kong, D.; Moody, A.R.; Tyrrell, P.N.; et al. Sample-Size Determination Methodologies for Machine Learning in Medical Imaging Research: A Systematic Review. Can. Assoc. Radiol. J. 2019, 70, 344–353. [Google Scholar]
Disclaimer/Publisher’s Note: The statements, opinions and data contained in all publications are solely those of the individual author(s) and contributor(s) and not of MDPI and/or the editor(s). MDPI and/or the editor(s) disclaim responsibility for any injury to people or property resulting from any ideas, methods, instructions or products referred to in the content. |
© 2023 by the authors. Licensee MDPI, Basel, Switzerland. This article is an open access article distributed under the terms and conditions of the Creative Commons Attribution (CC BY) license (https://creativecommons.org/licenses/by/4.0/).