Article

Urban Rivers Under Pressure: Human-Induced Modifications, Pollution, and Prospects for Restoration—A Case Study of the Assi River, Varanasi

1
Department of Civil Engineering, Indian Institute of Technology (BHU), Varanasi 221005, India
2
Department of Building, Energy and Material Technology, UiT, The Arctic University of Norway, 8515 Narvik, Norway
*
Author to whom correspondence should be addressed.
Geographies 2025, 5(4), 69; https://doi.org/10.3390/geographies5040069
Submission received: 9 October 2025 / Revised: 15 November 2025 / Accepted: 18 November 2025 / Published: 20 November 2025

Abstract

Small urban rivers are crucial to global freshwater ecosystems, yet they are disproportionately impacted by human-induced modifications. Existing restoration approaches have primarily focused on large river systems. This study aims to provide a comprehensive, high-resolution assessment of the urban stretch of the Assi River (~7 km) in Varanasi, India, to inform restoration strategies as a representative case study of the challenges faced by small rivers. We used high-resolution unmanned aerial vehicle (UAV) imagery to map the river and collected water quality data from seven sampling sites in October 2022. Our findings reveal a severe loss of multidimensional connectivity. Geospatial analysis revealed extensive encroachment, with built-up areas occupying 137,580 m2 along a 100 m length within the 30 m buffer zone, and channel widths constricted to as narrow as 1 m in some sections. Water quality is severely impaired, with dissolved oxygen (DO) levels dropping to a minimum of 0.2 mg/L and faecal coliform levels reaching up to 2.1 × 10⁸ MPN/100 mL. We propose a UAV-based restoration framework that integrates geospatial data with policy recommendations to reconnect the river. However, a limitation of this work is that it is based on single-season sampling and temporal variations; multi-seasonal campaigns will likely improve the framework. The proposed model for urban river management directly addresses SDG 6.3 and 6.6, which target the reduction of water pollution and protecting water-related ecosystems, respectively, and SDG 11.7, which aims to provide access to green spaces.

1. Introduction

Rivers are not mere bodies of water; they are the lifeblood of ecosystems, shaping landscapes, providing habitats for diverse flora and fauna, and sustaining human civilisation for centuries [1]. Small rivers constitute a substantial portion of river networks, comprising 70% to 80% of the total channel length [2]. Small rivers are disproportionately affected by land use and river engineering due to their unique characteristics and their critical role in larger river networks [3]. These small rivers, comprising first and second-order channels, make up a significant portion of the total channel length of larger river networks [4]. Despite their small size, these rivers play a crucial role in transmitting sediment and nutrients, providing habitat for diverse aquatic and riparian organisms, creating migration corridors, and governing connectivity at the watershed scale [5].
Small rivers are particularly vulnerable to human-induced disturbances [6]. Activities such as upland mining, urban and agricultural development, channelisation, groundwater withdrawal, and the construction of small structures like culverts and grade controls disrupt the connectivity of the small rivers [7], leading to significant alterations or complete loss of the ecosystems [2]. Additionally, dams, removal or alteration of riparian ecosystems, increased nutrient and sediment yields, and the introduction of exotic species also disproportionately affect small rivers [8,9]. Furthermore, small rivers commonly lack legal protection under legislation protecting water quality and stream flow, making them particularly susceptible to alteration and loss due to human activities [10]. The cumulative effects of these disturbances, combined with the lack of legal protection, contribute to the disproportionate impact of land use and river engineering, making these small rivers among the most endangered river ecosystems.
As our global population continues to migrate towards urban areas, more than 55% of the world’s population already resides in cities, with an additional 2.5 billion projected to do so by 2050, according to the United Nations. Consequently, an ever-increasing number of people will depend on urban rivers marred by the consequences of urban expansion [11]. The adverse impact of urbanisation on river hydrology has long been observed, which includes increased flooding [12], depleted biodiversity [13], compromised water quality [14], and, in some cases, eroded the very essence that once drew communities to their banks. Urbanisation, whether directly or indirectly, impacts all components of river ecosystems [15]. Therefore, successfully restoring urban waterways requires a profound understanding of these disturbances and their consequences [11,16]. Urbanisation’s well-documented effects on river ecosystem structure and function include changes in hydrology, sediment dynamics, groundwater recharge, aquatic and riparian biodiversity, and the emergence of the ‘urban river syndrome’ marked by consistent ecological degradation [17,18].
Due to increasing urbanisation, the connectivity of smaller rivers, particularly those flowing through urban areas (Figure 1), is gradually disrupted or lost [2]. Connectivity in river ecosystems refers to the water-mediated transfer of matter, energy, and organisms across spatial and temporal scales within a river network [2]. Connectivity can be multidimensional, referring to the water-mediated transfer of matter, energy, and organisms across spatial and temporal scales within a river network. This includes (i) longitudinal connectivity, i.e., the uninterrupted flow of water, sediment, and organisms along the river’s main channel; (ii) lateral connectivity involving exchange between the river channel and its adjacent areas (e.g., floodplain, riparian zones, and other water bodies) and (iii) vertical connectivity presents interactions that occur between surface water and the groundwater and hyporheic zones. Finally, temporal connectivity comprises variations in hydrological and ecological processes that happen seasonally or episodically [19].
63% of the world’s very long rivers (>1000 km) are no longer free-flowing over their entire length, with connectivity loss representing one of the most critical challenges for aquatic ecosystem functioning [20]. Researchers have developed the Connectivity Status Index (CSI) for the quantitative assessment of river connectivity at multiple scales [21]. CSI has been successfully applied globally to track connectivity across 12 million kilometres of rivers and provide baselines for restoration planning and monitoring [22]. These large-scale assessments typically utilise 500 m to 1 km resolution data, and, therefore, are not suitable for detecting connectivity patterns in small urban rivers [23].
The advent of UAVs, coupled with Structure-from-Motion (SfM) photogrammetry, has transformed small river assessment capabilities [24]. Recent studies have demonstrated that UAVs can achieve sub-centimetre-level spatial resolution for the comprehensive assessment of small rivers [24]. The precise mapping of channel widths as narrow as 1 m, the identification of individual encroachments, and a detailed characterisation of riparian zones are thus possible. The Sakri River study in Central India used UAV surveys to identify 0.5 million m3 of accumulated sediments across 50 km of river length [25]. Studies of the Bellamy River demonstrate that UAV-based approaches provide 83–100% classification accuracy for vegetation mapping and can detect geomorphic changes that conventional ground-based methods miss entirely [26].
The degradation of urban rivers under anthropogenic pressures represents a global phenomenon that has been extensively documented across diverse geographical contexts. However, the literature reveals that existing restoration approaches have primarily focused on large river systems. Global restoration approaches increasingly emphasise process-based understanding over form-focused interventions [27]. The Panke River restoration in Berlin exemplifies successful urban river restoration, where staged interventions between 1985 and 1995 improved water quality from Class IV to Class II [28,29].
This study undertakes the degradation of the Assi River, a small tributary of the River Ganga. The Ganga is considered the holiest of all rivers in India, where people take a holy bath. The degradation of the Assi River is not an isolated case, but rather representative of the crisis facing small urban rivers across South Asia. Severe pollution from domestic sewage and physical constriction due to urban encroachment mirror the challenges faced by waterways in rapidly urbanising regions across the subcontinent. For instance, similar patterns of degradation are seen in the Mithi River in Mumbai [30,31], Cooum River in Chennai [32], Buriganga River in Dhaka [33,34,35], Bagmati River in Kathmandu [36,37,38], all of which have been reduced to little more than open drains carrying untreated waste.
The study aims to contribute to the broader understanding of urban river management and restoration. The research undertakes the first high-resolution UAV-based connectivity analysis for the Assi River, establishing both methodological innovations and quantitative baselines essential for evidence-based restoration planning in urbanising regions. In this context the objectives of this study are to: (1) assess the condition of connectivity using high-resolution UAV imagery; (2) identify critical stretches requiring intervention; (3) propose targeted restoration strategies to improve the connectivity of the river system, and (4) analyse quality parameters to evaluate the bathing quality of water and ecological state of the river.

2. Materials and Methods

2.1. The Study Area

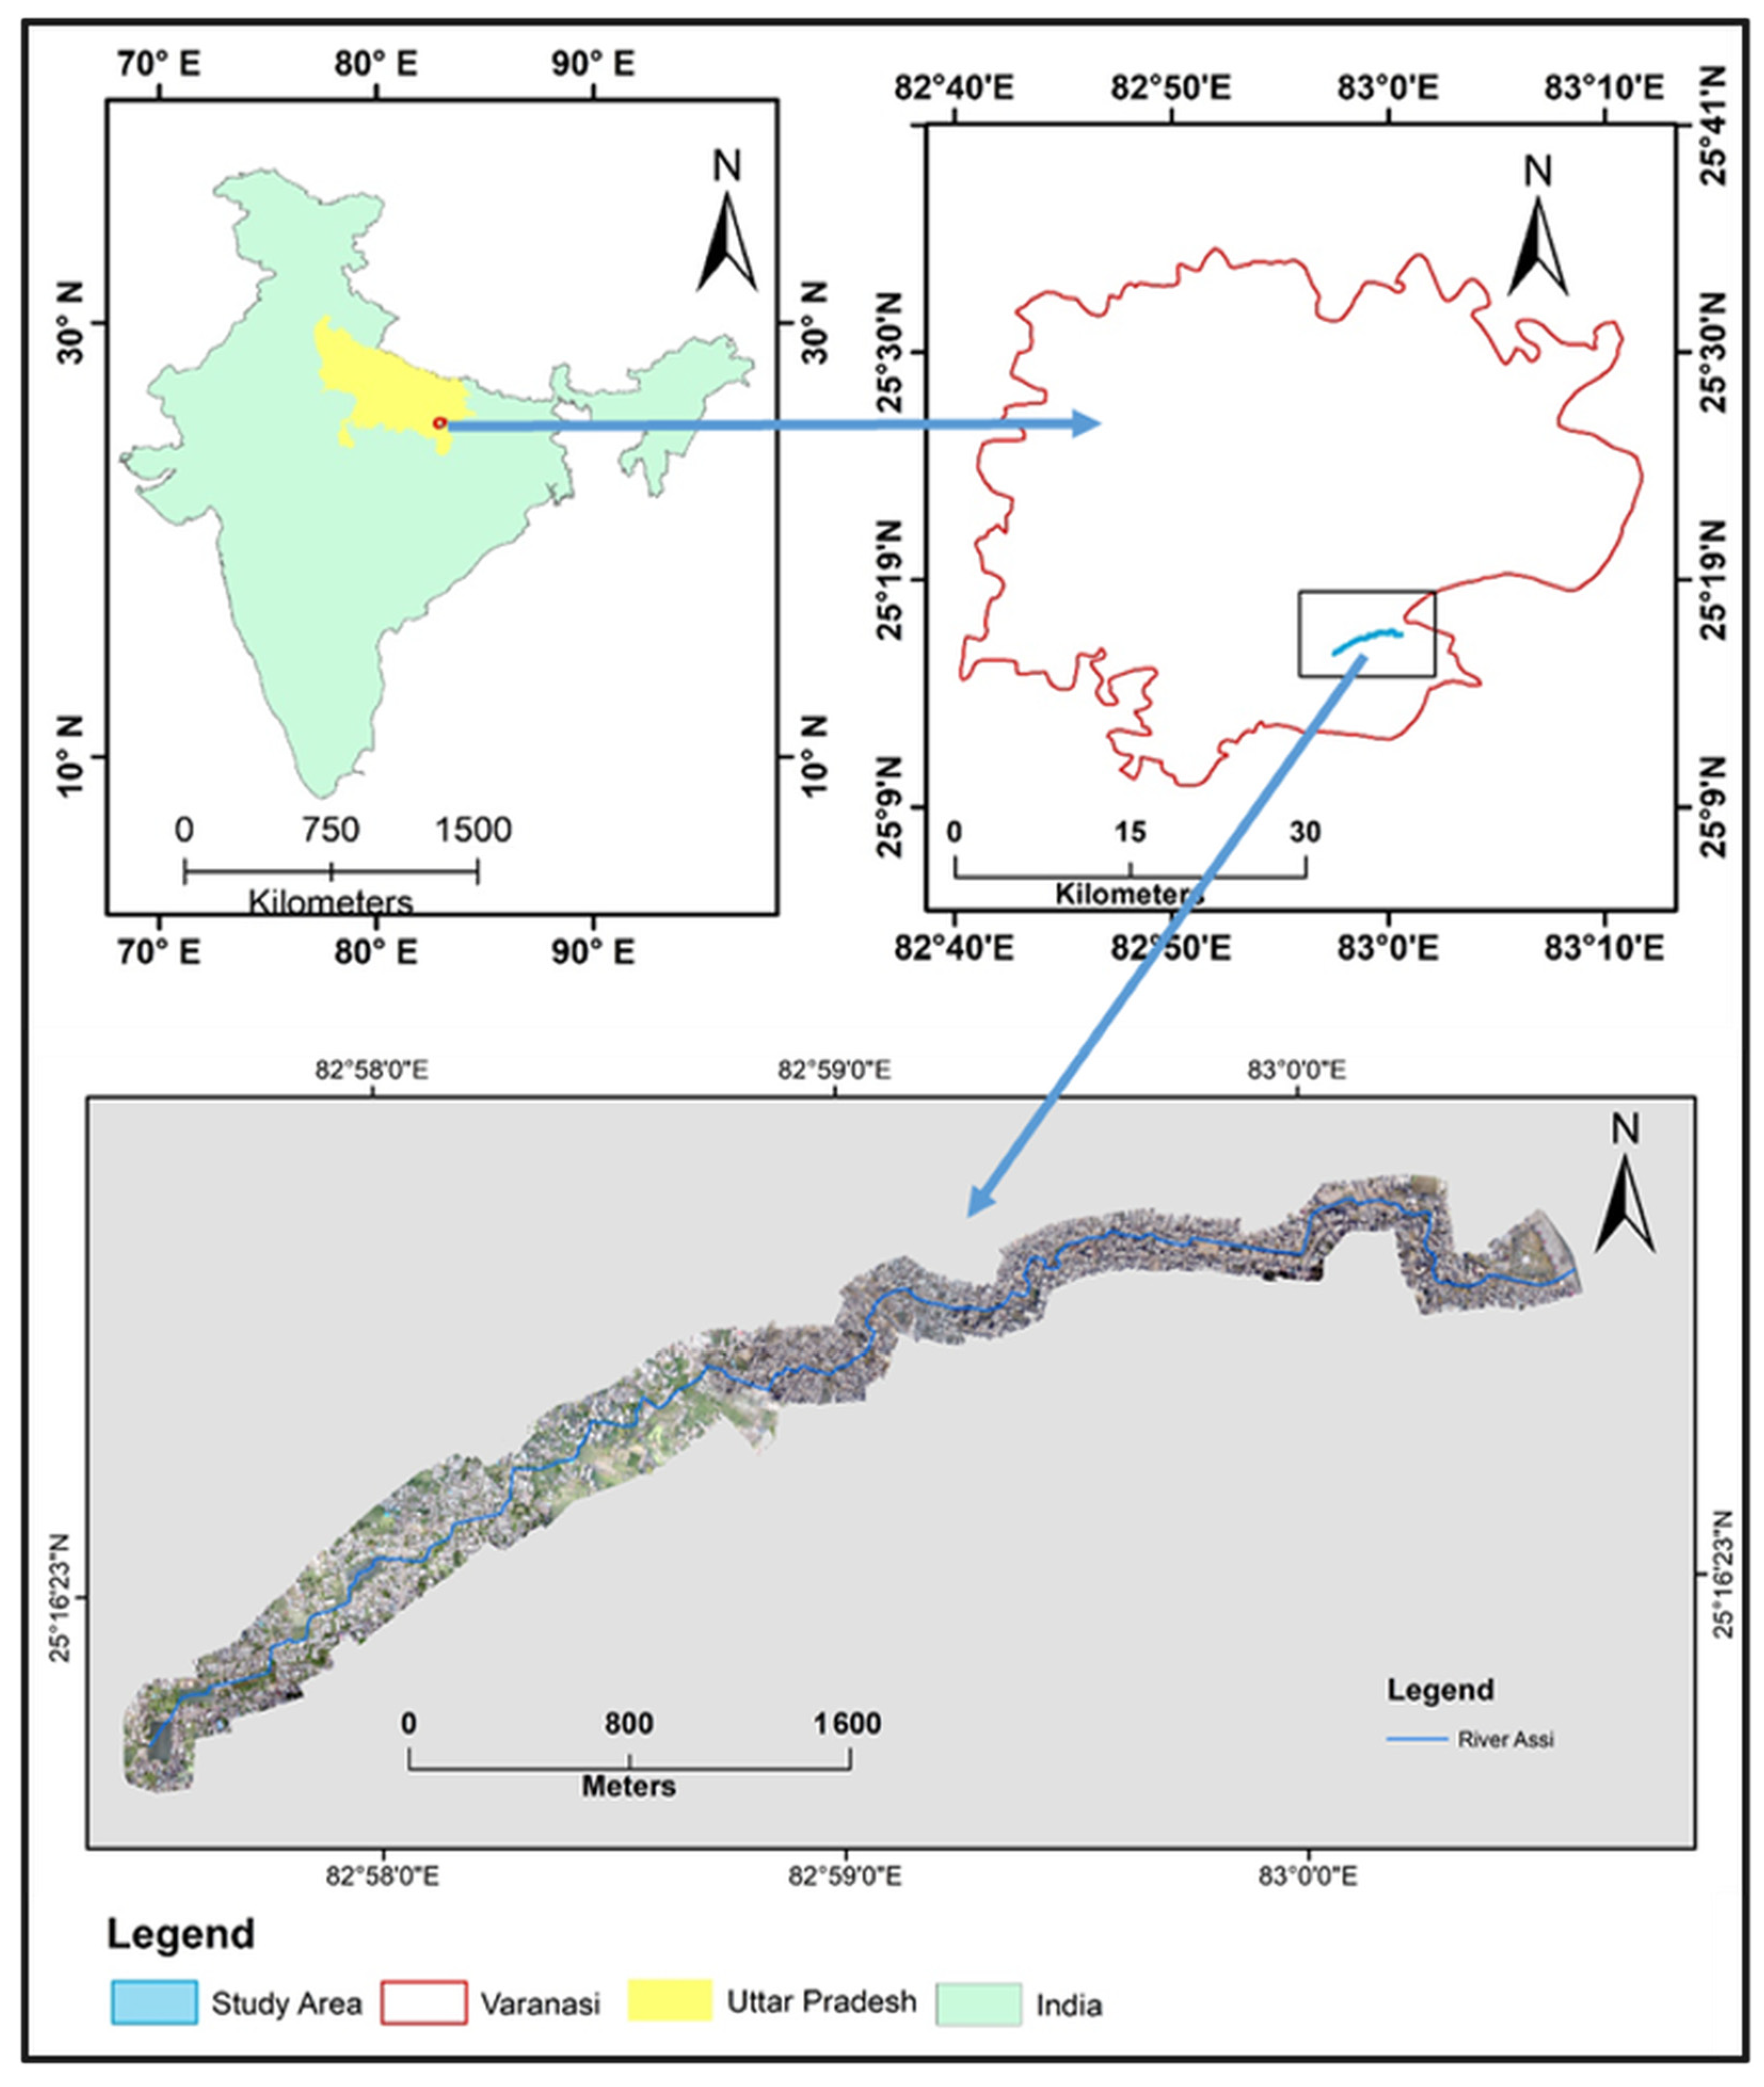
The Assi River, a minor tributary of the Ganga River, due to urban expansion, has been transformed into a sewage drainage channel within Varanasi City (Figure 2) and is facing a threat to its existence [39]. The total length of the studied river stretch is ~7 km, located between latitudes 25.25° and 25.31° E and longitudes 82.95° and 83.01° N.

2.2. Data Collection

The data collection process was divided into three key components for environmental assessment and analysis (Figure 3): UAV-based mapping, groundwater table (GWT) monitoring across the catchment area, and water quality sampling along the Assi River. Existing open wells within the catchment were identified and geolocated using Differential Global Positioning System (DGPS) for spatial accuracy. The depth to the water table was measured manually using an electric water level indicator, with measurements taken directly from the ground. Observations were conducted during pre-monsoon (May 2024) and post-monsoon (August 2024) periods to capture seasonal variations. The bottom elevation of the river channel was also collected using DGPS. GWT elevations were interpolated using kriging in QGIS 3.36. UAV data collection involves capturing high-resolution aerial imagery. Water quality data collection focuses on sampling and analysing the river’s various physicochemical, nutrient and biological parameters to assess pollution levels and monitor overall aquatic health., Water table data are measured through field surveys and well monitoring, which track groundwater levels.

2.2.1. UAV Data Collection

A UAV flight campaign was designed to cover various sections of the area of interest, requiring visibility and a continuous connection to the controller. The UAV selected was the DJI Phantom 4 Pro (SZ DJI Technology Co., Ltd., Shenzhen, China), due to its sturdy magnesium alloy structure, which ensures stability and minimal vibration, along with an integrated 3-axis gimbal.
The UAV could fly for up to 28 min within a 5 km range and capture high-resolution photos at 12.4 megapixels. Different flight altitudes were tested to strike a balance between image quality and survey speed. Finally, an altitude of 90 m was found to be optimal for achieving a ground resolution of 0.025 m per pixel. Flight planning aimed for high image overlap, which was achieved by controlling forward speed (frontal overlap) and flight transect width (lateral overlap). A total of 2385 images were captured. The first step involved fine-tuning the UAV system by comparing field measurements with remote sensing data. Occasionally, there were disconnections between the drone and the controller, requiring reconnection. Flight planning was conducted using Pix4D Capture (version 4.11.0) software installed on an Android 11 (Redmi 10 Prime) mobile phone. The raw imagery was processed using Pix4D Mapper 4.1.2, employing a Structure-from-Motion (SfM) photogrammetric workflow to generate orthomosaics and digital surface models (DSMs). Field-collected DGPS points were used to georeference the UAV data, ensuring geospatial accuracy.
The initial processing used the “3D Maps” template with a custom key point image to efficiently handle the large number of images (2385 total). Challenges such as occlusion were addressed by flying with high image overlap (85% longitudinal, 75% lateral) and using oblique camera angles where necessary, for reconstructing narrow corridors. The impact of shadows was minimised by conducting flights under clear sky conditions to eliminate the effects of shadows. Reflective water surfaces presented the most significant challenge, and their effects were mitigated by relying on stable surrounding land features and conducting manual inspections to ensure the integrity of the generated model.
36 DGPS points data were collected; 28 were utilised as Ground Control Points (GCPs) for georeferencing. and the 7 data points were used as independent Check Points (CPs) to validate the horizontal accuracy, leading to a root mean square error (RMSE) of ≤6 cm. The vertical accuracy of the DSM was cross verified against field elevation profiles, yielding an RMSE of ≤10 cm. All geospatial analyses, including land use classification and river width extraction, were performed in QGIS 3.28 using validated orthophotos and elevation datasets. To quantify the physical constriction of the Assi River, bank-line detection and vectorisation were performed manually using a digitisation process, while the centerline was created using a medial axis transformation of the vectorised river polygon. Perpendicular transects were then generated at regular intervals (10 m) along the entire centreline to measure the river’s width.
The buffer zones (both banks) of 3 m, 5 m, 10 m, 15 m, 20 m, and 30 m were selected for two primary reasons. First, the 15 m buffer serves as a critical, policy-relevant benchmark, aligning with a common standard for riparian buffers in the Urban River Management Plan [40], such as those recommended for the Ganga River basin. Second, the series of smaller, incremental buffers (3 m to 10 m) was chosen to provide a granular, multi-scale analysis of urban encroachment. This approach enables us to quantify precisely how the degree of encroachment intensifies at different distances from the river channel, providing high-resolution insight into the progressive loss of lateral connectivity.

2.2.2. Water Sampling and Testing

Sampling sites (based on land use patterns, accessibility considerations, and key pollution sources) were selected along the river’s stretch to assess water quality. These samples were collected in the post-monsoon season (October 2022), a period typically characterised by reduced river flow and elevated pollutant concentrations due to limited dilution capacity. Future multi-seasonal sampling campaigns will be crucial for understanding temporal variability in water quality, providing a more comprehensive long-term ecological profile of the river and informing adaptive management strategies. Sampling, preserving, and transporting the water samples to the laboratory were performed using standard methods [41]. All instruments were calibrated using standard solutions before each use, in accordance with the manufacturer’s instructions. Composite Sampling was performed at each site. Samples were qualitatively analysed for different physicochemical and microbiological parameters. The pH, temperature, electrical conductivity (EC), Total Dissolved Solid (TDS), Ammoniacal Nitrogen (NH4-N) and Nitrate Nitrogen (NO3-N) and dissolved oxygen (DO) were determined immediately at the collection site by a portable multi-parameter sonde (EXO 2), to minimise errors with time due to biological and chemical reactions between the atmosphere and the sample. Laboratory analyses were conducted for other parameters, including turbidity, biochemical oxygen demand (BOD), chemical oxygen demand (COD), total coliforms, faecal coliforms, and total phosphorus, following the guidelines of [40]. Heavy metals, including cadmium (Cd), mercury (Hg), nickel (Ni), chromium (Cr), lead (Pb), and arsenic (As), were determined using a flame atomic absorption spectrometer (AAS4141, ECIL, Hyderabad, India), following standard procedures [42]. QA/QC procedures and acceptance criteria, as well as all corrective actions and documentation of deviations, are to be followed as outlined in [41]. Potential biases in our methods include limitations of UAV imagery (e.g., lighting affecting land use classification near nallas, with an RMSE of ≤6 cm), risks of GIS misclassification, and constraints on water quality sampling due to accessibility and the single-season (October 2022) data.
Although the surface-water data (2022) and groundwater observations (2024) were collected in different years, we have still performed our analyses with their integration because the Assi River functions as a highly urbanised channel whose pollutant loads are controlled by persistent anthropogenic sources rather than natural variability [43,44,45]. The Assi River lies within an alluvial aquifer system, where groundwater levels typically exhibit limited interannual fluctuation [46,47,48]. This stability makes the groundwater table (2024) representative for assessing vertical hydraulic gradients, even when paired with surface-water quality data from 2022. We acknowledge this temporal mismatch and recommend future synchronised multi-season monitoring.

3. Results

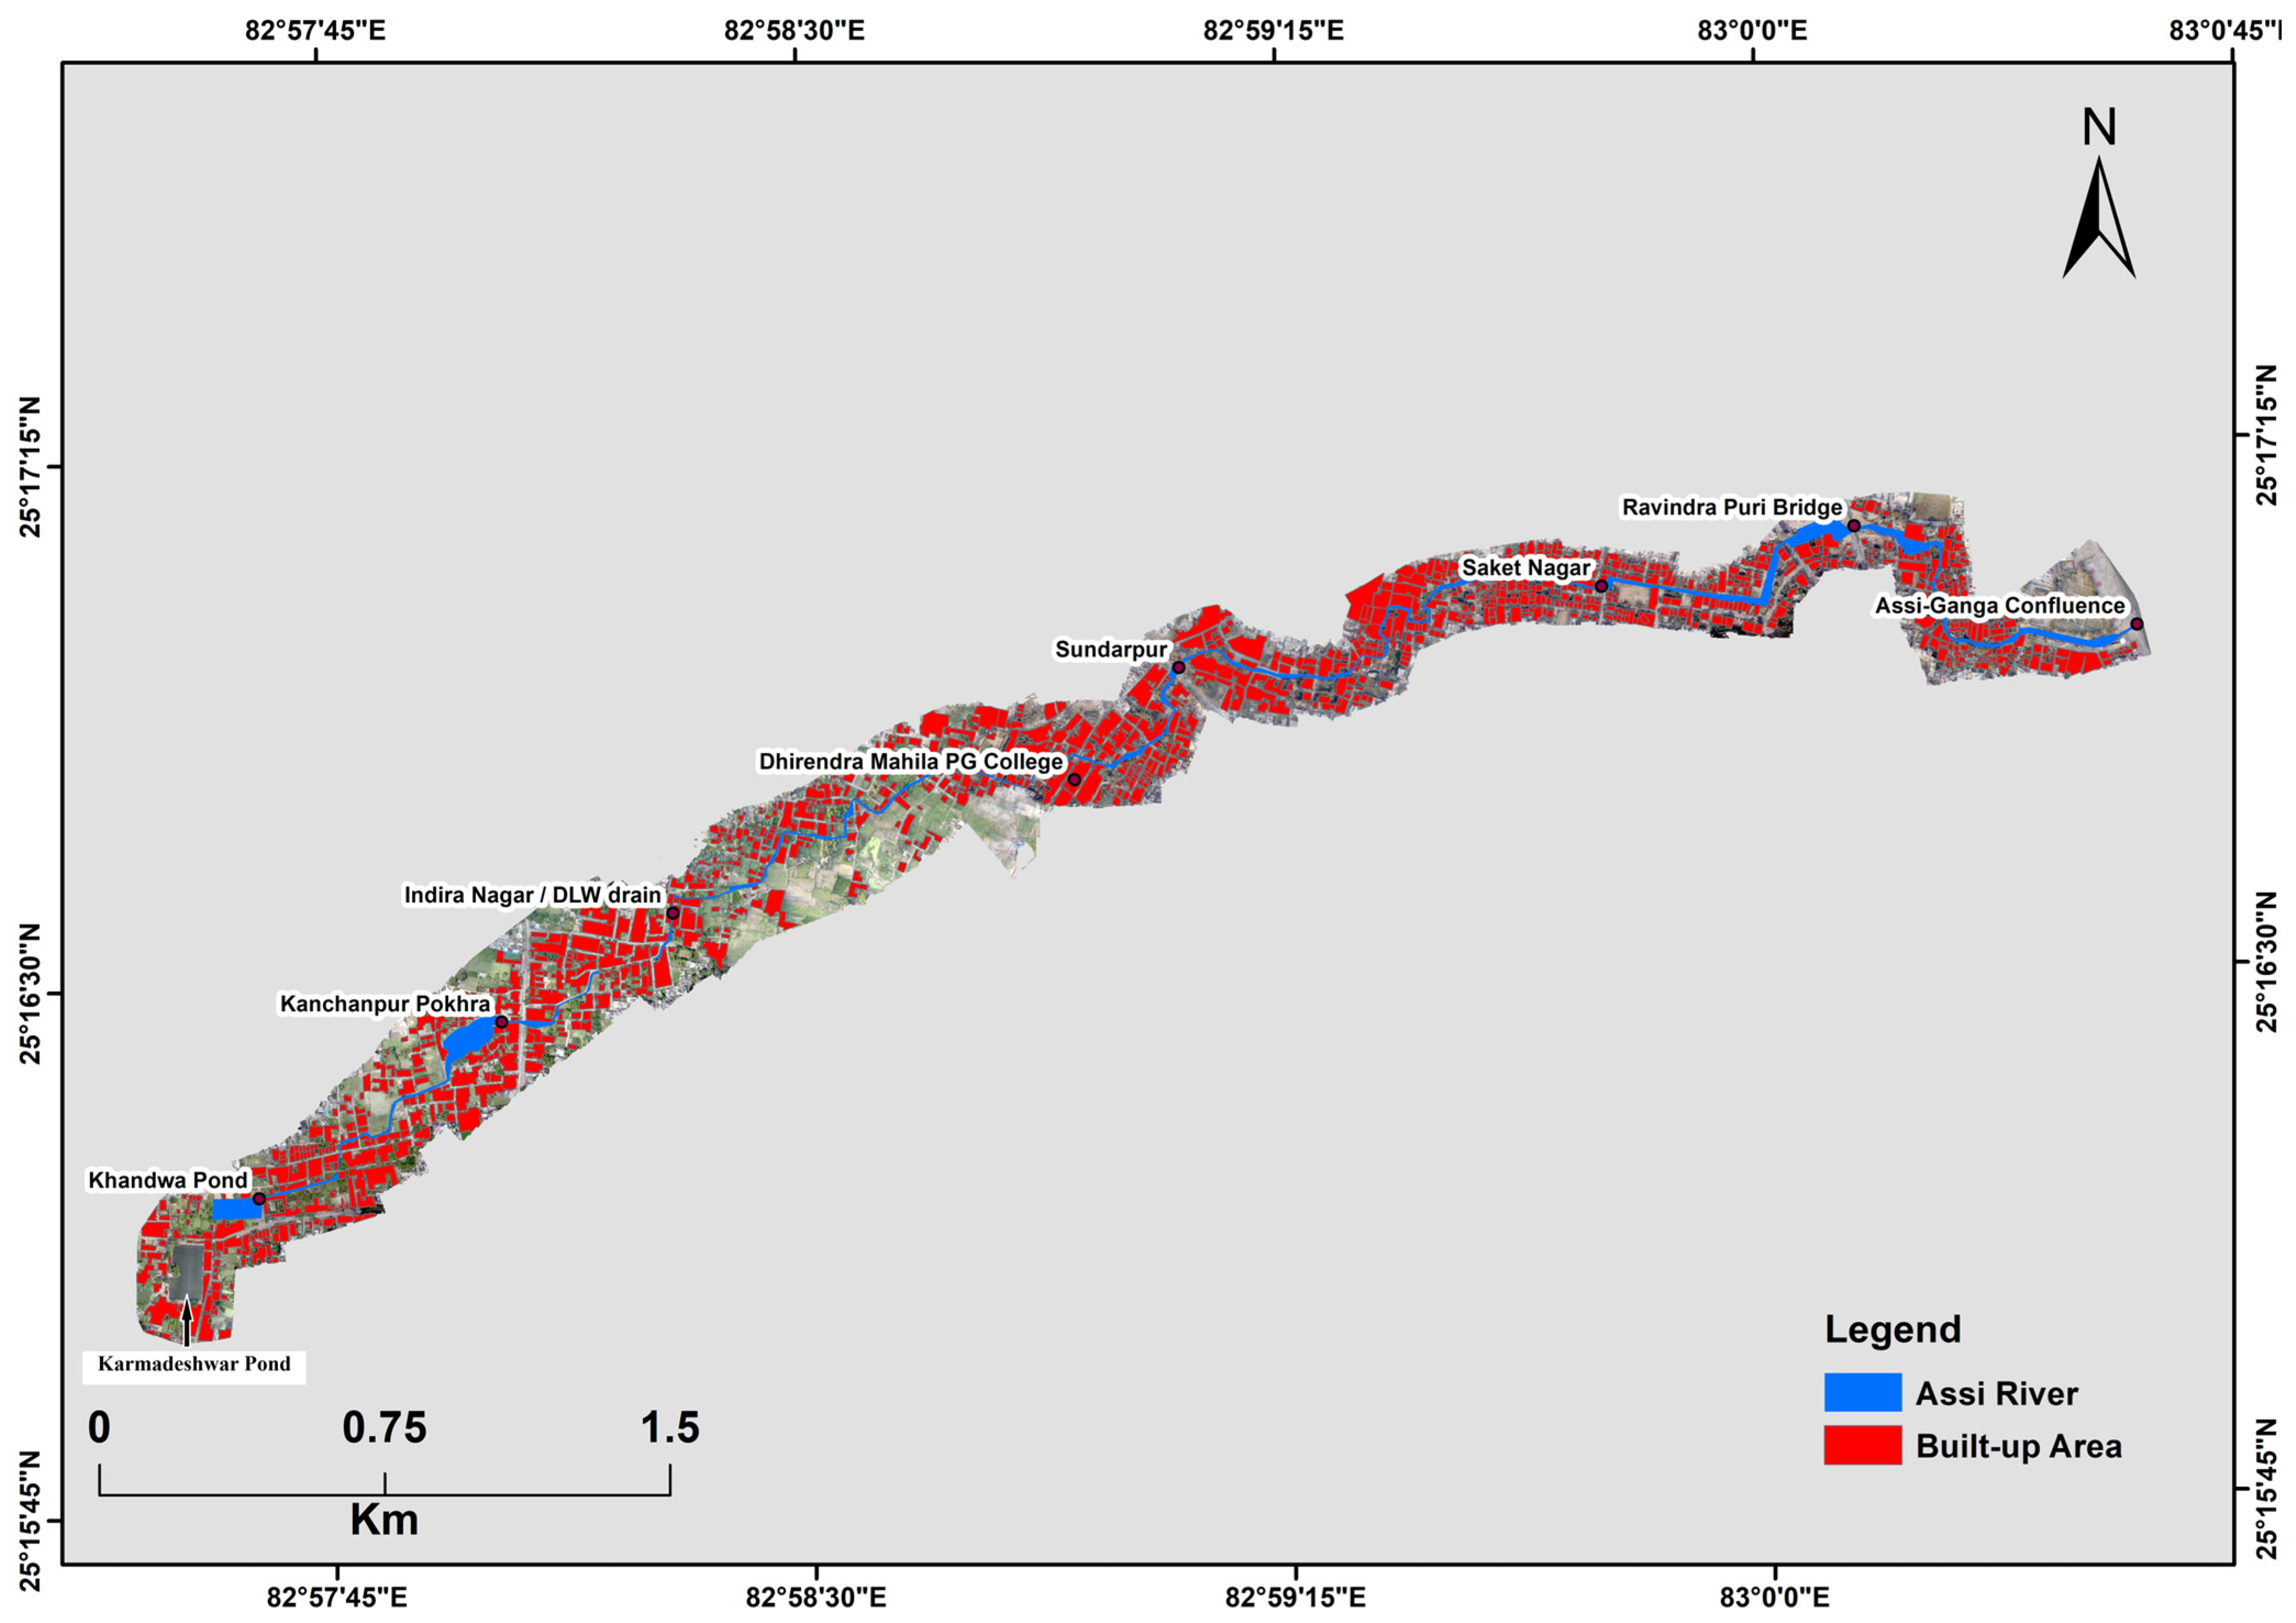
The journey of the Assi River through Varanasi has undergone significant changes over time. While historical texts describe it as a substantial river, its origin has been identified today as Khandwa, a pond located near Kardmeshwar Mahadev Inter College in Kandwa (Figure 4). Upstream from this point, the river ceases to exist and becomes untraceable in areas near Kandwa Road in the Awleshpur area. From its origin at Khandwa Pokhri, the river flows through Kanchanpur Pokhra and enters Indira Nagar after crossing Chunar Road. An open drain from the BLW (Banaras Locomotive Works) area joins the river, bringing wastewater from Indira Nagar Colony and Newada. The river continues through the area surrounding Dhirendra Mahila PG College and Indira Nagar. Moving downstream, it crosses Sundarpur Chauraha and winds through densely populated areas, including Naria Road, Tagore Road, Tilak Road, and Gandhi Nagar Road, until it reaches Saket Nagar. This 1.4 km stretch receives additional wastewater from another significant drain, located near Sundarpur Sabzimandi, at DLW. From Saket Nagar, the river flows through Durgakund Road near Sankat Mochan Crossing, then under the Ravindra Puri Road bridge. The river then continues toward Nagwa Road through the Sahoday Veer Bridge on the Assi-Lanka Road. In its final stretch, the river is diverted through Nagwa ward, also known as Nagwa Drain near Sant Ravidas Park. Finally, it meets the Ganges behind Ravidas Ghat Park, approximately 770 m upstream from its original confluence point at Assi Ghat. [49] reported the average daily flow of 62.07–65.19 MLD through the channel of the river Assi near Nagwa and the highest flow rate varying from 1.26 m3/s (108.86 MLD) to 1.42 m3/s (122.86 MLD) during January 2010. The temperature in the region varies significantly, ranging from a minimum of 1.7 °C to a maximum of 47.2 °C. The area receives an average annual rainfall of 1113 mm, mainly during the monsoon months from July to September.

3.1. Spatial Distribution of Encroachment

Table 1 shows the land use patterns along the river, showing encroachment within the immediate 5 m buffer zone on both sides of the river. Built-up areas account for 5566 m2. This encroachment increases significantly as the buffer zone expands, with built-up areas increasing to 25,240 m2 at 10 m, 82,303 m2 at 20 m, and 137,580 m2 at the 30 m buffer zone. The progression illustrates the severe urbanisation pressure on the river corridor, drastically reducing permeable surfaces and affecting the river’s connectivity (Figure 4).

3.2. Stretch-Specific Encroachment Analysis

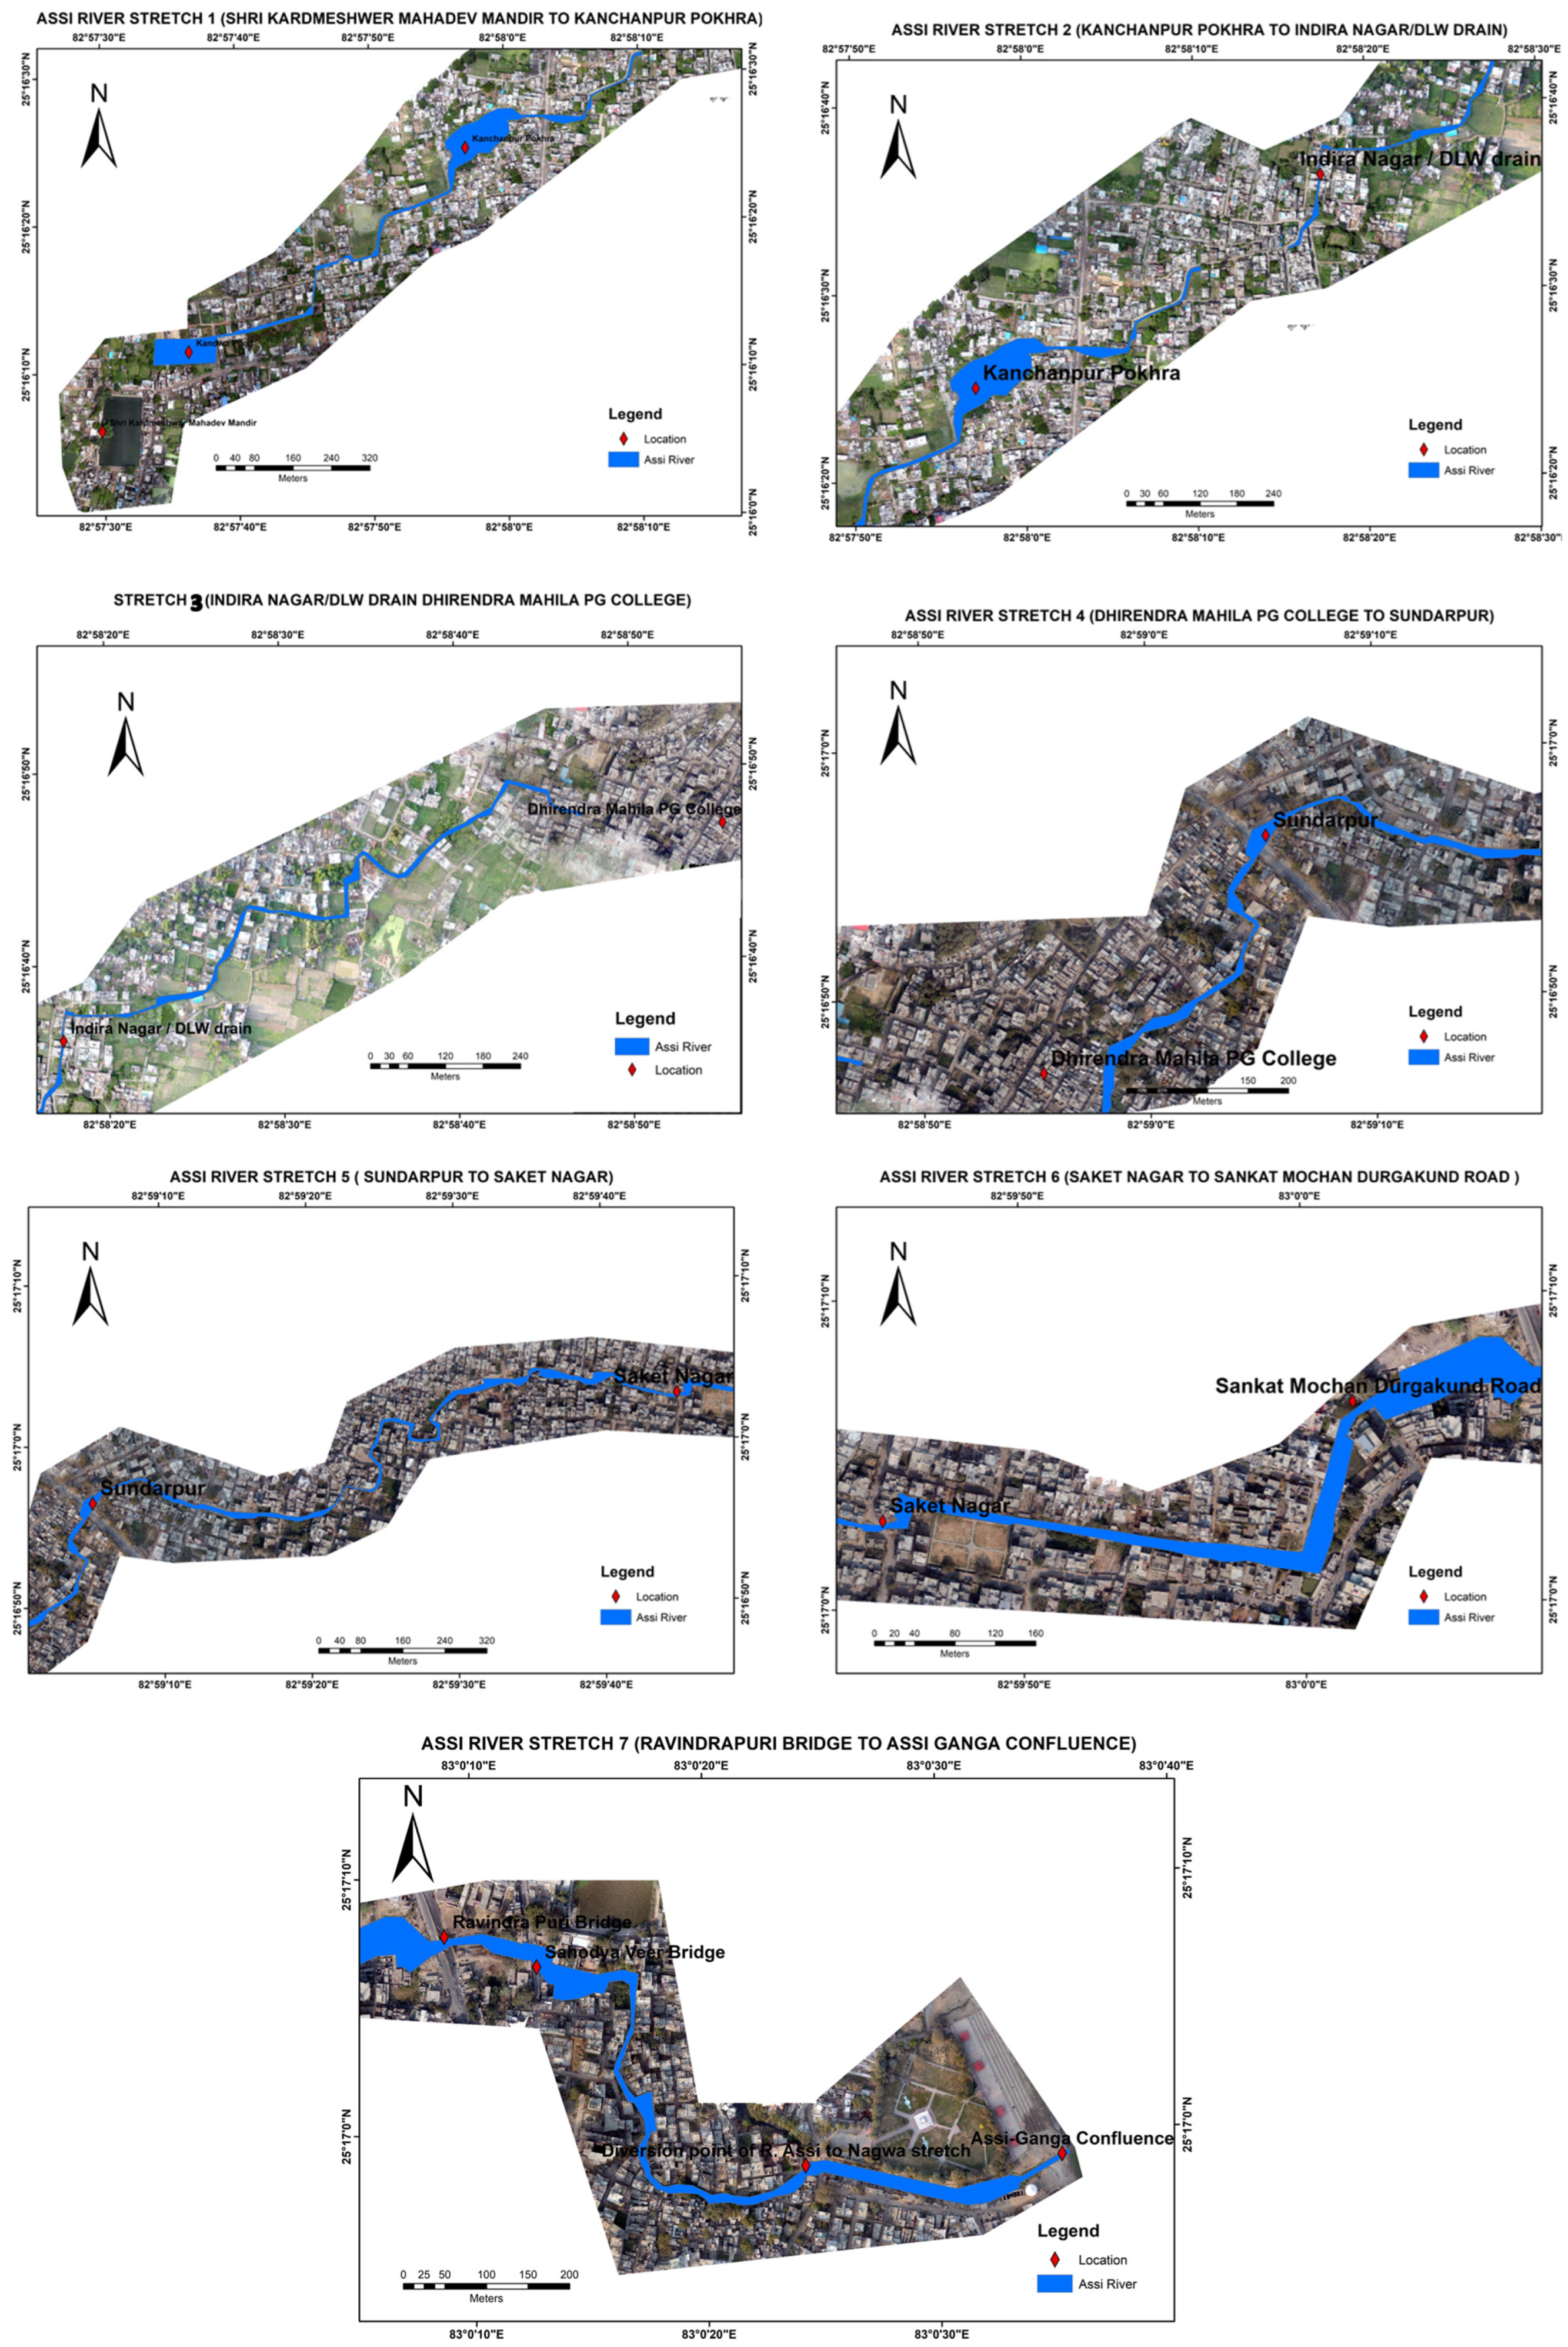
The ortho-photo and DSM have a horizontal accuracy of <6 cm. The degree of encroachment varies significantly across the seven defined stretches of the Assi River (Figure 5). Stretch 2 exhibits the most severe encroachment, with 71.02 m2 per 100 m within the 3 m buffer, increasing dramatically to 2866.82 m2 per 100 m at the 30 m buffer (Table 2). This represents the highest encroachment density among all stretches and correlates with the narrowest river width (1–18 m) observed in this stretch (Table 3).
Stretch 5 shows the second-highest encroachment density with 2733.17 m2 per 100 m at the 30 m buffer. Interestingly, stretches 6 and 7, closer to the confluence with the Ganges, show relatively lower encroachment within the immediate riverside zones (3 m and 5 m buffers) (Table 2). Stretches 2 and 3 exhibit the narrowest widths (as low as 1 m in places) and show some of the highest encroachment pressures (Table 3). This pattern suggests that encroachment has physically constrained the river channel, reduced its natural width and impacted flow dynamics and self-purification capacity.

3.3. Physicochemical Parameters Analysis

Table 4 shows the water quality data across all stretches of the Assi River. The Central Pollution Control Board (CPCB) specifies the primary water quality criteria for bathing in India and sets limits for faecal coliform (≤2500 MPN/100 mL), pH (6.5–8.5), dissolved oxygen (≥5 mg/L), and Biochemical Oxygen Demand (BOD) (≤3 mg/L). It can be observed that values for these parameters far exceed the safety standards. The headwaters at Kardmeshwer pond show marginally better quality than the downstream stretches, but still fail to meet bathing standards.
DO, a critical indicator of river health, shows alarming depletion throughout the river system. The highest recorded value in the river proper is merely 1.0 mg/L in Stretch 1, declining further to just 0.2 mg/L at Stretch 7 near the Ganges confluence. These values are significantly lower than the 5 mg/L minimum required for meeting bathing standards. This hypoxic condition indicates a severely stressed aquatic ecosystem incapable of supporting diverse aquatic life.
BOD values range from 48 mg/L to 126 mg/L across the stretches, exponentially higher than the ≤3 mg/L standard for bathing waters. Stretch 7 exhibits the highest BOD (126 mg/L), indicating extreme organic pollution near the confluence with the Ganges. This suggests that the Assi River contributes significantly to the pollution load of the Ganges at Varanasi, undermining broader Ganga rejuvenation efforts.
The conductivity measurements (934 to 1117 µS/cm) and Total Dissolved Solid (TDS) values (618–738 mg/L) further confirm the high concentration of dissolved substances, likely from sewage and urban runoff. Turbidity values (36.5–71.5 NTU) indicate substantial suspended particulate matter throughout the river system, with the highest values observed in the lower stretches. The water quality results presented in this study were obtained during the post-monsoon season (October 2022), a period typically characterised by reduced river flow and elevated pollutant concentrations due to limited dilution capacity. This season also follows peak rainfall months (July–September), during which surface runoff may transport large loads of nutrients and organic matter into the river, influencing downstream accumulation.

3.4. Nutrient, Bacterial & Heavy Metal Contamination

Table 4 shows the contamination level of all pollutants. Nutrient parameters reveal excessive inputs of nitrogen and phosphorus compounds. NH4-N ranges from 6.3 to 14.1 mg/L, while NO3-N ranges from 34.3 to 63 mg/L, with consistently increasing trends moving downstream. Total phosphorus (TP) ranges from 2.2 to 6.1 mg/L. These elevated nutrient levels indicate significant sewage inputs and likely contribute to eutrophication processes within the river system [50,51].
The most alarming indicators are the bacterial contamination parameters. Total coliform counts range from 2.2 × 10⁷ to 3.6 × 10⁸ MPN/100 mL, while faecal coliform counts range from 3.5 × 10⁶ to 2.1 × 10⁸ MPN/100 mL. These values exceed the CPCB bathing standards (desirable: 500 MPN/100 mL; maximum permissible: 2500 MPN/100 mL) by four to five orders of magnitude. Stretch 7 shows the highest bacterial contamination, indicating the cumulative effects of pollution as the river approaches its confluence with the Ganges.
The UAV imagery reveals no prominent agricultural or industrial sources within the studied buffer zone along the river stretch. Heavy metals (Cd, Hg, Ni, Cr, Pb and As) were below detection limits (BDL) across all stretches. The high faecal coliform counts, in the absence of heavy metals, indicate the most probable cause of pollution is the domestic sewage along this urbanised stretch. These findings are consistent with the observations reported in earlier studies performed on the Assi River [44,45]. Assi River exhibits stable inter-annual water-quality patterns due to its flow being dominated by continuous anthropogenic discharge rather than natural hydrological variation [44,45]. No new STPs, drain diversions, or pollution control measures were introduced at the confluence during the study period.

Study of Ponds in and Around the Catchment Area of the Assi River

Table 5 provides a detailed overview of the ponds and key parameters. These are critical for understanding the hydrological behaviour of the ponds and their role in improving the groundwater recharge in the area. The most extensive ponds include Kardhmeshwar Pond (13,828 m2) and Nagawa Pond 2 (13,466 m2) are two large ponds in terms of surface area. Amara Pond P2 is the smallest, with a surface area of only 561 m2 and has the smallest storage capacity, 505 m3. Whereas Pushkar Talab and Kurukshetra Pond have the highest water storage capacity at 47,601 m3 and 36,155 m3, respectively. These large storage capacities offer significant opportunities for water retention and flow regulation.
The difference between the pond bottom elevation and the GWT is a critical measure of the pond’s potential for groundwater recharge and its ability to retain water. Kardhmeshwar Pond (−0.54 m), Bhikharipur Pond 1 (−1.44 m), Nagawa Pond 1 (−2.06 m), Nagawa Pond 2 (−2.13 m), Durga Kund (−4.96 m), Kurukshetra Pond (−2.87 m), and Pushkar Talab (−4.73 m) show negative differences (Pongalpur Village Pond (3.62 m), Nevada Pond (3.43 m), and Amara Pond P5 (2.18 m) show a positive difference, indicating a gap between the GWT and the pond bottom. These ponds may require artificial recharge, and dredging could be performed in them to store more water and recharge the groundwater in the catchment area.
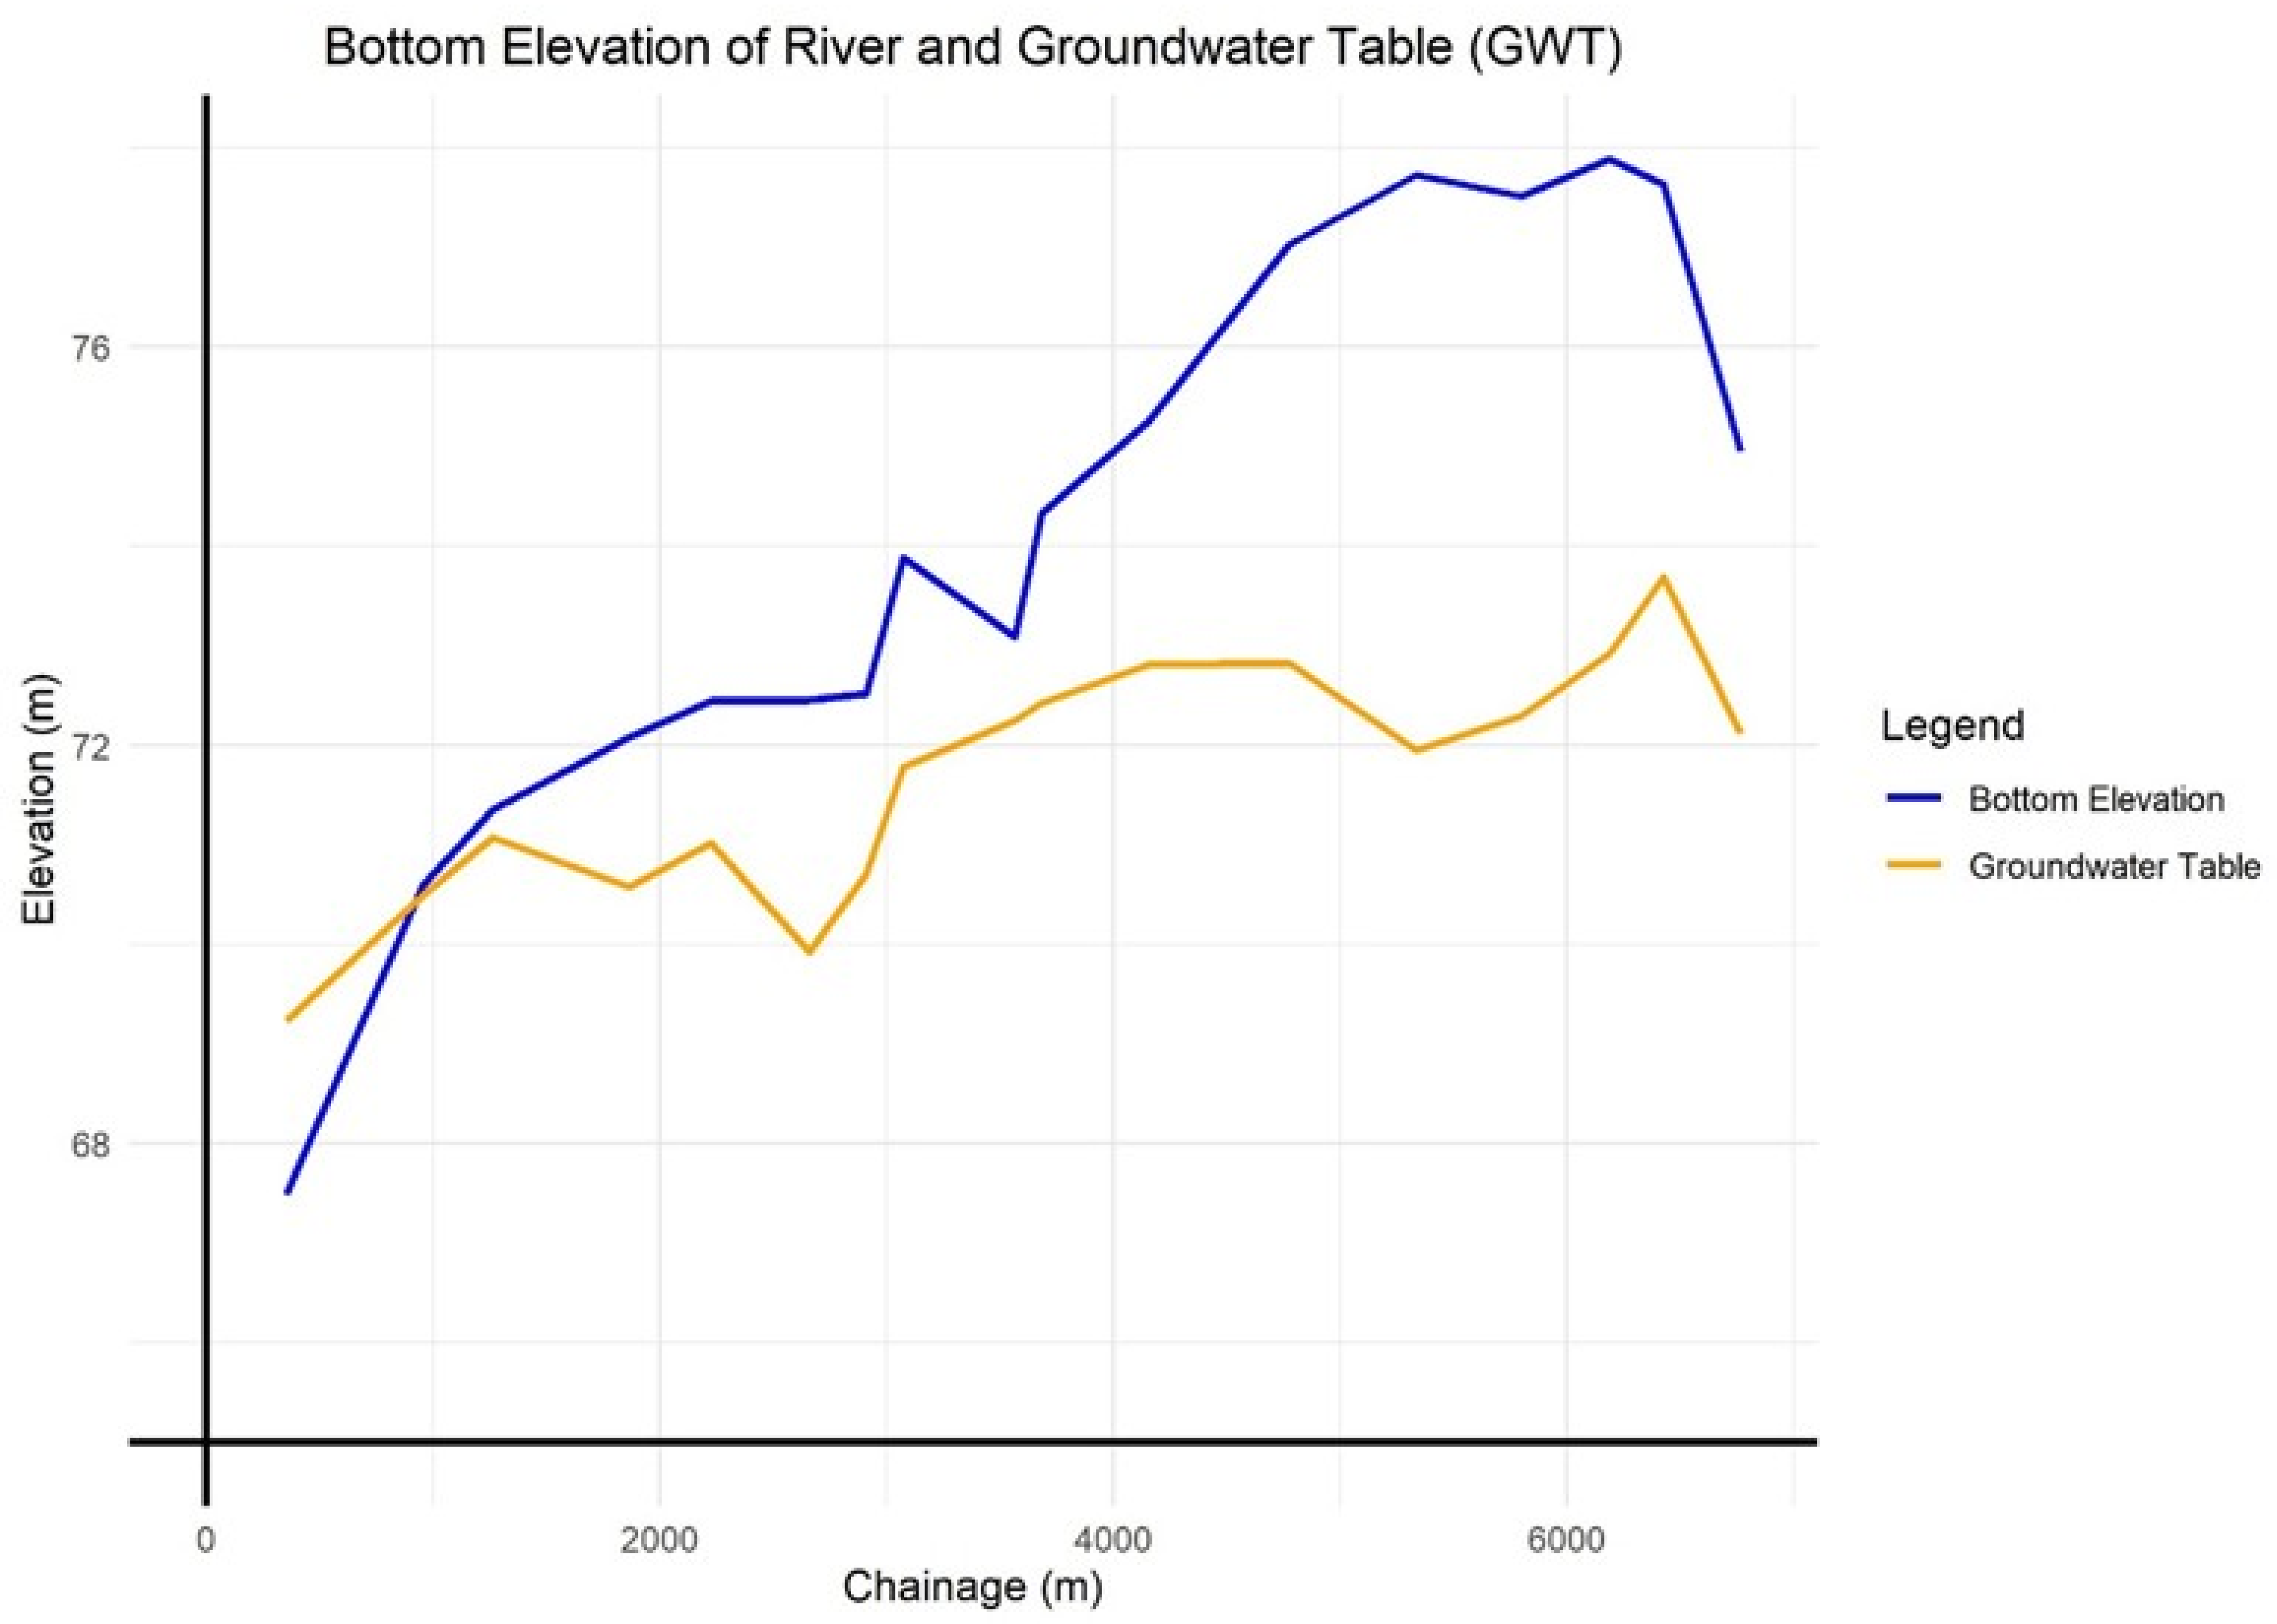
The bottom elevation of the river varies from 67.49 m (at the confluence with the River Ganga) to 77.89 m (effluent of Kandwa pond), with a mean of approximately 74.01 m (Figure 6). The water table across these points varies from 69.23 m to 73.69 m, with an average of 71.65 m above mean sea level in May and August 2024. In the upstream area near Kandwa Pond, the GWT is above the riverbed elevation, indicating a positive potential for establishing vertical connectivity between the river and the underlying aquifer.

3.5. Longitudinal and Lateral Disconnection

Buffer zone analysis in the study area shows a catastrophic loss of lateral connectivity. Table 1 shows that built-up areas of 5 m and 30 m in the buffer zone result in the elimination of natural riparian zones of 5566 m2 and 137,580 m2, respectively. Intact floodplains, as emphasised by [2] retain 50–60% of sediment and nutrients through overbank flows. Due to channelised stretches, the Assi River has lost its self-cleansing and sediment retention capacity.
Figure 7A illustrates where the Assi River meets the Ganga River. Figure 7B depicts the state of the Assi River near the Ravindrapuri Bridge. Figure 7C shows a heavily modified area in Saket Nagar, heavily influenced by human activities. Figure 7D illustrates the condition of the Assi River near Sundarpur. Figure 7E reveals a highly modified area, showing that Assi is almost invisible near Indra Nagar. The Assi River exhibits severe longitudinal fragmentation due to urban encroachment at two critical points: Kardmeshwer Kund, the river’s origin (Figure 7G), and downstream of Kanchanpur Pokhra (Figure 7H). Kardmeshwer Kund serves as a consistent water source with proper groundwater linkage. UAV mapping revealed channel narrowing to widths of 1–18 m in stretch 2. In the upstream area, GWT lies 0.54–4.96 m above the riverbed (e.g., Kardhmeshwar Pond). GWT is 1.74–5.78 m below the riverbed, showing the vertical disconnection and affecting hyporheic exchange in the downstream portion of the river.

4. Discussion

4.1. Restoration Strategies: Reconnecting the River

River width is a critical factor in maintaining longitudinal connectivity. When a river becomes too narrow, its capacity to carry water and sediment is reduced. An increase in the flow velocity causes erosion. The physical fragmentation and channel constriction obstruct the movement of aquatic organisms, such as fish and macroinvertebrates [52,53]. The elimination of the riparian zone disconnects the river from its natural flood plain, which is essential for fish spawning, feeding, and refuge [53,54]. In the case of the Assi River, urban encroachment and sedimentation have significantly reduced the width of many sections, contributing to disconnection issues. Evidence suggests the historical Assi originated near Durvasha Rishi Ashram in Allahabad and traversed approximately 120 km before joining the Ganga in Varanasi [46]. Reconnecting the paleochannel of the Assi River represents a fundamental step in restoring its longitudinal connectivity. The Assi can be revitalised through systematic paleochannel reconnection, targeted interventions at disconnection points, and restoration of adequate river width.
The results underscore the critical need for the restoration of riparian zones. The riparian zone, the transitional area between terrestrial and aquatic ecosystems, emerges as a critical component of riverine environments [55]. It serves as a buffer, a corridor of biodiversity, and a guardian of water quality [56]. The delicate balance of this zone has come under immense pressure in recent times, especially in the context of small rivers [57]. Riparian buffers are indispensable for mitigating urban impacts, stabilising stream banks, and enhancing water quality [58]. Implementing vegetation-based buffers along the riverbanks could provide multiple ecosystem services [59], including pollutant filtration [56], erosion control [57], and biodiversity conservation [60]. Case studies from similar urban river restoration efforts globally suggest that creating multi-zonal riparian buffers could effectively balance urban development with ecological integrity.
The US EPA suggests a straightforward approach for developing riparian zones, which has been successfully adopted in various parts of the world. This method involves dividing the buffer width (approximately 15 m) into two equal zones: a streamside zone (immediately adjacent to the river) and an outer zone (bordering the urban area) (Figure 8). It can restore natural interactions between rivers and adjacent landscapes by improving the lateral connectivity.
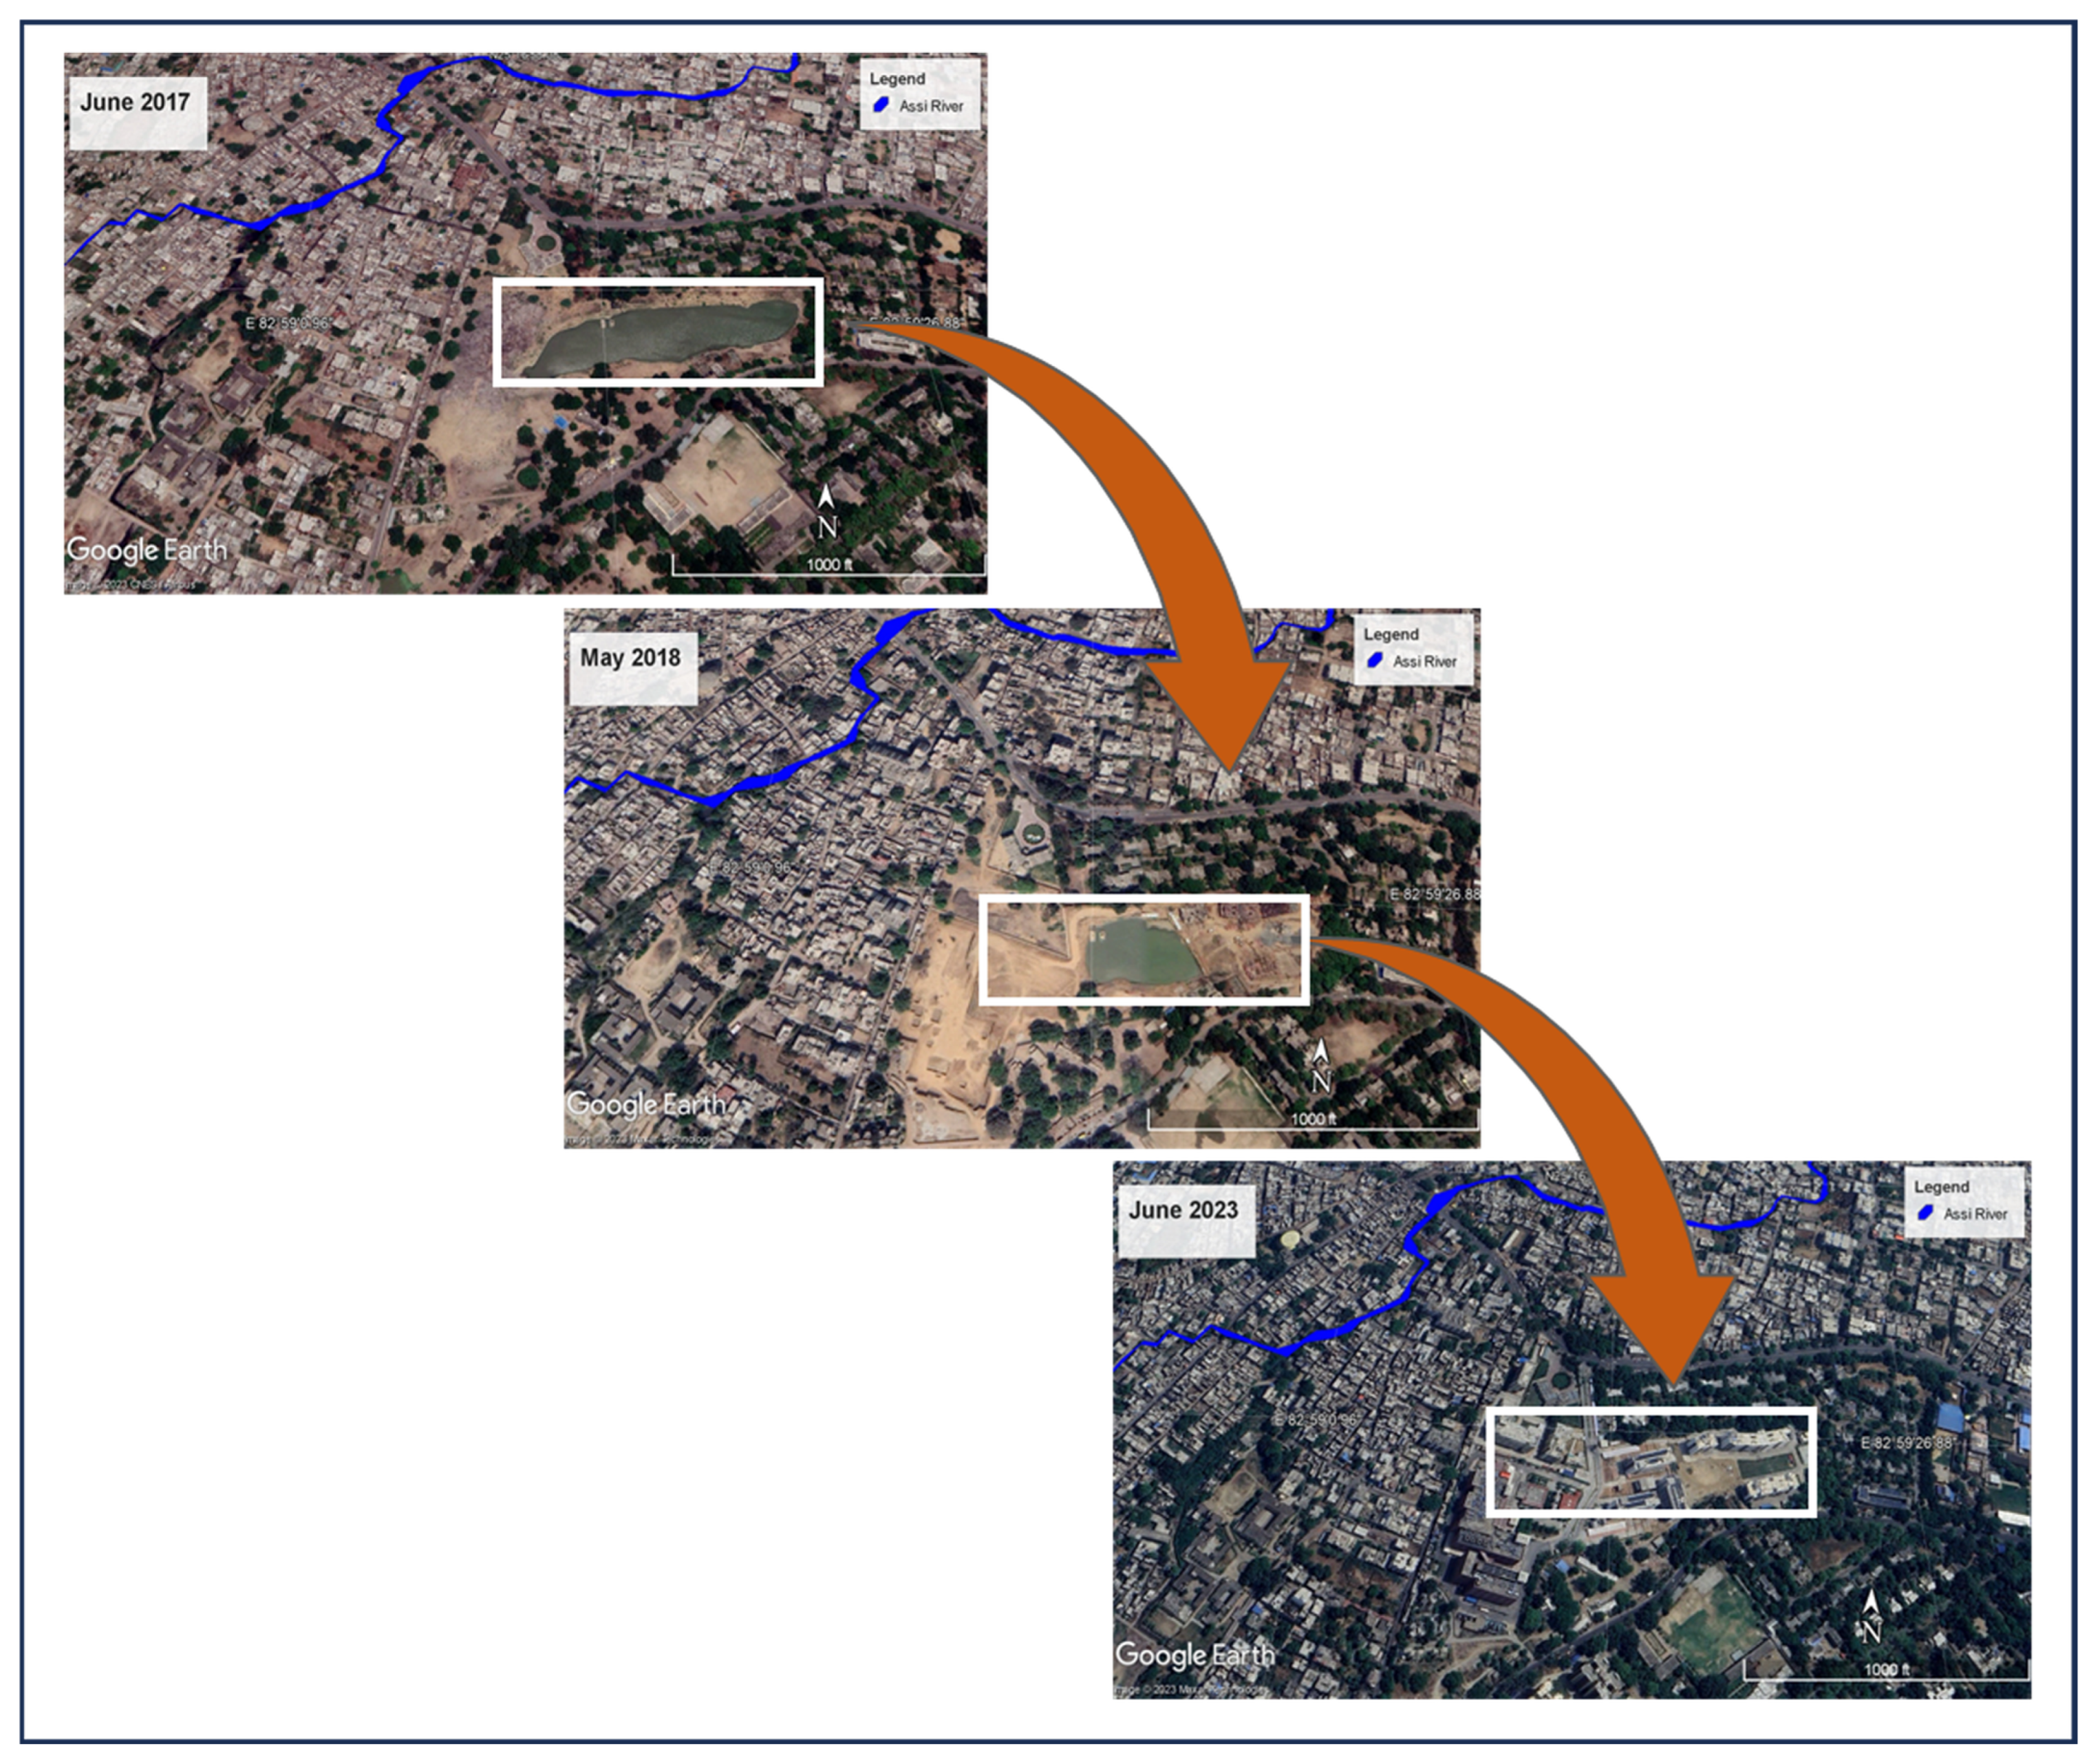
Ponds serve several essential functions in this restoration effort. They function as temporary storage areas during heavy rainfall, effectively regulating water flow. By capturing and retaining excess water, they mitigate the risk of downstream flooding and erosion. They operate as natural filters, trapping sediments and nutrients that would otherwise enter the river, thereby improving water quality downstream. Figure 9 illustrates that the water bodies in the catchment area of the Assi River are under threat from these modifications.
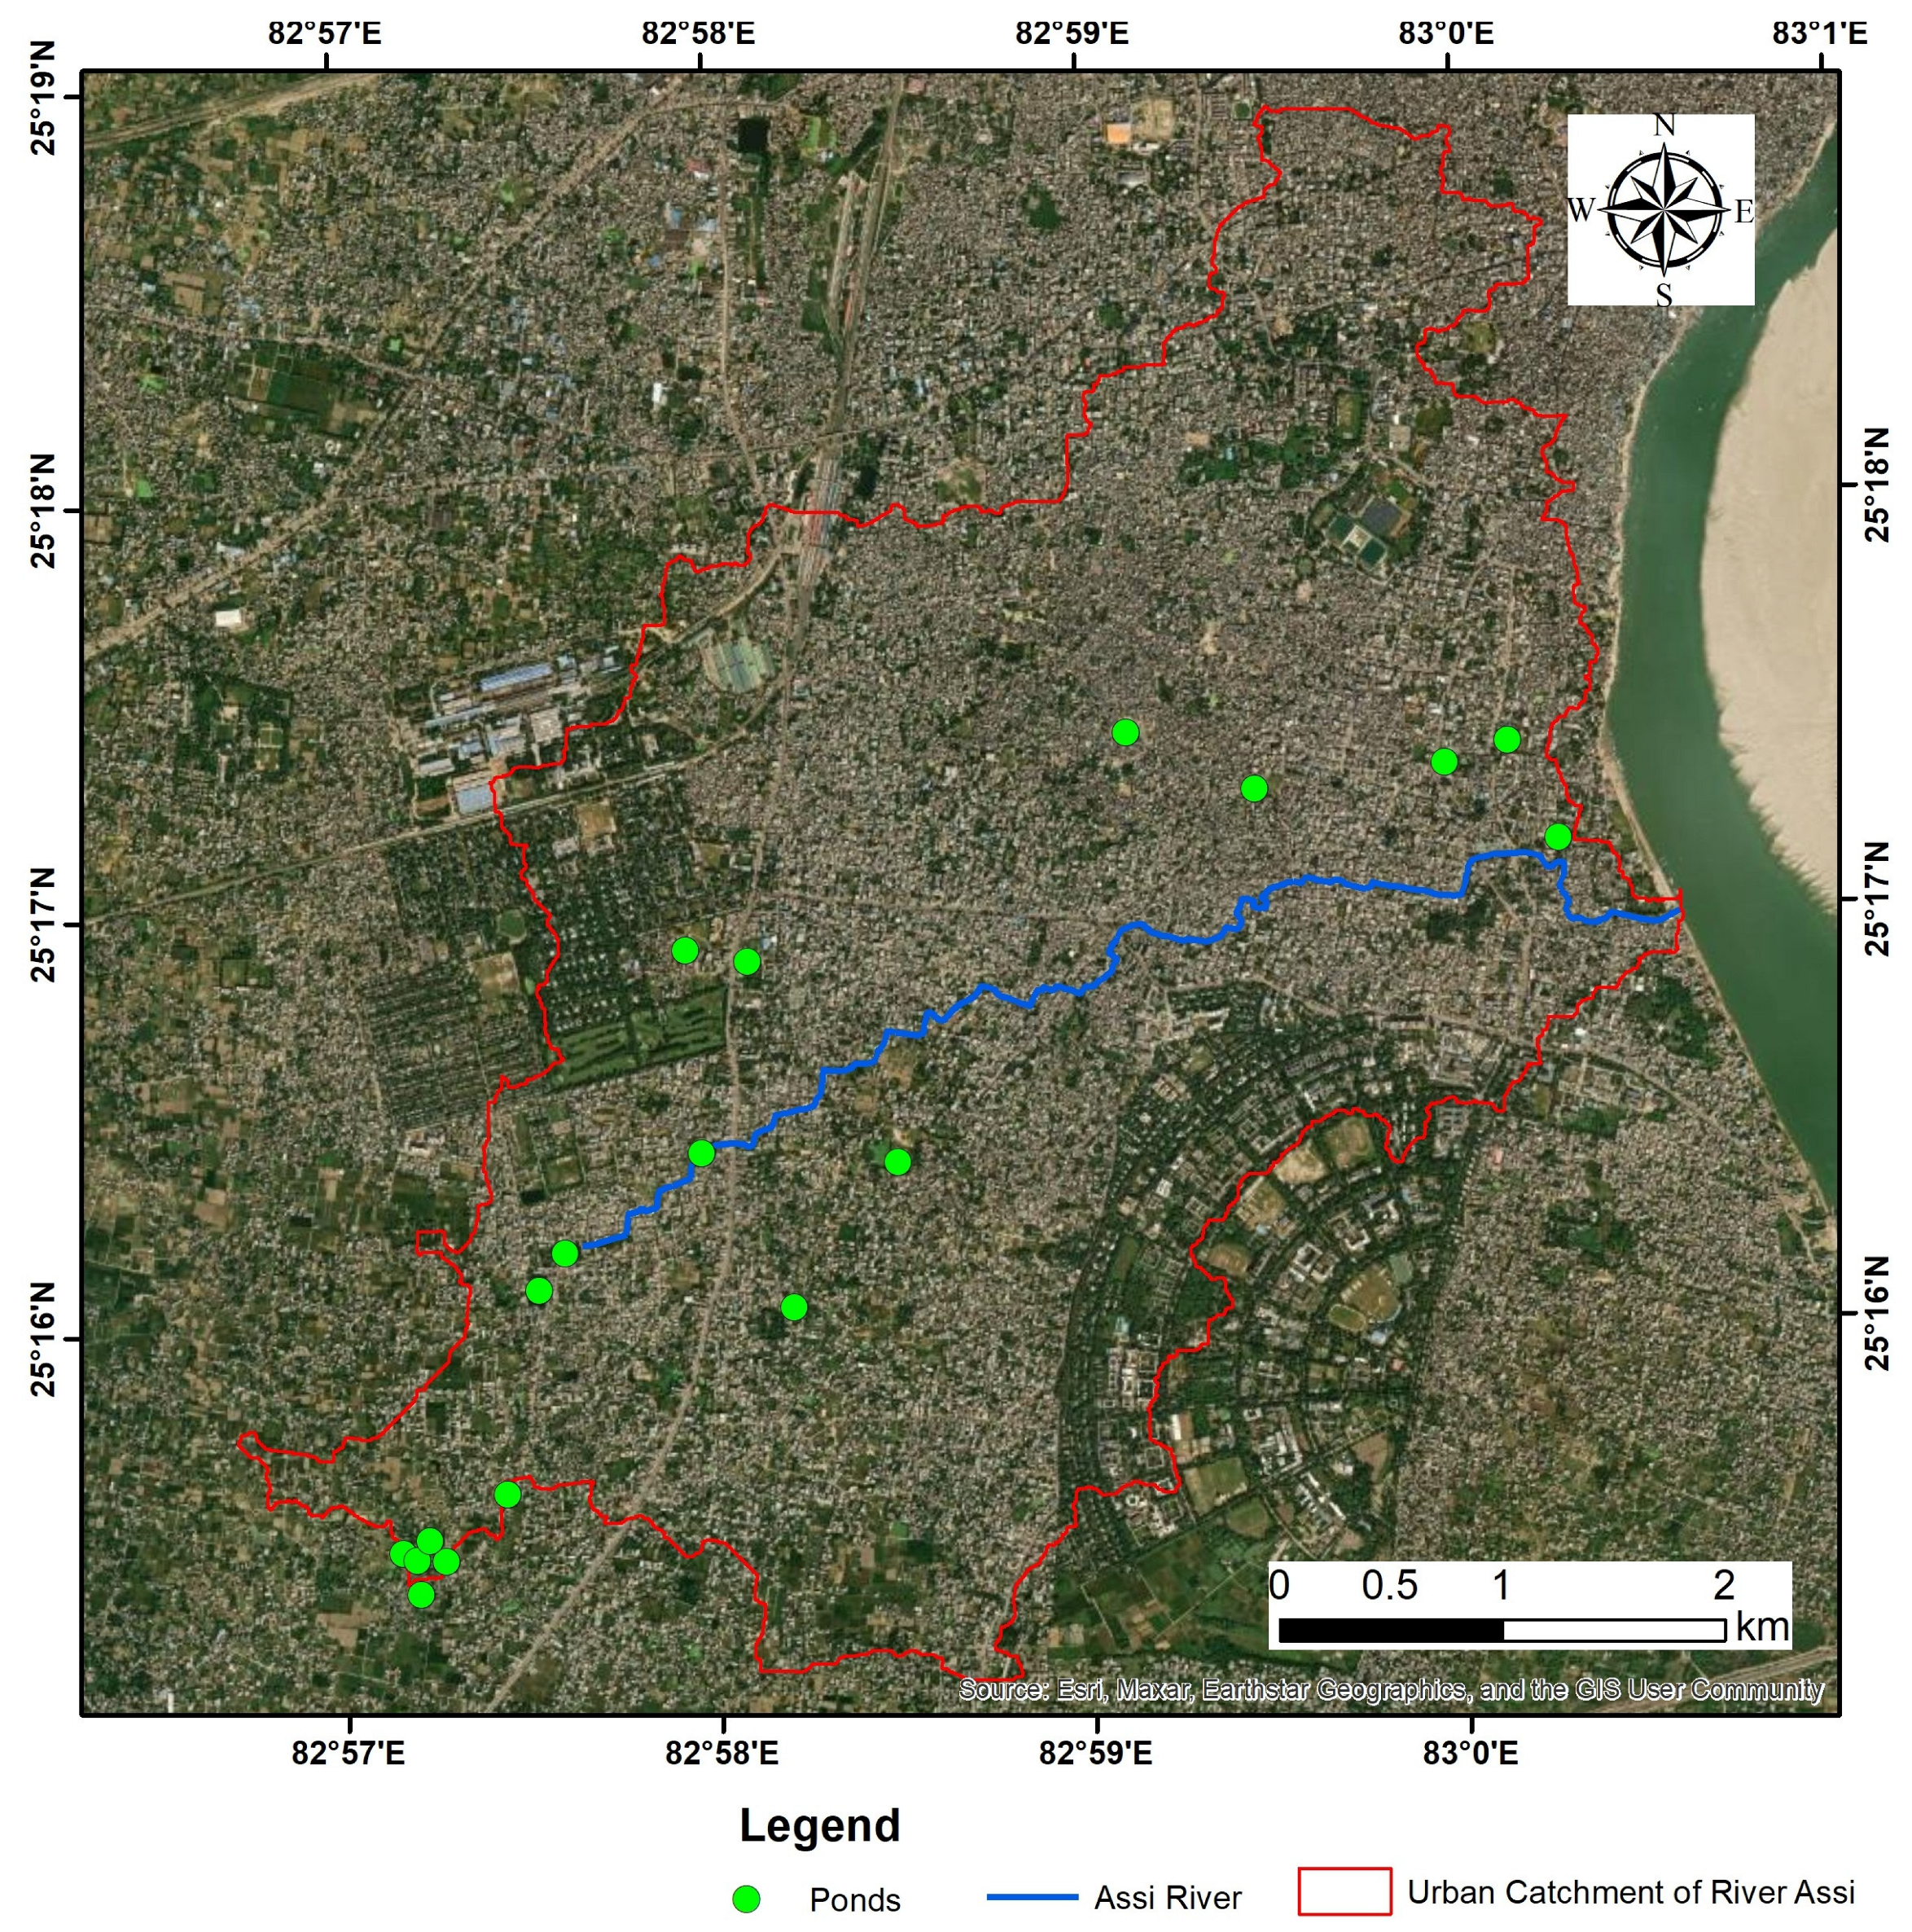
However, using remote Sensing and on-site verification, it is evident that there are still 19 ponds and small waterbodies in the catchment area of the Assi River (Figure 10). Constructing 12 groundwater recharge shafts in areas with positive GWT differentials (e.g., Nevada Pond) could reactivate hyporheic exchange, improving water quality and baseflow sustainability.

4.2. Policy Integration and Future Directions

The Assi River exemplifies the connectivity crisis facing small urban rivers globally. The Assi restoration model offers a replicable template by addressing multidimensional disconnection through geospatial planning, policy reform, and community engagement. As ref. [19] asserts, “connectivity is not merely a structural attribute but a dynamic process governing river resilience.” Restoring it is pivotal to achieving SDG 6 (Clean Water) and 11 (Sustainable Cities).
Despite the technical feasibility of the proposed restoration strategies for the Assi River, several critical barriers may hinder their effective implementation. Institutional fragmentation often results in overlapping mandates and a lack of coordinated action. Encroachment by informal settlements and formal constructions along the Assi Riverbanks poses a significant challenge; efforts to enforce buffer zones or relocate residents will likely face legal, social, and political hurdles. The situation is further complicated by low community awareness and engagement; many residents perceive the river as a drain rather than a living ecosystem, reducing public support for restoration, especially when conservation efforts conflict with short-term livelihood needs. Data limitations, including the lack of continuous hydrological, ecological, and groundwater monitoring, impede evidence-based decision-making and adaptive management.
Overcoming these challenges will require a shift toward integrated governance and inclusive stakeholder participation (including local communities and academic institutions). There are examples of restoration of urban waterways accomplished through a strong political commitment and generating a broad public consensus by highlighting the economic and social benefits. The restoration of the Cheonggyecheon Stream in Seoul, South Korea, involved the politically challenging removal of an elevated highway [61,62]. Similarly, the ongoing Thames River cleanup in London demonstrates how long-term success can be achieved through coordinated, multi-agency governance and sustained community engagement, shifting public perception of the river from a polluted industrial site to a valued recreational space [63].
To address the physical degradation observed in this study, it is crucial to restore the immediate buffer zone, thereby restoring the channel width. Longitudinal connectivity requires a pilot paleochannel reconnection project at Kardmeshwar pond, which is the current origin of the river. Groundwater recharge shafts can be installed at the sites of available ponds in the current catchment area to enhance vertical connectivity. A program for institutionalised regular UAV monitoring may be established, and a multi-season UAV survey is also required. For long-term sustainability and adaptive management, a task force comprising all relevant stakeholders can ensure coordinated efforts. Engaging the public in information sharing, mutual responsibility, and ownership for managing natural resources is crucial.

5. Conclusions

The degradation of the Assi River represents a microcosm of the challenges faced by small urban rivers globally, particularly in rapidly urbanising regions. This study assesses the river’s multidimensional connectivity loss—longitudinal, lateral, and vertical—due to urban encroachment, untreated sewage discharge, and disconnection from groundwater and floodplain systems. These findings are directly aligned with SDG 6.3 (reducing water pollution and improving water quality), SDG 6.6 (protecting water-related ecosystems), and SDG 11.3 and 11.7 (inclusive urbanisation and access to green spaces). On a national scale, the results complement key policy frameworks such as the Namami Gange Programme, the Urban River Management Plan [40], and the National Mission for Clean Ganga (NMCG), which focuses on river rejuvenation and urban water management. Varanasi city received the India Smart City Award, 2020, which also included the eco-restoration of the Assi River through wastewater treatment and removal of contaminants from the river. Despite these efforts, the Assi River continues to face a slow and dire decline, necessitating urgent administrative intervention and support.
The study recommends restoring riparian buffers, restoring paleochannels, leveraging ponds for groundwater recharge, and institutionalising UAV-based monitoring. However, implementation faces challenges such as fragmented governance, resistance to encroachment, and low public awareness. Enablers include supportive, innovative city policies, emerging geospatial technologies, and growing academic-community partnerships. The study suggests a framework to reconnect the Assi River, which includes recovering riparian buffers, restoring paleochannels, and revitalising groundwater connections. this. The successful implementation of the framework can serve as a replicable blueprint for sustainable urban river management.
The accuracy of determining the extent of urban encroachment relies on high-resolution geospatial data and sophisticated GIS analysis. However, a restoration plan may be implemented in any situation, provided the realistic estimates of encroachment are made available. Implementing the plan requires political will, as enforcing the required riparian buffer zone in urban areas may be challenging and is highly dependent on a stable political climate and robust legal frameworks. On a positive note, even the most degraded urban waterways can be restored through the implementation of strategic scientific solutions, informed by decisive policies and empowered communities.

Author Contributions

Conceptualisation, A.M. and A.O.; methodology, A.M. and P.K.S.; software, A.M.; validation, P.K.S. and N.S.; formal analysis, A.M.; investigation, A.O.; data curation, A.M.; writing—original draft preparation, A.M.; writing—review and editing, A.O., P.K.S. and R.K.C.; visualisation, A.M. and N.S.; supervision, P.K.S. and A.O.; project administration, R.K.C., P.K.S. and A.O.; funding acquisition, R.K.C. All authors have read and agreed to the published version of the manuscript.

Funding

The research stay of Anurag Mishra at UiT was funded by BRIDGE (Project No.: 322325), and the publication charges are paid by UiT, Norway.

Data Availability Statement

Historical Satellite Imagery has been downloaded from Google Earth Pro.

Acknowledgments

The authors are highly grateful to the Department of Civil Engineering, Indian Institute of Technology (BHU), for providing facilities for this study.

Conflicts of Interest

The authors declare no conflicts of interest.

Abbreviations

APHAAmerican Public Health Association
BDLBelow Detection Limit
BODBiochemical Oxygen Demand
CODChemical Oxygen Demand
CPCheck Point
CPCBCentral Pollution Control Board
DGPSDifferential Global Positioning System
DODissolved Oxygen
DSMDigital Surface Model
ECElectrical Conductivity
GCPGround Control Point
GWTGroundwater Table
MPNMost Probable Number
NH4-NAmmoniacal Nitrogen
NMCGNational Mission for Clean Ganga
NO3-NNitrate Nitrogen
NTUNephelometric Turbidity Unit
pHPotential of Hydrogen
RMSERoot Mean Square Error
SDGSustainable Development Goals
SfMStructure-from-Motion
TDSTotal Dissolved Solids
TPTotal Phosphorus
UAVUnmanned Aerial Vehicle
URMPUrban River Management Plan

References

  1. Kumari, A.; Sarika. Riverine Biodiversity and Importance: Potential Threat and Conservational Challenges; Elsevier: Amsterdam, The Netherlands, 2022. [Google Scholar]
  2. Wohl, E. The significance of small streams. Front. Earth Sci. 2017, 11, 447–456. [Google Scholar] [CrossRef]
  3. Fernández, D.; Barquín, J.; Álvarez-Cabria, M.; Peñas, F.J. Land-use coverage as an indicator of riparian quality. Ecol. Indic. 2014, 41, 165–174. [Google Scholar] [CrossRef]
  4. Nyssen, J.; Pontzeele, J.; Billi, P. Effect of beaver dams on the hydrology of small mountain streams: Example from the Chevral in the Ourthe Orientale basin, Ardennes, Belgium. J. Hydrol. 2011, 402, 92–102. [Google Scholar] [CrossRef]
  5. Verdonschot, P.F.M.; Verdonschot, R.C.M. The role of stream restoration in enhancing ecosystem services. Hydrobiologia 2023, 850, 2537–2562. [Google Scholar] [CrossRef]
  6. Graf, W.; Leitner, P.; Hanetseder, I.; Ittner, L.D.; Dossi, F.; Hauer, C. Ecological degradation of a meandering river by local channelization effects: A case study in an Austrian lowland river. Hydrobiologia 2016, 772, 145–160. [Google Scholar] [CrossRef]
  7. Young, K.A.; Gaskell, P.; Jackiin, T.; Williams, J.E. Brown Trout Management for the 21st Century; Wiley: Hoboken, NJ, USA, 2017. [Google Scholar]
  8. Škrinár, A.; Danáčová, M.; Výleta, R. Restoration OF Small River to Increase the Recreational and Tourist Potential of Rural Area. In Public Recreation and Landscape Protection—With Environment Hand in Hand…, Proceedings of the 13th Conference, Křtiny, Czech Republic, 9–10 May 2022; Mendel University in Brno: Brno, Czech Republic, 2022; pp. 292–296. [Google Scholar] [CrossRef]
  9. Pedroli, B.; De Blust, G.; Van Looy, K.; Van Rooij, S. Setting targets in strategies for river restoration. Landsc. Ecol. 2002, 17, 5–18. [Google Scholar] [CrossRef]
  10. Cody, B.A.; Stern, C.V.; Carter, N.T.; Sheikh, P.A. Water Resource Issues in the 113th Congress; Congress Research Service: Washington, DC, USA, 2013. [Google Scholar]
  11. Lespez, L.; Germaine, M.-A.; Gob, F.; Tales, E.; Thommeret, N.; de Milleville, L.; Archaimbault, V.; Letourneur, M. A new tool to characterise the socio-environmental dimensions of urban rivers: Urban river socio-environmental index. Landsc. Urban Plan. 2025, 261, 105388. [Google Scholar] [CrossRef]
  12. Nilsson, C.; Brittain, J.E. Remedial strategies in regulated rivers: Introductory remarks. Regul. Rivers Res. Manag. 1996, 12, 347–351. [Google Scholar] [CrossRef]
  13. Buffagni, A.; Tenchini, R.; Cazzola, M.; Erba, S.; Balestrini, R.; Belfiore, C.; Pagnotta, R. Detecting the impact of bank and channel modification on invertebrate communities in Mediterranean temporary streams (Sardinia, SW Italy). Sci. Total Environ. 2016, 565, 1138–1150. [Google Scholar] [CrossRef] [PubMed]
  14. Coelho, D.; Hughes, S.J.; Varandas, S.; Cortes, R.M.V. Conservation benefits of riparian buffers in urban areas: The case of the rio corgo (North Portugal). Fundam. Appl. Limnol. 2014, 185, 55–70. [Google Scholar] [CrossRef]
  15. Pattacini, L. Urban design and rivers: A critical review of theories devising planning and design concepts to define riverside urbanity. Sustainability 2021, 13, 7039. [Google Scholar] [CrossRef]
  16. Rohde, S.; Hostmann, M.; Peter, A.; Ewald, K.C. Room for rivers: An integrative search strategy for floodplain restoration. Landsc. Urban Plan. 2006, 78, 50–70. [Google Scholar] [CrossRef]
  17. Richardson, M.; Soloviev, M. The urban river syndrome: Achieving sustainability against a backdrop of accelerating change. Int. J. Environ. Res. Public Health 2021, 18, 6406. [Google Scholar] [CrossRef] [PubMed]
  18. Wang, Q.; Pang, X.; Wang, Z.J.; Yuan, X.Z.; Zhang, Y.G. Advances in research on the influence of urbanization on stream benthic macroinvertebrate communities. Shengtai Xuebao 2017, 37, 6275–6288. [Google Scholar] [CrossRef]
  19. Wohl, E. Connectivity in rivers. Prog. Phys. Geogr. 2017, 41, 345–362. [Google Scholar] [CrossRef]
  20. Shen, J.; Qin, G.; Gu, X.; Liu, Y.; An, S.; Liu, R.; Leng, X.; Wan, Y. Effects of seasonal hydrological regulation of cascade dams on the functional diversity of zooplankton: Implications for the management of massive reservoirs and dams. J. Hydrol. 2022, 610, 127825. [Google Scholar] [CrossRef]
  21. Yao, H.; Jiang, Y.; Li, X.; Su, J. Evaluation of river connectivity using a composite index method and its impact on nutrients dynamics in large rivers. Ecol. Indic. 2023, 155, 110961. [Google Scholar] [CrossRef]
  22. Grill, G.; Lehner, B.; Thieme, M.; Geenen, B.; Tickner, D.; Antonelli, F.; Babu, S.; Borrelli, P.; Cheng, L.; Crochetiere, H.; et al. Mapping the world’s free-flowing rivers. Nature 2019, 569, 215–221. [Google Scholar] [CrossRef] [PubMed]
  23. Dui, Z.; Huang, Y.; Wang, M.; Jin, J.; Gu, Q. Segmentation and Connectivity Reconstruction of Urban Rivers from Sentinel-2 Multi-Spectral Imagery by the WaterSCNet Deep Learning Model. Remote Sens. 2023, 15, 4875. [Google Scholar] [CrossRef]
  24. Acharya, B.S.; Bhandari, M.; Bandini, F.; Pizarro, A.; Perks, M.; Joshi, D.R.; Wang, S.; Dogwiler, T.; Ray, R.L.; Kharel, G.; et al. Unmanned Aerial Vehicles in Hydrology and Water Management: Applications, Challenges, and Perspectives. Water Resour. Res. 2021, 57, e2021WR029925. [Google Scholar] [CrossRef]
  25. Sarkar, D.; Sinha, R. Integrating UAV-Based Topographic and Geomorphic Analysis for the Development of River Rehabilitation Plans in Semi-Urban Settings. River Res. Appl. 2025, 41, 314–333. [Google Scholar] [CrossRef]
  26. Evans, A.D.; Gardner, K.H.; Greenwood, S.; Still, B. UAV and Structure-From-Motion Photogrammetry Enhance River Restoration Monitoring: A Dam Removal Study. Drones 2022, 6, 100. [Google Scholar] [CrossRef]
  27. Djenontin, I.N.S.; Fischer, H.W.; Yin, J.; Chi, G. Unveiling global narratives of restoration policy: Big data insights into competing framings and implications. Geoforum 2025, 161, 104241. [Google Scholar] [CrossRef] [PubMed]
  28. Lange, C.; Schneider, M.; Mutz, M.; Haustein, M.; Halle, M.; Seidel, M.; Sieker, H.; Wolter, C.; Hinkelmann, R. Model-based design for restoration of a small urban river. J. Hydro-Environ. Res. 2015, 9, 226–236. [Google Scholar] [CrossRef]
  29. Marx, C.; Tetzlaff, D.; Hinkelmann, R.; Soulsby, C. Effects of 66 years of water management and hydroclimatic change on the urban hydrology and water quality of the Panke catchment, Berlin, Germany. Sci. Total Environ. 2023, 900, 165764. [Google Scholar] [CrossRef]
  30. Singare, P.U.; Mishra, R.M.; Trivedi, M.P. Heavy Metal Pollution in Mithi River of Mumbai. Front. Sci. 2012, 2, 28–36. [Google Scholar] [CrossRef]
  31. Ghosh, M.; Mohanty, M.P.; Kishore, P.; Karmakar, S. Performance evaluation of potential inland flood management options through a three-way linked hydrodynamic modelling framework for a coastal urban watershed. Hydrol. Res. 2021, 52, 61–77. [Google Scholar] [CrossRef]
  32. Dhamodharan, A.; Abinandan, S.; Aravind, U.; Ganapathy, G.P.; Shanthakumar, S. Distribution of Metal Contamination and Risk Indices Assessment of Surface Sediments from Cooum River, Chennai, India. Int. J. Environ. Res. 2019, 13, 853–860. [Google Scholar] [CrossRef]
  33. Kumar, B.; Mizunoya, T. Sustainability Assessment Model of the Buriganga River Restoration Project in Bangladesh: A System Dynamics and Inclusive Wealth Study. Sustainability 2022, 14, 873. [Google Scholar] [CrossRef]
  34. Alam, K. Public attitudes toward restoration of impaired river ecosystems: Does residents’ attachment to place matter? Urban Ecosyst. 2011, 14, 635–653. [Google Scholar] [CrossRef]
  35. Islam, M.A.; Ahmad, S.A.; Islam, R. Water quality perceptions and willingness to pay: Valuing river water quality using contingent valuation method. J. Adv. Res. Dyn. Control Syst. 2019, 11, 1011–1022. [Google Scholar]
  36. Thapa, V. A Dying Holy River An Examination of Urban Contamination in the Bagmati River Basin. Master’s Thesis, Dartmouth College, Hanover, HN, USA, 2020. [Google Scholar]
  37. Shakya, L.; Tiwari, S.R. Impact of Landuse Changes on Bagmati River. Proc. IOE Grad. Conf. 2014, 250–255. Available online: https://conference.ioe.edu.np/publications/ioegc2014/IOE-CONF-2014-32.pdf (accessed on 20 August 2024).
  38. Mishra, B.K.; Regmi, R.K.; Masago, Y.; Fukushi, K.; Kumar, P.; Saraswat, C. Assessment of Bagmati river pollution in Kathmandu Valley: Scenario-based modeling and analysis for sustainable urban development. Sustain. Water Qual. Ecol. 2017, 9–10, 67–77. [Google Scholar] [CrossRef]
  39. Mishra, A.; Agnihotri, A.K.; Pipil, S.; Gaur, S.; Ohri, A. Chapter 4—Surveying techniques for urban areas. In Earth Observation; Kumar, A., Srivastava, P.K., Saikia, P., Mall, R.K., Eds.; Elsevier: Amsterdam, The Netherlands, 2024; pp. 69–91. [Google Scholar]
  40. URMP Urban River Management Plan (URMP). A Strategic Framework for Managing Urban River Stretches in the Ganga River Basin; Components and Guidance note; National Mission for Clean Ganga: New Dehli, India; National Institute of Urban Affairs (NIUA): New Dehli, India, 2020; Available online: https://niua.in/waterandenvironment/wp-content/uploads/2022/03/URMP-Framework-pdf.pdf (accessed on 25 August 2024).
  41. Rice, E.W.; Baird, R.B.; Eaton, A.D. (Eds.) Standard Methods for Examination of Water and Wastewater; American Public Health Association: Washington, DC, USA; American Water Works Association: Washington, DC, USA; Water Environment Federation: Washington, DC, USA, 2017. [Google Scholar]
  42. Singh, D.D.; Thind, P.S.; Sharma, M.; Sahoo, S.; John, S. Environmentally sensitive elements in groundwater of an industrial town in India: Spatial distribution and human health risk. Water 2019, 11, 2350. [Google Scholar] [CrossRef]
  43. Borthakur, A.; Singh, P. India’s lost rivers and rivulets. Energy Ecol. Environ. 2016, 1, 310–314. [Google Scholar] [CrossRef]
  44. Singh, A.L. Study of physico-chemical characteristics of water samples from Assi River, Varanasi, U.P. India. Pollut. Res. 2011, 30, 209–212. [Google Scholar]
  45. Mishra, S.; Agnihotri, A.K. Assessment of Water Quality of River Assi by using WQI, Varanasi, India. Int. J. Environ. Sustain. 2018, 114–121. [Google Scholar]
  46. Mishra, M.; Raju, K.N.P.; Raju, P.V. Palaeo and present channel of Assi river, Uttar Pradesh, India. Curr. Sci. 2020, 118, 630–639. [Google Scholar] [CrossRef]
  47. Lapworth, D.J.; Dochartaigh, B.Ó.; Nair, T.; O’Keeffe, J.; Krishan, G.; MacDonald, A.M.; Khan, M.; Kelkar, N.; Choudhary, S.; Krishnaswamy, J.; et al. Characterising groundwater-surface water connectivity in the lower Gandak catchment, a barrage regulated biodiversity hotspot in the mid-Gangetic basin. J. Hydrol. 2021, 594, 125923. [Google Scholar] [CrossRef]
  48. Fu, G.; Rojas, R.; Gonzalez, D. Trends in Groundwater Levels in Alluvial Aquifers of the Murray–Darling Basin and Their Attributions. Water 2022, 14, 1808. [Google Scholar] [CrossRef]
  49. Gupta, S.K.; Singh, V.P.; Mishra, V.B. Design and Testing of a Flow Measurement System for an Urban Sewage Drain. J. Irrig. Drain. Eng. 2012, 138, 558–563. [Google Scholar] [CrossRef]
  50. Mainstone, C.P.; Dils, R.M.; Withers, P.J.A. Controlling sediment and phosphorus transfer to receiving waters—A strategic management perspective for England and Wales. J. Hydrol. 2008, 350, 131–143. [Google Scholar] [CrossRef]
  51. Granger, S.J.; Harris, P.; Upadhayay, H.R.; Sint, H.; Pulley, S.; Stone, M.; Krishnappan, B.G.; Collins, A.L. Novel approaches to investigating spatial variability in channel bank total phosphorus at the catchment scale. Catena 2021, 202, 105223. [Google Scholar] [CrossRef]
  52. Rahel, F.J.; McLaughlin, R.L. Selective fragmentation and the management of fish movement across anthropogenic barriers. Ecol. Appl. 2018, 28, 2066–2081. [Google Scholar] [CrossRef]
  53. Lim, S.; Do, Y. Macroinvertebrate conservation in river ecosystems: Challenges, restoration strategies, and integrated management approaches. Entomol. Res. 2023, 53, 271–290. [Google Scholar] [CrossRef]
  54. Birnie-Gauvin, K.; Nielsen, J.; Frandsen, S.B.; Olsen, H.M.; Aarestrup, K. Catchment-scale effects of river fragmentation: A case study on restoring connectivity. J. Environ. Manag. 2020, 264, 110408. [Google Scholar] [CrossRef]
  55. Paillex, A.; Schuwirth, N.; Lorenz, A.W.; Januschke, K.; Peter, A.; Reichert, P. Integrating and extending ecological river assessment: Concept and test with two restoration projects. Ecol. Indic. 2017, 72, 131–141. [Google Scholar] [CrossRef]
  56. Décamps, H.; Pinay, G.; Naiman, R.J.; Petts, G.E.; McClain, M.E.; Hillbricht-Ilkowska, A.; Hanley, T.A.; Holmes, R.M.; Quinn, J.; Gibert, J.; et al. Riparian zones: Where biogeochemistry meets biodiversity in management practice. Polish J. Ecol. 2004, 52, 3–18. [Google Scholar]
  57. Glenn, E.P.; Nagler, P.L.; Shafroth, P.B.; Jarchow, C.J. Effectiveness of environmental flows for riparian restoration in arid regions: A tale of four rivers. Ecol. Eng. 2017, 106, 695–703. [Google Scholar] [CrossRef]
  58. Kondolf, G.M. Setting Goals in River Restoration: When; Where Can the River “Heal Itself”? American Geophysical Union: Washington, DC, USA, 2011; Volume 194. [Google Scholar]
  59. Langendoen, E.J.; Lowrance, R.R.; Simon, A. Assessing the impact of riparian processes on streambank stability. Ecohydrology 2009, 2, 360–369. [Google Scholar] [CrossRef]
  60. Jayawardana, J.M.C.K. Thoughts for stream restoration: Link between riparian, instream vegetation and macroinvertebrates. Environ. Res. J. 2010, 4, 1–26. [Google Scholar]
  61. Chou, R.-J. Achieving successful river restoration in dense urban areas: Lessons from Taiwan. Sustainability 2016, 8, 1159. [Google Scholar] [CrossRef]
  62. Lee, Y.; Kim, H.; Hong, Y. Revealed preference and effectiveness of public investment in ecological river restoration projects: An application of the count data model. Sustainability 2016, 8, 353. [Google Scholar] [CrossRef]
  63. Westwood, C.G.; Teeuw, R.M.; Wade, P.M.; Holmes, N.T.H.; Guyard, P. Influences of environmental conditions on macrophyte communities in drought-affected headwater streams. River Res. Appl. 2006, 22, 703–726. [Google Scholar] [CrossRef]
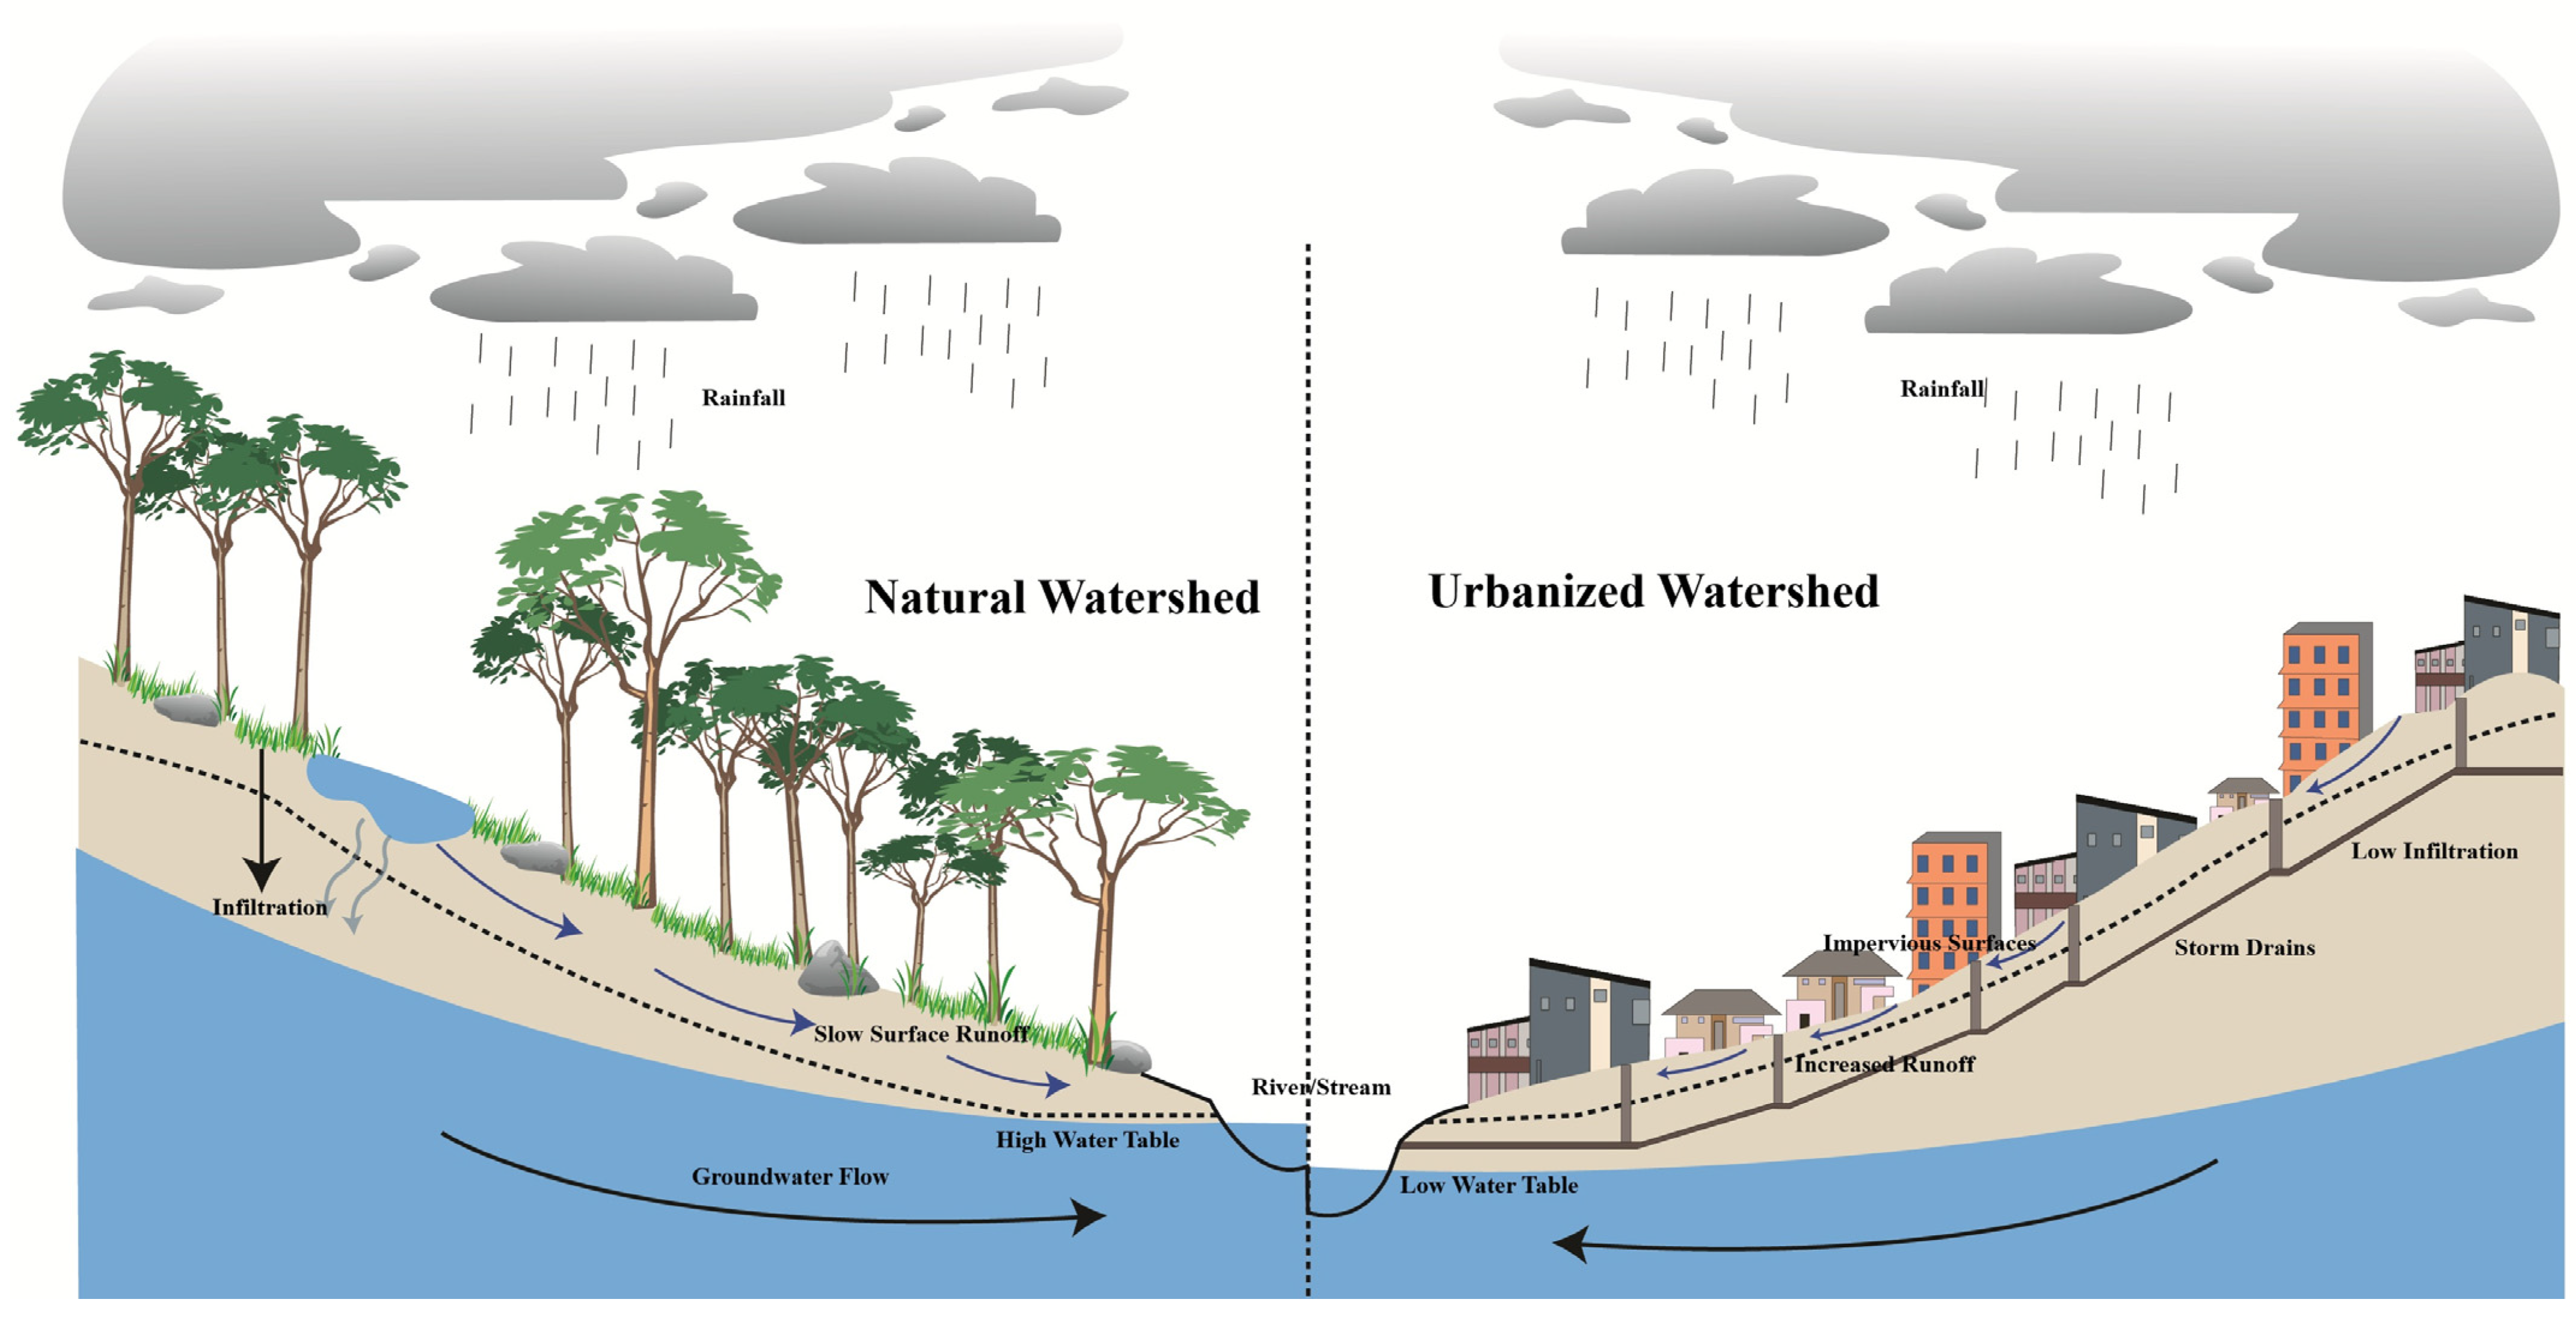
Figure 1. Comparison of subsurface flow conditions in natural and urbanised watersheds.
Geographies 05 00069 g001
Figure 2. Study Area Map.
Geographies 05 00069 g002
Figure 3. Flowchart of the study and methodology related to UAV and GIS.
Geographies 05 00069 g003
Figure 4. Built-up area along the Assi River and sampling locations.
Geographies 05 00069 g004
Figure 5. Different stretches of the river Assi.
Geographies 05 00069 g005
Figure 6. Line graph showing the Bottom Elevation of the River and the Groundwater Table (GWT).
Geographies 05 00069 g006
Figure 7. Condition of the River Assi at Some Important Locations.
Geographies 05 00069 g007
Figure 8. Voluntary management guidelines recommended for the area adjacent to the riparian buffer, streamside zone and an outer zone (adopted from [40]).
Geographies 05 00069 g008
Figure 9. Encroachment in the Pond in the Catchment Area of the River Assi (Imageries from Google Earth Pro).
Geographies 05 00069 g009
Figure 10. Ponds in the Catchment Area of the River Assi.
Geographies 05 00069 g010
Table 1. Different Land Use in different buffer widths in the river Assi.
Land-Use TypeArea in Buffer Width on Both Sides of the River (in m2)
5 m10 m20 m30 m
Agriculture Land306198843818197
Built Up556625,24082,303137,580
Vacant Plot516117,13638,45453,990
Table 2. Built-up area in different buffer widths in different stretches.
StretchLength (m)Encroached Area (m2/100 m) Length in Buffer Width on both Sides of the River
3 m5 m10 m15 m20 m30 m
a1049.006.0131.46188.66474.55813.541542.14
b816.002.2111.40185.05514.83870.221670.22
c1459.0023.24121.93533.041061.271631.872733.17
d411.001.7044.77345.01766.671226.522349.64
e1518.0017.7976.61318.91611.53892.421489.99
f666.0071.02174.77621.621205.411739.342866.82
g1014.0015.4884.12352.56954.341251.181630.08
Table 3. Range of width in different stretches of the river Assi.
Stretch No.Stretch NameAverage Width (m)
Stretch 1Karmadeshwar Temple to Kanchanpur Pokhra3–27
Stretch 2Kanchanpur Pokhra to Indira Nagar Drain1–18
Stretch 3Indira Nagar Drain to Dhirendra Mahila College1–13
Stretch 4Dhirendra Mahila College to Sunderpur4–21
Stretch 5Sunderpur to Saket Nagar5–21
Stretch 6Saket Nagar to Sankat Mochan Bridge6–42
Stretch 7Sankat Mochan Bridge to Confluence of Assi-Ganga7–25
Table 4. Water Quality in the River Assi (October 2022).
ParameterUnitsKardmeshwer PondKhandwa Pond
(Stretch 1)
Kanchanpur Pokhra
(Stretch 2)
Indira Nagar (Stretch 3)Sunderpur (Stretch 4)Saket Nagar (Stretch 5)Sankat
Mochan Bridge
(Stretch 6)
Confluence of Assi-Ganga (Stretch 7)
Temperature°C28.3 ± 2.832.5 ±3.832.7 ±4.333.1 ± 5.331.5 ± 4.531.2 ±4.631.5 ±3.932.6 ±4.1
DOmg/L4.9± 0.81.0 ± 0.50.35 ± 0.150.75 ± 0.050.6 ± 0.10.4 ± 0.10.3 ± 0.10.2 ± 0.1
ConductivityµS/cm635± 45940 ± 185938 ± 1531063 ± 187960 ± 159934 ± 1221090 ± 1731117 ± 241
TDSmg/L443 ± 58618 ± 67632 ± 89657 ± 63729 ± 123623 ± 133719 ± 153738 ± 95
pH-7.8 ± 0.57.1 ± 0.27.3 ± 0.37.1 ± 0.17.1 ± 0.27.2 ± 0.47.2 ± 0.37.2 ± 0.4
NH4-Nmg/L0.65 ± 0.36.3 ± 2.28.0 ± 1.47.8 ± 1.610.8 ± 4.414.1 ± 3.56.4 ± 2.711.9 ± 3.3
NO3-Nmg/L24.3 ± 6.334.3 ± 4.548.5 ± 6.344.6 ± 2.550.4 ± 2.042.5 ± 1.859 ± 2.863 ± 6.7
TurbidityNTU9.2 ± 1.658.5 ± 15.536.5 ± 15.539.5 ± 11.655.5 ± 10.554.5 ± 22.564.0 ± 16.371.5 ± 20.5
BODmg/L21± 5.657 ± 5.548 ± 11.356 ± 8.7104 ± 15.692 ± 9.197 ± 16.7126 ± 27
CODmg/L89± 22144 ± 15192 ± 35228 ± 24397 ± 57322 ± 76307 ± 84344 ± 60
Total ColiformMPN/
100 mL
(3.0 ± 1.2) × 103(2.2 ± 1.1) × 107(4.7 ± 2.3) × 107(3.4 ± 0.3) × 108(2.3 ± 1.1) × 108(1.7± 0.4) × 108(1.9 ± 0.6) × 108(3.6 ± 0.6) × 108
Faecal ColiformMPN/
100 mL
(1.1 ± 0.5) × 103(3.5 ± 1.6) × 106(1.1 ± 0.7) × 107(2.1 ± 1.3) × 107(5.3 ± 1.7) × 107(4.6 ± 2.1) × 107(3.1 ± 1.5) × 107(2.1 ± 1.4) × 108
Total phosphorusmg/L0.5 ± 0.22.43 ± 1.22.2 ± 0.72.4 ± 0.92.5 ± 1.16.1 ± 2.53.4 ± 1.52.5 ± 0.8
Cadmiummg/LBDLBDLBDLBDLBDLBDLBDLBDL
Mercurymg/LBDLBDLBDLBDLBDLBDLBDLBDL
Nickelmg/LBDLBDLBDLBDLBDLBDLBDLBDL
Chromiummg/LBDLBDLBDLBDLBDLBDLBDLBDL
Leadmg/LBDLBDLBDLBDLBDLBDLBDLBDL
Arsenicmg/LBDLBDLBDLBDLBDLBDLBDLBDL
Table 5. Details of ponds in the catchment area of the Assi River.
S.N.LatitudeLongitudeLocationTop Elevation of Pond
(m)
Bottom Elevation of the Pond
(m)
Avg. Depth (m)Area
(m2)
Volume
(m3)
Ground Water
Table (GWT)
(m)
Difference in GWT and Pond Bottom Elevation (m)
p125.2561582.953264Amara Pond 179.5974.123.4376312,79473.210.91
p225.2578182.952468Amara Pond 277.6076.580.956150575.421.16
p325.257582.953098Amara Pond 377.6675.421.33186414173.561.86
p425.2574782.954421Amara Pond 4 78.0475.630.95616505474.371.26
p525.2582982.953692Amara Pond 578.5575.641.19019992173.462.18
p625.2601482.957186Awaleshwar Mahadev Mandir Pond79.4275.562.32838652873.522.04
p725.2683182.958699Kardhmeshwar Pond79.7273.221.413,82819,35973.76−0.54
p825.2698182.959887Kandwa Pond78.1075.661.5750011,25073.761.9
p925.2737782.966059Kanchanpur77.9074.112.7901124,33172.131.98
p1125.2819382.965439Bhikharipur Pond 177.1374.651.6621610,15476.09−1.44
p1225.2814382.968213Bhikharipur Pond 178.8673.893.3345011,31477.26−3.5
p1325.2674982.970084Pongalpur Village Pond78.2875.781.711,28818,62671.223.62
p1425.2732982.974808Newada Pond 179.9575.452.9463113,75371.443.43
p1525.2904682.985239Nagawa Pond 277.8275.761.44878663875.47−2.06
p1625.288182.990932Nagawa Pond 376.3973.891.613,46622,21876.37−2.13
p1725.2890882.999411Durga Kund75.2569.014.1494620,35172.39−4.96
p1825.2899283.002225Kurukshetra Pond74.4567.624.5802836,15570.49−2.87
p1925.2859983.004469Pushkar Talab76.4164.134.9969147,60168.86−4.73
Disclaimer/Publisher’s Note: The statements, opinions and data contained in all publications are solely those of the individual author(s) and contributor(s) and not of MDPI and/or the editor(s). MDPI and/or the editor(s) disclaim responsibility for any injury to people or property resulting from any ideas, methods, instructions or products referred to in the content.