Article

Longitudinal Assessment of Land Use Change Impacts on Carbon Services in the Southeast Region, Vietnam

Faculty of Real Estate and Resources Economics, College of Business, National Economics University, 207 Giai Phong, Hanoi 113068, Vietnam
Geographies 2025, 5(4), 62; https://doi.org/10.3390/geographies5040062
Submission received: 10 September 2025 / Revised: 7 October 2025 / Accepted: 15 October 2025 / Published: 21 October 2025

Abstract

Land use change strongly influences ecosystem carbon services. This study evaluates long-term variations in carbon storage resulting from land use transitions in the Southeast region of Vietnam during 1990–2020. The analysis uses ALOS (JAXA) land use data in combination with QGIS-based spatial analysis to estimate carbon stocks. Land use trajectories were classified according to their dominant driving processes (urbanization, restoration, succession, reclamation, and reverse succession) to assess how each process affects carbon storage. The results indicate that total carbon stock increased from 475 million tons in 1990 to 502 million tons in 2010, before declining to 462 million tons in 2020. Carbon loss was mainly caused by urban expansion and ecological degradation, while ecological succession and forest restoration only partially compensated for these losses. This study develops a spatial framework for analyzing land use trajectories based on natural and anthropogenic dynamics, reflecting the region’s current administrative boundaries to improve management relevance. These findings underscore the need for sustainable land management, controlled urbanization, and ecosystem restoration to maintain carbon sequestration capacity and support Vietnam’s net-zero emission goals.

1. Introduction

Land use change (LUC) is one of the most powerful forces shaping the Earth’s surface and ecological processes [1]. Through urbanization, agricultural expansion, resource exploitation, and land management activities, humans have significantly altered natural landscapes [2,3]. These transformations not only modify the spatial distribution of land cover but also profoundly affect ecosystem functions and services [4], particularly carbon storage [5,6]. These ecosystem services are the foundation for sustainable development and social welfare [7]. Many studies have shown that land use change has affected global land cover [8,9], reduced biodiversity [10,11], and increased environmental risks [12]. In particular, ecosystem carbon services play a fundamental role in regulating global climate by absorbing and storing carbon dioxide [13]. Protecting and enhancing this carbon sequestration capacity has become a key challenge in the context of accelerating climate change.
Many important ecological regions around the world have conducted research on the relationship between land use, natural–human dynamics, and ecosystem services. Researchers often use models such as InVEST [14], GWR [15,16], and ARDL [17,18] to quantify changes in ecosystem services over time and space. However, most studies only focus on analyzing the impacts of natural factors or human factors separately, while paying little attention to the combined impacts and complex interactions between them [19,20]. In other words, it is still unclear how long-term LUC trajectories affect ecosystem service dynamics and how they relate to underlying natural and human processes. This gap leads to a lack of comprehensive evidence on how ecosystem services respond under different scenarios of LUC. In Vietnam, and especially in the Southeast region, rapid urbanization and industrialization have exerted intense pressure on land resources and the ecological environment [21]. Although some studies have explored individual aspects such as urban growth or forest loss, few have developed an integrated analytical framework linking long-term land use trajectories, natural and human dynamics, and ecosystem responses.
Terrestrial ecosystems serve as crucial carbon sinks, helping to absorb CO2 and mitigate climate change [22]. However, LUC has significantly changed the amount of carbon stored in vegetation and land [23]. Numerous international studies have confirmed that the conversion of natural forests to other land uses release large amounts of carbon emissions, thereby intensifying the greenhouse effect [24]. LUC ranks as the second-largest contributor to global carbon emissions, following the burning of fossil fuels [25]. Statistics indicate that tropical forests store approximately 160–250 petagrams of carbon [26], while LUC, mainly tropical deforestation, has released around 3.2 billion tons of CO2 [25]. Brazil and Indonesia together account for nearly half of global deforestation [27]. In Southeast Asia, carbon emissions from land conversion represent about one-third of total global LUC emissions [28].
Several studies have also examined how urbanization and climate change influence carbon services, highlighting the differences between developed and developing countries. Cities in developing countries exhibit a rapid increase in per capita CO2 emissions, while developed countries experience slower growth [29]. In particular, urbanization significantly elevates CO2 emissions in many Asian countries [30]. Interestingly, China presents a unique case where rapid urban expansion is accompanied by relatively slow growth in per capita CO2 emissions [29]. For example, a study in Jiangsu Province (China) found that total carbon storage decreased by about 14.34 million tons in just 20 years (2000–2020) due to land use change [31]. At the national scale, China’s urban area expanded by 6.87 million ha between 1990 and 2010, resulting in an estimated loss of 142 million tons of carbon from land cover and soil [32]. However, research in the Middle East shows varied outcomes across countries. Urbanization has no significant effect on CO2 emissions in Egypt, while Saudi Arabia and Jordan have exhibited contrasting patterns [33]. In addition, climate change (e.g., drought and rising temperatures) can exacerbate carbon losses through increased wildfires frequency and land degradation [34]. Globally, deforestation and peatland degradation in hot, dry climates significantly reduce carbon storage and have long-term impacts on the carbon cycle [24].
In Vietnam, LUC trends have also affected ecosystem carbon services. Since the Doi Moi and accessions to the WTO, Vietnam has undergone rapid industrialization and urbanization, leading to a decrease in forest areas and an expansion of construction and agricultural land [35]. Recent studies indicate that forest and cropland areas have decreased, while construction land, grasslands, and bare land have increased [36]. Consequently, total forest carbon storage has decreased slightly [37]. Conversions such as tropical deforestation for agriculture are identified as major sources of carbon emissions. For instance, in Central Vietnam, 67% of net carbon emissions from 2001 to 2010 resulted from forest-to-agriculture conversion [38]. Conversely, forest restoration, natural regeneration, and wetland conservation can enhance ecosystem carbon services [37]. Studies on coastal blue carbon in Vietnam also emphasize that mangrove ecosystems store substantial amounts of carbon, yet they are increasingly threatened by aquaculture and sea-level rise [39]. Nevertheless, in Vietnam and especially the Southeast region, research on the combined impacts of LUC and both natural and anthropogenic drivers on carbon ecosystem services remains limited. This lack of understanding hampers accurate assessment of carbon service degradation or recovery in rapidly developing areas such as the Southeast. Addressing this gap, the present study provides a comprehensive assessment of carbon ecosystem dynamics under the combined influences of human activities and natural factors in the region.
Accordingly, this study aims to evaluate how land use change has affected ecosystem carbon services in the Southeast region over three decades (1990–2020). By applying a trajectory-based approach that integrates both anthropogenic and natural processes, the research not only quantifies spatial–temporal variations in carbon storage but also provides scientific evidence for land management and sustainable development policies supporting Vietnam’s commitment to net-zero emissions. The findings are expected to bridge the knowledge gap regarding the linkages among LUC, its driving factors, and carbon services, while providing a scientific foundation for policymaking on land resource management and climate change mitigation in the Southeast and comparative regions.
Moreover, based on the above theoretical background and literature review, this study is guided by the following hypotheses:
H1. 
Urbanization and land reclamation are negatively associated with ecosystem carbon stocks in the Southeast region.
H2. 
Ecological succession and forest restoration have a positive effect on carbon stock recovery.
H3. 
The combined effects of anthropogenic process outweigh the compensatory capacity of natural processes, resulting in a net decline in total carbon storage during 1990–2020.
These hypotheses provide the analytical foundation for examining how human and natural dynamics interact to shape carbon service trajectories in the region.

2. Materials and Methods

2.1. Research Location

The study area is the Southeast region of Vietnam, comprising three administrative units: Tay Ninh, Dong Nai, and Ho Chi Minh City (HCM City). Although it occupies just over 9% of the country’s total land area, the Southeast region contributes approximately one-third of Vietnam’s GDP and over 44% of the national budget revenue [40]. Consequently, it is regarded as the key economic hub of Southern Vietnam and the most urbanized region in the country, with nearly 67% of its population living in urban areas. With a population exceeding 18.8 million people in 2022, the Southeast serves as Vietnam’s largest industrial and service center, yet it also faces intense pressure from urbanization, industrialization, and land use conversion. Ho Chi Minh City and its surrounding metropolitan area have undergone rapid population growth and urban expansion since 1990, intensifying land conversion and pressure on ecosystem carbon services [41]. Ecologically, the Southeast region is both an economically and environmentally significant area. It lies at the transitional boundary between the (old) Central Highlands in the north and the Mekong Delta in the southwest, and it borders the East Sea to the southeast (Figure 1). The region features diverse landscapes, ranging from basaltic volcanic in Tay Ninh and alluvial plains along the Dong Nai-Saigon River to extensive coastal mangrove ecosystems.
The selection of the Southeast as the research area is particularly meaningful because it represents one of Vietnam’s most dynamically developing region and is subject to the most intense land use change pressure nationwide. At the same time, the region still contains carbon-rich ecosystems, and land transformation here have implications not only at the local level but also for achieving Vietnam’s national target of net-zero emissions by 2050. Therefore, analyzing land use change patterns from 1990 to 2020 and their impacts on carbon ecosystem services in the Southeast provides essential scientific evidence for land management and sustainable development policymaking.

2.2. Research Data Collection and Data Analysis

2.2.1. Data Collection

The primary data for this study were obtained from multiple reliable sources and standardized to ensure spatial–temporal consistency. The land use data layer was derived from the ALOS Global Land Use and Land Cover dataset developed by the Japan Aerospace Exploration Agency (JAXA). This dataset has a spatial resolution of 30 m and is based on the ALOS satellite image, providing global land cover information across multiple time points from 1990 to 2020. According to JAXA, the overall classification accuracy exceeds 80%, which is considered sufficient for regional-scale spatial analysis. In this study, the land use data were reclassified into major categories to facilitate the estimation and comparison of carbon ecosystem services.
Administrative boundary data were obtained from the GADM database, which provides official provincial-level administrative boundaries. However, the boundaries were adjusted and updated to reflect the most recent administrative change, as Vietnam has merged and modified several administrative units since July 2025. This update is especially important to ensure that the analytical results align with the current territorial management framework, thereby enhancing the relevance and applicability of the findings for policymaking and land management. All spatial data were processed and analyzed using QGIS version 3.44.1, a powerful open source platform for geospatial analysis. During preprocessing, raster datasets were standardized to a common coordinate reference system, clipped to the administrative extent of the Southeast region and checked for geometric accuracy. Simultaneously, vector data on administrative boundaries were integrated with land use maps to construct a comprehensive GIS database. This workflow ensures the reproducibility of the study and provides a robust foundation for subsequent analytical steps.

2.2.2. Data Analysis

In this study, the amount of carbon stored (Ci) for each land use type i is determined based on the sum of the stocks from four main carbon stores: aboveground biomass, belowground biomass, soil carbon, and dead organic matter. The general formula is presented as follows:
C i = C above,i + C below,i + C soil,i + C dead,i
where Cabove,i is the amount of carbon stored in aboveground biomass. Cbelow,i is the amount stored in belowground biomass. Csoil,i is the soil organic carbon. Cdead,i represents carbon in dead organic matter. The corresponding coefficients are listed in Table 1.
The total regional carbon storage is calculated by multiplying the carbon density of each land use type by its area, then summing, according to Formula (2):
C t o t a l =   i = 1 n C i × A i
Ai is the area (ha) of land use type i.
This approach is inherited from the InVEST model, which is widely applied in international studies on ecosystem services. The advantage is that it allows for spatial and temporal quantification of carbon storage based on land use maps. At the same time, the model can separate the contributions of each carbon store to easily compare the impacts of land use changes on the carbon balance. In addition, in the context of research in the Southeast region, the use of the InVEST model allows for rapid quantification of changes in carbon stocks associated with specific land use types. It is also easy to update when new data is available. As a result, the research results not only closely reflect the current situation but can also be applied to land management and policy making to reduce greenhouse gas emissions.
In addition, the analysis of land use change considers changes between land types in terms of area and relates them to the driving processes that reflect the dynamics of the landscape. Classifying land use change into driving processes not only helps clarify the anthropogenic and natural causes behind land cover changes but also allows for the analysis of the specific impact of each process on carbon ecosystem services. This classification is described in detail in Table 2.

3. Results

3.1. Changes in Land Use

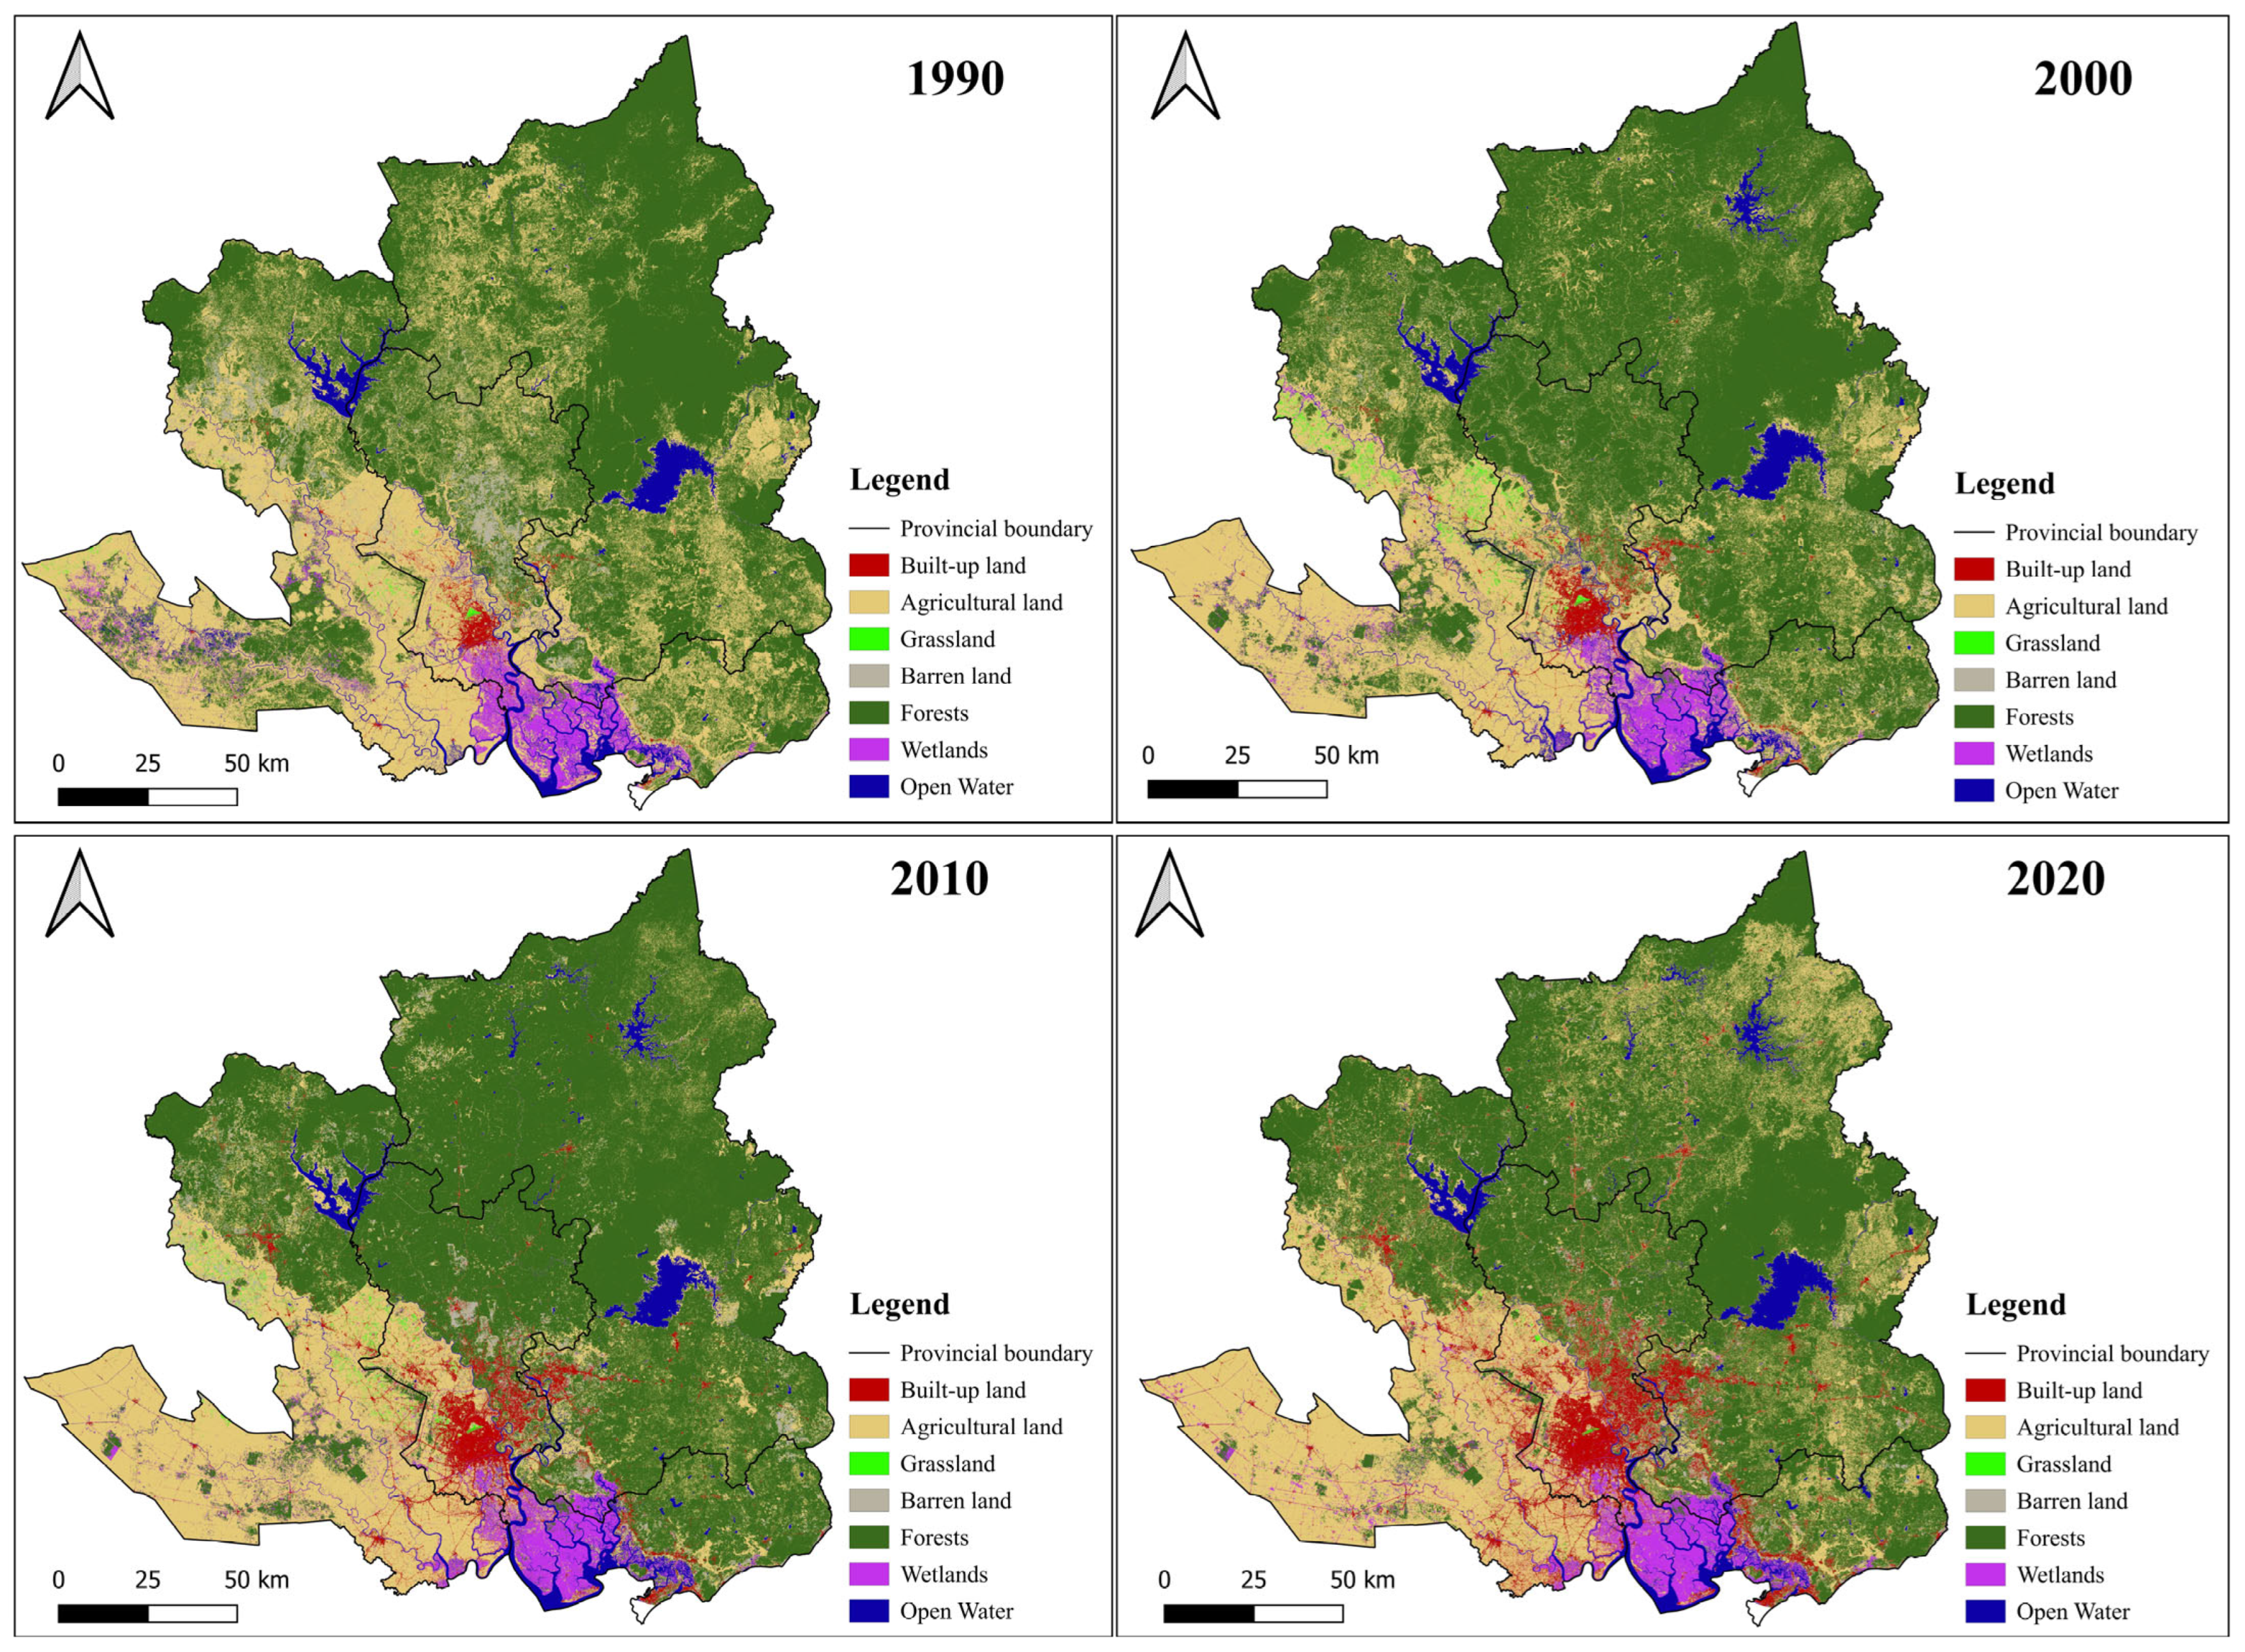
Figure 2 shows that the period 1990–2000 marked initial phase of land transformation in the Southeast region. In 1990, forests areas were clearly dominant, concentrated in the northern and Northeastern parts of the region, accounting for over 52% of the total area. Agricultural land was widely distributed in the central and southwestern areas, representing 36.35% (Appendix A). New construction land only appeared in HCM city and a few local points. By 2000, construction areas had expanded noticeably around HCM city, gradually spreading into adjacent provinces. The urbanization that characterized this decade was accompanied by a localized reduction in both forests and agricultural land. Between 2000 and 2010, urbanization accelerated dramatically, with built-up land expanded rapidly, an increase of approximately 3% compared to 1990. HCM city stood out as the most dynamic area, where built-up land accounted for nearly 8.78% of the total city area, double the proportion recorded in 2000. This urban expansion led to a sharp decrease in agricultural land, which dropped to 26.57%, equivalent to a loss of 150,000 ha within a decade. Interestingly, forest cover reached its highest level during this period, suggesting that while urban growth was concentrated in the core urban areas, several peripheral and northern zones managed to maintain or even increase their forest cover due to conservation and restoration initiatives.
By 2020, urbanization had reached its peak, with built-up areas extending beyond central HCM City into Dong Nai and Tay Ninh provinces. Agricultural land showed a slight recovery compared to 2010, reaching 32.62%, while forests cover declined to 51.49%, lower than the initial level observed in 1990. This pattern indicates growing forest fragmentation. Over the entire 1990–2020 period, the most striking trend was the rapid expansion of built-up land alongside the contraction of agricultural land and the localized decline of forests. These changes reflect the Southeast’s role as Vietnam’s most dynamic economic region but also reveal significant environmental challenges, particularly in maintaining ecosystem services, such as carbon storage. The loss of forest and agricultural land has diminished the region’s capacity for natural climate regulation, while intensified urbanization has contributed to greater emission pressure.

3.2. Land Use Trajectories and Main Driving Processes

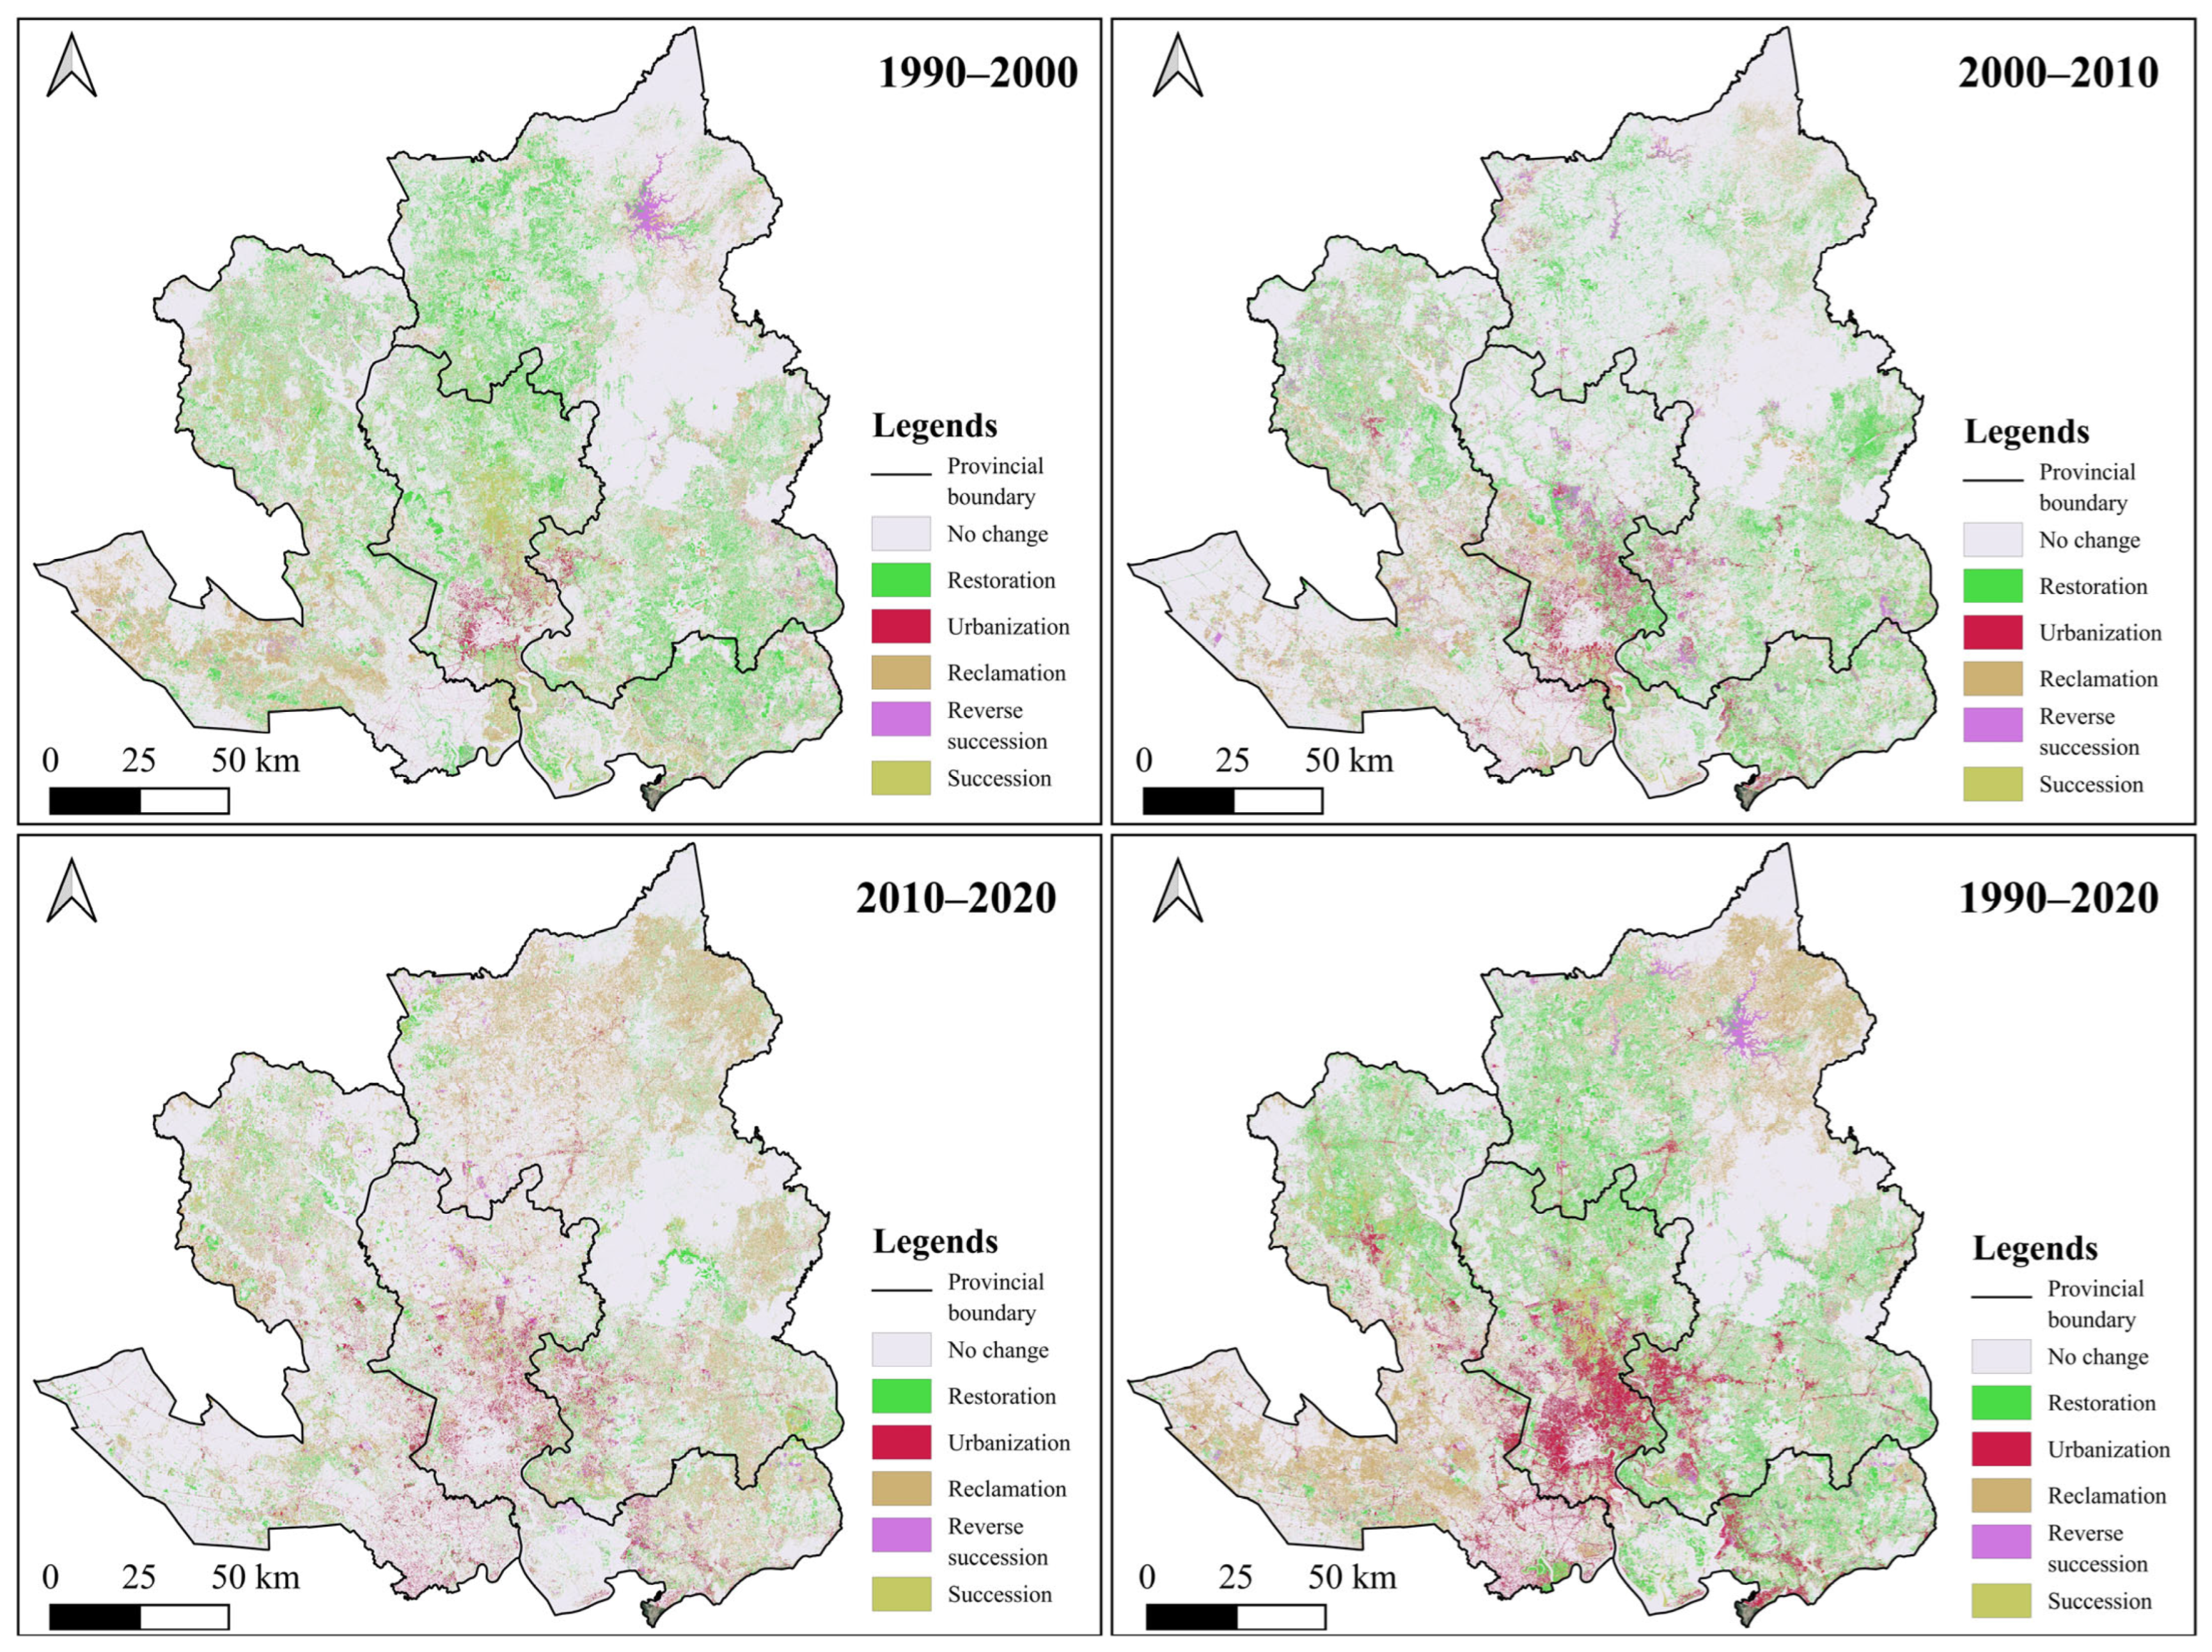
In this study, land use trajectories represent the sequential transitions of land cover types observed at four time points (1990, 2000, 2010, and 2020). This differs from simple area variations, as trajectories capture the continuous direction of change driven by anthropogenic or natural processes such as urbanization, restoration, or succession (Figure 3). During the period 1990–2000, the Southeast region experienced contrasting land use trajectories reflecting the interaction between natural recovery and human-induced transformation. Between 1990 and 2000, land use was relatively stable, with limited urban expansion confined mainly to Ho Chi Minh City. However, early signs of ecological succession and forest restoration emerged in the northern and northeastern parts of the region, particularly in protected areas of Dong Nai and Tay Ninh. These natural processes contributed to a gradual increase in forest cover and carbon storage. The decade 2000–2010 marked an acceleration of urbanization and agricultural reclamation, spreading outward from Ho Chi Minh City toward Dong Nai. Urban areas expanded rapidly along transportation corridors and river basins, resulting in localized forest degradation. At the same time, forest restoration continued in northern subregions, but its spatial extent was not sufficient to offset the loss caused by construction and agricultural conversion.
From 2010 to 2020, urbanization became the dominant trajectory, forming a continuous metropolitan belt linking HCM City with Dong Nai and Tay Ninh. The conversion of forest and agricultural land to built-up areas intensified, while reverse succession and ecological degradation appeared more frequently in forest–agriculture transition zones. Although small patches of succession and restoration persisted, they were spatially scattered and limited in their compensatory role. Overall, the regional landscape over the three decades reflects an increasing dominance of anthropogenic processes, urbanization and reclamation, over natural recovery. These processes have reshaped the spatial configuration of the Southeast region, driving a clear decline in ecological integrity and carbon sequestration potential.

3.3. Carbon Storage

The results presented in Table 3 indicate that total carbon storage in the Southeast region fluctuated significantly during the period 1990–2020. In 1990, the region’s total carbon stock was 475.34 million tons, rising to a peak of 502.48 million tons in 2010 before declining to 462.40 million tons in 2020. This pattern reflects two contrasting periods. An initial period of carbon accumulation driven by forest restoration and ecological succession (1990–2010), followed by a phase of decline associated with rapid urbanization and land conversion (2010–2020).
At the provincial level, Dong Nai consistently held the highest carbon reserves. of its total carbon storage increased from 263.47 million tons in 1990 to 279.86 million tons in 2010, then decreased to 252.22 million tons in 2020. In contrast, HCM City had the lowest carbon stock among the three provinces, rising from 94.20 million tons in 1990 to 107.04 million tons in 2000, and subsequently decreasing to 95.46 million tons in 2020. Tay Ninh maintained a moderate level, increasing slightly from 117.67 million tons in 1990 to 118.93 million tons in 2000, before falling to 114.72 million tons in 2020, reflecting the conversion of forest land to agricultural and industrial crops. Across carbon pools, aboveground biomass was the most dynamic component. Aboveground carbon increased from 198.20 million tons in 1990 to 217.50 million tons in 2010, then decreased to 194.19 million tons in 2020. Belowground biomass followed a similar trajectory, peaking in 2010 before declining again in 2020. In contrast, soil carbon remained relatively stable, fluctuating around 190–200 million tons, suggesting that soil is the most stable carbon reservoir and less affected by short-term changes in vegetation cover. Carbon stored in dead organic matter, however, gradually decreased from 29 million tons in 1990 to 27.36 million tons in 2020, reflecting the reduction of old-growth forests and increasing habitat fragmentation.
Overall, the Southeast region’s carbon storage picture over the past three decades reveals a conflict between recovery and degradation. The period 1990–2010 witnessed ecological recovery and succession, which increased carbon stocks, but since 2010, urbanization, industrialization, and deforestation have reversed this trend. The fact that total carbon storage in 2020 fell below its 1990 level underscores a long-term risk of declining carbon ecosystem services, promote habitat restoration, and implement sustainable land use management strategies to preserve the climate regulation functions of Vietnam’s most dynamically developing region.

4. Discussion

The findings of this study are broadly consistent with previous research on carbon service dynamics but also reveal distinct patterns in the Southeast region. For example, Ngo et al. (2023) [43] used Landsat remote sensing data to estimate biomass and carbon stocks in mangrove forests of Quang Ninh. Their results, along with other international studies, confirm that remote sensing is an effective tool for monitoring carbon changes resulting from land use transition. Similarly, Liu et al. (2025) [37] analyzed nationwide data for Vietnam (2015–2023) and reported an average annual decrease of nearly 0.63% in carbon stock due to deforestation and agricultural land loss. They also emphasized the importance of accurate land use classification for achieving carbon neutrality targets [37]. The downward trend in carbon stock observed in the Southeast from 1990 to 2020 aligns with these warnings, underscoring the risk of declining carbon services as forest areas shrink. However, compared with other regions, the Southeast experiences different magnitudes and types of fluctuations. While Liu et al. (2025) [37] argued that natural factors play a dominant role in land use distribution across Vietnam, this study observed that in the Southeast, human drivers, especially urbanization, are the strongest factors contributing to carbon service decline. This finding is consistent with Zhi et al. (2025) [42], who reported that urbanization and subsequent degradation are the main causes of carbon loss in Nigeria. Thus, compared with previous studies, the present research provides a more comprehensive view of carbon evolution. It not only quantifies the overall decline relative to the general trend but also specifically identifies the processes that trend in the local context.
This study builds upon the methodological foundations of earlier research while expanding both the spatial scope and analytical depth. First, the study covers the entire Southeast region over three decades, unlike earlier studies that focused on a single environment or shorter timeframe. Instead of assessing each land use type individually, expanding the analytical scale to the regional levels enables a multidimensional assessment of socio-economic development. Second, this work pioneers the identification of land use change trajectories based on driving factors. The study employs multi-period land use transition chains to classify natural–anthropogenic trajectories, an approach not used in prior studies. These methods reveal the causes of each landscape alteration and quantify their effects on carbon services. Third, the analysis uniformly applies the ALOS land use dataset for the 1990–2020 milestones, updating both data and management boundaries to ensure intertemporal comparability. Provincial administrative borders are also updated, and the results correspond well with existing management practices, reducing boundary-related errors and enhancing applicability. This presents an improvement over earlier research that relied on outdated boundaries or data, which made comparisons with current management units problematic. The study’s integrated approach and updated data, applied to the Southeast region for the first time, provide a more comprehensive and accurate picture of carbon dynamics.
The findings of this research are consistent with the proposed hypotheses. The results confirm H1 and H3, indicating that urbanization and land reclamation processes have a strong negative impact on carbon storage, while anthropogenic influences overall outweigh the compensatory capacity of natural processes, resulting in a net carbon decline from 1990 to 2020. H2 is partially supported, as ecological succession and forest restoration contribute positively to carbon sequestration but at an insufficient scale to offset human-driven losses. These results reinforce the conclusion that human-induced land transformations are the dominant factor shaping carbon service dynamics in the Southeast region.
In addition, the findings have direct implications for Vietnam’s sustainable development policy and climate strategy, particularly in the context of its commitment to achieving net-zero emissions by 2050. To realize this ambitious goal, land use management and planning in key regions such as the Southeast are crucial. This study clearly highlights the emission pressures resulting from land conversion in the region. Uncontrolled urbanization and industrialization have significantly reduced ecological carbon stocks, resulting in total carbon levels in 2020 being lower than those in 1990. Without strong measures in land management and ecosystem conservation, this most dynamically developing region could become a “hot spot” that hinders the national carbon neutrality target. Conversely, the research results also offer opportunities and policy directions. Firstly, identifying the specific locations and stages of carbon loss enables the allocation of restoration resources to the areas where they are most needed. For example, the suburbs of HCM city and the fringes of industrial zones should be prioritized for afforestation and habitat restoration programs to enhance carbon sequestration services. Second, identifying urbanization as the leading driver of carbon loss suggests that land use policies should aim to control urban expansion, promote smart and low-impact urban development, and strictly protect remaining forest areas. The Southeast region should closely integrate urban and infrastructure planning with forestry planning, ensuring sufficient green space to sustain the region’s CO2 absorption capacity. Overall, this study provides timely scientific evidence for sustainable development policymaking at both regional and national levels. By clarifying the relationship between land use change and carbon services, the study contributes to the formulation of specific land management and ecosystem restoration strategies that support Vietnam’s progress toward its net-zero emissions goal by 2050.
Although a multivariate regression could be used to compare the relative influence of different driving factors on carbon stocks, this study intentionally applied a spatial trajectory-based approach rather than a statistical correlation model. The aim was to capture the dynamic and spatial nature of land use transitions and their cumulative effects on carbon services over time. Regression models are effective for identifying direct linear relationships, but they are limited in reflecting spatial heterogeneity, feedback loops, and non-linear ecological interactions. In contrast, the trajectory classification method used in this study enables a process-oriented understanding of how anthropogenic (e.g., urbanization, reclamation) and natural (e.g., succession, restoration) forces interact to drive carbon stock changes. Future work, however, could integrate regression or machine learning approaches to quantitatively compare the relative weight of each driver under different socio-economic and environmental conditions.

5. Conclusions

The study results provide a clear depiction of carbon service changes in the Southeast region over the past three decades. The total carbon stock in the region showed an increasing trend from 1990 to 2010, driven by ecological succession and certain forest restoration efforts, but declined sharply after 2010 due to identified urbanization, industrialization, and deforestation. This trend illustrates the adverse relationship between rapid socio-economic development and the degradation of ecosystem services, with carbon services serving as a representative indicator. Process-based analysis reveals that urbanization and forest degradation are the direct causes of the most significant carbon losses, particularly in HCM city and the peri-urban areas of Dong Nai and Tay Ninh. In contrast, ecological succession and forest restoration have had positive impacts but remain small in scale and insufficient to offset losses from human-driven processes. The spatial differences among the three provinces also highlight the varying effectiveness of management policies. Dong Nai, with its special-use and protection forests, has maintained a partial carbon balance, while Tay Ninh and HCM city have experienced greater losses due to agricultural land pressure and urbanization. These findings confirm that without timely intervention, the Southeast region will continue to face a serious decline in carbon storage and sequestration capacity, thereby making it difficult to achieve the national emission reduction target. This study not only sheds light on the mechanisms and trajectories of carbon change but also underscores the urgency of integrating ecosystem service management into land use planning, especially in key economic zones.
The research applied a long-term land use trajectory approach linked to driving processes, thereby quantifying for the first time the impact of each type of landscape transformation on carbon stocks in the Southeast region. The integrated approach, combined with updated dataset (ALOS 1990–2020 maps and revised administrative boundaries), provided a more comprehensive and realistic representation of carbon dynamics in the region. These findings offer timely scientific evidence to inform sustainable development policymaking. Accordingly, to contribute to Vietnam’s goal of achieving net-zero emissions by 2050, the Southeast region should prioritize strict control of urbanization, protect existing forest areas, and restore degraded ecosystems to enhance future carbon sequestration capacity.
This study has several limitations that should be acknowledged. First, the estimation of carbon stock relied on secondary data and standardized coefficients from international datasets (e.g., ALOS, InVEST), which may not fully represent local variations in vegetation density or soil carbon. Second, due to data availability, socio-economic variables such as population growth, industrial expansion, and income levels were not explicitly included, although they are likely to influence land use dynamics. Third, the classification of land use trajectories was based on discrete temporal snapshots (1990–2000–2010–2020), which may overlook short-term transitions within each decade. Future research could improve upon these aspects by integrating field-based carbon measurements, high-resolution remote sensing data, and spatio-temporal modeling techniques to better capture fine-scale variations. In addition, combining the trajectory approach with statistical or machine learning models would enable a more comprehensive understanding of the interaction between human and natural drivers, thereby enhancing policy relevance for carbon-neutral land management.

Funding

This research received no external funding.

Data Availability Statement

The original contributions presented in this study are included in the article. Further inquiries can be directed to the corresponding author.

Acknowledgments

To make this article more complete, the author would like to thank the reviewers’ comments and editing of this work.

Conflicts of Interest

The author declares no conflicts of interest.

Appendix A

Table A1. Land use statistics in study areas.
CategoriesBuilt-Up LandAgricultural LandGrass LandBare LandForestsWetlandOpen WaterTotal
1990Dong Naiha1746.90306,128.520.0915,154.83940,900.955581.3537,261.801,306,774.44
%0.1323.430.001.1672.000.432.85100.00
Ho Chi Minhha16,628.13256,334.491367.9139,457.53266,915.8856,193.8447,925.27684,823.05
%2.4337.430.205.7638.988.217.00100.00
Tay Ninhha3852.63479,036.973507.7531,789.89284,587.8328,450.6242,633.45873,859.14
%0.4454.820.403.6432.573.264.88100.00
Totalha22,227.661,041,499.984875.7586,402.251,492,404.6690,225.81127,820.522,865,456.63
%0.7836.350.173.0252.083.154.46100.00
2000Dong Naiha5018.40225,131.8513.6814,311.441,009,415.974946.2247,915.461,306,753.02
%0.3817.230.001.1077.250.383.67100.00
Ho Chi Minhha29,214.90190,388.973535.2015,844.05344,593.6252,597.0848,607.38684,781.20
%4.2727.800.522.3150.327.687.10100.00
Tay Ninhha6315.30500,393.3411,522.5212,460.32282,525.9322,253.0438,366.82873,837.27
%0.7257.261.321.4332.332.554.39100.00
Totalha40,548.60915,914.1615,071.4042,615.811,636,535.5279,796.34134,889.662,865,371.49
%1.4231.960.531.4957.112.784.71100.00
2010Dong Naiha14,673.60147,666.331.8026,381.431,064,181.336646.6847,223.271,306,774.44
%1.1211.300.002.0281.440.513.61100.00
Ho Chi Minhha60,145.11125,882.823407.4030,703.50363,330.4555,785.1545,568.62684,823.05
%8.7818.380.504.4853.058.156.65100.00
Tay Ninhha22,492.53487,880.1910,250.8227,660.96274,529.8824,734.2526,310.51873,859.14
%2.5755.831.173.1731.422.833.01100.00
Totalha97,311.24761,429.3413,660.0284,745.891,702,041.6687,166.08119,102.402,865,456.63
%3.4026.570.482.9659.403.044.16100.00
2020Dong Naiha32,209.11291,163.50232.4720,404.71899,169.849670.2353,924.581,306,774.44
%2.4622.280.021.5668.810.744.13100.00
Ho Chi Minhha90,836.55152,091.271561.7726,670.96307,770.9364,491.9341,399.64684,823.05
%13.2622.210.233.8944.949.426.05100.00
Tay Ninhha47,241.72491,458.863925.359863.91268,371.2729,017.3523,980.68873,859.14
%5.4156.240.451.1330.713.322.74100.00
Totalha170,287.38934,713.635719.5956,939.581,475,312.04103,179.51119,304.902,865,456.63
%5.9432.620.201.9951.493.604.16100.00
Source: author’s calculations, 2025.

References

  1. Gurgel, A.C.; Reilly, J.; Blanc, E. Agriculture and forest land use change in the continental United States: Are there tipping points? iScience 2021, 24, 102772. [Google Scholar] [CrossRef]
  2. Robinson, G.M. Global sustainable agriculture and land management systems. Geogr. Sustain. 2024, 5, 637–646. [Google Scholar] [CrossRef]
  3. Fu, M.; Jiao, L.; Su, J. Urban land system change: Spatial heterogeneity and driving factors of land use intensity in Wuhan, China. Habitat Int. 2025, 159, 103380. [Google Scholar] [CrossRef]
  4. Schirpke, U.; Tasser, E.; Borsky, S.; Braun, M.; Eitzinger, J.; Gaube, V.; Getzner, M.; Glatzel, S.; Gschwantner, T.; Kirchner, M.; et al. Past and future impacts of land-use changes on ecosystem services in Austria. J. Environ. Manag. 2023, 345, 118728. [Google Scholar] [CrossRef] [PubMed]
  5. Zhu, L.; Song, R.; Sun, S.; Li, Y.; Hu, K. Land use/land cover change and its impact on ecosystem carbon storage in coastal areas of China from 1980 to 2050. Ecol. Indic. 2022, 142, 109178. [Google Scholar] [CrossRef]
  6. Lei, X.; Zhou, Y.; Huo, P. Impacts of multi-scenario land use change on carbon storage and its economic value in the Qilian Mountains Region, China. J. Nat. Conserv. 2025, 88, 127042. [Google Scholar] [CrossRef]
  7. Xu, Z.; Peng, J. Recognizing ecosystem service’s contribution to SDGs: Ecological foundation of sustainable development. Geogr. Sustain. 2024, 5, 511–525. [Google Scholar] [CrossRef]
  8. Winkler, K.; Fuchs, R.; Rounsevell, M.; Herold, M. Global land use changes are four times greater than previously estimated. Nat. Commun. 2021, 12, 2501. [Google Scholar] [CrossRef] [PubMed]
  9. Afuye, G.A.; Nduku, L.; Kalumba, A.M.; Santos, C.A.G.; Orimoloye, I.R.; Ojeh, V.N.; Thamaga, K.H.; Sibandze, P. Global trend assessment of land use and land cover changes: A systematic approach to future research development and planning. J. King Saud Univ. Sci. 2024, 36, 103262. [Google Scholar] [CrossRef]
  10. Semenchuk, P.; Plutzar, C.; Kastner, T.; Matej, S.; Bidoglio, G.; Erb, K.-H.; Essl, F.; Haberl, H.; Wessely, J.; Krausmann, F.; et al. Relative effects of land conversion and land-use intensity on terrestrial vertebrate diversity. Nat. Commun. 2022, 13, 615. [Google Scholar] [CrossRef]
  11. Cabernard, L.; Pfister, S.; Hellweg, S. Biodiversity impacts of recent land-use change driven by increases in agri-food imports. Nat. Sustain. 2024, 7, 1512–1524. [Google Scholar] [CrossRef]
  12. Ma, S.; Wang, L.-J.; Jiang, J.; Zhao, Y.-G. Land use/land cover change and soil property variation increased flood risk in the black soil region, China, in the last 40 years. Environ. Impact Assess. Rev. 2024, 104, 107314. [Google Scholar] [CrossRef]
  13. Lang, Y.; Chao, H.; Xiao, J. The Relationship Between Carbon Emissions and Ecosystem Services in Guangdong Province, China: The Perspective of Ecological Function Zones. Land 2024, 13, 2227. [Google Scholar] [CrossRef]
  14. Wang, R.-Y.; Mo, X.; Ji, H.; Zhu, Z.; Wang, Y.-S.; Bao, Z.; Li, T. Comparison of the CASA and InVEST models’ effects for estimating spatiotemporal differences in carbon storage of green spaces in megacities. Sci. Rep. 2024, 14, 5456. [Google Scholar] [CrossRef]
  15. Shao, Y.; Yuan, X.; Ma, C.; Ma, R.; Ren, Z. Quantifying the Spatial Association between Land Use Change and Ecosystem Services Value: A Case Study in Xi’an, China. Sustainability 2020, 12, 4449. [Google Scholar] [CrossRef]
  16. Jia, Z.; Wang, X.; Feng, X.; Ma, J.; Wang, X.; Zhang, X.; Zhou, J.; Sun, Z.; Yao, W.; Tu, Y. Exploring the spatial heterogeneity of ecosystem services and influencing factors on the Qinghai Tibet Plateau. Ecol. Indic. 2023, 154, 110521. [Google Scholar] [CrossRef]
  17. Ali, R.; Bakhsh, K.; Yasin, M.A. Impact of urbanization on CO2 emissions in emerging economy: Evidence from Pakistan. Sustain. Cities Soc. 2019, 48, 101553. [Google Scholar] [CrossRef]
  18. Wang, W.-Z.; Liu, L.-C.; Liao, H.; Wei, Y.-M. Impacts of urbanization on carbon emissions: An empirical analysis from OECD countries. Energy Policy 2021, 151, 112171. [Google Scholar] [CrossRef]
  19. Deng, L.; Li, Y.; Cao, Z.; Hao, R.; Wang, Z.; Zou, J.; Wu, Q.; Qiao, J. Revealing Impacts of Human Activities and Natural Factors on Dynamic Changes of Relationships among Ecosystem Services: A Case Study in the Huang-Huai-Hai Plain, China. Int. J. Environ. Res. Public Health 2022, 19, 10230. [Google Scholar] [CrossRef] [PubMed]
  20. Limazie, M.S.; Woni, S. Foreign direct investment and carbon emissions in ECOWAS: Does good governance matter? J. Econ. Dev. 2024, 26, 139–153. [Google Scholar] [CrossRef]
  21. Tuan, N.T. Comparing the process of converting land use purposes between socio-economic regions in Vietnam from 2007 to 2020. Environ. Socio-Econ. Stud. 2024, 12, 51–62. [Google Scholar] [CrossRef]
  22. Yuan, W.; Xia, J.; Song, C.; Wang, Y.-P. Simulating the land carbon sink: Progresses and challenges of terrestrial ecosystem models. Agric. For. Meteorol. 2024, 358, 110264. [Google Scholar] [CrossRef]
  23. Qin, Z.; Zhu, Y.; Canadell, J.G.; Chen, M.; Li, T.; Mishra, U.; Yuan, W. Global spatially explicit carbon emissions from land-use change over the past six decades (1961–2020). One Earth 2024, 7, 835–847. [Google Scholar] [CrossRef]
  24. Liu, M.; Chen, Y.; Chen, K.; Chen, Y. Progress and Hotspots of Research on Land-Use Carbon Emissions: A Global Perspective. Sustainability 2023, 15, 7245. [Google Scholar] [CrossRef]
  25. Jia, L. China’s Large-Scale Afforestation Captured 400 m Tons of CO2 Annually over Past 40 Years: Report. 2023. Available online: https://english.cas.cn/newsroom/cas_media/202307/t20230726_333927.shtml (accessed on 15 July 2025).
  26. Baccini, A.; Goetz, S.J.; Walker, W.S.; Laporte, N.T.; Sun, M.; Sulla-Menashe, D.; Hackler, J.; Beck, P.S.A.; Dubayah, R.; Friedl, M.A.; et al. Estimated carbon dioxide emissions from tropical deforestation improved by carbon-density maps. Nat. Clim. Chang. 2012, 2, 182–185. [Google Scholar] [CrossRef]
  27. Ritchie, H. Carbon Emissions from Deforestation: Are They Driven by Domestic Demand or International Trade? 2021. Available online: https://ourworldindata.org/carbon-deforestation-trade (accessed on 15 July 2025).
  28. Sasmito, S.D.; Taillardat, P.; Adinugroho, W.C.; Krisnawati, H.; Novita, N.; Fatoyinbo, L.; Friess, D.A.; Page, S.E.; Lovelock, C.E.; Murdiyarso, D.; et al. Half of land use carbon emissions in Southeast Asia can be mitigated through peat swamp forest and mangrove conservation and restoration. Nat. Commun. 2025, 16, 740. [Google Scholar] [CrossRef]
  29. Luqman, M.; Rayner, P.J.; Gurney, K.R. On the impact of urbanisation on CO2 emissions. NPJ Urban Sustain. 2023, 3, 6. [Google Scholar] [CrossRef]
  30. Yazdi, S.K.; Dariani, A.G. CO2 emissions, urbanisation and economic growth: Evidence from Asian countries. Econ. Res. Istraz. 2019, 32, 510–530. [Google Scholar] [CrossRef]
  31. Xiong, Z.; Zhang, Y.; Liu, M.; Gao, Y.; Gu, T. Assessing land urbanization and ecological planning impact on carbon stock and its economic value from coupled InVEST-PLUS models. Sci. Rep. 2025, 15, 30494. [Google Scholar] [CrossRef]
  32. Lai, L.; Huang, X.; Yang, H.; Chuai, X.; Zhang, M.; Zhong, T.; Chen, Z.; Chen, Y.; Wang, X.; Thompson, J.R. Carbon emissions from land-use change and management in China between 1990 and 2010. Sci. Adv. 2016, 2, e1601063. [Google Scholar] [CrossRef] [PubMed]
  33. Aldegheishem, A. The relationship between urbanization, energy consumption, economic growth, and carbon dioxide emissions in middle eastern countries: Saudi Arabia, Jordan and Egypt. Environ. Res. Commun. 2024, 6, 065011. [Google Scholar] [CrossRef]
  34. Nguyen, T.T.; Grote, U.; Neubacher, F.; Rahut, D.B.; Do, M.H.; Paudel, G.P. Security risks from climate change and environmental degradation: Implications for sustainable land use transformation in the Global South. Curr. Opin. Environ. Sustain. 2023, 63, 101322. [Google Scholar] [CrossRef]
  35. Tuan, N.T. Urbanization and land use change: A study in Vietnam. Environ. Socio-Econ. Stud. 2022, 10, 19–29. [Google Scholar] [CrossRef]
  36. Niu, X.; Hu, Y.; Lei, Z.; Yan, H.; Ye, J.; Wang, H. Temporal and Spatial Evolution Characteristics and Its Driving Mechanism of Land Use/Cover in Vietnam from 2000 to 2020. Land 2022, 11, 920. [Google Scholar] [CrossRef]
  37. Liu, Y.; Yang, K.; Peng, Z.; Zou, T.; Su, D.; Sun, R.; Ma, J. Land use and land cover classification and terrestrial ecosystem carbon storage changes in Vietnam based on Sentinel images. Sci. Rep. 2025, 15, 22114. [Google Scholar] [CrossRef] [PubMed]
  38. Avitabile, V.; Schultz, M.; Herold, N.; de Bruin, S.; Pratihast, A.K.; Manh, C.P.; Quang, H.V.; Herold, M. Carbon emissions from land cover change in Central Vietnam. Carbon Manag. 2016, 7, 333–346. [Google Scholar] [CrossRef]
  39. Jamilah, M.; Becker, A.; Lee, S.L.; Quiros, T.A.L.; Chee, S.Y.; Evans, C.; Tan, Y.Y.; Ti, L.L.; Pishal, I.; Then, A.Y.H. Socioeconomic impacts linked to land use and land use changes affecting blue carbon ecosystems in Southeast Asia: A systematic map. Ocean Coast. Manag. 2025, 267, 107643. [Google Scholar] [CrossRef]
  40. Le, P. Chỉ Chiếm 9% Diện Tích Nhưng 1 Vùng Đóng Góp 1/3 GDP và Hơn 44% Nguồn Thu Ngân Sách Cả Nước. 2024. Available online: https://cafef.vn/chi-chiem-9-dien-tich-nhung-1-vung-dong-gop-1-3-gdp-va-hon-44-nguon-thu-ngan-sach-ca-nuoc-188240812094639636.chn (accessed on 15 July 2025).
  41. Tuan, N.T.; Hegedűs, G.; Phuong, N.T.T. Urbanization and forecast possibilities of land use changes by 2050: New evidence in Ho Chi Minh city, Vietnam. Open Agric. 2025, 10, 20250421. [Google Scholar] [CrossRef]
  42. Zhi, L.; Abdullahi, U.; Zhang, Q.; Wang, X.; Li, X. Dynamics of Ecosystem Services Driven by Land Use Change Under Natural and Anthropogenic Driving Trajectories in the Kaduna River Basin, Nigeria. Land 2025, 14, 706. [Google Scholar] [CrossRef]
  43. Ngo, D.; Nguyen, H.; Nguyen, K.; Dang, C.; Nguyen, H.; Dang, N.; Pham, T. Application of multispectral UAV to estimate mangrove biomass in Vietnam: A case study in Dong Rui commune, Quang Ninh Province. One Ecosyst. 2023, 8, e103760. [Google Scholar] [CrossRef]
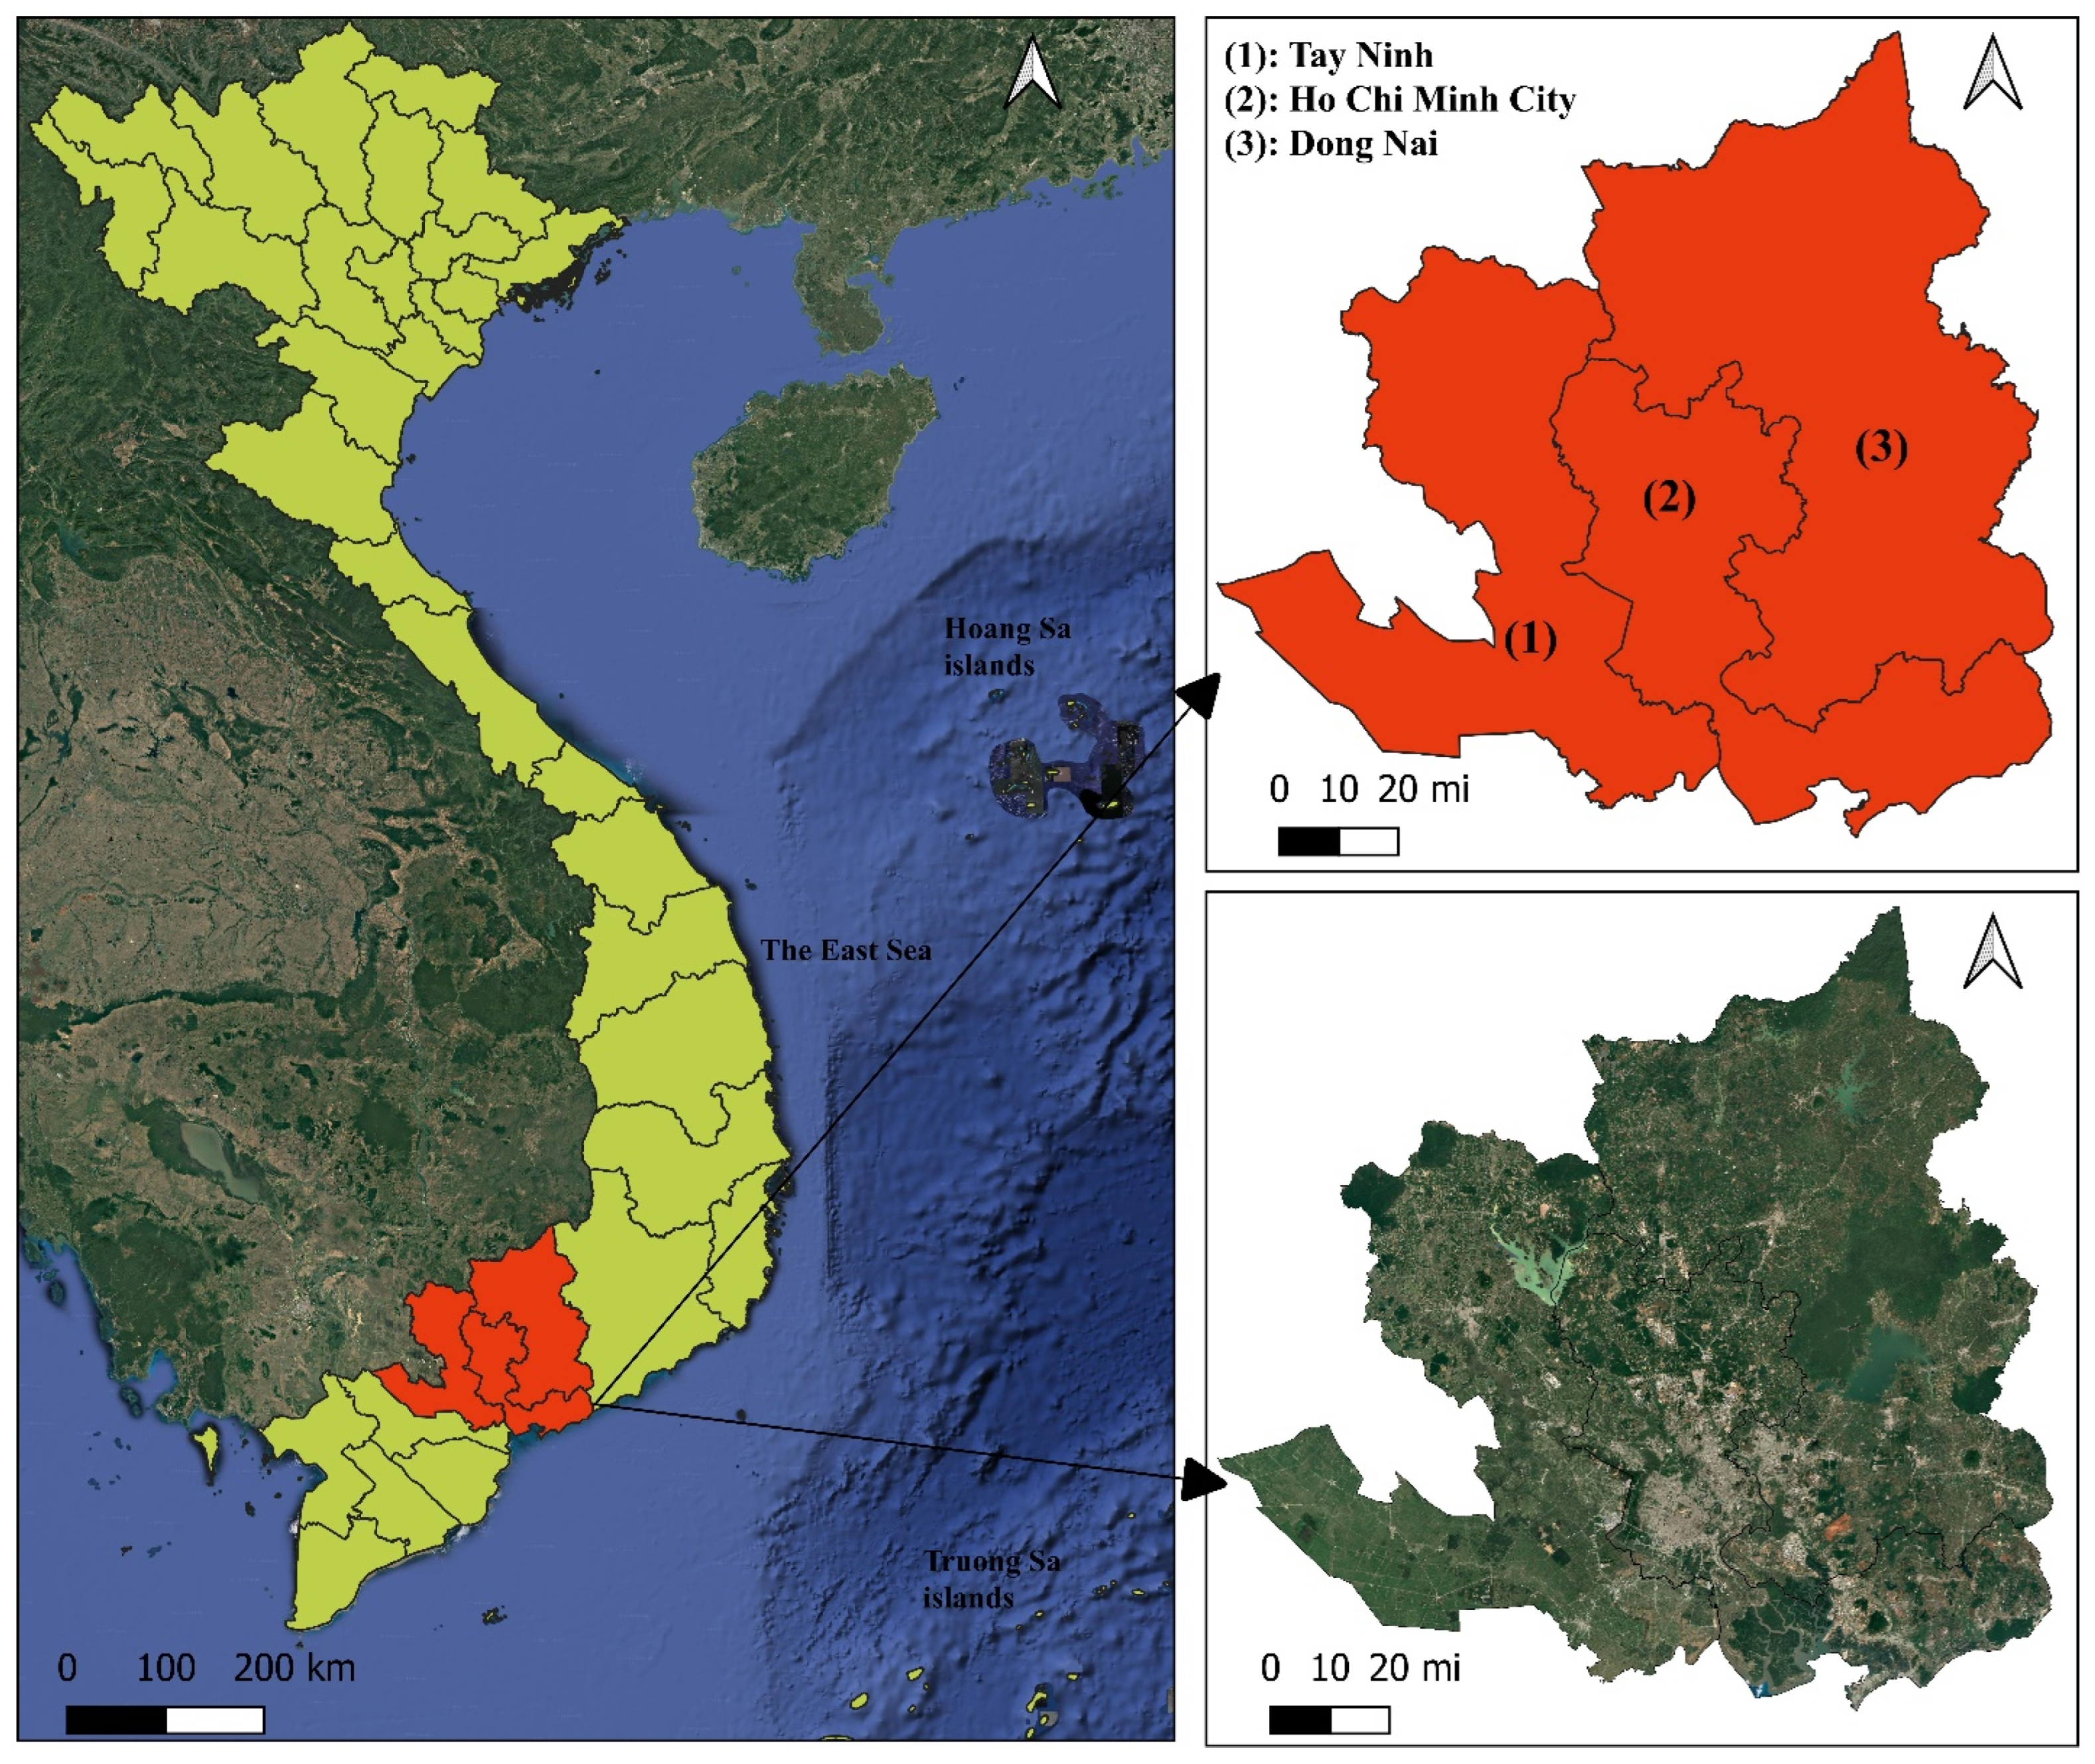
Figure 1. Study areas. Source: author’s compilation, 2025.
Geographies 05 00062 g001
Figure 2. Spatial distribution of land use in the Southeast region. Source: author’s compilation, 2025.
Geographies 05 00062 g002
Figure 3. Land use trajectories in the Southeast region, 1990–2020. Source: author’s compilation, 2025.
Geographies 05 00062 g003
Table 1. Carbon Pool coefficients by Land Use Type.
CodeLand Use TypeCabove (t/ha)Cbelow (t/ha)Csoil (t/ha)Cdead (t/ha)
1Built-up land0070
2Agricultural land208.550.2313.95
3Grass land17.314.0723.613.95
4Bare land0117.70
5Forests118.1927.7793.629.62
6Wetland1023.419.80
7Open Water0000
Source: Zhi et al., 2025 [42].
Table 2. Classification of land use change driving processes.
Driving ProcessLand Use ChangeDriving Process Properties
Urbanization2, 3, 4, 5, 6–1 Anthropogenic
Succession4–3, 5, 6, 7; 3–5, 6, 7; 5–6, 7; 7–5, 6 Natural
Restoration2–3, 4, 5, 6, 7; 1–2, 3, 4, 5, 6, 7Natural and Anthropogenic
Reverse succession3, 5–4; 5–3, 6; 6–3, 4; 7–3, 4 Natural
Reclamation3, 4, 5, 6, 7–2 Anthropogenic
Source: Zhi et al., 2025 [42].
Table 3. Carbon Storage in pools and locality.
Categories1990 (Million Tons)
C_aboveC_belowC_soilC_deadC
Dong Nai117.3828.88103.8513.35263.47
HCM city37.2610.9539.826.1794.20
Tay Ninh43.5612.6951.949.48117.67
Total198.2052.51195.6229.00475.34
2000 (Million Tons)
Dong Nai123.8630.08106.2012.88273.01
HCM city45.1212.4543.436.03107.04
Tay Ninh43.8212.6852.569.87118.93
Total212.8055.20202.1928.78498.97
2010 (Million Tons)
Dong Nai128.8030.99107.7512.33279.86
HCM city46.0812.5142.495.31106.38
Tay Ninh42.6312.4251.599.60116.23
Total217.5055.92201.8227.24502.48
2020 (Million Tons)
Dong Nai112.2027.6999.5912.74252.22
HCM city40.0911.3838.875.1195.46
Tay Ninh41.9112.3350.989.50114.72
Total194.1951.41189.4527.36462.40
Source: author’s calculations, 2025.
Disclaimer/Publisher’s Note: The statements, opinions and data contained in all publications are solely those of the individual author(s) and contributor(s) and not of MDPI and/or the editor(s). MDPI and/or the editor(s) disclaim responsibility for any injury to people or property resulting from any ideas, methods, instructions or products referred to in the content.