Article

Strategic Ground Data Planning for Efficient Crop Classification Using Remote Sensing and Mobile-Based Survey Tools

by
Ramavenkata Mahesh Nukala
1,
Pranay Panjala
2,
Vazeer Mahammood
1 and
Murali Krishna Gumma
2,*
1
Faculty of Geo-Engineering, Andhra University, Visakhapatnam 530003, India
2
Digital Agriculture and Geospatial Sciences, International Crops Research Institute for the Semi-Arid Tropics (ICRISAT), Hyderabad 502324, India
*
Author to whom correspondence should be addressed.
Geographies 2025, 5(4), 59; https://doi.org/10.3390/geographies5040059
Submission received: 31 July 2025 / Revised: 19 September 2025 / Accepted: 1 October 2025 / Published: 15 October 2025

Abstract

Reliable and representative ground data is fundamental for accurate crop classification using satellite imagery. This study demonstrates a structured approach to ground truth planning in the Bareilly district, Uttar Pradesh, where wheat is the dominant crop. Pre-season spectral clustering of Sentinel-2 Level-2A NDVI time-series data (November–March) was applied to identify ten spectrally distinct zones across the district, capturing phenological and land cover variability. These clusters were used at the village level to guide spatially stratified and optimized field sampling, ensuring coverage of heterogeneous and agriculturally significant areas. A total of 197 ground truth points were collected using the iCrops mobile application, enabling standardized and photo-validated data collection with offline functionality. The collected ground observations formed the basis for random forest supervised classification, enabling clear differentiation between major land use and land cover (LULC) classes with an overall accuracy of 91.6% and a Kappa coefficient of 0.886. The findings highlight that systematic ground data collection significantly enhances the reliability of remote sensing-based crop mapping. The outputs serve as a valuable resource for agricultural planners, policymakers, and local stakeholders by supporting crop monitoring, land use planning, and informed decision-making in the context of sustainable agricultural development.

1. Introduction

Accurate and timely information on crop types and land use patterns is essential for effective agricultural planning, food security assessment, and sustainable natural resource management. With the rapid evolution of satellite remote sensing technologies, there has been a growing emphasis on data-driven, automated approaches for large-scale crop monitoring and classification. Among these, supervised classification techniques using high-resolution optical imagery have emerged as powerful tools for mapping cropland and identifying dominant crop types at regional and national scales. Earth observation and geospatial technologies play a vital role in environmental monitoring and sustainable agriculture [1,2,3]. Satellite imagery enables reliable large-scale assessment of agricultural areas [4] and, when combined with climate and socioeconomic data, helps identify productivity gaps [5].
Remote sensing offers consistent and cost-effective crop monitoring [6,7,8] and is widely used in land use/land cover (LULC) mapping across scales [9]. However, global products like GLC2000 and GCEP30 lack detailed crop-type classification [10,11,12]. Crop classification techniques range from time-series vegetation indices to advanced machine learning models such as RF, SVM, and ANN [13,14]. While these methods offer high accuracy, they often require extensive training data [15]. Spectral Matching Techniques (SMT) can reduce this need and have been effective in mapping crops, cropping systems, irrigation sources, and stress-prone areas [16]. Cloud platforms like Google Earth Engine (GEE) further support large-scale, real-time agricultural monitoring [17,18].
However, the accuracy of supervised classification models is largely dependent on the quality, completeness, and spatial representativeness of ground truth data used for training and validation. Inaccurate, sparse, or spatially biased reference data can significantly impair classification performance, leading to unreliable land use maps and flawed agricultural or environmental policy decisions. Traditional approaches often rely on ground data collected from easily accessible or arbitrary locations, resulting in sparse coverage and spatial bias [19]. These inconsistencies reduce the representativeness of training data and negatively affect classification accuracy, especially in heterogeneous landscapes. These limitations are further compounded by inconsistencies in field protocols, non-standardized attribute recording, and a lack of precise spatial referencing.
Recent studies have highlighted the need for structured and systematic field data collection frameworks that are informed by remote sensing insights. One promising approach involves the unsupervised clustering of time-series vegetation indices, such as the Normalized Difference Vegetation Index (NDVI), to identify spectrally distinct zones prior to field campaigns. These clusters can guide sampling strategies and ensure representative coverage of all major land cover classes, thereby improving the robustness and generalizability of classification models.
Real-time spatial information on crop patterns plays a vital role for government departments, helping them make informed decisions on procurement, farmer guidance, crop area assessment, and production forecasts [20,21,22,23,24,25]. Presenting agricultural insights through real-time dashboards not only enhances transparency but also supports more sustainable and efficient food production [26,27,28,29]. The integration of mobile-based applications in field data collection offers a scalable and standardized way to improve data quality [30,31,32]. In this study, we used ICRISAT’s in-house developed iCrops application (ICRISAT, India), which supports offline data collection, automatic GPS tagging, predefined forms for crop attributes, and integration with spatial layers. The Global Navigation Satellite System (GNSS) was employed during sampling via the built-in GPS receivers of Android smartphones (typically dual-band: GPS + GLONASS), with the iCrops app recording an average horizontal accuracy of 3–5 m under open-sky conditions. Tools such as Open Data Kit (ODK) and Kobo Toolbox have also been widely used in agricultural monitoring [33,34,35,36,37] to ensure consistency, geolocation accuracy, and data completeness under field conditions with limited connectivity.
Despite notable advancements in remote sensing and machine learning for agricultural monitoring, a critical gap remains: the absence of an operational, end-to-end framework that integrates spectral clustering, spatially optimized sampling, and standardized, scalable ground data collection protocols. The objective of this study is to develop a systematic approach for crop mapping in the Bareilly district, Uttar Pradesh. We use Sentinel-2 NDVI time-series imagery to generate spectral clusters that guide the selection of representative ground-truth points. These clusters ensure that sampling captures the spectral and spatial variability of the landscape. The collected field data are then integrated into a Random Forest classification model to produce a land use/land cover map with a focus on rabi crops. This approach addresses two persistent challenges in existing mapping efforts: the lack of representative and standardized field data and reduced classification accuracy in heterogeneous agricultural regions.

2. Materials and Methods

2.1. Study Area

The Bareilly district in Uttar Pradesh, situated on the Ganges River plain between 28°8′ and 28°58′ North latitude and 78°58′ and 79°47′ East longitude, experiences a monsoon-influenced climate with an average annual precipitation of 800–900 mm (Figure 1). The region’s fertile alluvial soils support a thriving agricultural sector, with wheat, rice, sugarcane, pulses, oilseeds, and vegetables being the primary crops.
The district’s temperature variations, ranging from hot summers exceeding 40 degrees Celsius to cool winters between 4 and 20 degrees Celsius, contribute to the cultivation of a diverse range of crops. With the adoption of modern agricultural practices and irrigation facilities, including canals and tube wells, the Bareilly district plays a crucial role in Uttar Pradesh’s agricultural landscape and agricultural productivity.

2.2. Methodology

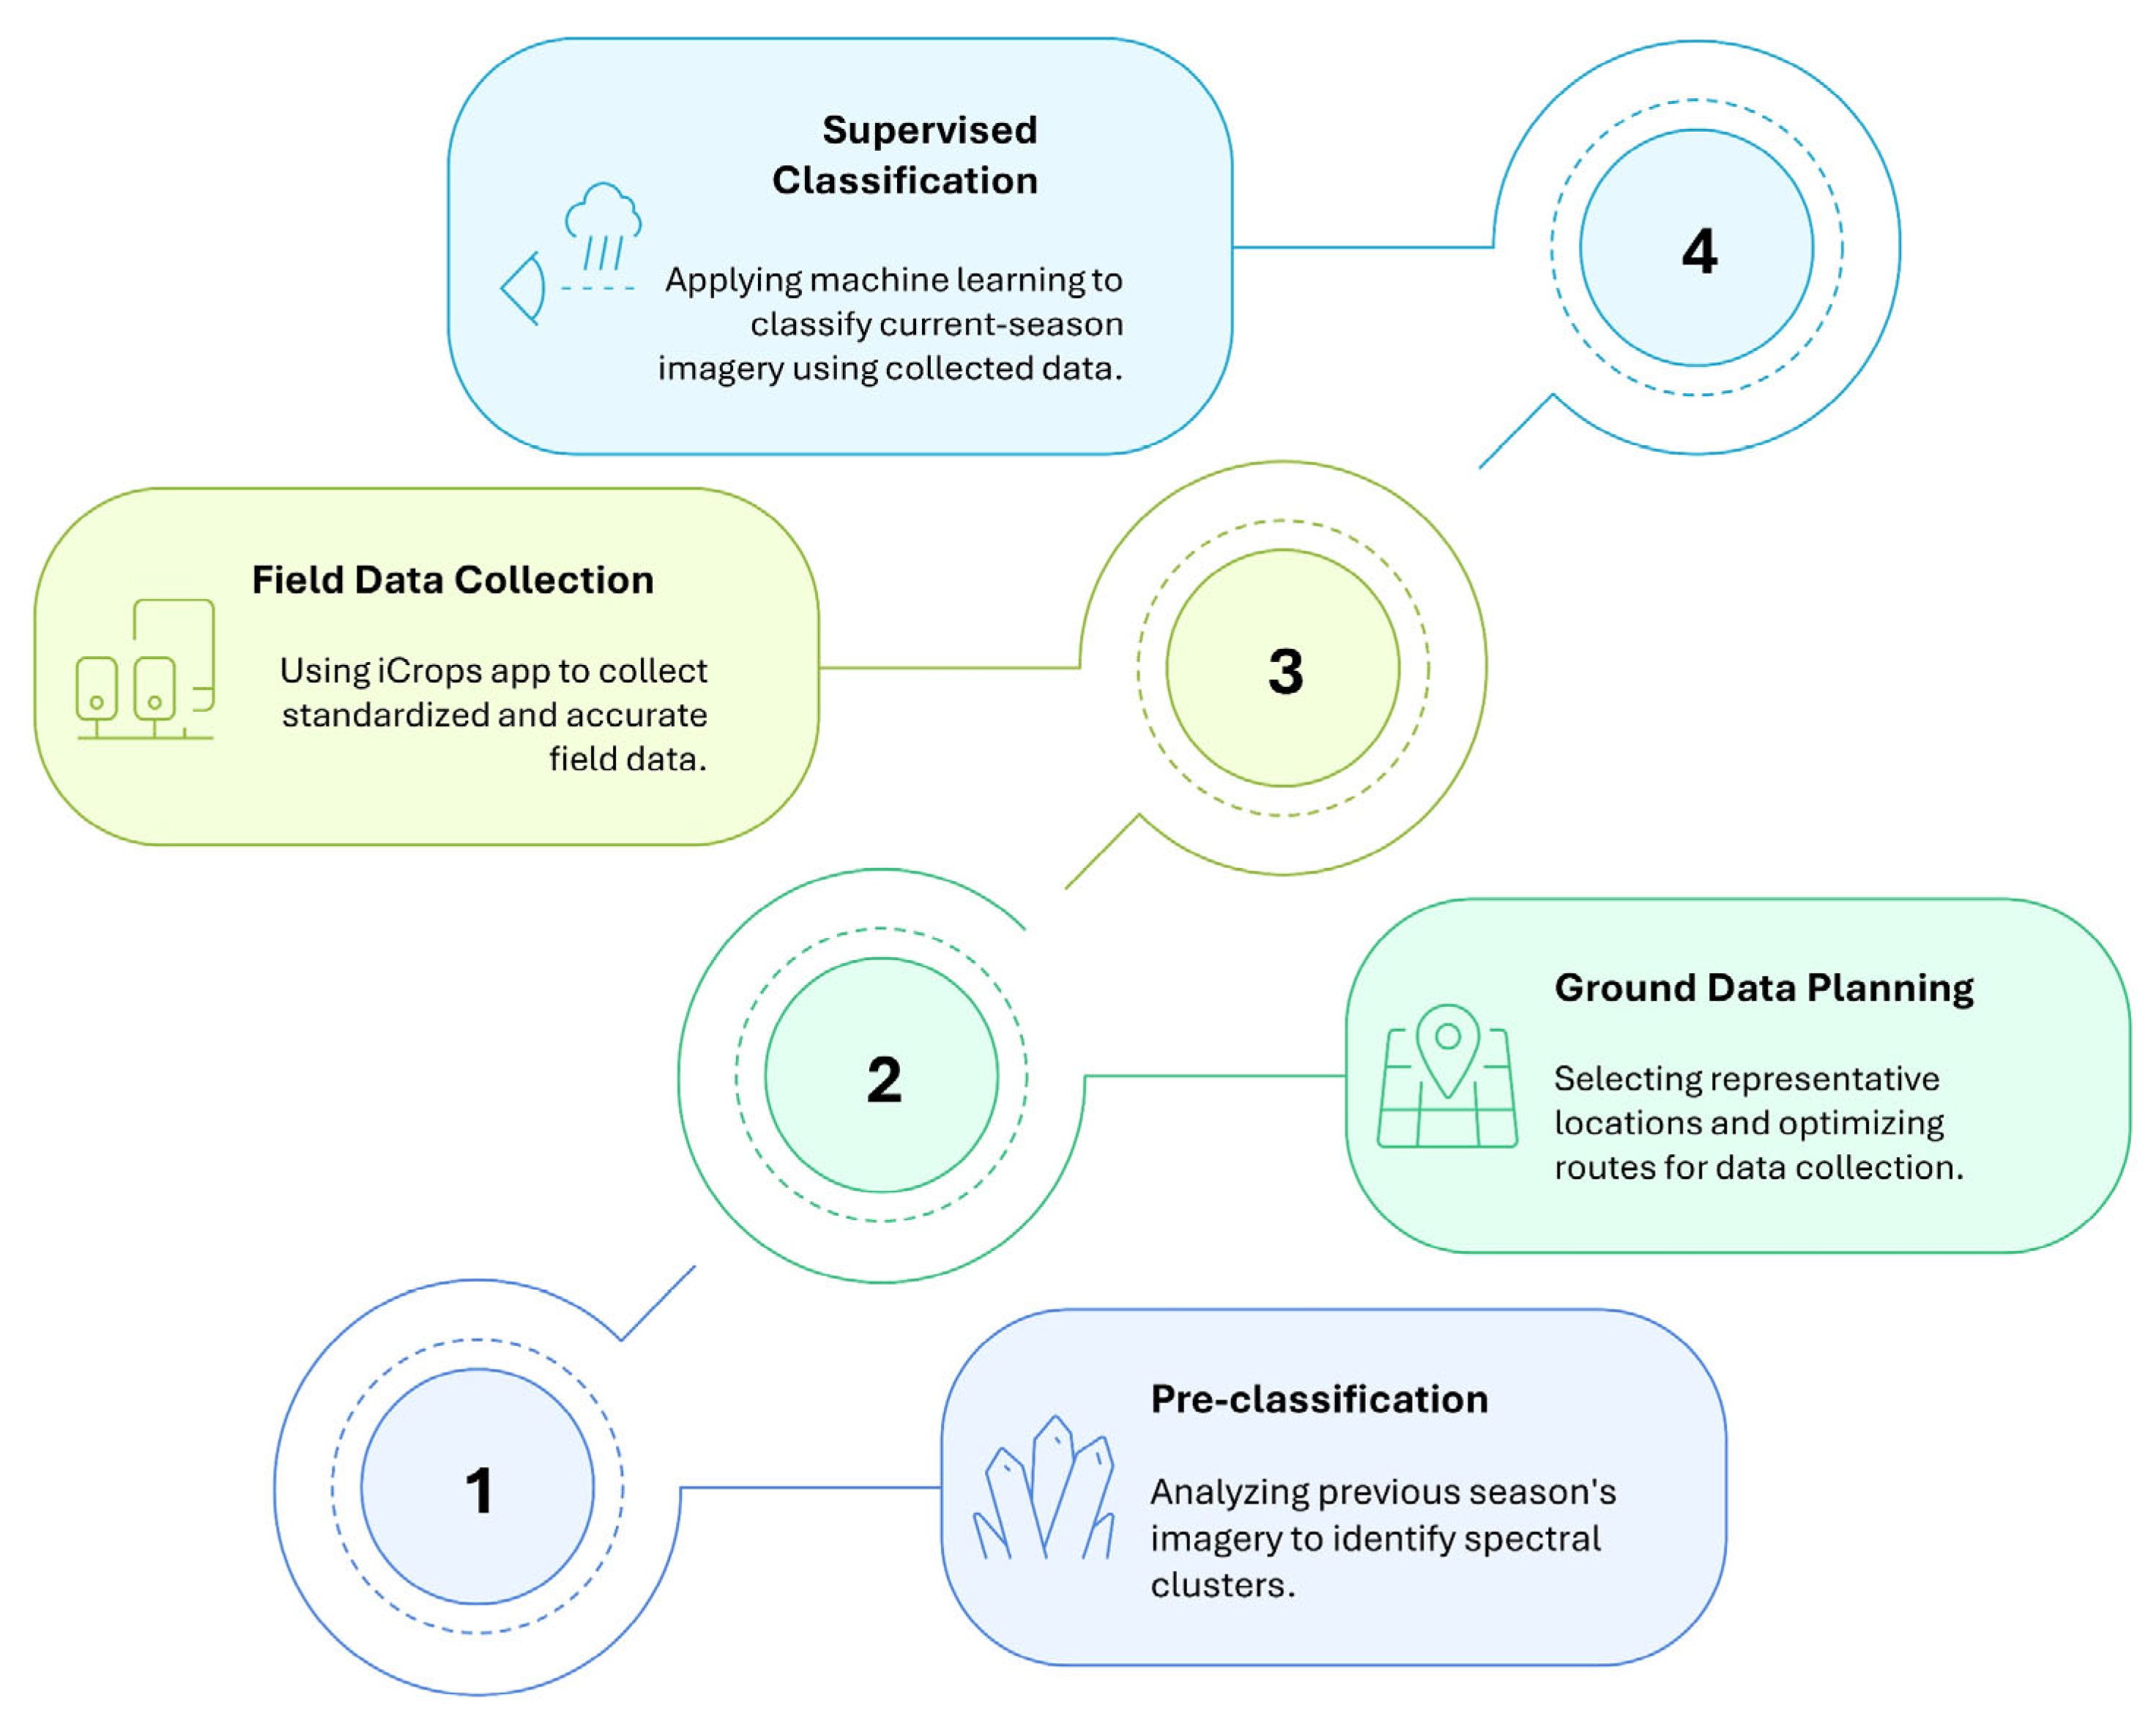
This study adopted a systematic ground data planning approach tailored for operational crop classification. The methodology comprises four major components: (i) Ground data planning and field collection, and (ii) supervised classification using the collected data. Each step is described in detail below (Figure 2).

2.3. Ground Data Planning and Field Collection

A structured approach was used to plan and conduct ground truth data collection, integrating remote sensing, spatial optimization, and standardized field protocols [38,39].
First, a pre-season spectral clustering analysis was performed using a time series of Sentinel-2 Level-2A NDVI data (10 m resolution) from the rabi season (November to March). Cloud-free observations were composited monthly to generate a five-layer NDVI time series. Unsupervised k-means clustering was applied to this stack across the full extent of the Bareilly district, resulting in ten spectrally distinct zones. The number of clusters was selected using the elbow method to balance interpretability and field feasibility. These clusters do not represent final crop types but were used as stratification units to guide sampling across diverse phenological and land cover patterns.
Although the clustering was performed on the full district-wide NDVI stack, the resulting map was used at the village level to support localized field planning. This means that the spectral zones were analyzed within the administrative context of villages to capture spatial variation in cropping patterns, sowing dates, irrigation access, and management practices. By overlaying the cluster map with village boundaries, field teams ensured that each major phenological pattern was sampled across multiple villages, enhancing the spatial representativeness of the dataset [40,41].
Based on the cluster map, ground truth locations were selected to ensure spectral representativeness, spatial spread, and field homogeneity. Within each cluster, candidate points were generated using a stratified random sampling approach, constrained by a minimum spacing of 300 m to reduce spatial autocorrelation, a field homogeneity threshold of at least 3 × 3 Sentinel-2 pixels (90 × 90 m), and proximity to road networks for logistical feasibility. Clusters with high intra-class variability were assigned more points to capture diversity, while spectrally uniform classes such as water bodies and built-up areas received fewer. Candidate points were then ranked by spectral variance within a 3 × 3-pixel window, with higher variance assigned greater priority. To optimize logistics, least-cost path analysis in QGIS was used to generate efficient field routes, prioritizing paved and unpaved roads while enabling access to remote areas.
Field data were collected using the iCrops mobile application, which supports offline GPS-tagged data entry, structured forms, and photo documentation. At each site, field staff recorded GPS coordinates (typically accurate to 3–5 m), captured 3–4 geotagged photos, and recorded key attributes including crop type, growth stage, sowing date, and irrigation status [39]. Only fields sufficiently large and homogeneous, covering multiple Sentinel-2 pixels, were included to minimize mixed-pixel effects.
Collected data were synchronized to a central server and reviewed daily by a quality assurance team for accuracy and consistency. The validated ground truth dataset was then used to extract time-series spectral values (Red, NIR, SWIR, NDVI, EVI) from co-located Sentinel-2 pixels for use in supervised classification.

2.4. Crop Classification Using Supervised Classification

Once field data are collected and rigorously validated, they are employed for the supervised classification of current-season Sentinel-2 imagery. The classification workflow begins with the extraction of key spectral features, including the Red, Near-Infrared (NIR), and Short-Wave Infrared (SWIR) bands, which are sensitive to vegetation structure and water content. In addition, vegetation indices such as the NDVI and the Enhanced Vegetation Index (EVI) are computed to improve class separability and enhance vegetation-related discrimination.
The validated ground truth dataset was partitioned into training (70%) and validation (30%) subsets. To ensure spatial independence and reduce autocorrelation, validation points were selected from different villages than those used for training. This location-based partitioning strategy provides a more robust estimate of model generalizability.
A Random Forest (RF) classifier is selected for its robustness to overfitting, ability to handle high-dimensional data, and interpretability. The classifier is trained using the training subset and subsequently applied to the entire study area to generate a classified thematic map representing spatial patterns of land cover or crop types. The Random Forest classifier was implemented using 500 trees (estimators = 500), with no maximum depth constraint to allow full tree growth. Features were selected using the square root of the number of input variables at each split (sqrt rule), and the model used out-of-bag (OOB) error estimates for internal validation. These parameters were optimized through iterative testing to balance model complexity and accuracy.
Post-classification, spatial filtering is performed to address noise artifacts commonly associated with pixel-based classification. Specifically, a majority filter is applied to reduce “salt-and-pepper” noise and enhance the spatial coherence of classified patches, ensuring that the output maps are both visually interpretable and analytically sound.
Model performance is evaluated using a confusion matrix, from which several accuracy metrics are derived. These include overall accuracy (OA), the Kappa coefficient (κ), producer’s accuracy (PA), and user’s accuracy (UA) for each class. Together, these metrics provide a comprehensive assessment of classification reliability, both in aggregate and on a class-specific basis.

3. Results

3.1. Spectral Clustering and Ground Truth Sampling

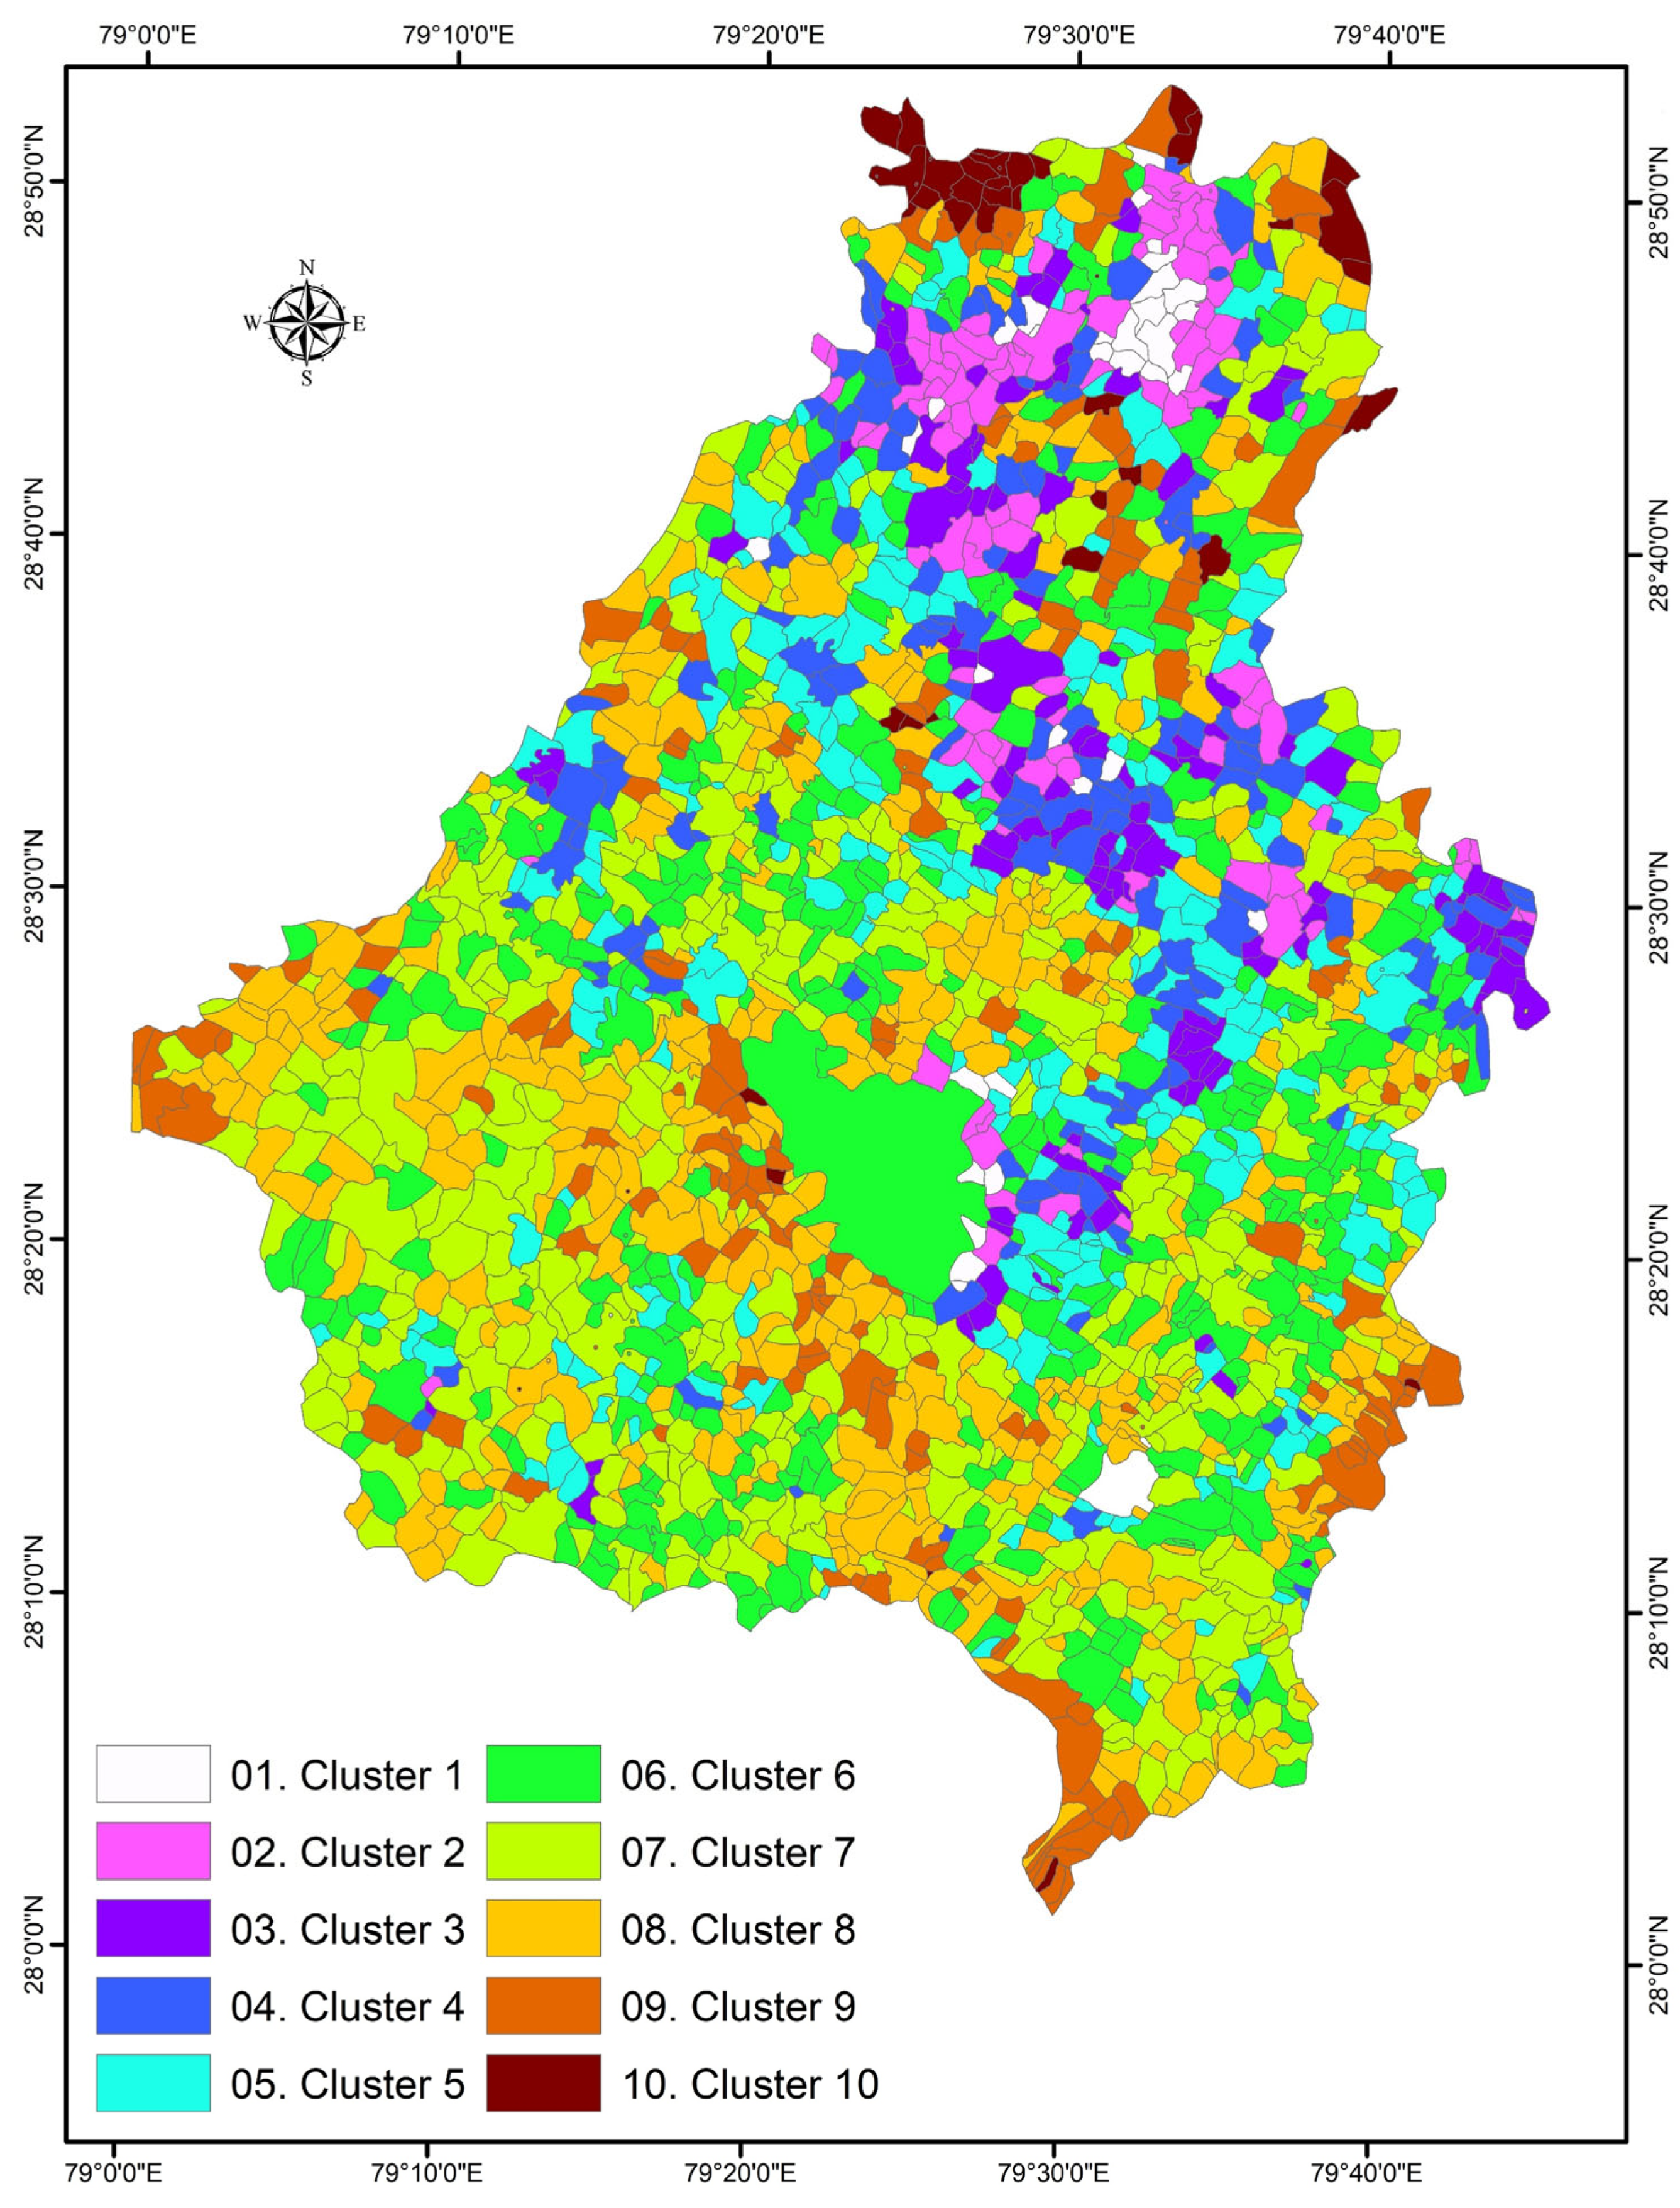
The pre-classification and ground truth sampling formed the foundation of a systematic and representative data collection strategy in the Bareilly district. Using time series Sentinel 2 NDVI data from the previous rabi season, unsupervised k-means clustering was applied across the full extent of the district to identify ten spectrally distinct zones (Figure 3). The clustering was not performed independently per village, but the resulting map was used to guide field planning at the village level to capture spatial variation in cropping patterns, sowing dates, and irrigation practices.
Each cluster represents a unique NDVI trajectory over time, reflecting different land use and land cover (LULC) dynamics. These clusters do not represent final crop types but served as stratification units to ensure that field data collection covered the full range of spectral and phenological variability across the landscape.
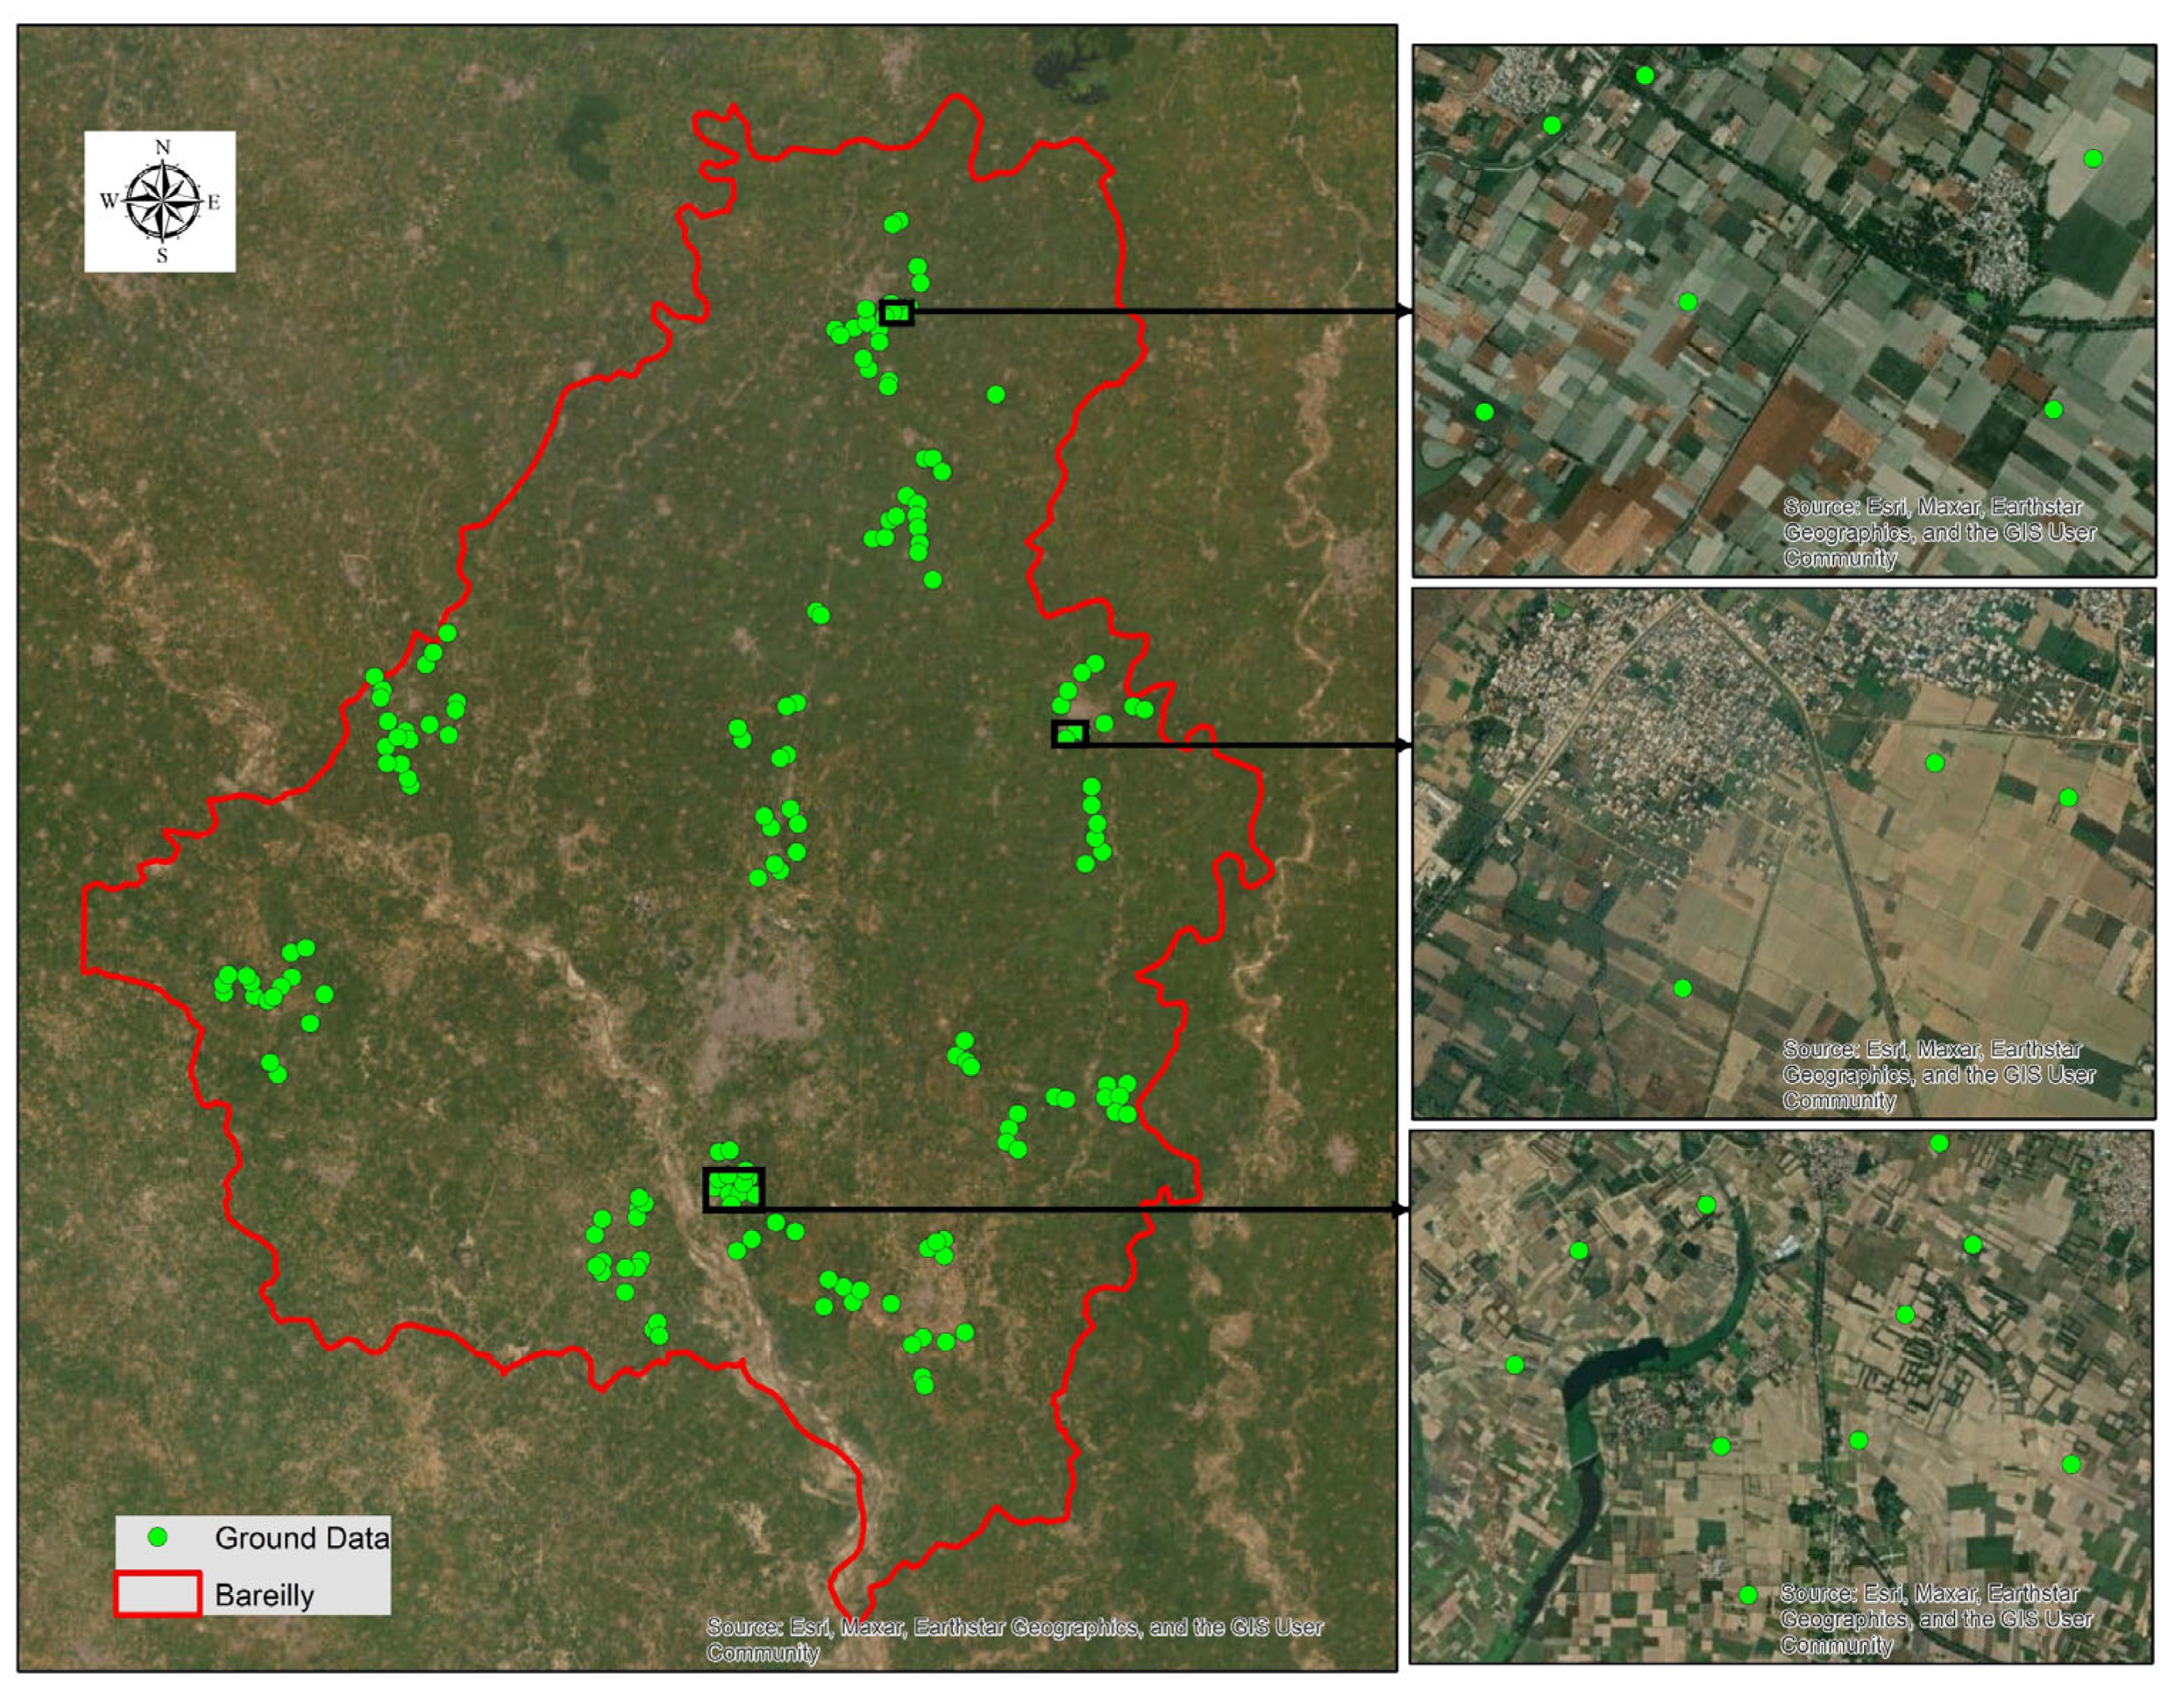
A total of 197 ground truth points were systematically distributed across the ten clusters based on spectral heterogeneity and land cover complexity (Figure 4, Table 1). The allocation was not uniform. Instead, more points were assigned to spectrally diverse clusters to capture intra-class variability, while fewer were allocated to homogeneous classes that are easier to classify.
Clusters 1, 5, and 9 exhibited high and sustained NDVI values from January to February and were confirmed through field observations as predominantly wheat fields. These clusters received high sampling density, with 30, 20, and 28 points, respectively, to ensure robust representation of the dominant crop. Clusters 2, 7, and 8 showed moderate or fluctuating NDVI profiles and were verified as other crops, including sugarcane, pulses, and vegetables. Cluster 7, which displayed high intra-class variability likely due to mixed cropping or variable sowing dates, received the second highest allocation of 25 points.
Cluster 3 (water bodies) and Cluster 4 (built up areas) showed stable, low, or near zero NDVI and were spectrally distinct. As these classes are easily separable, they required fewer samples, with 12 and 14 points, respectively. Cluster 10, labeled as Other LULC, showed the highest spectral heterogeneity, encompassing fallow land, scrub, and fragmented agriculture. It received the largest number of points (31) to adequately capture its diversity. Cluster 6 was small in spatial extent and received only 4 points, reflecting its limited coverage.
This stratified sampling strategy ensured that spectrally complex and agriculturally significant zones were thoroughly sampled, while homogeneous and easily classifiable areas received proportionally fewer but sufficient observations. The integration of the cluster map with road networks and village boundaries enabled route-optimized field campaigns, allowing teams to efficiently access both accessible and remote areas.
The resulting dataset, spatially distributed, spectrally guided, and validated through geotagged photos and farmer interviews, provided a robust foundation for supervised classification. This approach minimized accessibility bias and enhanced the representativeness of the training data, directly contributing to the reliability of the final land cover map.

3.2. Crop Classification Using Random Forest Classifier

Following ground truth data collection and validation, supervised classification was performed using the Random Forest (RF) algorithm and Sentinel-2 imagery from the current rabi season. The validated dataset of 197 ground truth points was partitioned into a training set (70%, n = 138) and an independent validation set (30%, n = 60). To minimize spatial autocorrelation, validation points were selected from different villages than those used for training, ensuring spatial independence and a robust estimate of model generalizability. The classification was based on key spectral features extracted from Sentinel-2 data, including the Red, Near-Infrared (NIR), and Short-Wave Infrared (SWIR) bands, as well as time-series NDVI and EVI values computed from cloud-free observations during the growing season. These features were used to capture phenological dynamics and improve class separability.
The RF model was trained using 500 decision trees with no maximum depth constraint, and feature selection at each split followed the square root rule. Out-of-bag (OOB) error estimates were used for internal validation during training. After classification, a majority filter was applied to reduce “salt-and-pepper” noise and improve spatial coherence in the output map.
Model performance was evaluated using the validation subset (n = 60), from which a confusion matrix was computed to derive overall accuracy (91.6%), the Kappa coefficient (0.886), producer’s accuracy, and user’s accuracy (Table 2). Producer’s and user’s accuracies ranged from 83% to 100%, with the highest accuracy for Water Bodies (100%) and the lowest for Other Crop (83% user’s accuracy). Misclassifications occurred primarily between Wheat and Other Crop, particularly in areas with overlapping phenology or fragmented fields.
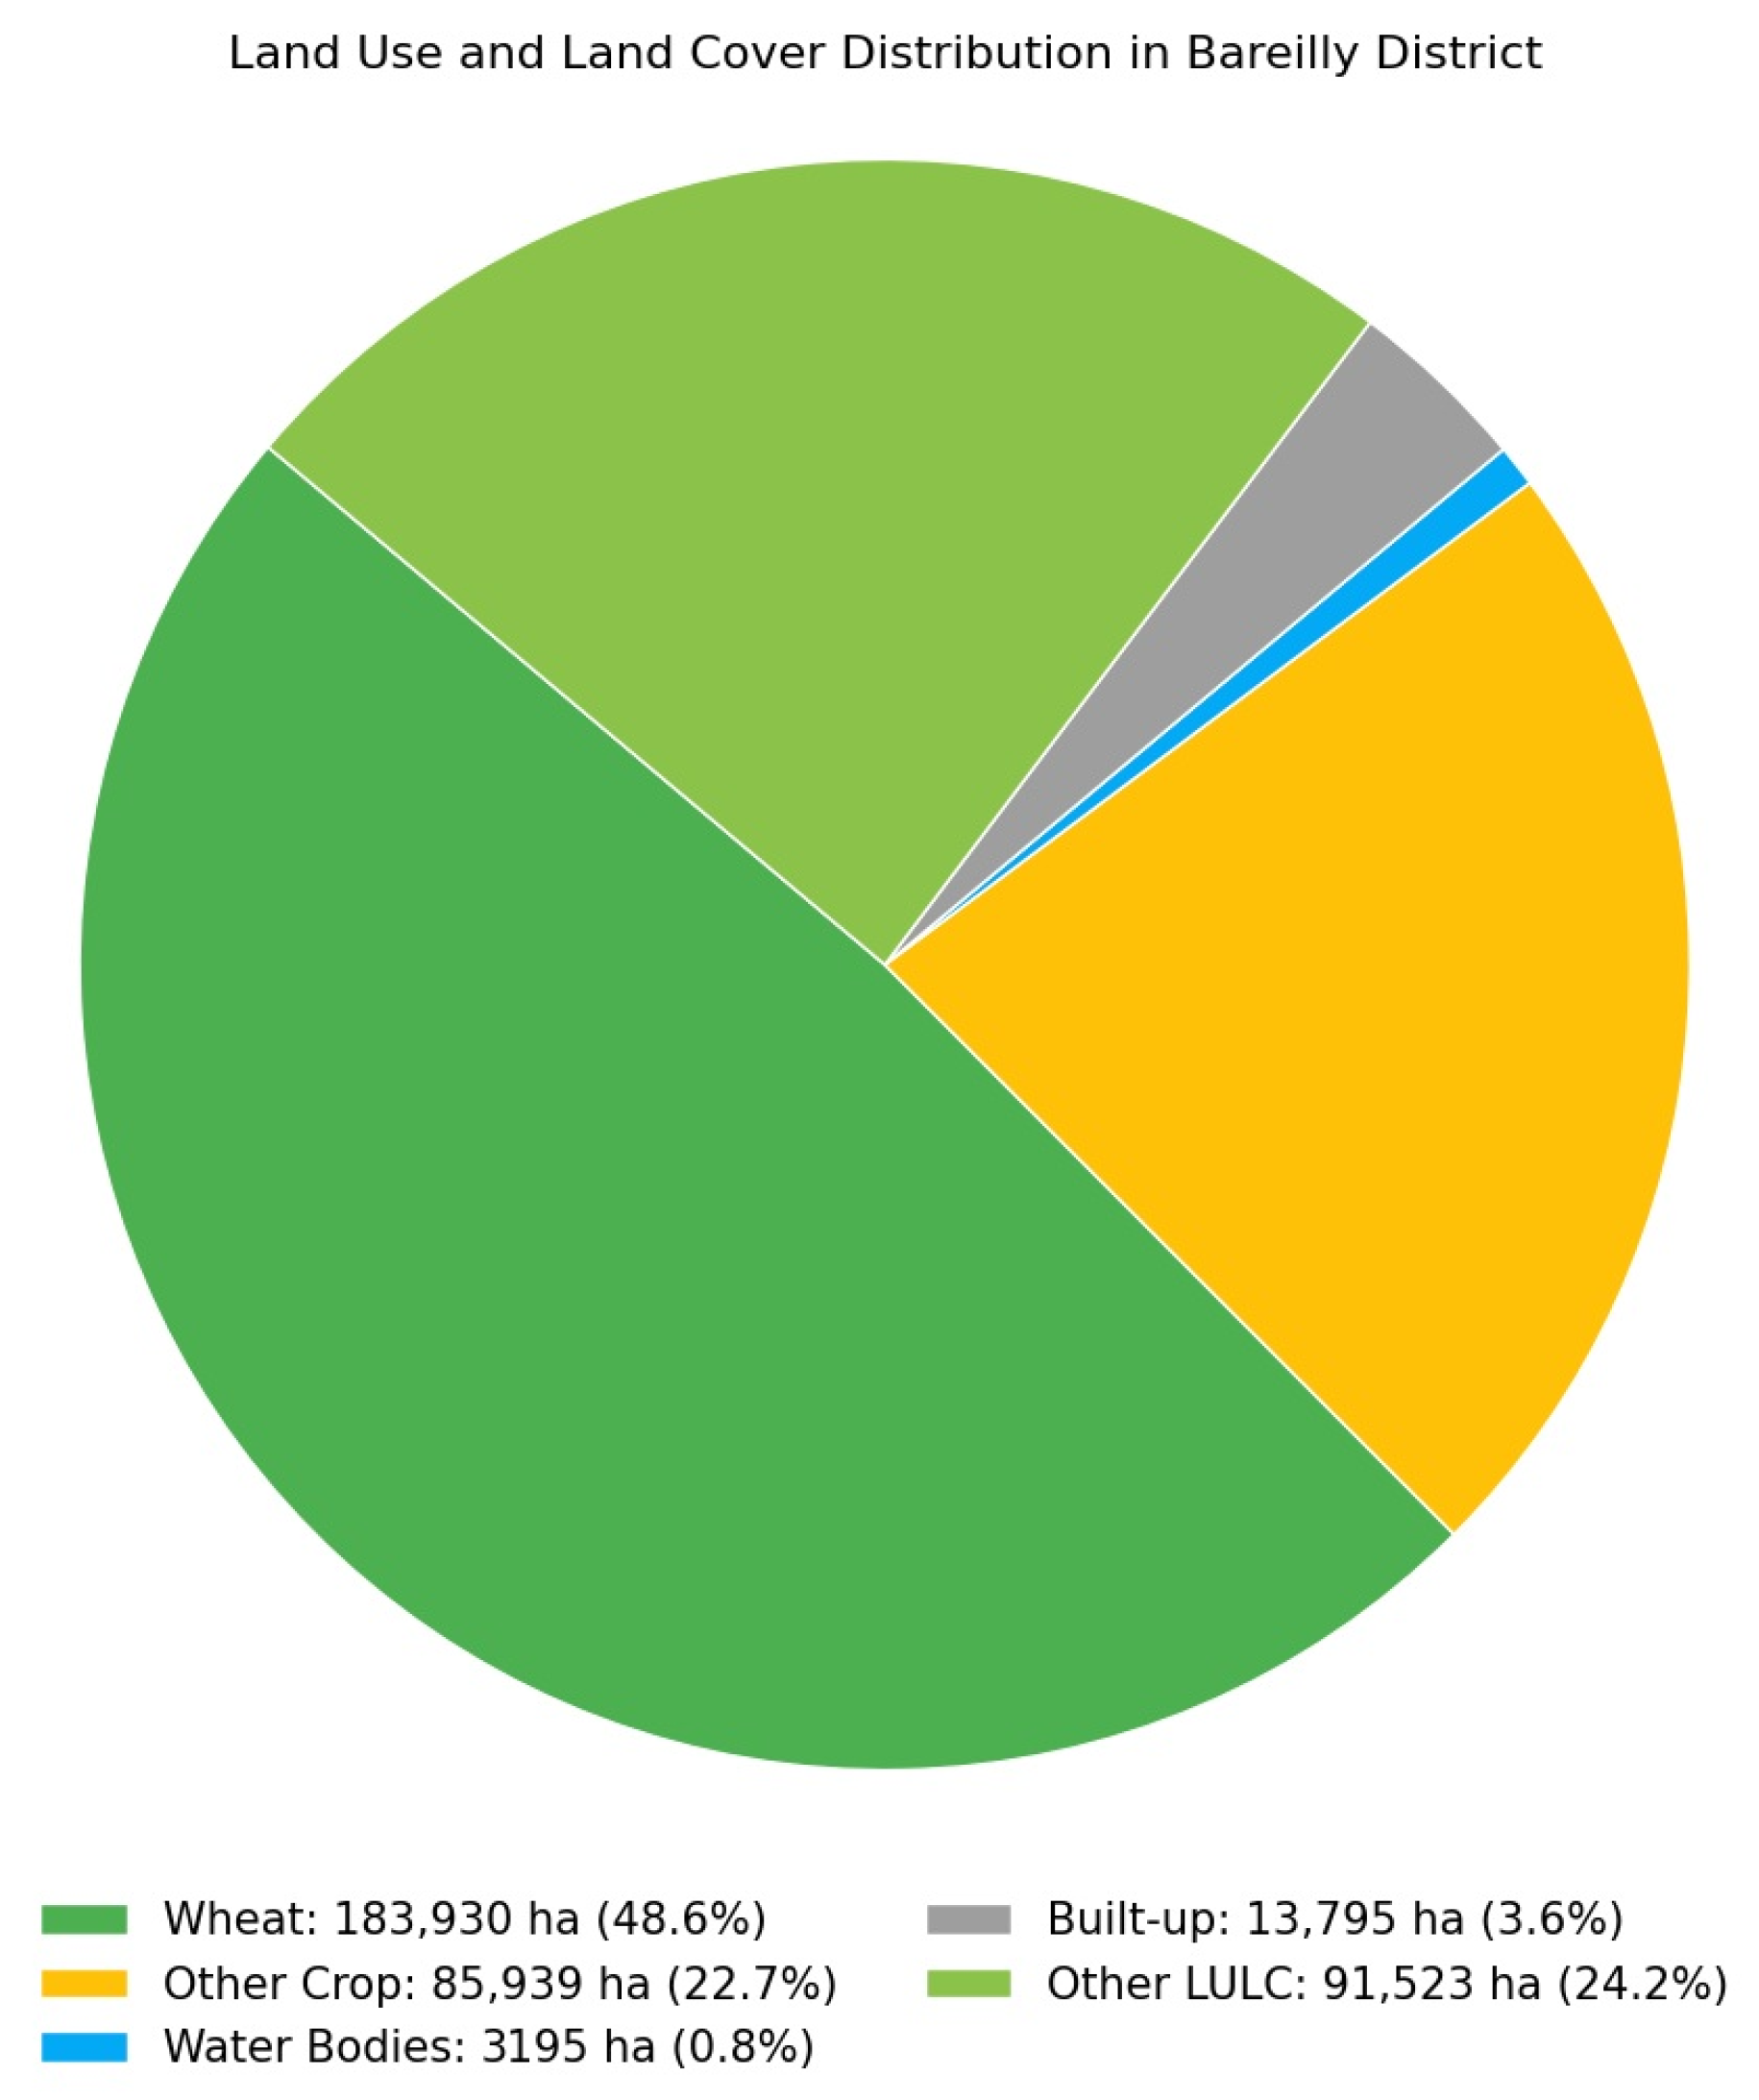
The final land cover map (Figure 5) identified five classes: Wheat, Other Crop, Water Bodies, Built-up, and Other LULC. Wheat was the dominant crop, covering approximately 183,930 hectares, followed by Other Crop (85,939 ha), Other LULC (91,523 ha), Built-up (13,795 ha), and Water Bodies (3195 ha) (Figure 6).
The high accuracy achieved in this study can be attributed to the structured sampling design using spectral clustering to guide field data collection, ensuring spatial representativeness, and employing standardized digital data capture via iCrops. This approach minimized accessibility bias and provided a robust training dataset that captured the spectral variability across classes.
While the results are promising, limitations remain. The classification was based on single-season data in a wheat-dominated, irrigated landscape. Performance may vary in more diverse or rainfed systems. Future work should test the approach across multiple seasons and agroecological zones to assess temporal and spatial generalizability.

4. Discussion

The methodology presented in this study integrates remote sensing, spatial optimization, and digital field data collection to improve the accuracy and representativeness of crop classification in heterogeneous agricultural landscapes. A key strength of the approach lies in the use of pre-season spectral clustering of Sentinel-2 NDVI time-series data to guide ground truth sampling. By identifying ten spectrally distinct zones across the Bareilly district, the k-means clustering process effectively captured the phenological diversity of the region, enabling targeted and representative field data collection. This strategy directly addresses a major limitation in conventional supervised classification workflows: spatially biased or non-representative training data, often resulting from convenience-based or accessibility-driven sampling [42,43].
The stratified allocation of 197 ground points, with higher density in spectrally variable clusters such as Cluster 10 (Other LULC, 31 points) and Cluster 7 (Other Crop, 25 points), ensured that the classifier was trained on a diverse and realistic representation of land use patterns. This is particularly important in agricultural systems where mixed cropping, variable sowing dates, and fragmented fields contribute to spectral heterogeneity [44,45]. The integration of village-level administrative boundaries into the sampling design further enhanced local relevance by accounting for regional differences in farming practices and irrigation access. Additionally, the use of least-cost path analysis for route optimization improved field efficiency, enabling coverage of remote and less accessible areas while minimizing logistical constraints, a practical consideration often overlooked in large-scale data collection efforts.
The adoption of the iCrops mobile application for field data collection introduced a standardized, digital workflow that significantly enhances data quality and consistency. Features such as automatic GPS tagging, structured data entry forms, offline functionality, and geotagged photo documentation reduce human error and ensure traceability. Daily quality assurance checks further strengthened data integrity, making the dataset robust for both training and validation purposes. This digital approach represents a major advancement over traditional paper-based surveys, particularly in resource-constrained settings where data loss and inconsistency are common.
The supervised classification using the Random Forest (RF) algorithm achieved a high overall accuracy of 91.6% and a Kappa coefficient of 0.886, demonstrating the effectiveness of the integrated methodology through a structured workflow: remote sensing–guided sampling, spatially independent validation, and standardized field data collection. The RF classifier’s ability to handle high-dimensional spectral data (Red, NIR, SWIR, NDVI, EVI) and its robustness to noise contributed to reliable class discrimination. The use of spatially independent training and validation sets, ensuring no overlap in villages, minimized spatial autocorrelation and provided a more realistic assessment of model generalizability. The application of a majority filter to reduce salt-and-pepper noise further improved the spatial coherence of the final land use/land cover (LULC) map, enhancing its usability for decision-making [46].
Despite these strengths, some limitations must be acknowledged. First, the study was conducted in a predominantly irrigated, wheat-dominated agroecosystem with relatively large and uniform fields. The high accuracy achieved may not be directly transferable to rainfed or highly diversified agricultural systems where crop calendars are less synchronized, field sizes are smaller, and spectral signals are more variable. In such contexts, the current clustering approach might fail to capture fine-scale variability, leading to underrepresentation of minor or intercropped crops.
Second, the classification was based on a single rabi season, limiting the assessment of temporal stability and long-term reliability of the method. Multi-season validation is essential to evaluate the robustness of the spectral clusters and their transferability across years, particularly under changing climatic conditions or shifting agricultural practices.
Third, while the use of Sentinel-2 provides high spatial (10 m) and temporal (5-day revisit) resolution, the reliance on optical data makes the approach vulnerable to cloud contamination during critical growth stages. The absence of radar data (e.g., Sentinel-1) limits the ability to monitor crop development under cloudy conditions, which could be particularly problematic in regions with prolonged winter cloud cover.
Finally, although the iCrops application enhances data standardization, the success of the method depends heavily on field staff training, logistical capacity, and community cooperation. In regions with limited institutional support or low farmer engagement, replicating this approach may pose significant operational challenges.

5. Conclusions

This study presents a systematic and scalable framework for crop classification by integrating remote sensing, spectral clustering, optimized ground data planning, and mobile-based field data collection. Applied in the Bareilly district, Uttar Pradesh, a wheat-dominated, irrigated agricultural region, the approach demonstrates how pre-season spectral clustering of Sentinel 2 NDVI time series data can guide representative and spatially balanced ground truth sampling. By identifying ten spectrally distinct zones that reflect diverse phenological and land use patterns, the clustering process enabled targeted field campaigns that captured the full range of spectral variability across the district.
The strategic allocation of 197 ground truth points, prioritizing spectrally heterogeneous and agriculturally significant clusters, ensured a robust and representative training dataset. The use of the iCrops mobile application facilitated standardized, GPS-accurate data collection with photo validation and offline functionality, minimizing human error and accessibility bias. This digital, traceable workflow significantly enhanced data quality and operational efficiency, particularly in remote or less accessible areas.
Using this high-quality dataset, a Random Forest classifier was trained and validated with spatially independent samples, achieving an overall accuracy of 91.6 percent and a Kappa coefficient of 0.886. The resulting land use land cover map clearly delineated five classes: Wheat, Other Crop, Water Bodies, Built up, and Other LULC, with strong class separability and spatial coherence. Wheat emerged as the dominant crop, covering approximately 183,930 hectares, underscoring its central role in the region’s agricultural economy.
The high classification accuracy achieved in this study underscores the critical importance of systematic ground data planning. Rather than relying on convenience-based or arbitrary sampling, the integration of remote sensing derived spectral clusters into field campaign design ensures that training data are both spectrally comprehensive and spatially representative, with key prerequisites for reliable supervised classification in heterogeneous landscapes.
This end-to-end methodology is operationally feasible, scalable, and adaptable to other agroecological regions. It offers a replicable model for national and subnational crop monitoring systems, supporting agricultural planning, food security assessments, and sustainable land use management. However, its performance may vary in rainfed, highly diversified, or fragmented farming systems where crop calendars are less synchronized and spectral signals more variable. Additionally, reliance on optical data limits robustness under persistent cloud cover, suggesting future integration with radar data such as Sentinel 1 could enhance temporal reliability.
Future research should focus on multi-season validation to assess the temporal stability of spectral clusters and test the framework across diverse agroclimatic zones. Incorporating ancillary data such as climate, soil, and socioeconomic variables could further improve classification accuracy and support broader decision-making applications. Ultimately, this study reaffirms that the synergy between satellite remote sensing, intelligent sampling design, and digital field tools is essential for advancing precision agriculture and evidence-based policy in the era of sustainable development.

Author Contributions

Conceptualization, M.K.G., R.M.N. and V.M.; methodology, M.K.G. and R.M.N.; software, P.P. and R.M.N.; validation, M.K.G. and V.M.; writing—original draft preparation, M.K.G., R.M.N. and P.P.; writing—review and editing, M.K.G., P.P., R.M.N. and V.M.; visualization, P.P.; supervision, M.K.G. and V.M.; funding acquisition, M.K.G. All authors have read and agreed to the published version of the manuscript.

Funding

This research received no external funding.

Data Availability Statement

The original contributions presented in this study are included in the article. Further inquiries can be directed to the corresponding author.

Acknowledgments

The authors would like to thank the International Crops Research Institute for The Semi-Arid Tropics (ICRISAT), and Andhra University for providing support to conduct research. We are grateful for the help of the field and the staff of ICRISAT for assisting with ground data collection.

Conflicts of Interest

The authors declare no conflicts of interest.

References

  1. Im, J. Earth observations and geographic information science for sustainable development goals. GIScience Remote Sens. 2020, 57, 591–592. [Google Scholar] [CrossRef]
  2. Obi Reddy, G.; Dwivedi, B.; Ravindra Chary, G. Applications of geospatial and big data technologies in smart farming. In Smart Agriculture for Developing Nations: Status, Perspectives and Challenges; Springer: Berlin/Heidelberg, Germany, 2023; pp. 15–31. [Google Scholar]
  3. Weiss, M.; Jacob, F.; Duveiller, G. Remote sensing for agricultural applications: A meta-review. Remote Sens. Environ. 2020, 236, 111402. [Google Scholar] [CrossRef]
  4. Lobell, D.B.; Asner, G.P.; Ortiz-Monasterio, J.I.; Benning, T.L. Remote sensing of regional crop production in the Yaqui Valley, Mexico: Estimates and uncertainties. Agric. Ecosyst. Environ. 2003, 94, 205–220. [Google Scholar] [CrossRef]
  5. Jha, P.K.; Middendorf, G.; Faye, A.; Middendorf, B.J.; Prasad, P.V. Lives and livelihoods in smallholder farming systems of senegal: Impacts, adaptation, and resilience to COVID-19. Land 2023, 12, 178. [Google Scholar] [CrossRef]
  6. Anderson, M.C.; Allen, R.G.; Morse, A.; Kustas, W.P. Use of Landsat thermal imagery in monitoring evapotranspiration and managing water resources. Remote Sens. Environ. 2012, 122, 50–65. [Google Scholar] [CrossRef]
  7. Qiu, B.; Hu, X.; Chen, C.; Tang, Z.; Yang, P.; Zhu, X.; Yan, C.; Jian, Z. Maps of cropping patterns in China during 2015–2021. Sci. Data 2022, 9, 479. [Google Scholar] [CrossRef] [PubMed]
  8. Dong, J.; Xiao, X.; Kou, W.; Qin, Y.; Zhang, G.; Li, L.; Jin, C.; Zhou, Y.; Wang, J.; Biradar, C. Tracking the dynamics of paddy rice planting area in 1986–2010 through time series Landsat images and phenology-based algorithms. Remote Sens. Environ. 2015, 160, 99–113. [Google Scholar] [CrossRef]
  9. Pittman, K.; Hansen, M.C.; Becker-Reshef, I.; Potapov, P.V.; Justice, C.O. Estimating global cropland extent with multi-year MODIS data. Remote Sens. 2010, 2, 1844–1863. [Google Scholar] [CrossRef]
  10. Tateishi, R.; Hoan, N.T.; Kobayashi, T.; Alsaaideh, B.; Tana, G.; Phong, D.X. Production of global land cover data-GLCNMO2008. J. Geogr. Geol. 2014, 6, 99. [Google Scholar] [CrossRef]
  11. Thenkabail, P.S.; Teluguntla, P.G.; Xiong, J.; Oliphant, A.; Congalton, R.G.; Ozdogan, M.; Gumma, M.K.; Tilton, J.C.; Giri, C.; Milesi, C. Global Cropland-Extent Product at 30-m Resolution (GCEP30) Derived from Landsat Satellite Time-Series Data for the Year 2015 Using Multiple MACHINE-learning Algorithms on Google Earth Engine Cloud; US Geological Survey: Moffett Field, CA, USA, 2021; ISSN 2330-7102. [Google Scholar]
  12. Gray, J.; Friedl, M.; Frolking, S.; Ramankutty, N.; Nelson, A.; Gumma, M.K. Mapping Asian cropping intensity with MODIS. IEEE J. Sel. Top. Appl. Earth Obs. Remote Sens. 2014, 7, 3373–3379. [Google Scholar] [CrossRef]
  13. Salcedo-Sanz, S.; Ghamisi, P.; Piles, M.; Werner, M.; Cuadra, L.; Moreno-Martínez, A.; Izquierdo-Verdiguier, E.; Muñoz-Marí, J.; Mosavi, A.; Camps-Valls, G. Machine learning information fusion in Earth observation: A comprehensive review of methods, applications and data sources. Inf. Fusion 2020, 63, 256–272. [Google Scholar] [CrossRef]
  14. Panjala, P.; Gumma, M.K.; Teluguntla, P. Machine learning approaches and sentinel-2 data in crop type mapping. In Data Science in Agriculture and Natural Resource Management; Springer: Singapore, 2022; pp. 161–180. [Google Scholar]
  15. Phalke, A.; Ozdogan, M.; Thenkabail, P.; Erickson, T.; Gorelick, N. Mapping croplands of Europe, Middle East, Russia, and Central Asia using Landsat 30-m data, machine learning algorithms and Google Earth Engine. ISPRS J. Photogramm. Remote Sens. 2020, 167, 104–122. [Google Scholar] [CrossRef]
  16. Gumma, M.K.; Panjala, P.; Dubey, S.K.; Ray, D.K.; Murthy, C.; Kadiyala, D.M.; Mohammed, I.; Takashi, Y. Spatial Distribution of Cropping Systems in South Asia Using Time-Series Satellite Data Enriched with Ground Data. Remote Sens. 2024, 16, 2733. [Google Scholar] [CrossRef]
  17. Johnson, D.M.; Mueller, R. Pre-and within-season crop type classification trained with archival land cover information. Remote Sens. Environ. 2021, 264, 112576. [Google Scholar] [CrossRef]
  18. Hussain, S.; Qin, S.; Nasim, W.; Bukhari, M.A.; Mubeen, M.; Fahad, S.; Raza, A.; Abdo, H.G.; Tariq, A.; Mousa, B. Monitoring the dynamic changes in vegetation cover using spatio-temporal remote sensing data from 1984 to 2020. Atmosphere 2022, 13, 1609. [Google Scholar] [CrossRef]
  19. Foerster, S.; Kaden, K.; Foerster, M.; Itzerott, S. Crop type mapping using spectral–temporal profiles and phenological information. Comput. Electron. Agric. 2012, 89, 30–40. [Google Scholar] [CrossRef]
  20. Chunfang, Y.; Xing, J.; Changming, C.; Shiou, L.; Obuobi, B.; Yifeng, Z. Digital economy empowers sustainable agriculture: Implications for farmers’ adoption of ecological agricultural technologies. Ecol. Indic. 2024, 159, 111723. [Google Scholar] [CrossRef]
  21. Mathenge, M.; Sonneveld, B.G.; Broerse, J.E. Application of GIS in agriculture in promoting evidence-informed decision making for improving agriculture sustainability: A systematic review. Sustainability 2022, 14, 9974. [Google Scholar] [CrossRef]
  22. Raihan, A. A systematic review of Geographic Information Systems (GIS) in agriculture for evidence-based decision making and sustainability. Glob. Sustain. Res. 2024, 3, 1–24. [Google Scholar] [CrossRef]
  23. Hu, L.; Zhang, C.; Zhang, M.; Shi, Y.; Lu, J.; Fang, Z. Enhancing FAIR data services in agricultural disaster: A review. Remote Sens. 2023, 15, 2024. [Google Scholar] [CrossRef]
  24. Chakraborty, A.; Biswal, A.; Pandey, V.; Shadab, S.; Kalyandeep, K.; Murthy, C.; Seshasai, M.; Rao, P.; Jain, N.; Sehgal, V. Developing a spatial information system of biomass potential from crop residues over India: A decision support for planning and establishment of biofuel/biomass power plant. Renew. Sustain. Energy Rev. 2022, 165, 112575. [Google Scholar] [CrossRef]
  25. Benti, N.E.; Chaka, M.D.; Semie, A.G.; Warkineh, B.; Soromessa, T. Transforming agriculture with Machine Learning, Deep Learning, and IoT: Perspectives from Ethiopia—Challenges and opportunities. Discov. Agric. 2024, 2, 63. [Google Scholar] [CrossRef]
  26. Rashid, M.R.A.; Hasan, M.; Islam, M.A.; Tasnim, S.T.; Taifa, R.J.; Mahbub, S.; Mansoor, N.; Ali, M.S.; Jabid, T.; Islam, M. Transforming agri-food value chains in Bangladesh: A practical application of blockchain for traceability and fair pricing. Heliyon 2024, 10, e40091. [Google Scholar] [CrossRef] [PubMed]
  27. Sizan, N.S.; Layek, M.A.; Hasan, K.F. A secured triad of IoT, machine learning, and blockchain for crop forecasting in agriculture. arXiv 2025, arXiv:2505.01196. [Google Scholar] [CrossRef]
  28. Singh, A.; Jadhav, A.; Singh, P. AI Applications in Production. In Industry 4.0, Smart Manufacturing, and Industrial Engineering; CRC Press: Boca Raton, FL, USA, 2024; pp. 139–161. [Google Scholar]
  29. Hofmann, E.; Selensky, S.; Kirstätter, N. Emerging technologies and supply chain management: Maneuvering in current areas of tensions. In Industry 4.0; CRC Press: Boca Raton, FL, USA, 2020; pp. 1–42. [Google Scholar]
  30. Kour, V.P.; Arora, S. Recent developments of the internet of things in agriculture: A survey. IEEE Access 2020, 8, 129924–129957. [Google Scholar] [CrossRef]
  31. Laamrani, A.; Pardo Lara, R.; Berg, A.A.; Branson, D.; Joosse, P. Using a mobile device “app” and proximal remote sensing technologies to assess soil cover fractions on agricultural fields. Sensors 2018, 18, 708. [Google Scholar] [CrossRef]
  32. Dhal, S.; Wyatt, B.M.; Mahanta, S.; Bhattarai, N.; Sharma, S.; Rout, T.; Saud, P.; Acharya, B.S. Internet of Things (IoT) in digital agriculture: An overview. Agron. J. 2024, 116, 1144–1163. [Google Scholar] [CrossRef]
  33. Tonnang, H.E.; Salifu, D.; Mudereri, B.T.; Tanui, J.; Espira, A.; Dubois, T.; Abdel-Rahman, E.M. Advances in data-collection tools and analytics for crop pest and disease management. Curr. Opin. Insect Sci. 2022, 54, 100964. [Google Scholar] [CrossRef]
  34. Taye, M.; Azeze, T.; Hunde, D.; Melese, K.; Hassen, A.; Mihreteab, S.; Assefa, G.; Yilma, Z. Challenges and opportunities of tablet-based electronic performance data collection and feedback system for artificial insemination delivery in dairy cattle: Experience from the land O’Lakes Venture37 PAID project in Ethiopia. Cogent Food Agric. 2023, 9, 2202217. [Google Scholar] [CrossRef]
  35. Templ, B. A roadmap for advancing plant phenological studies through effective open research data management. Ecol. Inform. 2025, 87, 103109. [Google Scholar] [CrossRef]
  36. Penki, R.; Meesala, S.B.; Tanniru, S. A review of challenges and solutions in adopting a participatory geographical information system for disaster management. Ecocycles 2022, 8, 64–73. [Google Scholar] [CrossRef]
  37. Lush, V.; Bastin, L.; Otsu, K.; Masó, J. Assessing FAIRness of citizen science data in the context of the Green Deal Data Space. Int. J. Digit. Earth 2024, 17, 2344587. [Google Scholar] [CrossRef]
  38. Gumma, M.K.; Nelson, A.; Thenkabail, P.S.; Singh, A.N. Mapping rice areas of South Asia using MODIS multitemporal data. J. Appl. Remote Sens. 2011, 5, 053547. [Google Scholar] [CrossRef]
  39. Thenkabail, P.; GangadharaRao, P.; Biggs, T.; Krishna, M.; Turral, H. Spectral Matching Techniques to Determine Historical Land-use/Land-cover (LULC) and Irrigated Areas Using Time-series 0.1-degree AVHRR Pathfinder Datasets. Photogramm. Eng. Remote Sens. 2007, 73, 1029–1040. [Google Scholar]
  40. Gumma, M.K.; Tummala, K.; Dixit, S.; Collivignarelli, F.; Holecz, F.; Kolli, R.N.; Whitbread, A.M. Crop type identification and spatial mapping using Sentinel-2 satellite data with focus on field-level information. Geocarto Int. 2022, 37, 1833–1849. [Google Scholar] [CrossRef]
  41. Rao, P.; Zhou, W.; Bhattarai, N.; Srivastava, A.K.; Singh, B.; Poonia, S.; Lobell, D.B.; Jain, M. Using Sentinel-1, Sentinel-2, and Planet imagery to map crop type of smallholder farms. Remote Sens. 2021, 13, 1870. [Google Scholar] [CrossRef]
  42. Russell, A.M.; Browne, M.; Hing, N.; Rockloff, M.; Newall, P. Are any samples representative or unbiased? Reply to Pickering and Blaszczynski. Int. Gambl. Stud. 2022, 22, 102–113. [Google Scholar] [CrossRef]
  43. Gao, Z.; Guo, D.; Ryu, D.; Western, A.W. Training sample selection for robust multi-year within-season crop classification using machine learning. Comput. Electron. Agric. 2023, 210, 107927. [Google Scholar] [CrossRef]
  44. Zheng, Y.-Y.; Kong, J.-L.; Jin, X.-B.; Wang, X.-Y.; Su, T.-L.; Zuo, M. CropDeep: The crop vision dataset for deep-learning-based classification and detection in precision agriculture. Sensors 2019, 19, 1058. [Google Scholar] [CrossRef]
  45. Tariq, A.; Yan, J.; Gagnon, A.S.; Riaz Khan, M.; Mumtaz, F. Mapping of cropland, cropping patterns and crop types by combining optical remote sensing images with decision tree classifier and random forest. Geo-Spat. Inf. Sci. 2023, 26, 302–320. [Google Scholar] [CrossRef]
  46. Lou, C.; Al-qaness, M.A.; AL-Alimi, D.; Dahou, A.; Abd Elaziz, M.; Abualigah, L.; Ewees, A.A. Land use/land cover (LULC) classification using hyperspectral images: A review. Geo-Spat. Inf. Sci. 2025, 28, 345–386. [Google Scholar] [CrossRef]
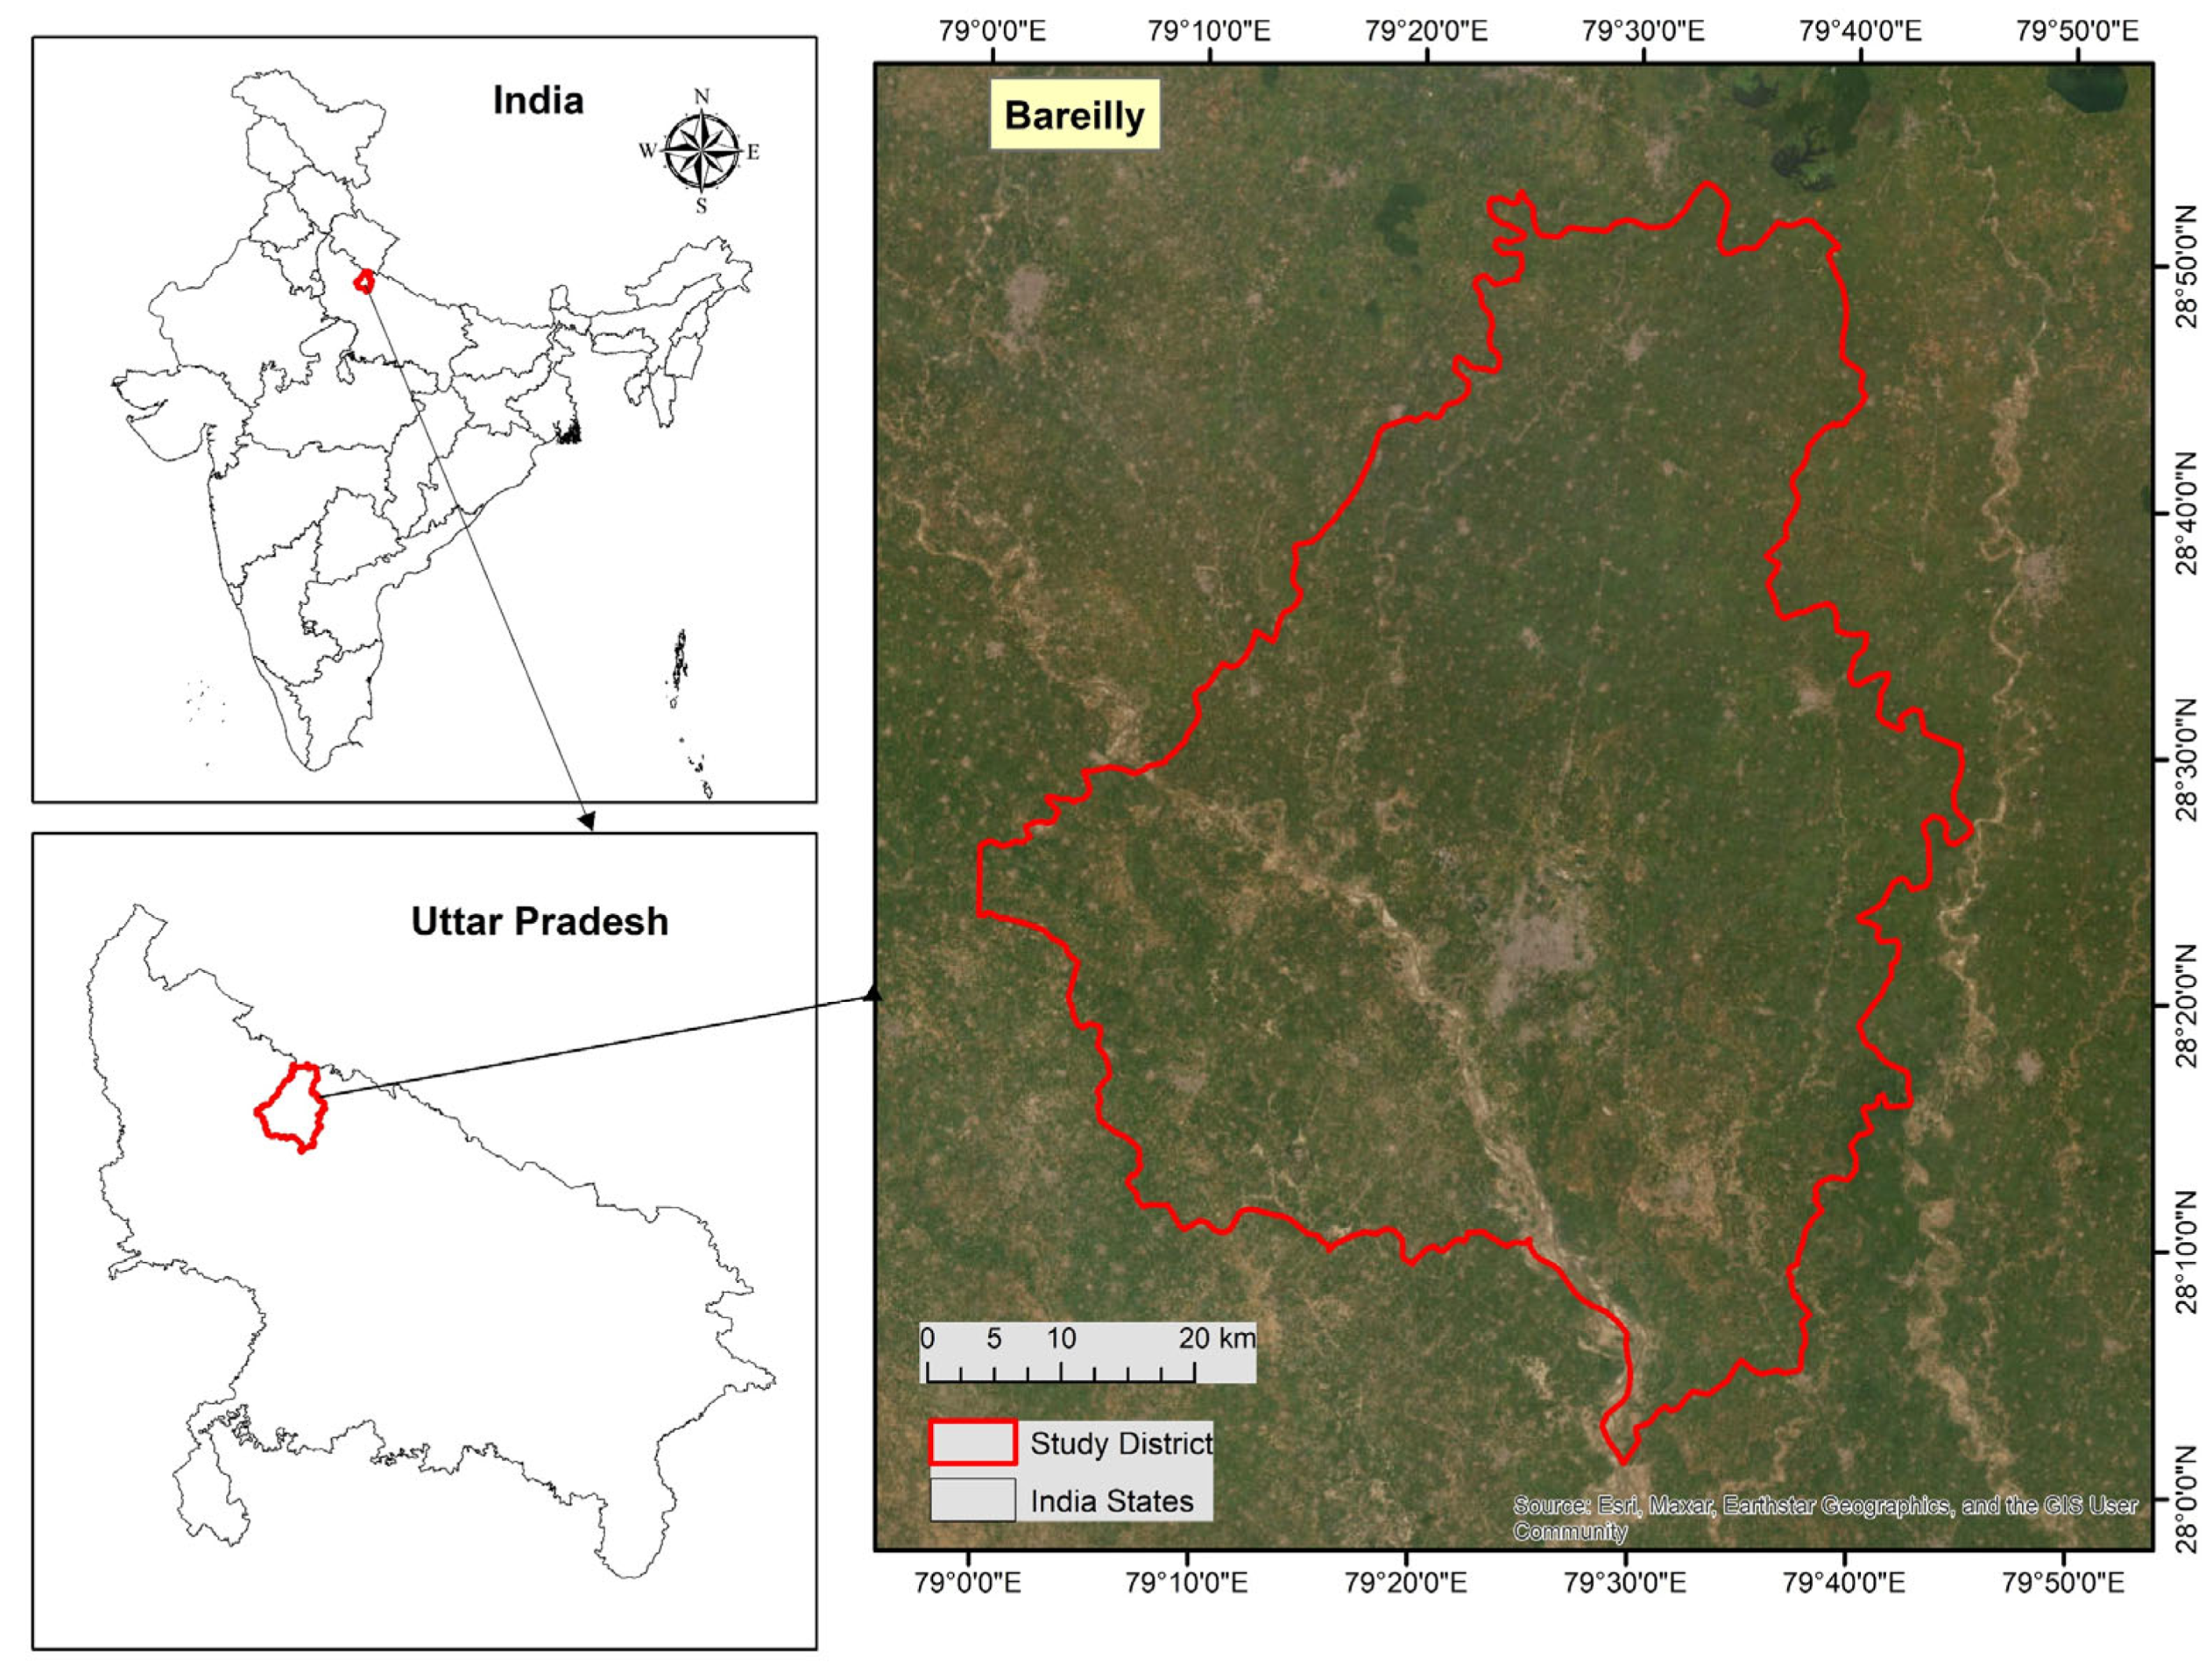
Figure 1. Spatial view of the Bareilly district of Uttar Pradesh.
Geographies 05 00059 g001
Figure 2. The methodological flowchart of study.
Geographies 05 00059 g002
Figure 3. Spatial clusters are derived at village level.
Geographies 05 00059 g003
Figure 4. Ground data collected based on spectral clusters.
Geographies 05 00059 g004
Figure 5. The spatial distribution of LULC of the Bareilly district.
Geographies 05 00059 g005
Figure 6. The pie chart shows the LULC distribution across the study area.
Geographies 05 00059 g006
Table 1. Cluster wise collected ground points.
Spectral ClusterAssociated LULC ClassTotal Ground Points
Cluster 1Wheat30
Cluster 2Other Crop18
Cluster 3Water Bodies12
Cluster 4Built-up14
Cluster 5Wheat20
Cluster 6Other LULC4
Cluster 7Other Crop25
Cluster 8Other Crop15
Cluster 9Wheat28
Cluster 10Other LULC31
Total197
Table 2. Error matrix table for LULC classification.
Reference/GTWheatOther CropWater BodiesBuilt-UpOther LULCTotalUser’s Accuracy (%)
Wheat2610002796
Other Crop1100101283
Water Bodies004004100
Built-up00051683
Other LULC0000101191
Total2711461160
Producer’s (%)96911008391
Disclaimer/Publisher’s Note: The statements, opinions and data contained in all publications are solely those of the individual author(s) and contributor(s) and not of MDPI and/or the editor(s). MDPI and/or the editor(s) disclaim responsibility for any injury to people or property resulting from any ideas, methods, instructions or products referred to in the content.