Composite Index of Poverty Based on Sustainable Rural Livelihood Framework: A Case from Manggarai Barat, Indonesia
Abstract
1. Introduction
2. Materials and Methods
2.1. Study Area
2.2. Data Sources
2.3. Composite Index Construction
2.3.1. Indicator Selection
- 1.
- Number of high school institutions:
- 5 = Worst condition (0.00–0.80).
- …
- 1 = Optimal condition (3.20–4.00).
- 2.
- Source of drinking water:
- 1 = Branded bottled water.
- …
- 5 = River, rainwater, etc.
- 3.
- Access to a financial credit institution:
- 1 = presence.
- 5 = absence.
- 4.
- Distance to nearest higher education institution (km):
- 1 = Optimal condition (3.00–22.38).
- …
- 5 = Worst condition (80.52–99.90).
2.3.2. Normalization
- is the raw class score (1 to 5);
- is the normalized value;
- .
2.3.3. Weighting
2.3.4. Aggregation
- = composite index for unit (e.g., village);
- = normalized score of indicator or unit ;
- = final weight for indicator .
|
|
3. Results
3.1. Spatial Disparities in Multidimensional Poverty
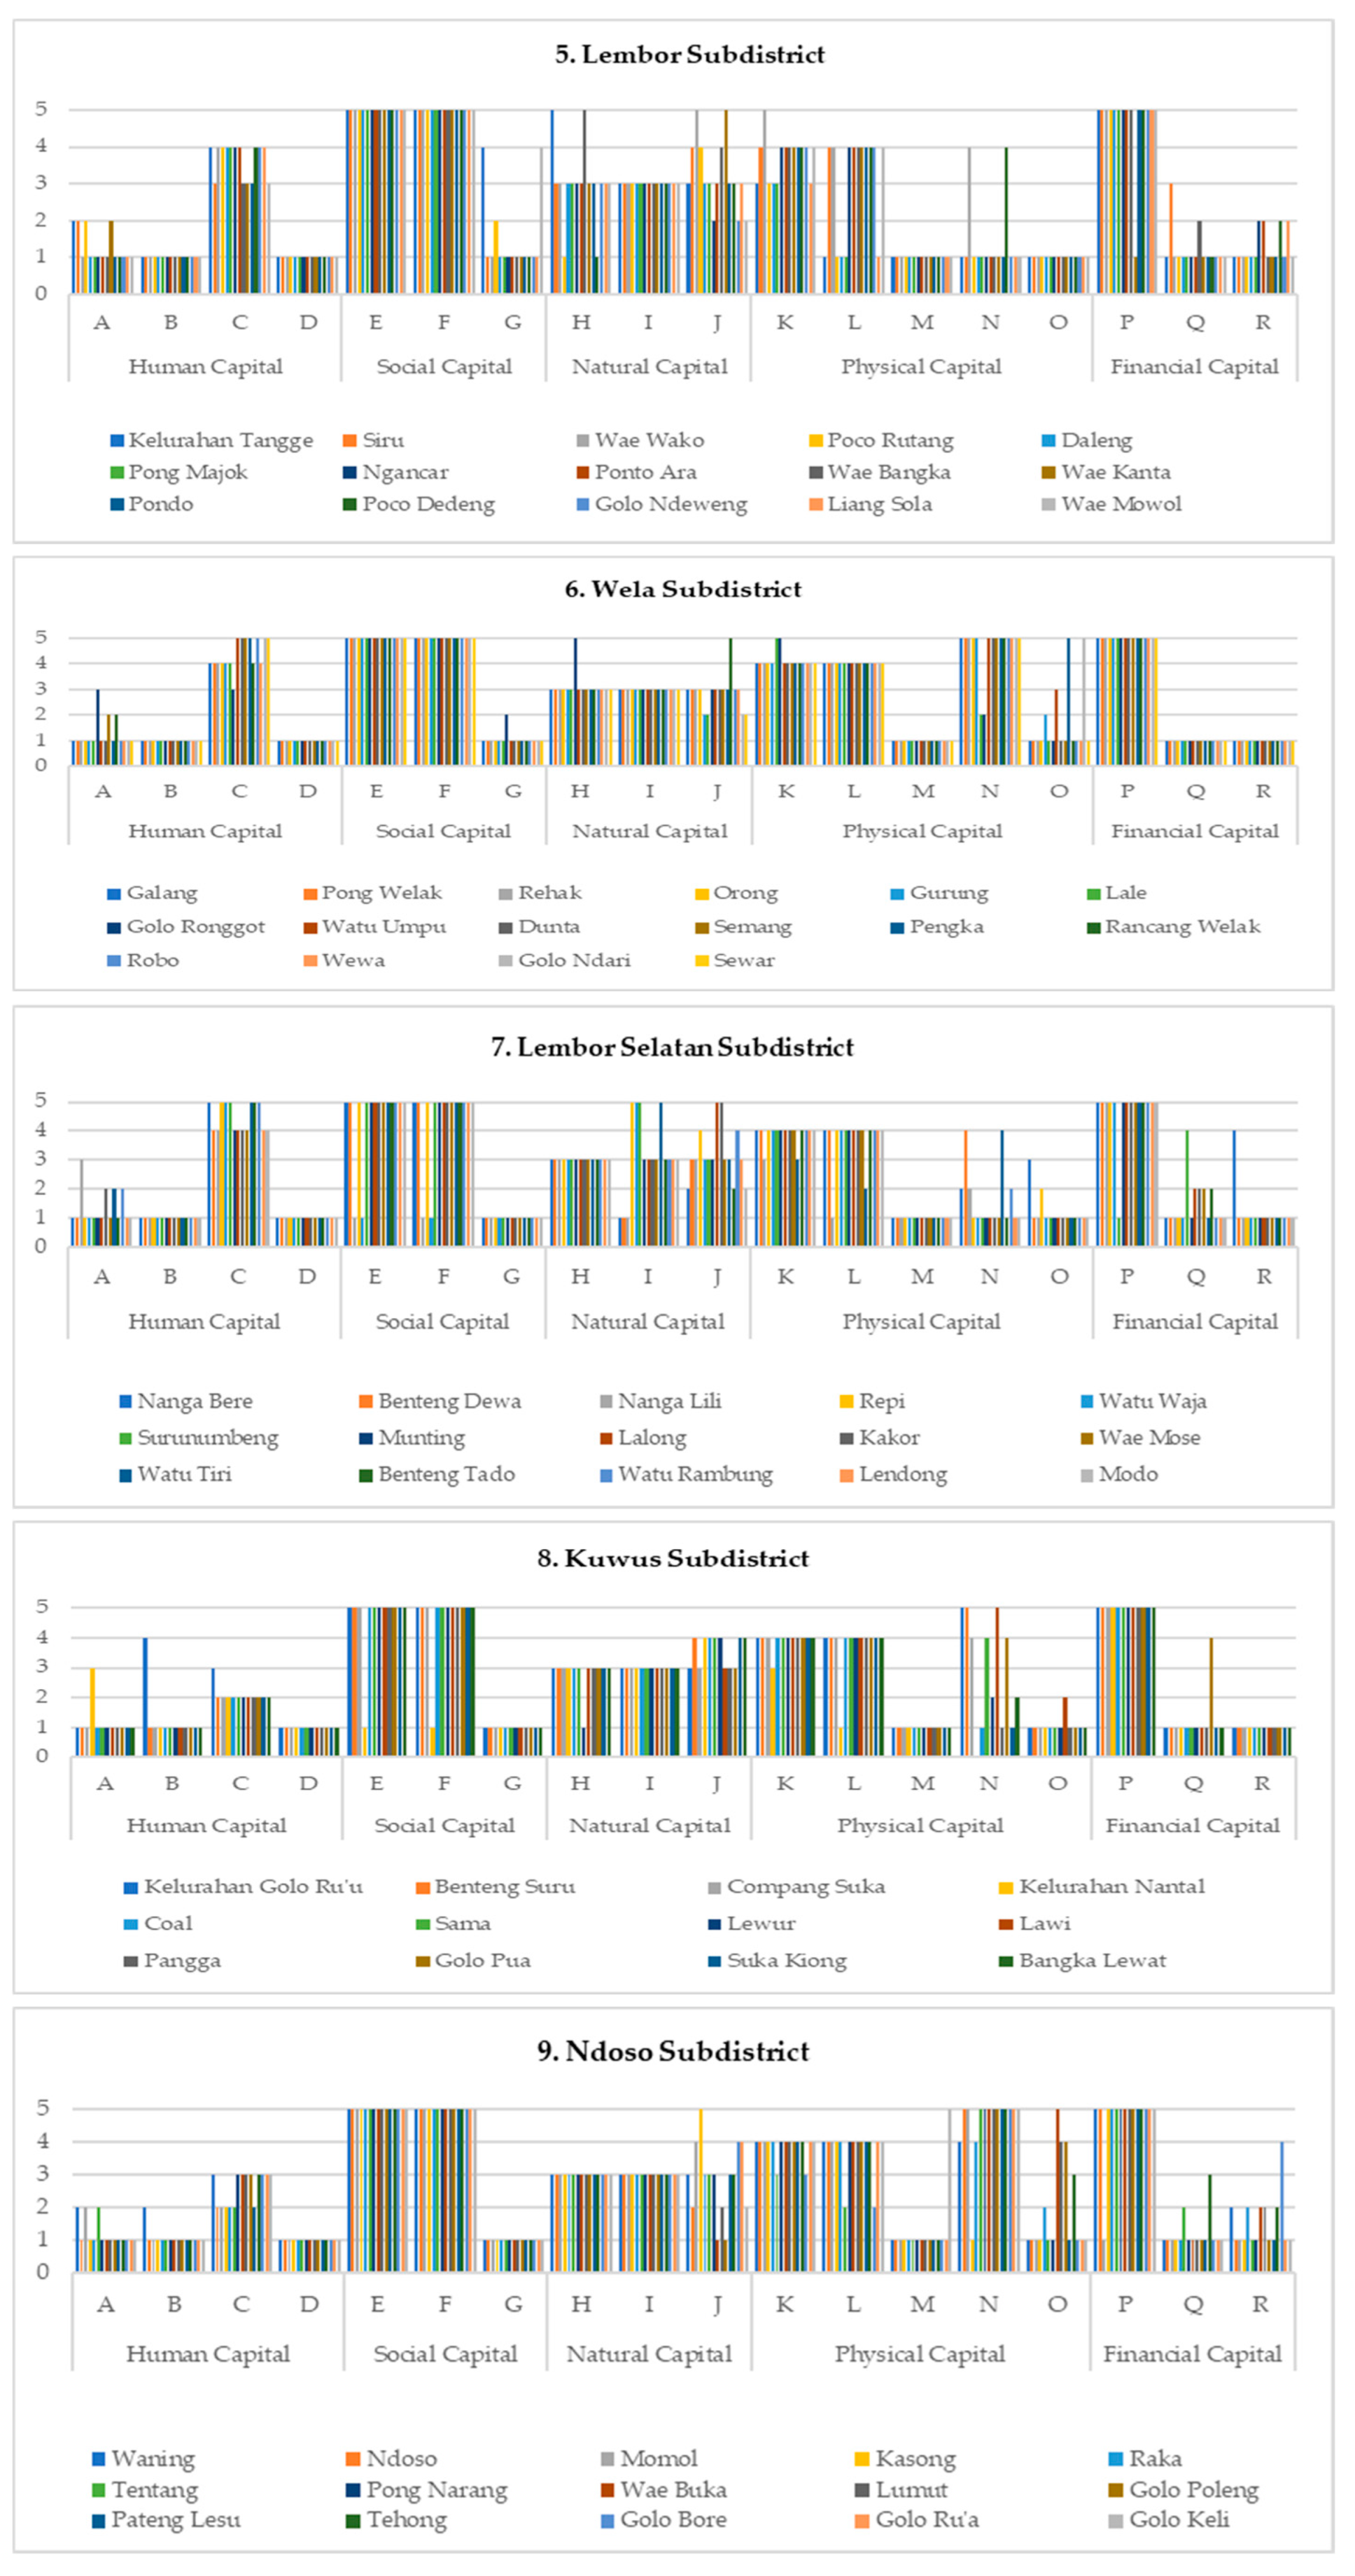
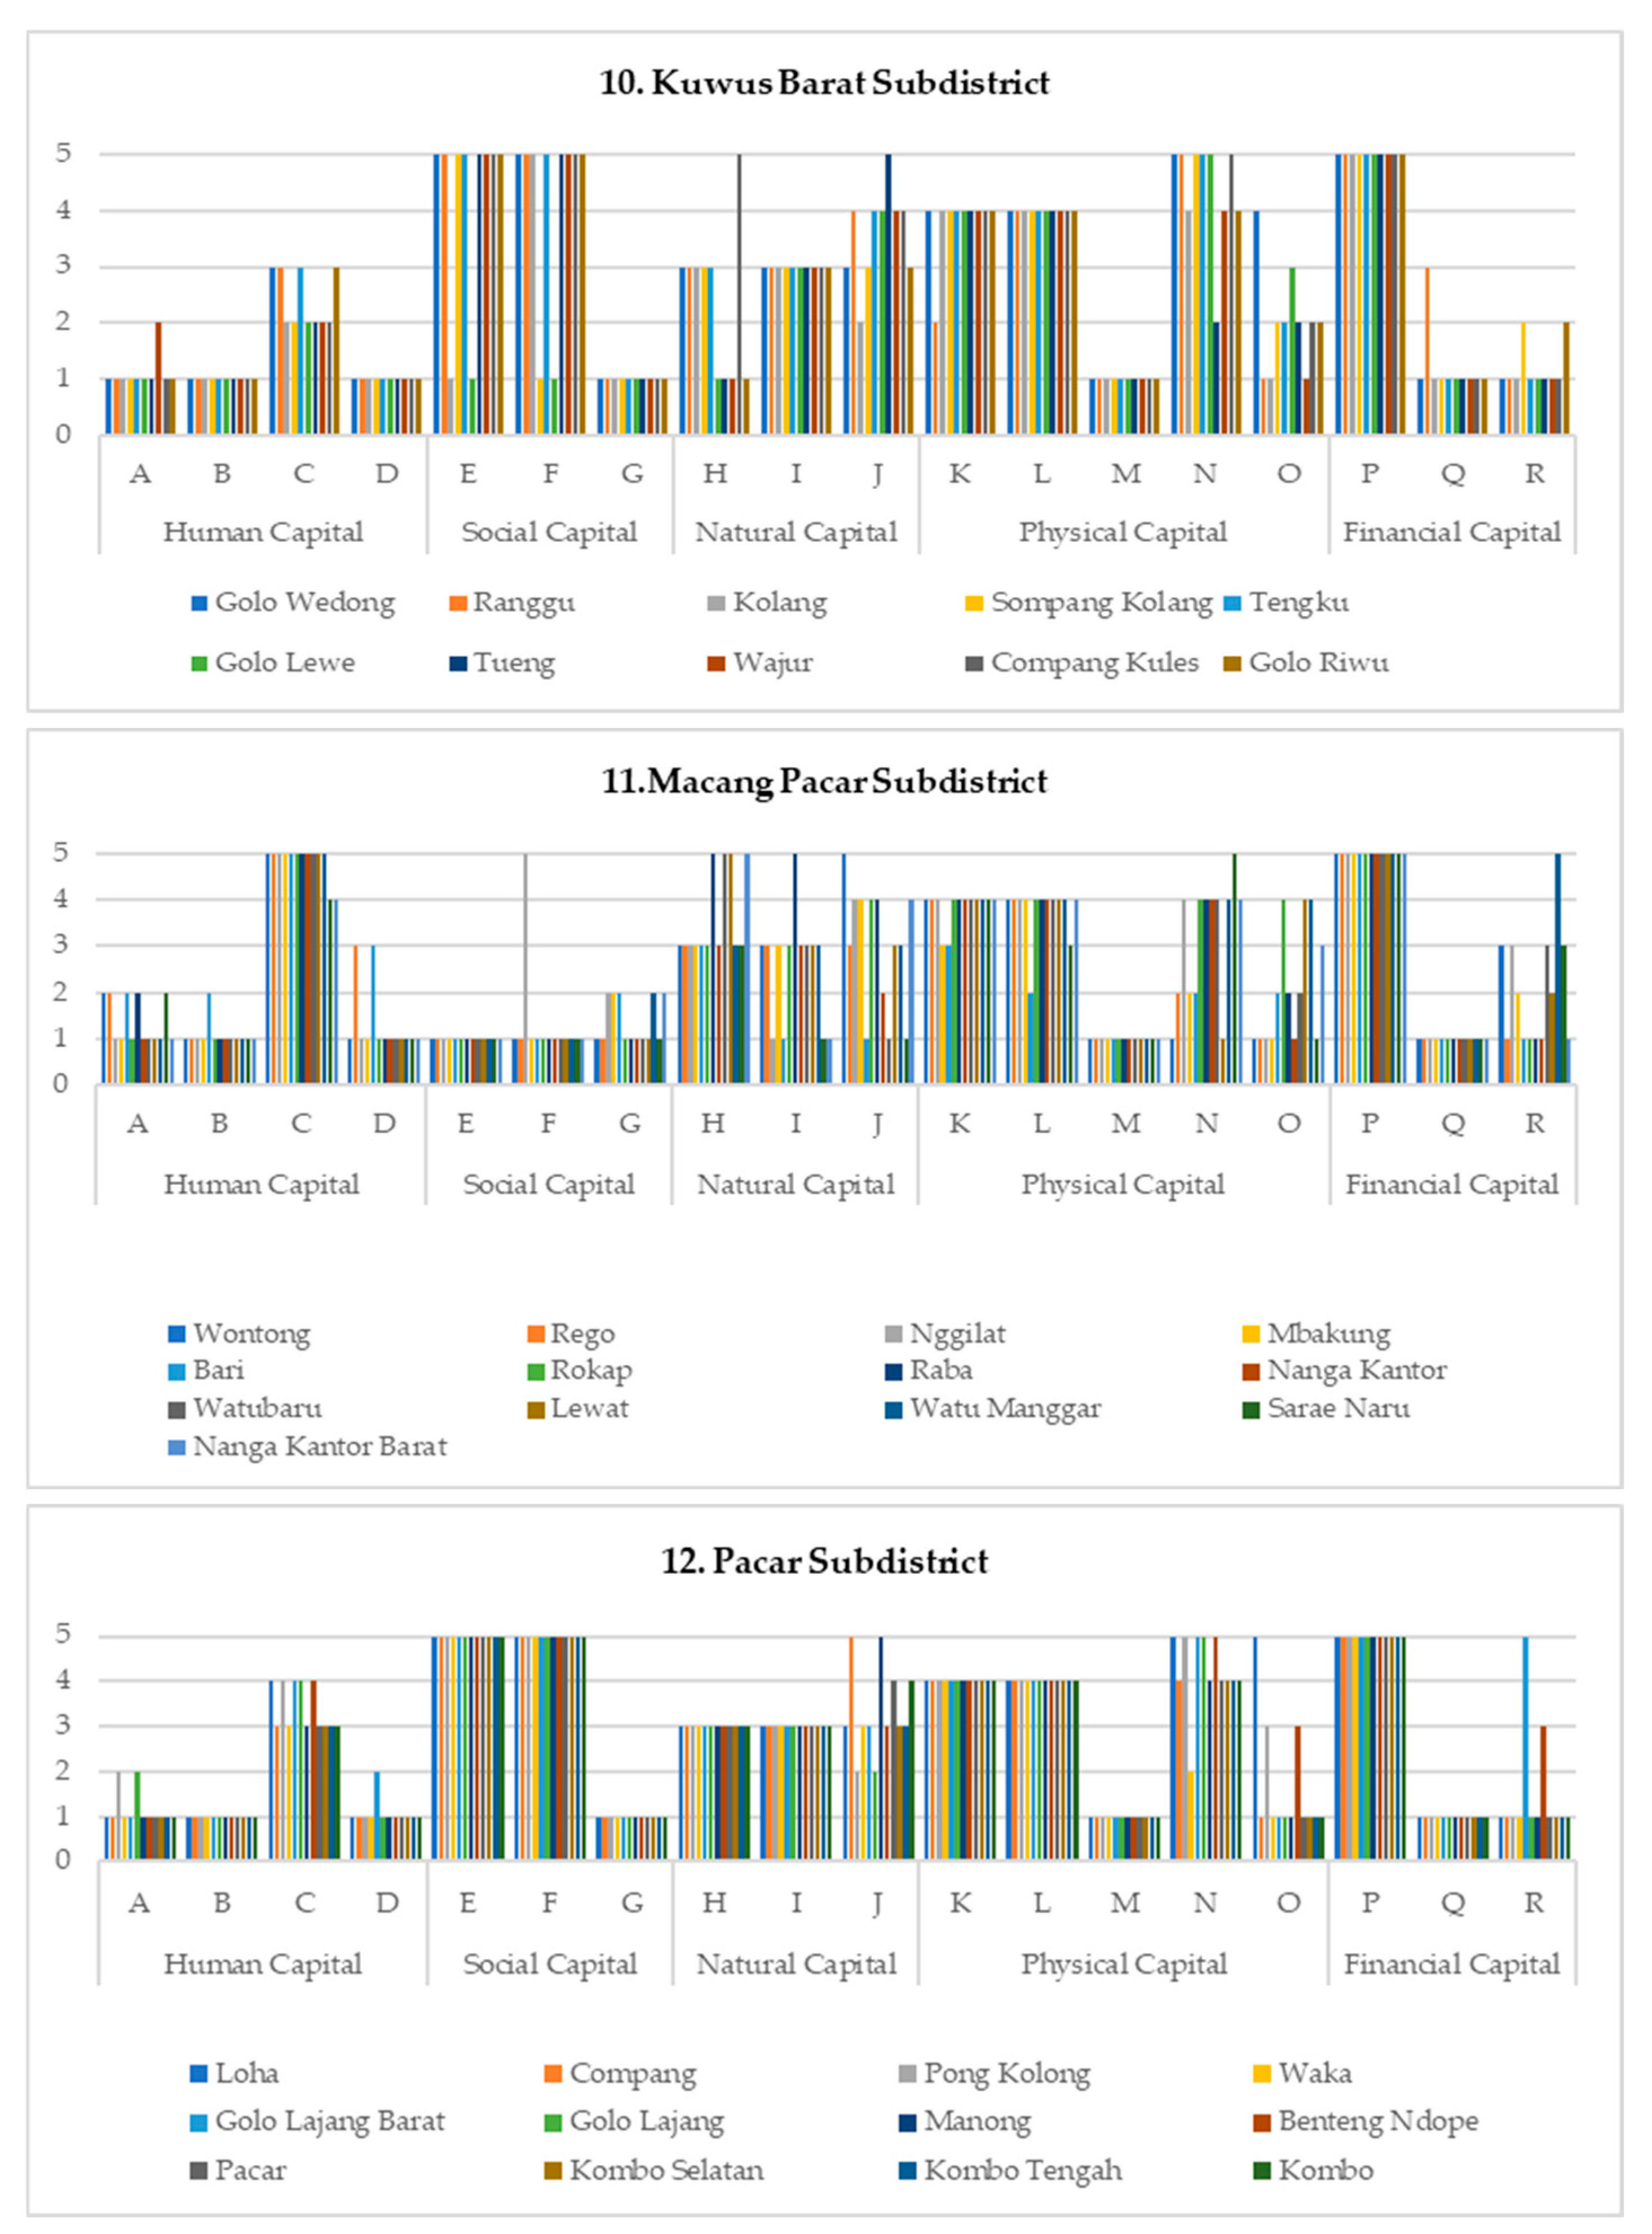
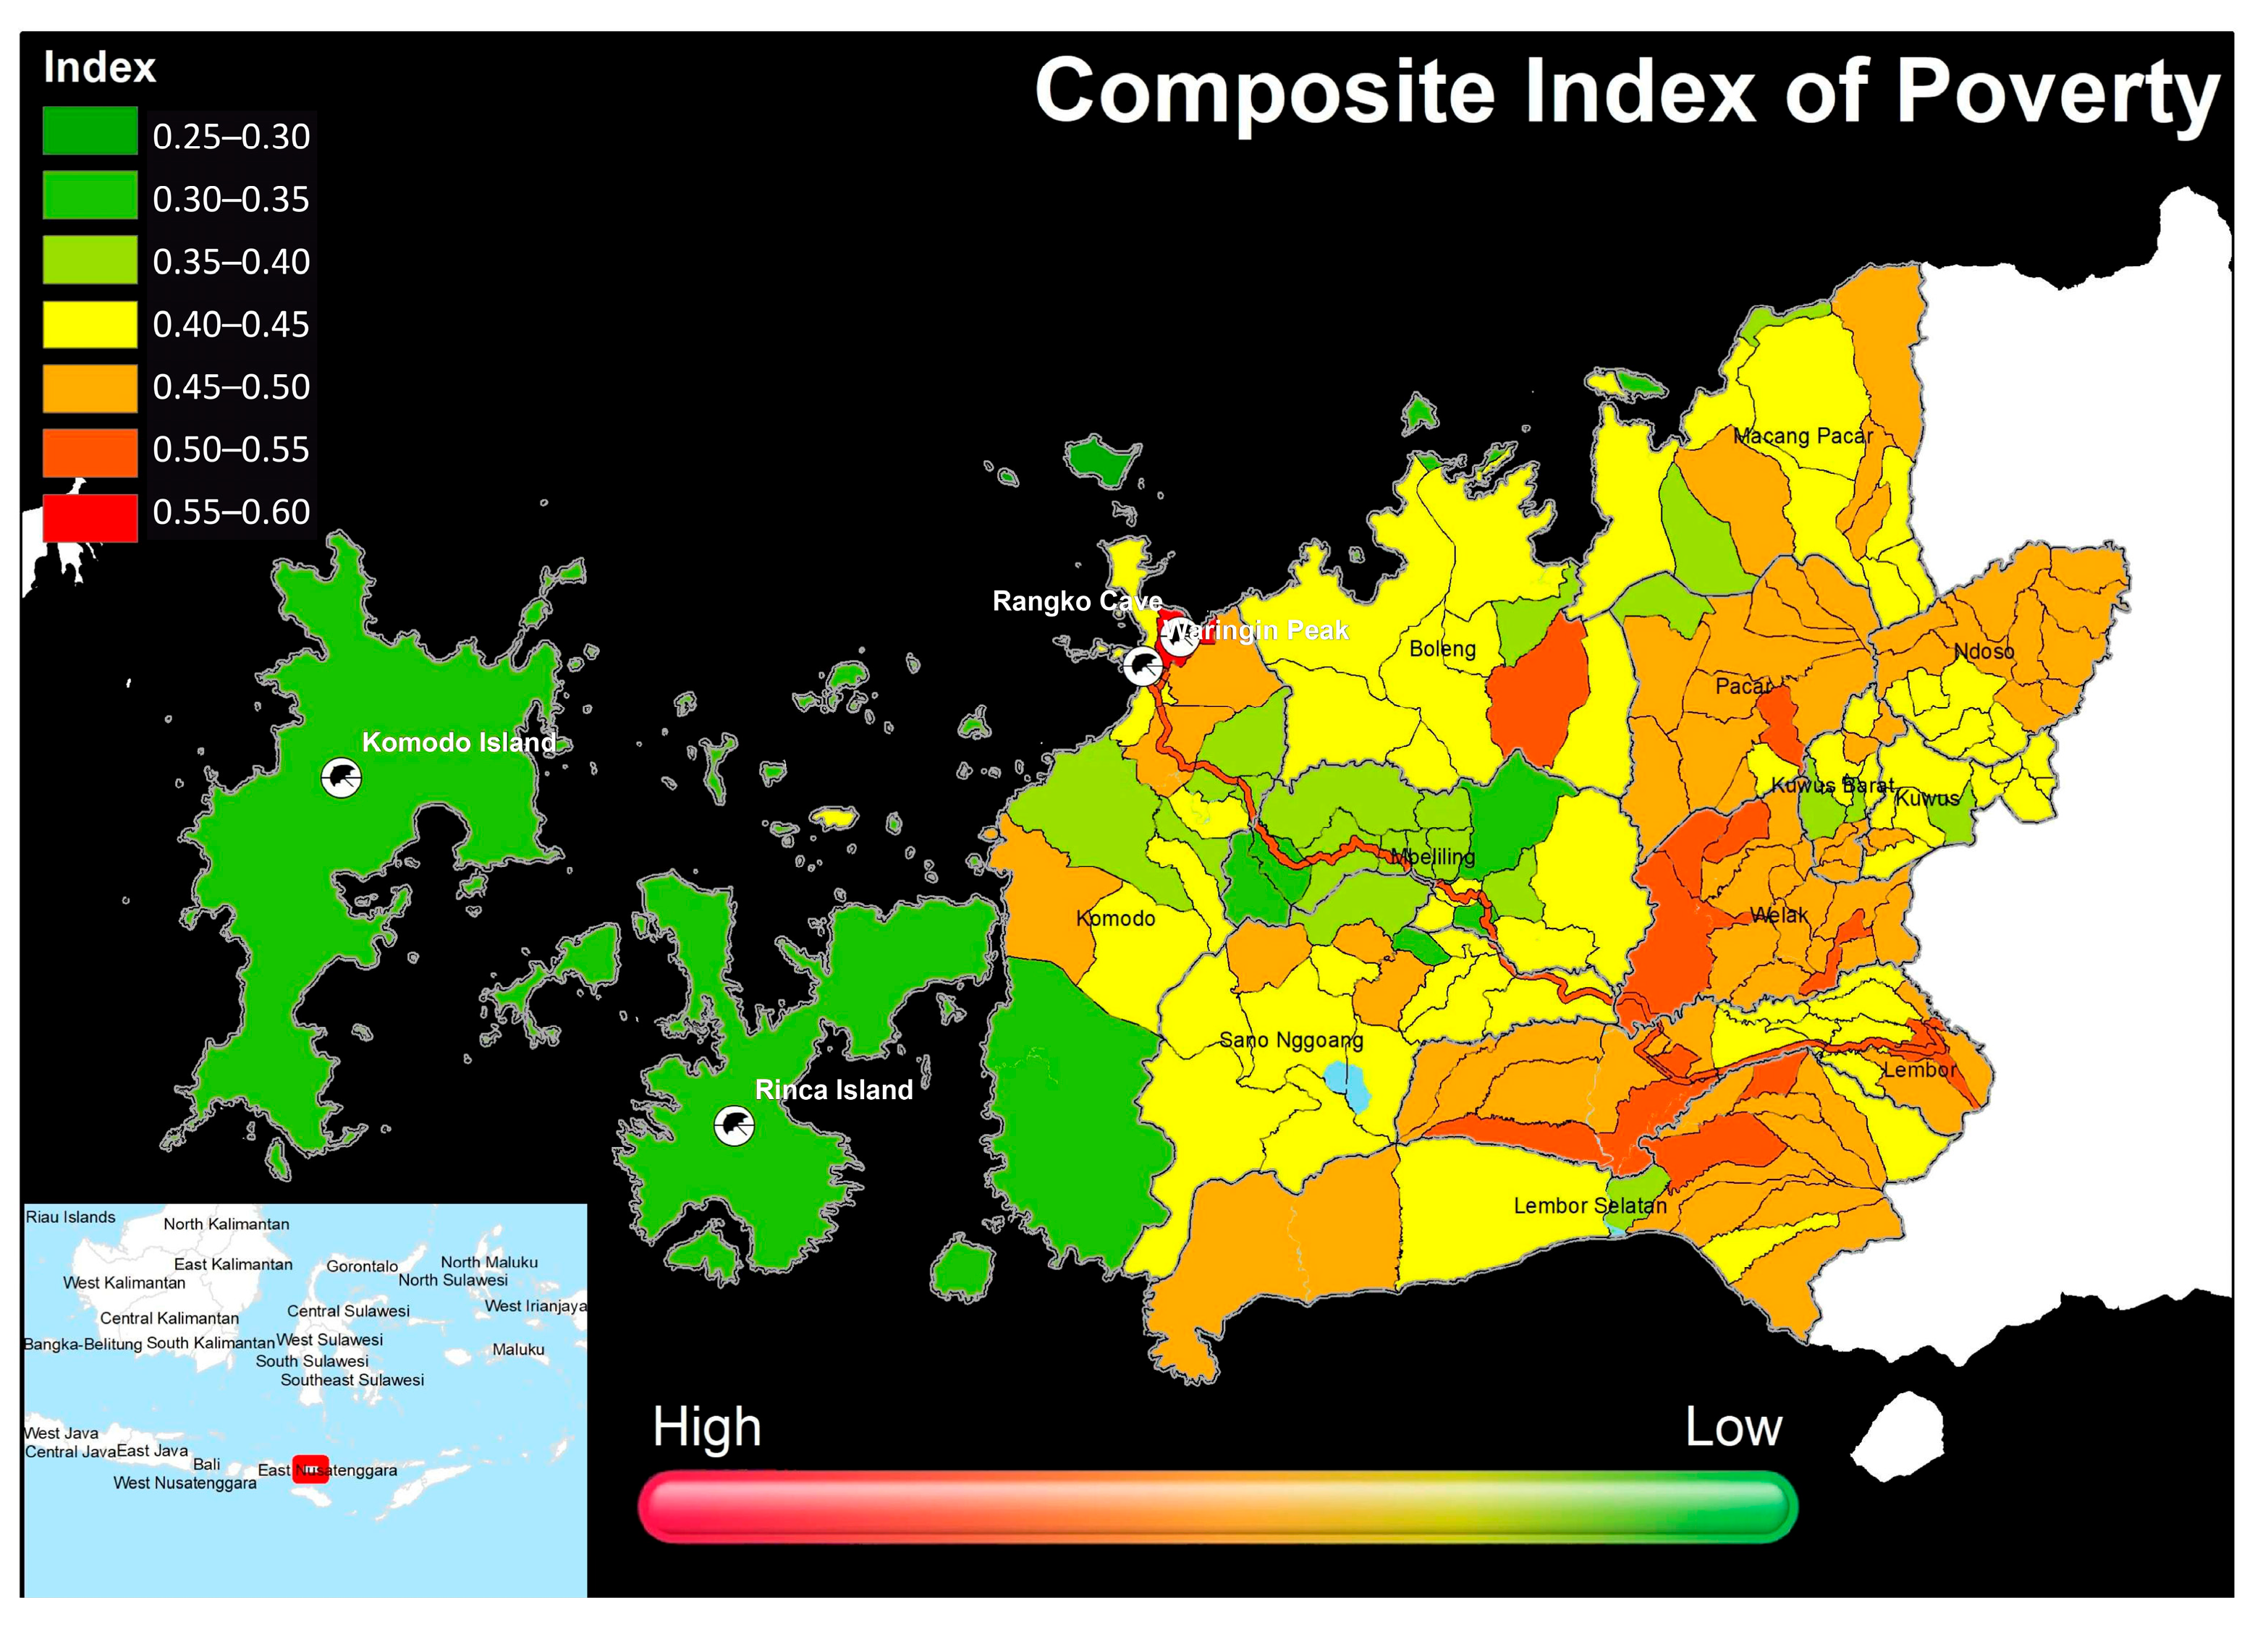
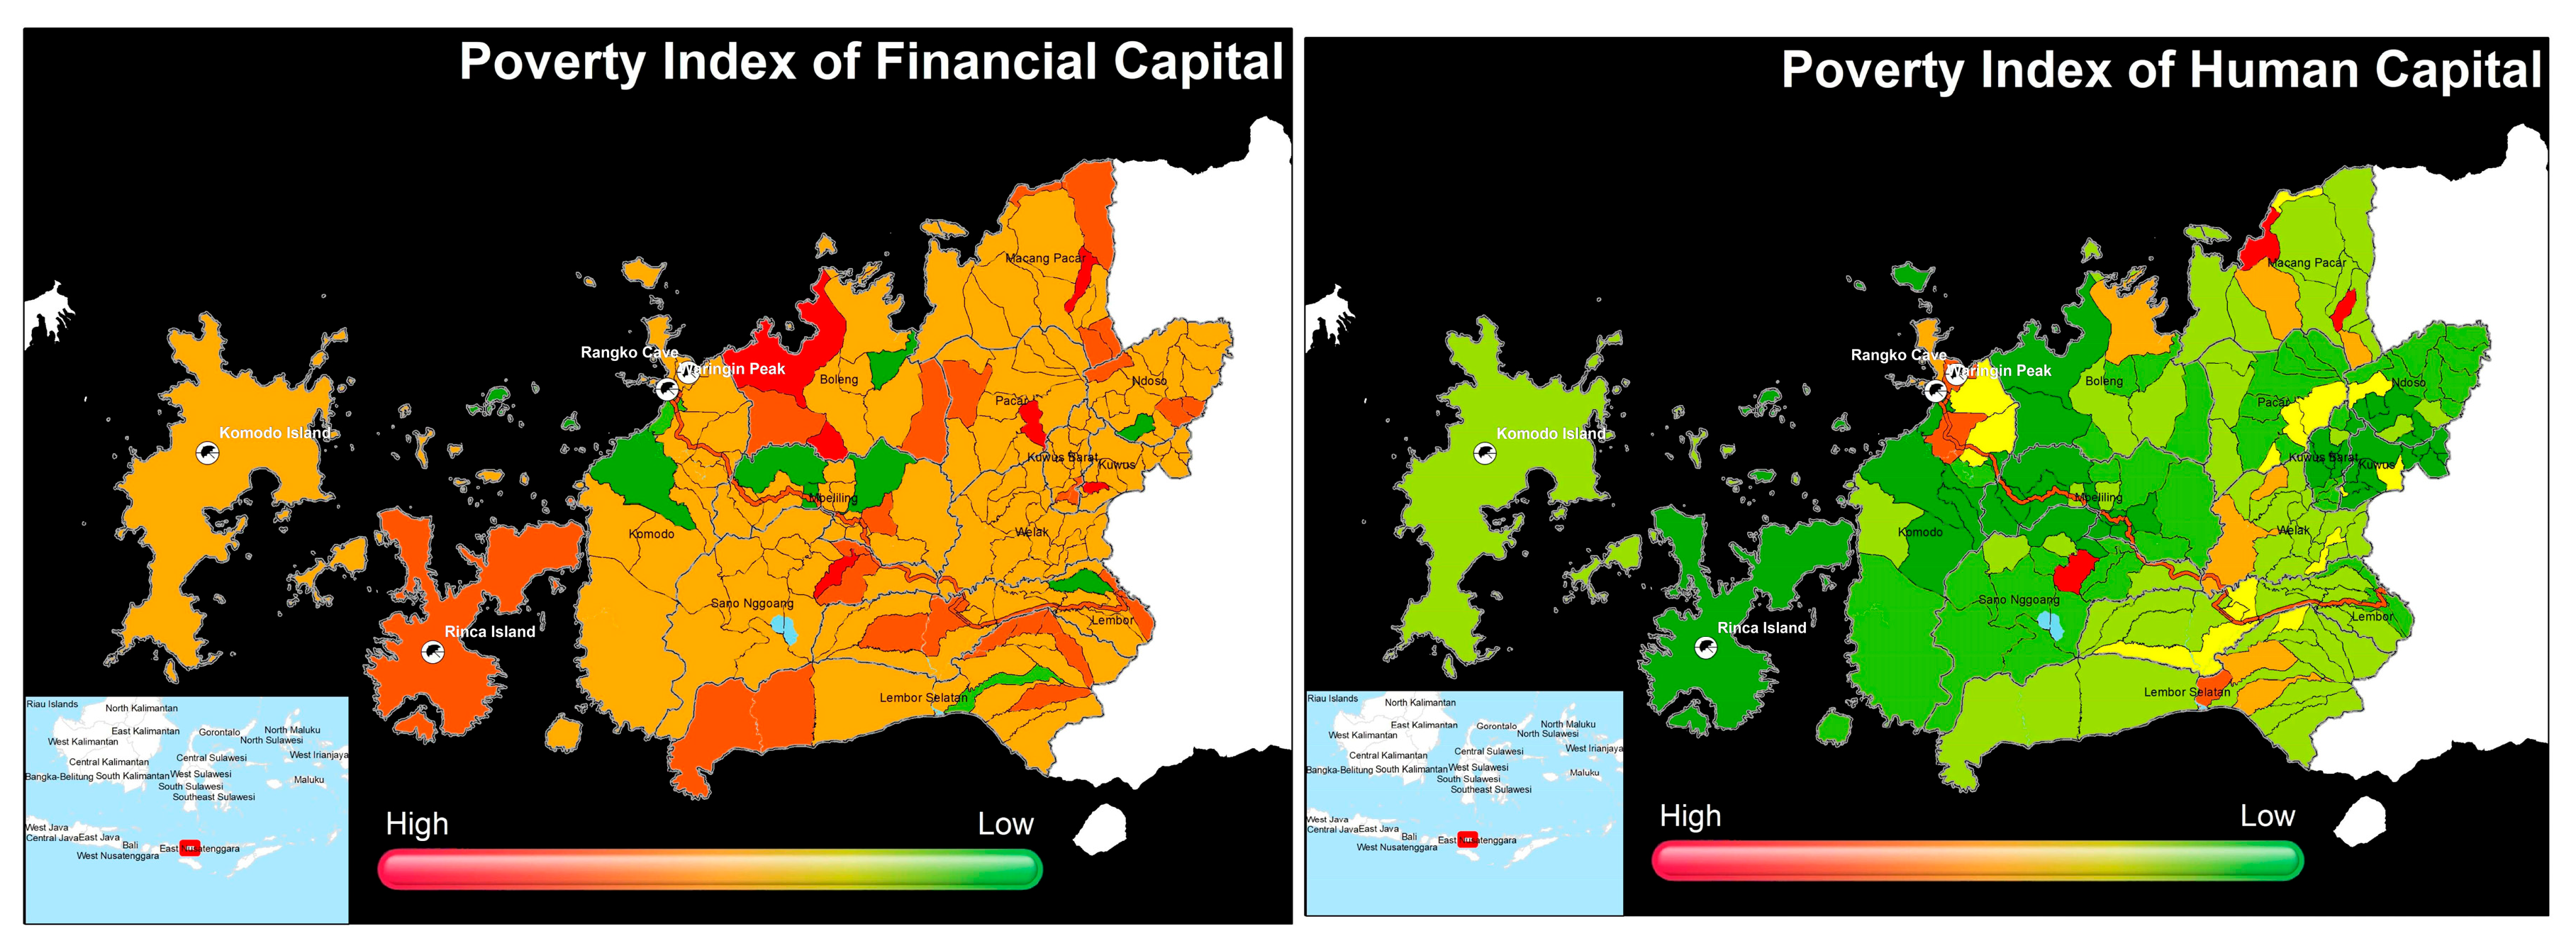
- Human Capital: Access to senior high schools (A), prevalence of communicable diseases (B), access to higher education (C), access to vocational training (D).
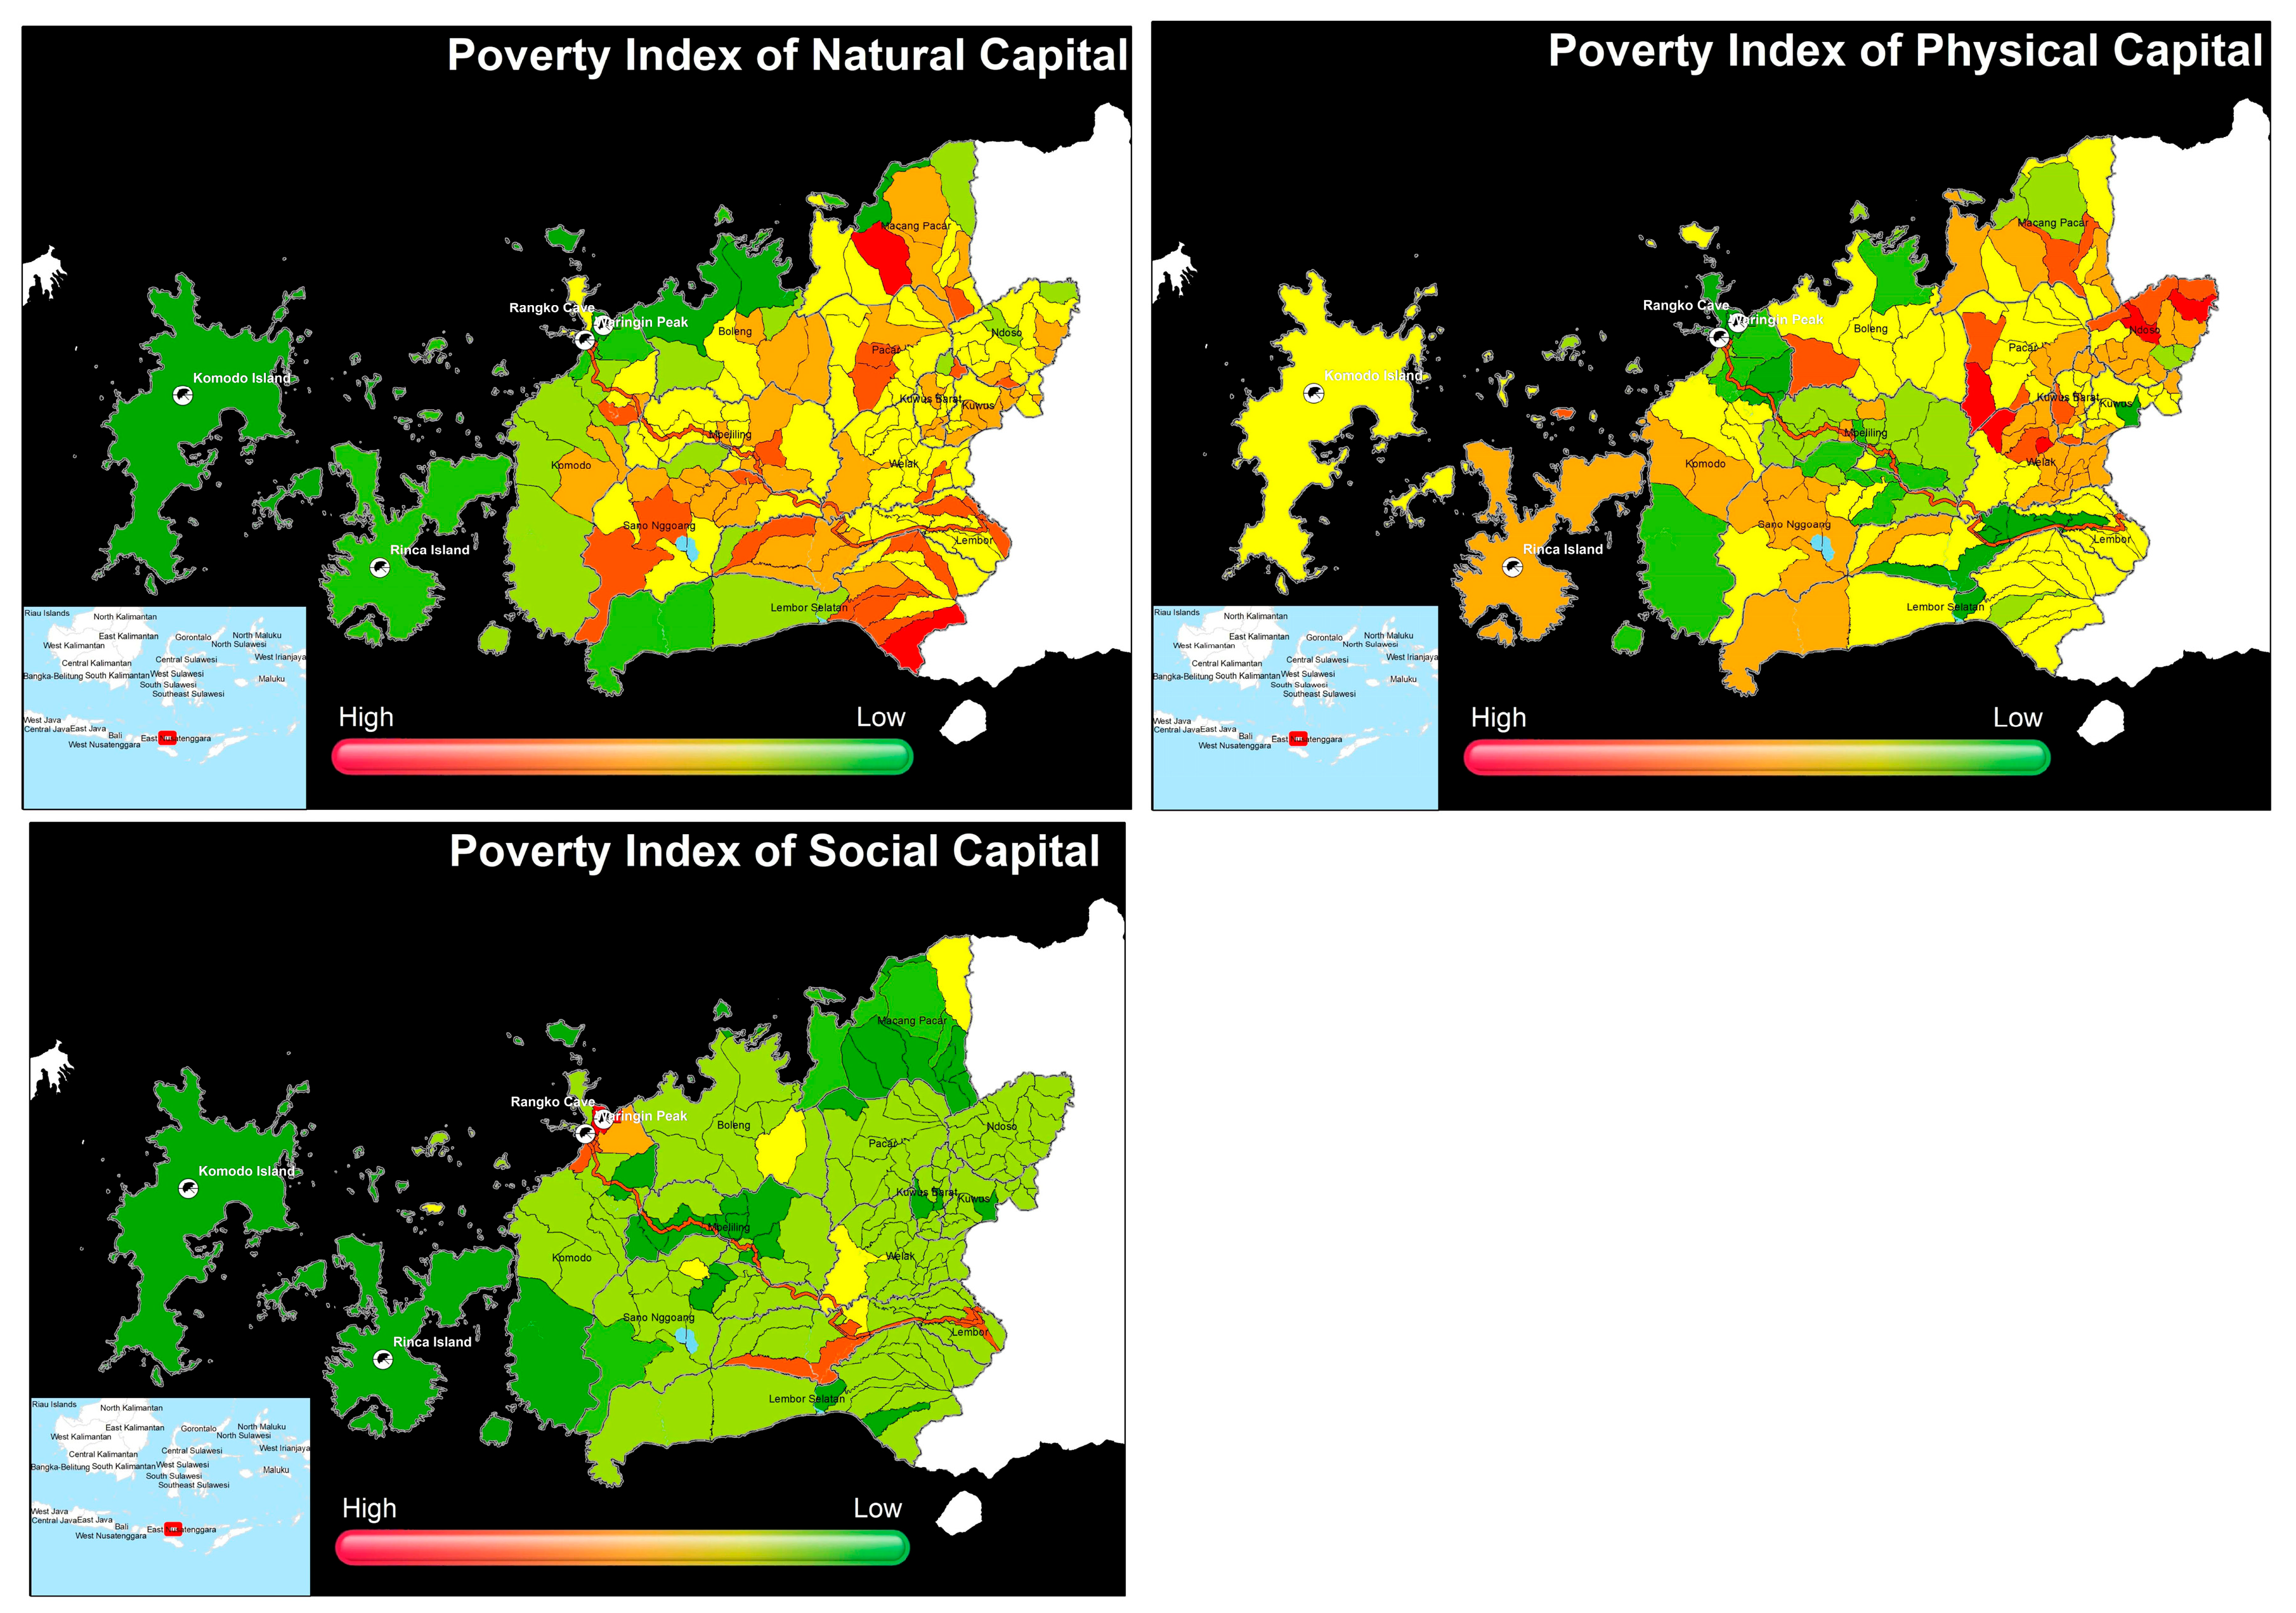
- Social Capital: Neighborhood safety initiatives (E), maintenance of local security systems (F), and variations in crime rates (G).
- Natural Capital: Trends in disaster occurrences (H), presence of mangrove ecosystems (I), and access to surface water sources (J).
- Physical Capital: Access to drinking water (K), access to clean water (L), sanitation facilities (M), road infrastructure quality (N), and access to electricity (O).
- Financial Capital: Access to financial credit (P), presence of village-owned enterprises (BUMDes) (Q), and access to banking services (R).
3.2. Composite Poverty Index Distribution
4. Discussion
4.1. Linking Tourism Investment and Persistent Poverty
4.2. Drivers of Spatial Inequalities Across Multidimensional Capitals
4.3. Interpretation of the Composite Poverty Index and Policy Implications
5. Conclusions
Author Contributions
Funding
Institutional Review Board Statement
Informed Consent Statement
Data Availability Statement
Conflicts of Interest
Appendix A
| ANOVA Test Result a | ||||||
|---|---|---|---|---|---|---|
| Model |
Unstandardized Coefficients | Standardized Coefficients | t | Sig. | ||
| B | Std. Error | Beta | ||||
| 18 | (Constant) | 3.313 | 8.890 | 0.373 | 0.710 | |
| Main family toilet waste disposal site | 2.408 | 0.638 | 0.223 | 3.776 | <0.001 | |
| Number of Senior High Schools (SMA), Islamic Senior High Schools (MA), and Vocational High Schools (SMK) | −4.597 | 1.679 | −0.167 | −2.738 | 0.007 | |
| Activation of community-based security system (initiative-based) | −4.333 | 2.339 | −0.123 | −1.852 | 0.066 | |
| Percentage of households without electricity | 0.074 | 0.035 | 0.121 | 2.131 | 0.035 | |
| R1208C—Small Business Credit (KUK) facility received by village residents | 9.842 | 3.849 | 0.140 | 2.557 | 0.012 | |
| R709AK–IK3—Number of people suffering from diseases | −0.331 | 0.083 | −0.223 | −4.000 | <0.001 | |
| R1402A—Number of Village-Owned Enterprises (BUMDes) | −2.853 | 1.087 | −0.149 | −2.625 | 0.010 | |
| R1304A—Construction/maintenance of community security posts | −4.413 | 2.827 | −0.111 | −1.561 | 0.121 | |
| R1209GK3—Distance to nearest bank agent | 0.215 | 0.095 | 0.129 | 2.255 | 0.026 | |
| Number of crime types (variation) | −3.951 | 1.791 | −0.130 | −2.206 | 0.029 | |
| Trend in number of disaster events (2020–2021) | −0.065 | 0.022 | −0.165 | −2.950 | 0.004 | |
| R701KK4—Distance to nearest Academy/Higher Education Institution | 0.097 | 0.044 | 0.139 | 2.224 | 0.028 | |
| Total number of vocational education institutions | −3.449 | 1.518 | −0.126 | −2.272 | 0.025 | |
| Number of surface water sources (variation) | −1.878 | 0.917 | −0.120 | −2.048 | 0.042 | |
| Main household drinking water source (1 = piped water utility/PDAM, 2 = wells, etc.) | 2.291 | 0.818 | 0.301 | 2.799 | 0.006 | |
| R308B2—Presence of mangrove trees (1 = present, 2 = absent, 3 = non-permanent) | 3.447 | 1.562 | 0.139 | 2.207 | 0.029 | |
| R507A—Main household drinking water source | −2.400 | 1.174 | −0.236 | −2.045 | 0.043 | |
| Variable | Index | Class | Range/Category |
|---|---|---|---|
| Number of Skill Education Institutions | 5 | Very Poor | 0.00–1.20 |
| Number of Skill Education Institutions | 4 | Poor | 1.20–2.40 |
| Number of Skill Education Institutions | 3 | Moderate | 2.40–3.60 |
| Number of Skill Education Institutions | 2 | Good | 3.60–4.80 |
| Number of Skill Education Institutions | 1 | Very Good | 4.80–6.00 |
| Number of High Schools (SMA/MA/SMK) | 5 | Very Poor | 0.00–0.80 |
| Number of High Schools (SMA/MA/SMK) | 4 | Poor | 0.80–1.60 |
| Number of High Schools (SMA/MA/SMK) | 3 | Moderate | 1.60–2.40 |
| Number of High Schools (SMA/MA/SMK) | 2 | Good | 2.40–3.20 |
| Number of High Schools (SMA/MA/SMK) | 1 | Very Good | 3.20–4.00 |
| Number of Crime Variations | 1 | Very Good | 0.00–0.80 |
| Number of Crime Variations | 2 | Good | 0.80–1.60 |
| Number of Crime Variations | 3 | Moderate | 1.60–2.40 |
| Number of Crime Variations | 4 | Poor | 2.40–3.20 |
| Number of Crime Variations | 5 | Very Poor | 3.20–4.00 |
| Number of Surface Water Source Variations | 5 | Very Poor | 0.00–0.80 |
| Number of Surface Water Source Variations | 4 | Poor | 0.80–1.60 |
| Number of Surface Water Source Variations | 3 | Moderate | 1.60–2.40 |
| Number of Surface Water Source Variations | 2 | Good | 2.40–3.20 |
| Number of Surface Water Source Variations | 1 | Very Good | 3.20–4.00 |
| Percentage of Non-Electricity User Households | 1 | Very Good | 0.00–24.13 |
| Percentage of Non-Electricity User Households | 2 | Good | 24.13–48.27 |
| Percentage of Non-Electricity User Households | 3 | Moderate | 48.27–72.40 |
| Percentage of Non-Electricity User Households | 4 | Poor | 72.40–96.53 |
| Percentage of Non-Electricity User Households | 5 | Very Poor | 96.53–100 |
| Number of Village-Owned Enterprises (BUMDes) | 5 | Very Poor | 0.00–1.00 |
| Number of Village-Owned Enterprises (BUMDes) | 4 | Poor | 1.00–2.00 |
| Number of Village-Owned Enterprises (BUMDes) | 3 | Moderate | 2.00–3.00 |
| Number of Village-Owned Enterprises (BUMDes) | 2 | Good | 3.00–4.00 |
| Number of Village-Owned Enterprises (BUMDes) | 1 | Very Good | 4.00–5.00 |
| Number of Epidemic Disease Sufferers | 1 | Very Good | 0–22 |
| Number of Epidemic Disease Sufferers | 2 | Good | 22–44 |
| Number of Epidemic Disease Sufferers | 3 | Moderate | 44–66 |
| Number of Epidemic Disease Sufferers | 4 | Poor | 66–88 |
| Number of Epidemic Disease Sufferers | 5 | Very Poor | 88–110 |
| Distance to Nearest Higher Education Institution | 1 | Very Good | 3.00–22.38 km |
| Distance to Nearest Higher Education Institution | 2 | Good | 22.38–41.76 km |
| Distance to Nearest Higher Education Institution | 3 | Moderate | 41.76–61.14 km |
| Distance to Nearest Higher Education Institution | 4 | Poor | 61.14–80.52 km |
| Distance to Nearest Higher Education Institution | 5 | Very Poor | 80.52–99.90 km |
| Distance to Nearest Bank Agent | 1 | Very Good | 0.00–12.00 km |
| Distance to Nearest Bank Agent | 2 | Good | 12.00–24.00 km |
| Distance to Nearest Bank Agent | 3 | Moderate | 24.00–36.00 km |
| Distance to Nearest Bank Agent | 4 | Poor | 36.00–48.00 km |
| Distance to Nearest Bank Agent | 5 | Very Poor | 48.00–60.00 km |
| Distance to Nearest Hospital | 1 | Very Good | 1.00–20.78 km |
| Distance to Nearest Hospital | 2 | Good | 20.78–40.56 km |
| Distance to Nearest Hospital | 3 | Moderate | 40.56–60.34 km |
| Distance to Nearest Hospital | 4 | Poor | 60.34–80.12 km |
| Distance to Nearest Hospital | 5 | Very Poor | 80.12–99.90 km |
| Existence of Mangroves | 1 | Good | Present (1) |
| Existence of Mangroves | 3 | Neutral | Non-coastal (3) |
| Existence of Mangroves | 5 | Poor | Not Present (2) |
| Drinking Water Source | 1 | Very Good | 1 (Branded Bottled Water) |
| Drinking Water Source | 2 | Good | 2 (Refilled Water), 3 (Piped with Meter) |
| Drinking Water Source | 3 | Moderate | 4 (Piped w/o Meter), 5 (Borehole/Pump Well) |
| Drinking Water Source | 4 | Fairly Poor | 6 (Well), 7 (Spring) |
| Drinking Water Source | 5 | Very Poor | 8 (River/Lake), 9 (Rainwater), 10 (Others) |
| Bathing/Washing Water Source | 1 | Very Good | 1 (Piped with Meter) |
| Bathing/Washing Water Source | 2 | Good | 2 (Piped w/o Meter), 3 (Borehole/Pump Well) |
| Bathing/Washing Water Source | 3 | Moderate | 4 (Well), 5 (Spring) |
| Bathing/Washing Water Source | 4 | Poor | 6 (River/Lake) |
| Bathing/Washing Water Source | 5 | Very Poor | 7 (Rainwater), 8 (Others) |
| Toilet Facility | 1 | Very Good | 1 (Private Toilet) |
| Toilet Facility | 2 | Good | 2 (Shared Toilet) |
| Toilet Facility | 4 | Poor | 3 (Public Toilet) |
| Toilet Facility | 5 | Very Poor | 4 (No Toilet) |
| Road Condition | 1 | Very Good | 1 (All Year Round) |
| Road Condition | 2 | Good | 2 (All Year Except Certain Periods) |
| Road Condition | 4 | Poor | 3 (Only in Dry Season) |
| Road Condition | 5 | Very Poor | 4 (Not Accessible All Year) |
| Credit Facility | 1 | Good | 1 (Available) |
| Credit Facility | 5 | Poor | 2 (Not Available) |
| Activation of Neighborhood Security System | 1 | Good | 1 (Yes) |
| Activation of Neighborhood Security System | 5 | Poor | 0 (No) |
| Existence of Security Post Maintenance | 1 | Good | 1 (Yes) |
| Existence of Security Post Maintenance | 5 | Poor | 0 (No) |
| Trend in Disaster Events 2020–2021 | 1 | Very Good | Significant Decrease (≥20%) |
| Trend in Disaster Events 2020–2021 | 2 | Good | Slight Decrease (10%–<20%) |
| Trend in Disaster Events 2020–2021 | 3 | Moderate | Stable (−10% to +10%) |
| Trend in Disaster Events 2020–2021 | 4 | Poor | Slight Increase (10%–<20%) |
| Trend in Disaster Events 2020–2021 | 5 | Very Poor | Significant Increase (≥20%) |
| Letter Code (Results Section) | Numeric Code (Method Section) | Indicator Description | Livelihood Capital |
|---|---|---|---|
| A | X1 | Access to senior high schools | Human Capital |
| B | X2 | Prevalence of communicable/epidemic diseases | Human Capital |
| C | X3 | Distance to nearest higher education institution | Human Capital |
| D | X4 | Access to vocational training institutions | Human Capital |
| E | X5 | Neighborhood safety initiatives (community-based security systems) | Social Capital |
| F | X6 | Maintenance of local security infrastructure (security posts) | Social Capital |
| G | X7 | Variations in crime rates | Social Capital |
| H | X13 | Trends in disaster occurrences | Natural Capital |
| I | X14 | Presence of mangrove ecosystems | Natural Capital |
| J | X15 | Access to surface water sources | Natural Capital |
| K | X8 | Main source of drinking water | Physical Capital |
| L | X9 | Main source of clean water (washing/bathing) | Physical Capital |
| M | X10 | Type of sanitation facilities | Physical Capital |
| N | X11 | Road infrastructure quality/access to production centers | Physical Capital |
| O | X12 | Access to electricity (inverse of % non-users) | Physical Capital |
| P | X16 | Access to financial credit institutions | Financial Capital |
| Q | X17 | Presence of Village-Owned Enterprises (BUMDes) | Financial Capital |
| R | X18 | Access to banking services/distance to nearest bank agent | Financial Capital |
References
- Roblek, V.; Kejžar, A. A comprehensive examination of indicators for evaluating poverty and social exclusion. Discov. Glob. Soc. 2025, 3, 51. [Google Scholar] [CrossRef]
- Ayele, A.W.; Ewinetu, Y.; Delesho, A.; Alemayehu, Y.; Edemealem, H. Prevalence and associated factors of multidimensional poverty among rural households in East Gojjam zone, Northern Ethiopia: A community-based cross-sectional study. BMC Public Health 2025, 25, 167. [Google Scholar] [CrossRef]
- World Bank Group. Poverty & Equity Brief [Internet]. World Bank Group. 2019. Available online: https://databankfiles.worldbank.org/public/ddpext_download/poverty/33EF03BB-9722-4AE2-ABC7-AA2972D68AFE/Global_POVEQ_IDN.pdf (accessed on 12 February 2024).
- BPS-Statistics of Manggarai Barat Regency. Manggarai Barat Regency in Figures [Internet]. Labuan Bajo. 2024. Available online: https://manggaraibaratkab.bps.go.id/id/publication/2024/02/28/b3f41d3b859a25216d016797/kabupaten-manggarai-barat-dalam-angka-2024.html (accessed on 12 February 2024).
- Gai, A.; Ernan, R.; Fauzi, A.; Barus, B.; Putra, D. Poverty Reduction Through Adaptive Social Protection and Spatial Poverty Model in Labuan Bajo, Indonesia’s National Strategic Tourism Areas. Sustainability 2025, 17, 555. [Google Scholar] [CrossRef]
- Hickel, J. The true extent of global poverty and hunger: Questioning the good news narrative of the Millennium Development Goals. Third World Q. 2016, 37, 749–767. [Google Scholar] [CrossRef]
- Béné, C.; Newsham, A.; Davies, M.; Ulrichs, M.; Godfrey-Wood, R. Resilience, poverty and development. J. Int. Dev. 2014, 26, 598–623. [Google Scholar] [CrossRef]
- Scoones, I. Sustainable Livelihoods and Rural Development; Practical Action Publishing Rugby: Rugby, UK, 2015. [Google Scholar]
- Morse, S. Having Faith in the Sustainable Livelihood Approach: A Review. Sustainability 2025, 17, 539. [Google Scholar] [CrossRef]
- Amaliah, Y.; Husni, A.H.A.A.; Ansar, M.C.; Chowdhury, K. The research landscape of rural sustainable livelihood: A scientometric analysis. Front. Sustain. 2025, 6, 1548378. [Google Scholar] [CrossRef]
- Natarajan, N.; Newsham, A.; Rigg, J.; Suhardiman, D. A sustainable livelihoods framework for the 21st century. World Dev. 2022, 155, 105898. [Google Scholar] [CrossRef]
- Tian, J.; Sui, C.; Zeng, S.; Ma, J. Spatial Differentiation Characteristics, Driving Mechanisms, and Governance Strategies of Rural Poverty in Eastern Tibet. Land 2024, 13, 978. [Google Scholar] [CrossRef]
- Liu, M.; Ge, Y.; Hu, S.; Hao, H. The Spatial Effects of Regional Poverty: Spatial Dependence, Spatial Heterogeneity and Scale Effects. ISPRS Int. J. Geo-Inf. 2023, 12, 501. [Google Scholar] [CrossRef]
- Deng, Q.; Li, E.; Zhang, P. Livelihood sustainability and dynamic mechanisms of rural households out of poverty: An empirical analysis of Hua County, Henan Province, China. Habitat Int. 2020, 99, 102160. [Google Scholar] [CrossRef]
- Barman, P.; Sarkar, B.; Islam, N. Livelihood assessment through the sustainable livelihood security index in Majuli river Island, Assam. GeoJournal 2025, 90, 105. [Google Scholar] [CrossRef]
- DFID. Section 2: Framework. In Sustainable Livelihoods Guidance Sheets; DFID: London, UK, 2000. [Google Scholar]
- Scoones, I. Sustainable Rural Livelihoods: A Framework for Analysis; Institute of Development Studies: Falmer, UK, 1998. [Google Scholar]
- Aldrich, D.P.; Meyer, M.A.; Page-Tan, C.M. Social capital and natural hazards governance. In Oxford Research Encyclopedia of Natural Hazard Science; Oxford University Press: Oxford, UK, 2018. [Google Scholar]
- Morse, S.; McNamara, N.; Acholo, M. Sustainable Livelihood Approach: A Critical Analysis of Theory and Practice; University of Reading: Reading, UK, 2009. [Google Scholar]
- Serrat, O. The Sustainable Livelihoods Approach. In Knowledge Solutions; Springer: Singapore, 2017; pp. 21–26. [Google Scholar]
- Saaty, T.L. The Analytic Hierarchy Process: Planning, Priority Setting, Resource Allocation; McGraw-Hill International Book Company: New York, NY, USA, 1980. [Google Scholar]
- Álvarez-Gamboa, J.; Cabrera-Barona, P.; Jácome-Estrella, H. Financial inclusion and multidimensional poverty in Ecuador: A spatial approach. World Dev. Perspect. 2021, 22, 100311. [Google Scholar] [CrossRef]
- Liu, M.; Ge, Y.; Hu, S.; Stein, A.; Ren, Z. The spatial–temporal variation of poverty determinants. Spat. Stat. 2022, 50, 100631. [Google Scholar] [CrossRef]
- Chambers, R.; Conway, G. Sustainable Rural Livelihoods: Practical Concepts for the 21st Century; Institute of Development Studies: Falmer, UK, 1992. [Google Scholar]
- Alongi, D.M. Mangrove forests: Resilience, protection from tsunamis, and responses to global climate change. Estuar. Coast. Shelf Sci. 2008, 76, 1–13. [Google Scholar] [CrossRef]
- Walters, B.B. Mangrove forests and human security. CABI Rev. 2008, 3, 1–9. [Google Scholar] [CrossRef]
- Walters, B.B. Local management of mangrove forests in the Philippines: Successful conservation or efficient resource exploitation? Hum. Ecol. 2004, 32, 177–195. [Google Scholar] [CrossRef]
- Primavera, J.H. Integrated mangrove-aquaculture systems in Asia. Integr. Coast. Zone Manag. 2000, 121–130. [Google Scholar]
- Brown, B.; Fadillah, R.; Nurdin, Y.; Soulsby, I.; Ahmad, R. Case Study: Community Based Ecological Mangrove Rehabilitation (CBEMR) in Indonesia. From small (12–33 ha) to medium scales (400 ha) with pathways for adoption at larger scales (>5000 ha). SAPI EN S. Surv. Perspect. Integr. Environ. Soc. 2014, 7, 2. [Google Scholar]
- UNESCO. The United Nations World Water Development Report 2021: Valuating Water, 2021st ed.; United Nations Educational, Scientific and Cultural Organization (UNESCO): Paris, France, 2021; 206p. [Google Scholar]
- Choudhary, N.; Schuster, R.C.; Brewis, A.; Wutich, A. Household water insecurity affects child nutrition through alternative pathways to WASH: Evidence from India. Food Nutr. Bull. 2021, 42, 170–187. [Google Scholar] [CrossRef]
- Cairncross, S.; Valdmanis, V. Water supply, sanitation and hygiene promotion (chapter 41). In Disease Control Priorities in Developing Countries; The International Bank for Reconstruction and Development/The World Bank: Washington, DC, USA, 2006. [Google Scholar]
- Dercon, S.; Gilligan, D.O.; Hoddinott, J.; Woldehanna, T. The impact of agricultural extension and roads on poverty and consumption growth in fifteen Ethiopian villages. Am. J. Agric. Econ. 2009, 91, 1007–1021. [Google Scholar] [CrossRef]
- Fan, S.; Chan-Kang, C. Road Development, Economic Growth, and Poverty Reduction in China; International Food Policy Research Institute (IFPRI): Washington, DC, USA, 2005; Volume 12. [Google Scholar]
- Ritonga, D.H.S. The Effectiveness of Layanan Keuangan Tanpa Kantor Dalam Rangka Keuangan Inklusif (Laku Pandai) Study on Brilink Pt Bank Rakyat Indonesia (Persero) Tbk; North Sumatera Regional Office, Universitas Brawijaya: Malang, Indonesia, 2019. [Google Scholar]
- Demirgüç-Kunt, A.; Singer, D. Financial Inclusion and Inclusive Growth: A Review of Recent Empirical Evidence; World Bank Policy Research Working Papers: Washington, DC, USA, 2017; p. 8040. [Google Scholar]
- Psacharopoulos, G.; Patrinos, H.A. Returns to investment in education: A further update. Educ. Econ. 2004, 12, 111–134. [Google Scholar] [CrossRef]
- Agency (IEA) IE. Energy Access Outlook Report; IEA: Paris, France, 2017. [Google Scholar]
- Rockström, J.; Falkenmark, M.; Folke, C.; Lannerstad, M.; Barron, J.; Enfors, E.; Gordon, L.; Heinke, J.; Hoff, H.; Pahl-Wostl, C. Water Resilience for Human Prosperity; Cambridge University Press: Cambridge, UK, 2014. [Google Scholar]
- Adeningsih, S.H. Capacity Building of Village-Owned Enterprises (BUMDes) in Encouraging Village Economic Welfare. Riwayat Educ. J. Hist. Humanit. 2025, 8, 602–609. [Google Scholar] [CrossRef]
- Putra, I.R.A.S.; Wibowo, R.A.; Purwadi; Andari, T.; Asrori; Christy, N.N.A.; Santoso, C.W.B.; Harefa, H.Y.; Suryawardana, E. Village-Owned Enterprises Perspectives Towards Challenges and Opportunities in Rural Entrepreneurship: A Qualitative Study with Maxqda Tools. Adm. Sci. 2025, 15, 74. [Google Scholar] [CrossRef]
- Wulandari, R.D.; Laksono, A.D.; Nantabah, Z.K.; Rohmah, N.; Zuardin, Z. Hospital utilization in Indonesia in 2018: Do urban–rural disparities exist? BMC Health Serv. Res. 2022, 22, 491. [Google Scholar] [CrossRef]
- Firmansyah, M.R.; Antariksa, A.; Ridjal, A.M. Pola Ruang Pura Kahyangan Jawa Timur dan Bali Berdasarkan Susunan Kosmos Tri Angga dan Tri Hita Karana; Brawijaya University: Malang, Indonesia, 2017. [Google Scholar]
- Altbach, P.G. Access means inequality. In The International Imperative in Higher Education; Springer: Berlin/Heidelberg, Germany, 2013; pp. 21–24. [Google Scholar]
- Alkire, S.; Santos, M.E. Acute Multidimensional Poverty: A New Index for Developing Countries; Oxford Poverty and Human Development Initiative: Oxford, UK, 2011. [Google Scholar]
- Alkire, S.; Foster, J. Counting and multidimensional poverty measurement. J. Public Econ. 2011, 95, 476–487. [Google Scholar] [CrossRef]
- Subiyantoro, H.; Tarziraf, A.; Asmara, A. The role of vocational education as the key to economic development in Indonesia. In Proceedings of the 3rd Multidisciplinary International Conference, MIC, Jakarta, Indonesia, 28 October 2023. [Google Scholar]
- Chakravarty, S.; Lundberg, M.; Nikolov, P.; Zenker, J. Vocational training programs and youth labor market outcomes: Evidence from Nepal. J. Dev. Econ. 2019, 136, 71–110. [Google Scholar] [CrossRef]
- Lanjouw, P.F.; Tarp, F. Poverty, vulnerability and Covid-19: Introduction and overview. Rev. Dev. Econ. 2021, 25, 1797–1802. [Google Scholar] [CrossRef]
- Kanbur, R.; Venables, A.J. Spatial Inequality and Development Overview of Unu-Wider Project; The Governance and Social Development Resource Centre (GSDRC): Birmingham, UK, 2005. [Google Scholar]
- Kraay, A.; McKenzie, D. Do poverty traps exist? Assessing the evidence. J. Econ. Perspect. 2014, 28, 127–148. [Google Scholar] [CrossRef]
- Collins, D.; Morduch, J.; Rutherford, S.; Ruthven, O. Portfolios of the Poor: How the World’s Poor Live on $2 a Day; Princeton University Press: Princeton, NJ, USA, 2009. [Google Scholar]
- Ghosh, J. Microfinance and the challenge of financial inclusion for development. Cambridge J. Econ. 2013, 37, 1203–1219. [Google Scholar] [CrossRef]
- Barbier, E.B.; Hacker, S.D.; Kennedy, C.; Koch, E.W.; Stier, A.C.; Silliman, B.R. The value of estuarine and coastal ecosystem services. Ecol. Monogr. 2011, 81, 169–193. [Google Scholar] [CrossRef]
- Dasgupta, P. The Economics of Biodiversity: The Dasgupta Review; Hm Treasury: London, UK, 2021. [Google Scholar]
- Adger, W.N. Social capital, collective action, and adaptation to climate change. Econ. Geogr. 2003, 79, 387–404. [Google Scholar] [CrossRef]
- Woolcock, M.; Narayan, D. Social capital: Implications for development theory, research, and policy. World Bank Res. Obs. 2000, 15, 225–249. [Google Scholar] [CrossRef]
- Putnam, R.D. Bowling alone: America’s declining social capital. In Culture and Politics: A Reader; Springer: Berlin/Heidelberg, Germany, 2000; pp. 223–234. [Google Scholar]
- Alkire, S.; Roche, J.M.; Vaz, A. Changes over time in multidimensional poverty: Methodology and results for 34 countries. World Dev. 2017, 94, 232–249. [Google Scholar] [CrossRef]

| Livelihood Capital | Parameter | Indicators |
|---|---|---|
| Human Capital | Education & Skills | Adult literacy program activities; Number of vocational training institutions; Number of kindergartens, primary schools, junior high schools, senior high schools, universities/colleges; Distance to nearest early childhood center, kindergarten, primary, junior high, senior high school, and higher education institution; Availability of public transportation to educational facilities |
| Health | Number of health facilities; Distance to nearest health facility; Number of residents suffering from malnutrition; Incidence of extraordinary diseases; Availability of stunting-related service packages for pregnant women and children under two | |
| Social Capital | Social Networks | Existence of community institutions; Number of community institutions in the village; Community habit of cooperation for public purposes; Mutual help activities when residents face misfortunes |
| Trust & Reciprocity | Number of village meetings; cooperation habits; Existence of neighborhood security posts; Activation of community-based security systems; Construction/maintenance of security posts | |
| Institutional Support | Utilization of Village Funds; Existence of village government and village consultative bodies; Number of village meetings conducted; Existence of court offices, police stations, or police posts; Availability of social and health service packages | |
| Safety & Security | Incidents of crime; Existence of prostitution/localization areas; Existence of neighborhood security posts; Community-based security initiatives; Community participation in safety programs | |
| Natural Capital | Natural Resources | Existence of rivers, irrigation canals, reservoirs, lakes, or water catchments; Existence of excavation/mining sites; Incidents of environmental pollution; Incidents of landslides; Village location in relation to forest areas |
| Biodiversity | Existence of mangrove trees; Condition of mangrove ecosystems; Community reforestation/planting activities | |
| Environmental Sustainability | Waste recycling/management activities by communities; Natural disaster events; Community practice of burning fields/gardens; Existence of village-level waste banks; Participation in social forestry programs | |
| Physical Capital | Infrastructure | Road conditions and types of surface; Electricity access; Housing condition; Main sources of drinking and bathing/washing water; Type of sanitation facilities |
| Tools & Equipment | Road quality from/to agricultural production centers; Existence of farm tools and technology | |
| Transportation | Existence and operational hours of public transportation; Road accessibility; Transportation costs to subdistrict/district offices; Type of transportation infrastructure connecting agricultural production centers to main village roads | |
| Financial Capital | Income & Savings | Primary income sources of village/household population; Existence/accessibility of bank agents; Existence of village flagship products exported abroad; Number of Village-Owned Enterprises, industrial centers, small industry clusters, small industrial estates |
| Credit Access | Number of cooperatives (small industry, savings and loans, others); Availability of credit facilities (People’s Business Credit, Food and Energy Security Credit, Small Business Credit, Joint Business Groups); Existence of village-level microfinance institutions | |
| Financial Services | Existence of commercial banks (government-owned, private), and rural banks; Distance to nearest bank/agent; Number of migrant workers abroad; Existence of recruitment agencies for migrant workers; Utilization of village financial systems |
| Livelihood Capital | Indicators |
|---|---|
| Human Capital | Literacy rate, school attendance, number of high schools, distance to nearest university, incidence of extraordinary disease cases, etc. |
| Social Capital | Number of village-owned enterprises (BUMDes), group participation (proxied through the presence of community security measures), neighbourhood security activation, etc. |
| Natural Capital | Access to clean water (drinking and bathing), source of drinking water (categorized into five classes), presence of mangrove ecosystem, etc. |
| Physical Capital | Road accessibility, household toilet type, electricity usage (inverse of percentage of non-users), crime variation, distance to nearest hospital, etc. |
| Financial Capital | Household income level (via proxy), number of bank agents within a radius, access to a credit institution, etc. |
| Livelihood Capital | Capital Weight | Indicator | Indicator Weight | IW × CW |
|---|---|---|---|---|
| (CW) | (IW) | |||
| Human Capital | 0.371 | Number of senior high schools (SMA/MA/SMK) | 0.368 | 0.137 |
| Number of Epidemic Disease Cases | 0.14 | 0.052 | ||
| Distance to the nearest higher education institution | 0.153 | 0.057 | ||
| Number of Vocational training institutions | 0.339 | 0.126 | ||
| Social Capital | 0.239 | Activation of neighbourhood security system initiated by residents | 0.11 | 0.026 |
| Construction/maintenance of local security systems | 0.309 | 0.074 | ||
| Number of crime type variations | 0.581 | 0.139 | ||
| Natural Capital | 0.123 | Trend in the number of disaster events | 0.261 | 0.032 |
| Presence of mangrove vegetation | 0.411 | 0.051 | ||
| Number of surface water source types available | 0.328 | 0.04 | ||
| Physical Capital | 0.167 | Main drinking water source | 0.189 | 0.032 |
| Primary water source for bathing/washing | 0.257 | 0.043 | ||
| Predominant type of sanitation facility used | 0.276 | 0.046 | ||
| Road access from production areas to trade centers | 0.095 | 0.016 | ||
| Percentage of households not using electricity | 0.183 | 0.031 | ||
| Financial Capital | 0.1 | Availability of small business credit facilities (KUK) | 0.548 | 0.055 |
| Number of village-owned enterprises (BUMDes) | 0.241 | 0.024 | ||
| Distance to the nearest banking agent | 0.211 | 0.021 |
Disclaimer/Publisher’s Note: The statements, opinions and data contained in all publications are solely those of the individual author(s) and contributor(s) and not of MDPI and/or the editor(s). MDPI and/or the editor(s) disclaim responsibility for any injury to people or property resulting from any ideas, methods, instructions or products referred to in the content. |
© 2025 by the authors. Licensee MDPI, Basel, Switzerland. This article is an open access article distributed under the terms and conditions of the Creative Commons Attribution (CC BY) license (https://creativecommons.org/licenses/by/4.0/).
Share and Cite
Gai, A.M.; Ernan, R.; Barus, B.; Fauzi, A. Composite Index of Poverty Based on Sustainable Rural Livelihood Framework: A Case from Manggarai Barat, Indonesia. Geographies 2025, 5, 58. https://doi.org/10.3390/geographies5040058
Gai AM, Ernan R, Barus B, Fauzi A. Composite Index of Poverty Based on Sustainable Rural Livelihood Framework: A Case from Manggarai Barat, Indonesia. Geographies. 2025; 5(4):58. https://doi.org/10.3390/geographies5040058
Chicago/Turabian StyleGai, Ardiyanto Maksimilianus, Rustiadi Ernan, Baba Barus, and Akhmad Fauzi. 2025. "Composite Index of Poverty Based on Sustainable Rural Livelihood Framework: A Case from Manggarai Barat, Indonesia" Geographies 5, no. 4: 58. https://doi.org/10.3390/geographies5040058
APA StyleGai, A. M., Ernan, R., Barus, B., & Fauzi, A. (2025). Composite Index of Poverty Based on Sustainable Rural Livelihood Framework: A Case from Manggarai Barat, Indonesia. Geographies, 5(4), 58. https://doi.org/10.3390/geographies5040058


