Abstract
Local food movements are growing in popularity across the United States, with many communities focused on gaining control over their food systems. This is especially true in northwest Washington. Over the last 15 years, farmers, bakers, and millers in northwest Washington have increasingly invested their resources in growing and using local grains. Northwest Washington is not commonly considered a grain-growing region despite historically high yields of cereal grains. This study examines how grain agriculture has changed in northwest Washington since the late 19th century and uses a mix of quantitative spatial analyses, historical agricultural census analyses, and qualitative interviews to explore potential cultural and biophysical causes behind these changes. Our findings suggest that historical trends in grain agriculture were not driven primarily by climatic changes, but our spatially explicit models of late 21st-century climate suitability suggest the length and timing of optimal growing season conditions will change across our study area. This change coincides with the rising community interest in local grains. However, producers are concerned that future climate change may make it more challenging to grow grains in this region. This mixed-methods approach is of the utmost importance in understanding the entire story of community-based food systems in this area and in informing future decision-making of communities in northwest Washington.
1. Introduction
Across the United States, many communities are increasingly interested in local food movements, which give individuals more control over and awareness of where their food comes from [1,2,3]. Many consumers purchase all their food from large grocery stores and, therefore, may have no connection to the farmers who produced that food or even knowledge of where the food came from [4]. For many shoppers, the goal behind buying locally is to build relationships and a sense of connection between consumers and local farmers, as well as to divest from large industrial agricultural corporations [5]. Many consumers also choose to buy local food for environmental reasons, as fewer resources are used for transport if bought locally [5].
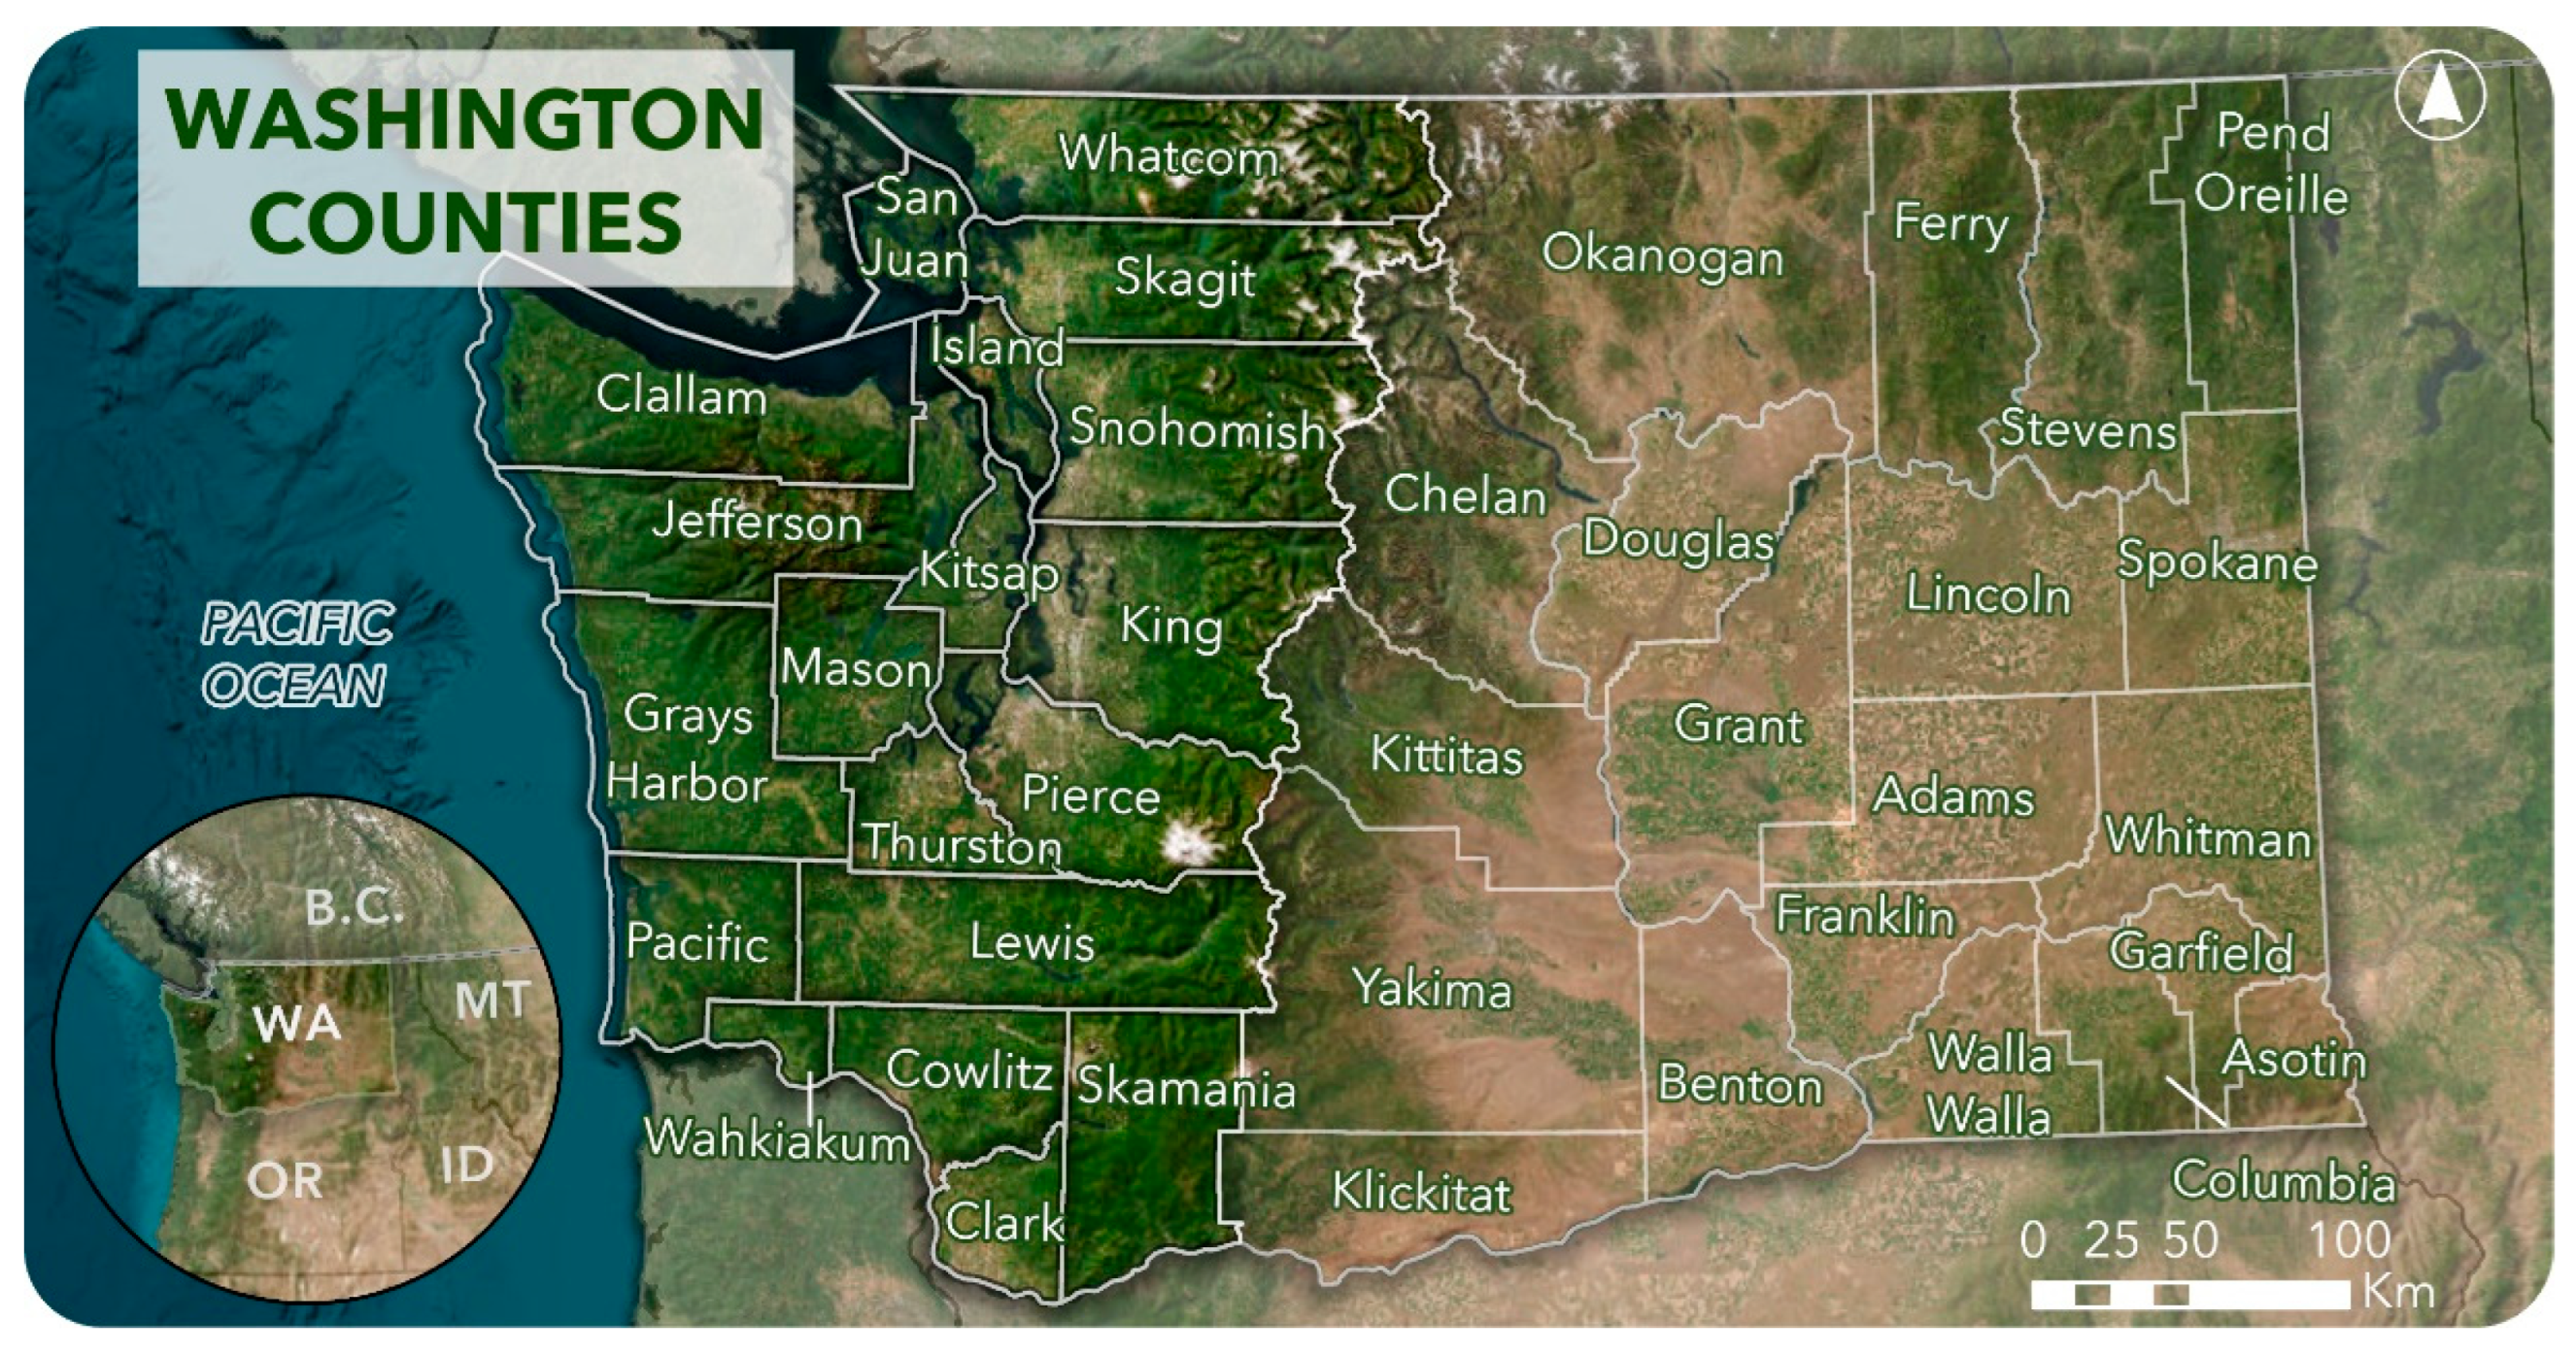
It is difficult to define what local is, as it is dependent on the opinion of the consumer. Generally, the definition of “local” in food systems is driven by geographical proximity and a combination of having a relationship with both the farmer and the freshness or quality of the food [6]. In Washington State, actors in the local food movement have emphasized reconnecting consumers to food producers [4]. This is especially true in western Washington (Figure 1), which is home to 2250 of the farmers markets counted in the 2022 United States Department of Agriculture (USDA) National Agricultural Statistics Service (NASS) Agricultural Census. This is about 63% of the total farmers’ markets in Washington state, despite this region containing only 5.14% of the state’s total cropland [7]. The relative abundance of farmers markets indicates a strong regional interest in having access to local food.
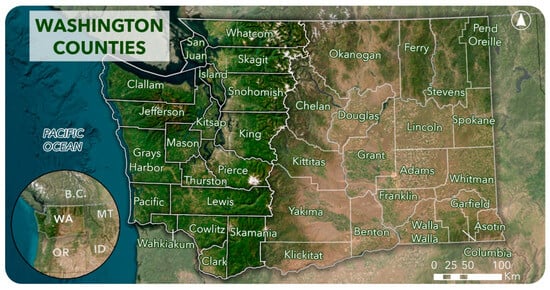
Figure 1.
Map of counties in Washington State.
Most crops grown and sold at farmers’ markets in western Washington are berries, vegetables, flowers, and dairy products [8]. Conspicuously missing from this mix of crops are key staples like cereal grains [8]. Grains, particularly wheat, are one of the top crops in Washington, but today, the large majority of this crop type is grown in the more arid part of Washington east of the Cascade Mountain Range [9]. Grains were grown on both sides of Washington State starting shortly after European arrival, with the San Juan Islands (in San Juan County) even setting record-breaking yields for wheat harvest [10]. However, due to a combination of cultural, political, and technological changes in the early 20th century, many farmers in western Washington chose to grow more high-value crops like what is sold and grown today: vegetables, fruits, and animal products [11]. Many of these changes were spurred by shifting priorities in the United States government towards efficiency and productivity, as well as industrial and technological advances [12,13]. This change in agricultural priorities led to a loss of knowledge about the potential for grain agriculture in western Washington, as described by Jones [10]:
Today, people often ask me if it is possible to grow wheat and oats on the San Juan Islands, in Skagit Valley, or basically in any place out of place. The farm memory is gone. It has vanished along with the infrastructure that once supported it … Little remains to remind us that thousands of communities once had vibrant local grain systems in place for food, feed, and malt.
Today, it is a common assumption that western Washington is not climatically suitable for growing grains. Eastern Washington has an extremely suitable climate for growing grains, with hot, dry summers needed for grain maturation and the cold winters required for germination and flowering processes [14]. Despite this assumption, some farmers successfully grow cereal grains in western Washington [9]. Typically, these crops are grown in rotation with the main commodity crops to rebuild soil health [10]. However, in the past 15 to 20 years, more farmers have started growing wheat and other small grains for human food rather than for cover crops or animal feed in western Washington [5,15]. This coincides with the rise of small grain mills and labs in northwest Washington, like Cairnspring Mills and the Washington State University Bread Lab. These organizations both focus on revitalizing the use of local, flavorful, and climate-resilient cereal grains [16,17].
Farmers’ decisions about which crops to grow are based on a complex and interactive set of cultural and physical factors, including economic incentives, climatic and edaphic limitations of crops, and social norms [12,13,18,19]. Both the mid-twentieth century decrease in grain agriculture and the recent resurgence of interest in grain crops in western Washington have likely occurred in response to a mix of changing cultural and/or climatic conditions. The resurgence of grain agriculture in western Washington shows us that the assumption that the climate is completely unsuitable for grain agriculture in this region is not correct [5,10,15]. However, it is unknown how much of a role climatic change played in the mid-20th century decline in grain agriculture. Additionally, there is concern about the potential for future climate changes hindering grain agriculture, but there has been no quantitative analysis of the projected effects of climate change specifically on grain agriculture in this region [5]. Previous studies have typically focused on community interest in the local grain agriculture or the climate affecting grain agriculture in northwest Washington but do not look at these factors together [5,10,15,18,19,20]. Our ability to understand the relationship between trends in climate and trends in grain agriculture is hampered because there is no readily available source of detailed geospatial data that can be used to visualize and spatially analyze the changing extent and locations of grain agriculture over the 20th and early 21st centuries.
To address this knowledge gap, this study combines historical records of grain production with qualitative and quantitative analyses to examine both the biophysical suitability of local lands for wheat agriculture and the motivations of grain farmers and local bakers. We focus primarily on wheat because it is one of the most commonly grown cereal grains in northwest Washington, as well as a grain of particular interest for research and community food needs [10]. We used a mix of interviews, historical records, and spatial analyses of climate, soil, and land use zoning records to explore the socio-ecological factors influencing farmers’ decisions regarding grain agriculture in San Juan, Skagit, and Whatcom counties.
2. Materials and Methods
2.1. Study Area
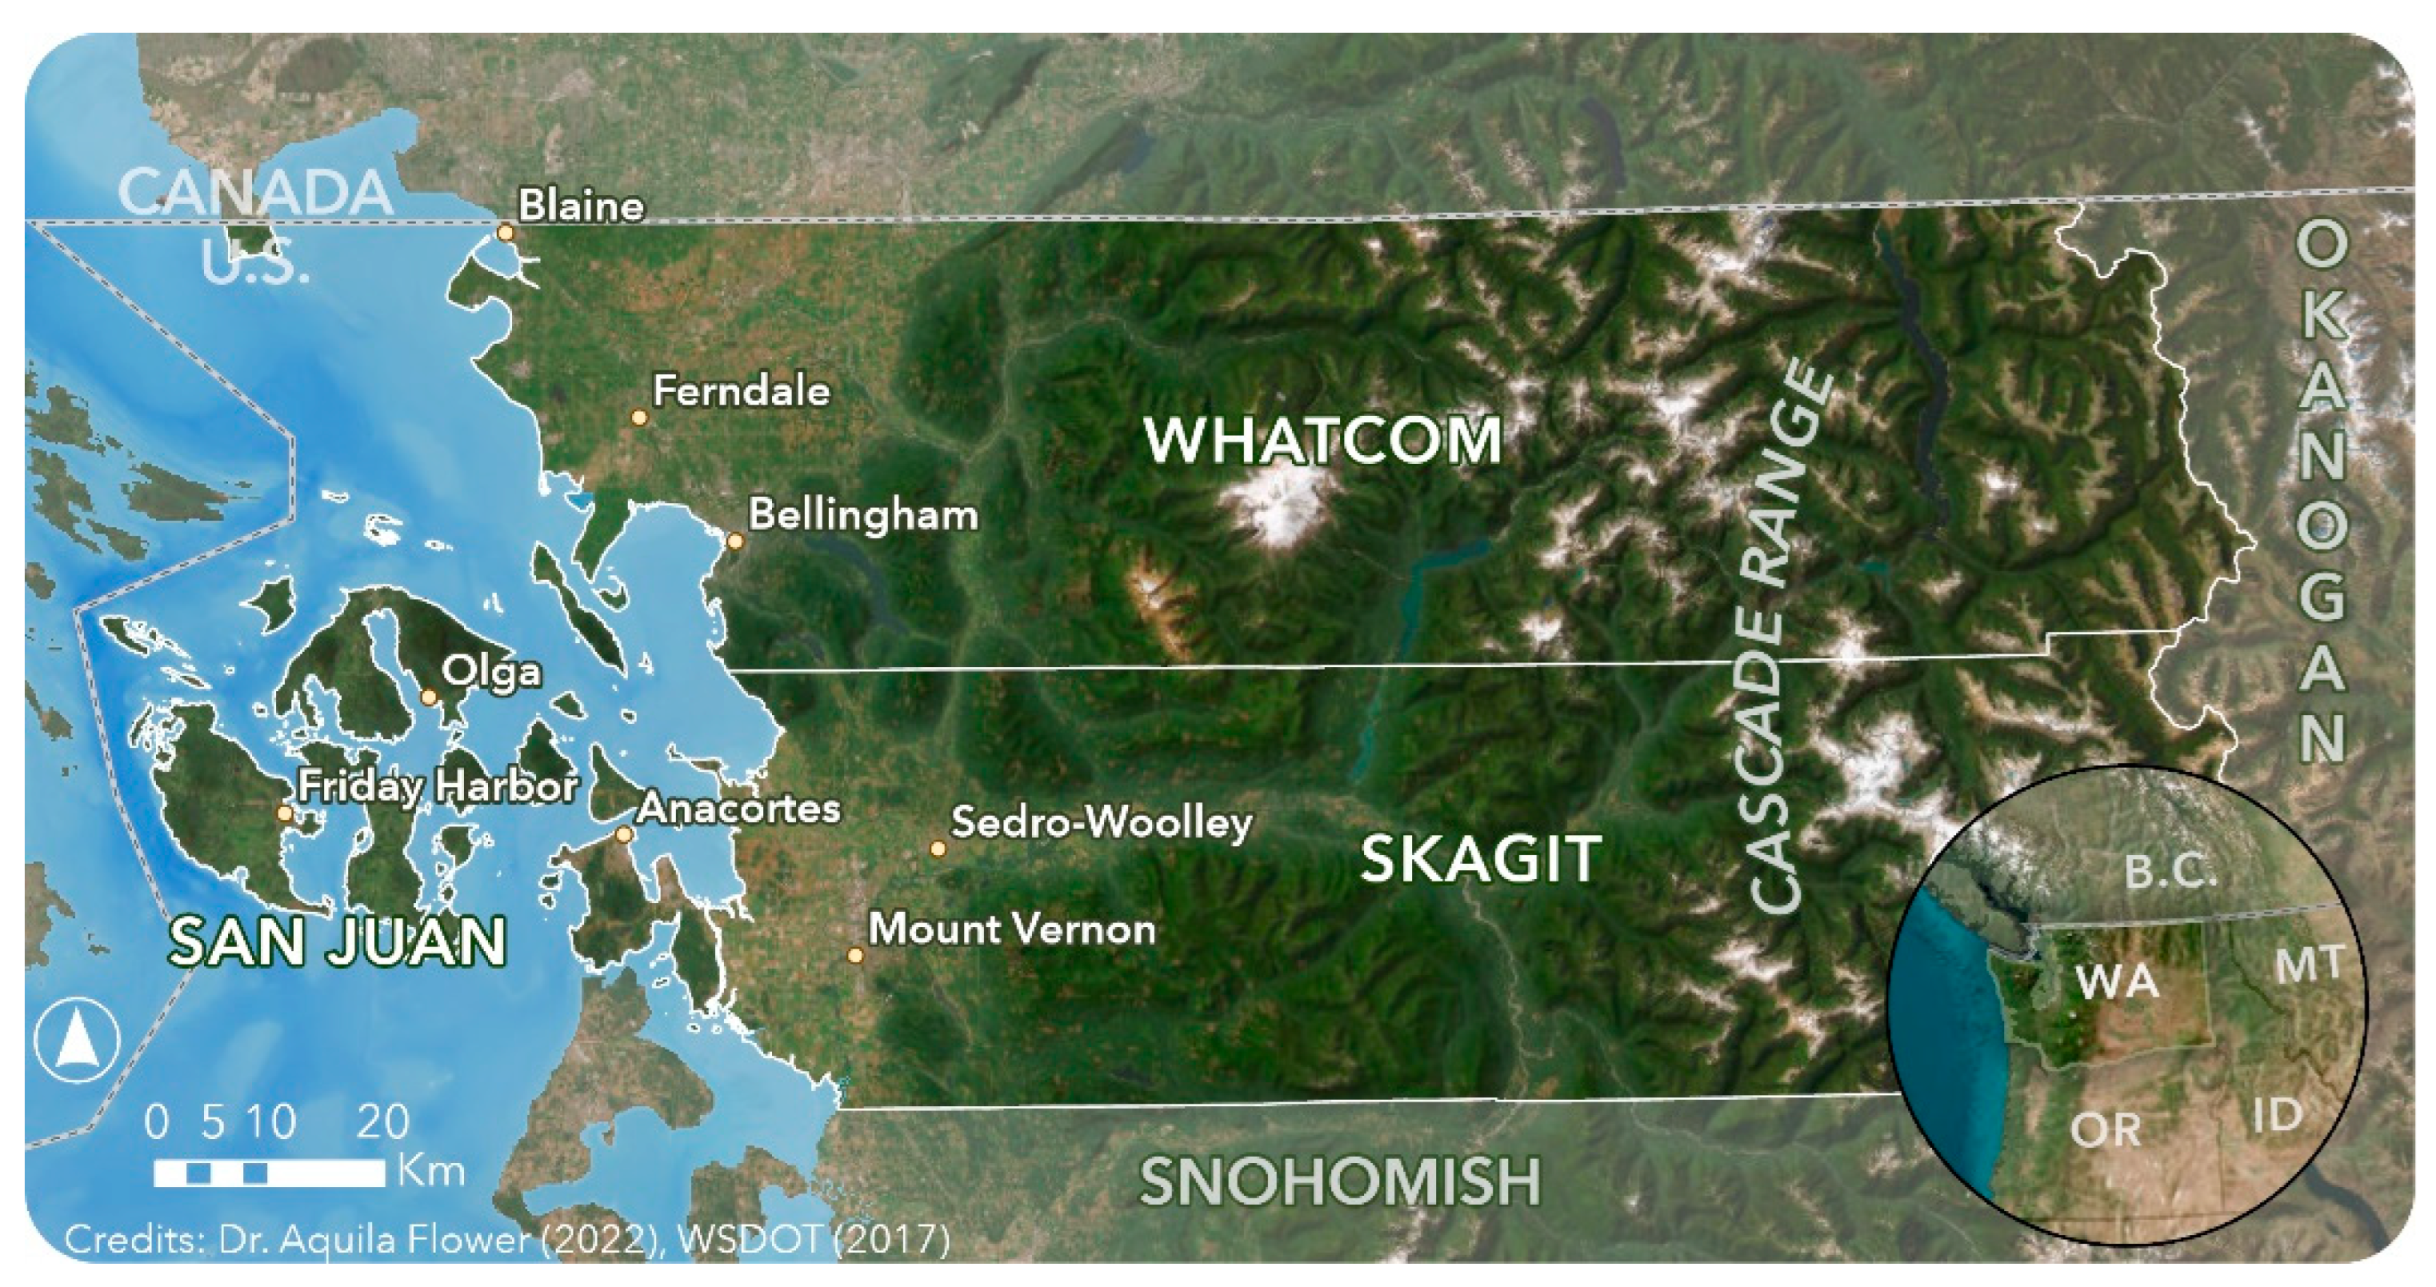
Our study focuses on San Juan, Skagit, and Whatcom Counties, located in the northwestern part of Washington, on the wetter, windward side of the Cascade Mountains (Figure 2). The Cascade Mountain Range creates a natural climatic divide between the western and eastern sides of Washington State through its influence on precipitation and wind direction. Much of western Washington is within the Köppen climate types Csb and Cfb, which are both temperate coastal Mediterranean climate types characterized by dry summer months [21,22]. Temperatures are generally mild year-round due to the proximity of the Pacific Ocean [23]. Average minimum winter temperatures typically range from 5 °C near the Pacific Ocean to −13 °C near the Cascade Mountain Range [24,25]. Average summer maximum temperatures typically range in the 20’s (°C) but can reach temperatures up to 33 °C [24,25].

Figure 2.
Northwest Washington study area map.
2.2. Historical Agricultural Census Records
To quantify and visualize long-term trends in grain agriculture, we used agricultural census data from NASS [26,27,28,29,30,31,32,33,34,35,36,37,38,39,40]. While they include some sampling errors, historical agricultural censuses and bulletins, including the most recent agricultural census in 2022, are an excellent way to compare agricultural output across multiple years [41]. We collected data from each census and bulletin year for Washington. To ensure consistency in analysis and data collection, specific cereal grain crops were included from each year (Table 1).

Table 1.
Crops included in analysis.
2.3. Climate Data
To quantify the envelope or range of climatic conditions in which wheat has been grown both historically and in modern times, high-resolution climate data were needed. We used the program ClimateNA (Climate North America) to download historical climatic data. ClimateNA statistically downscales PRISM (Parameter elevation Regression on Independent Slopes Model) data grids to a scale-free version that covers the entirety of North America [24,25]. To capture changes across the 20th century, we downloaded 30-year climate normals from 1901–1930, 1931–1960, 1961–1990, and 1991–2020. 30-year climate normals are used because they minimize the effects of short-term weather fluctuations. For future analysis, we downloaded a 30-year CMIP6 SSP2-4.5 8-GCM ensemble projection from 2040–2070. We selected the SSP2-4.5 scenario because it is a middle-of-the-road scenario.
After inputting a 30 × 30 m resolution Digital Elevation Model (DEM) from the United States Geological Survey (USGS) [42,43,44,45], the program used these elevation values to statistically downscale interpolated monthly minimum and maximum temperature variable surfaces. The output was ASCII files, including 60 monthly variables (Table 2). We re-projected the resulting datasets to NAD 1983 UTM Zone 10N and clipped them to our study region.
Table 2.
ClimateNA variables were used for our climate analysis.
We identified the thresholds defining “suitable” and “optimal” conditions, or envelopes, (Table 2) through a literature review of previously published experimental and correlative analyses of the relationship between wheat growth rate of the entire plant measured by °C d−1 and weather or climatic conditions. From this literature, we determined suitable conditions for wheat to be between 0 °C and 37 °C [46,47,48,49,50]. Optimum conditions for growth are between 17 °C and 23 °C [47]. Using those thresholds, we analyzed the dataset to identify areas that met zero, one, or both condition sets based on their temperature characteristics.
To create a final optimum score, we assigned a value of 1 to places where both the suitable and optimum envelopes were met each month, then added the values together. The final envelope indicates the number of months that are within the identified threshold conditions. Finally, to understand how areas of climatic suitability have changed or are projected to change compared to the present, we subtracted the results for each 30-year normal period from the 1991–2020 normal. The outputs show that the climatic suitability changed from one normal period to the most modern period. The goal of this change analysis is to understand how the length of the growing season has changed over time and how it may change in the future.
2.4. Land Zoning and Soil Data
Agricultural land zoning data is necessary to understand where wheat can be grown, as agriculture fields will not occur in areas that are not properly zoned. We used an agricultural zoning dataset from the Salish Sea Atlas [51] to understand which areas have been zoned properly for wheat growth (Figure 3). The zoning data for Northwest Washington was collected from the Washington State Department of Commerce’s Puget Sound Mapping Project (2018).
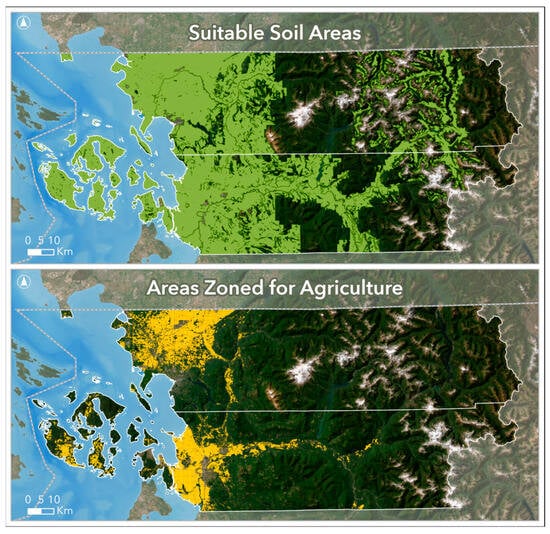
Figure 3.
Map of suitable soil areas and areas zoned for agriculture in northwest Washington.
We also collected soil data to continue refining the biophysical suitability envelopes for wheat. Using a soil shapefile from The Soil Survey Geographic Database (SSURGO), we identified soils that were loam or clay-based and those classified as possible agricultural land (Figure 3) [52,53,54]. This database is maintained by the Natural Resources Conservation Service. We overlaid agriculture-zoned areas in the study area with areas that satisfy the optimal conditions for temperature. Following that, we intersected the output with soil types that are loam or clay-based to identify areas of highest suitability.
2.5. Interviews
Using a mixture of intentional and snowball sampling, we interviewed farmers who grow any type of cereal grains and bakers or millers who use local grains in Northwest Washington. Face-to-face or online interviews occurred after the selection of interviewees. Interviewees were identified either from internet research or from snowball sampling, where an interviewee is recommended to me by a contact (Appendix A) [55]. We spoke to seven farmers, bakers, and millers, with one interviewee being both a farmer and a baker. These interviews were semi-structured, and interviewees were informed that no identifiable information would be shared about them to increase trust and transparency [56,57].
The purpose of the interviews was to explore the interviewees’ motivations and processes, allowing us to have a more holistic view of the cereal grain community in Northwest Washington. Interviews were transcribed using Rev [58]. From these transcriptions, we selected quotes that represent common themes from the interviewees. Following, we analyzed these themes to understand the main drivers and challenges that the farmers, bakers, and millers face [55,56,59,60,61].
3. Results
3.1. Declining Cereal Grain Farms and Acreage
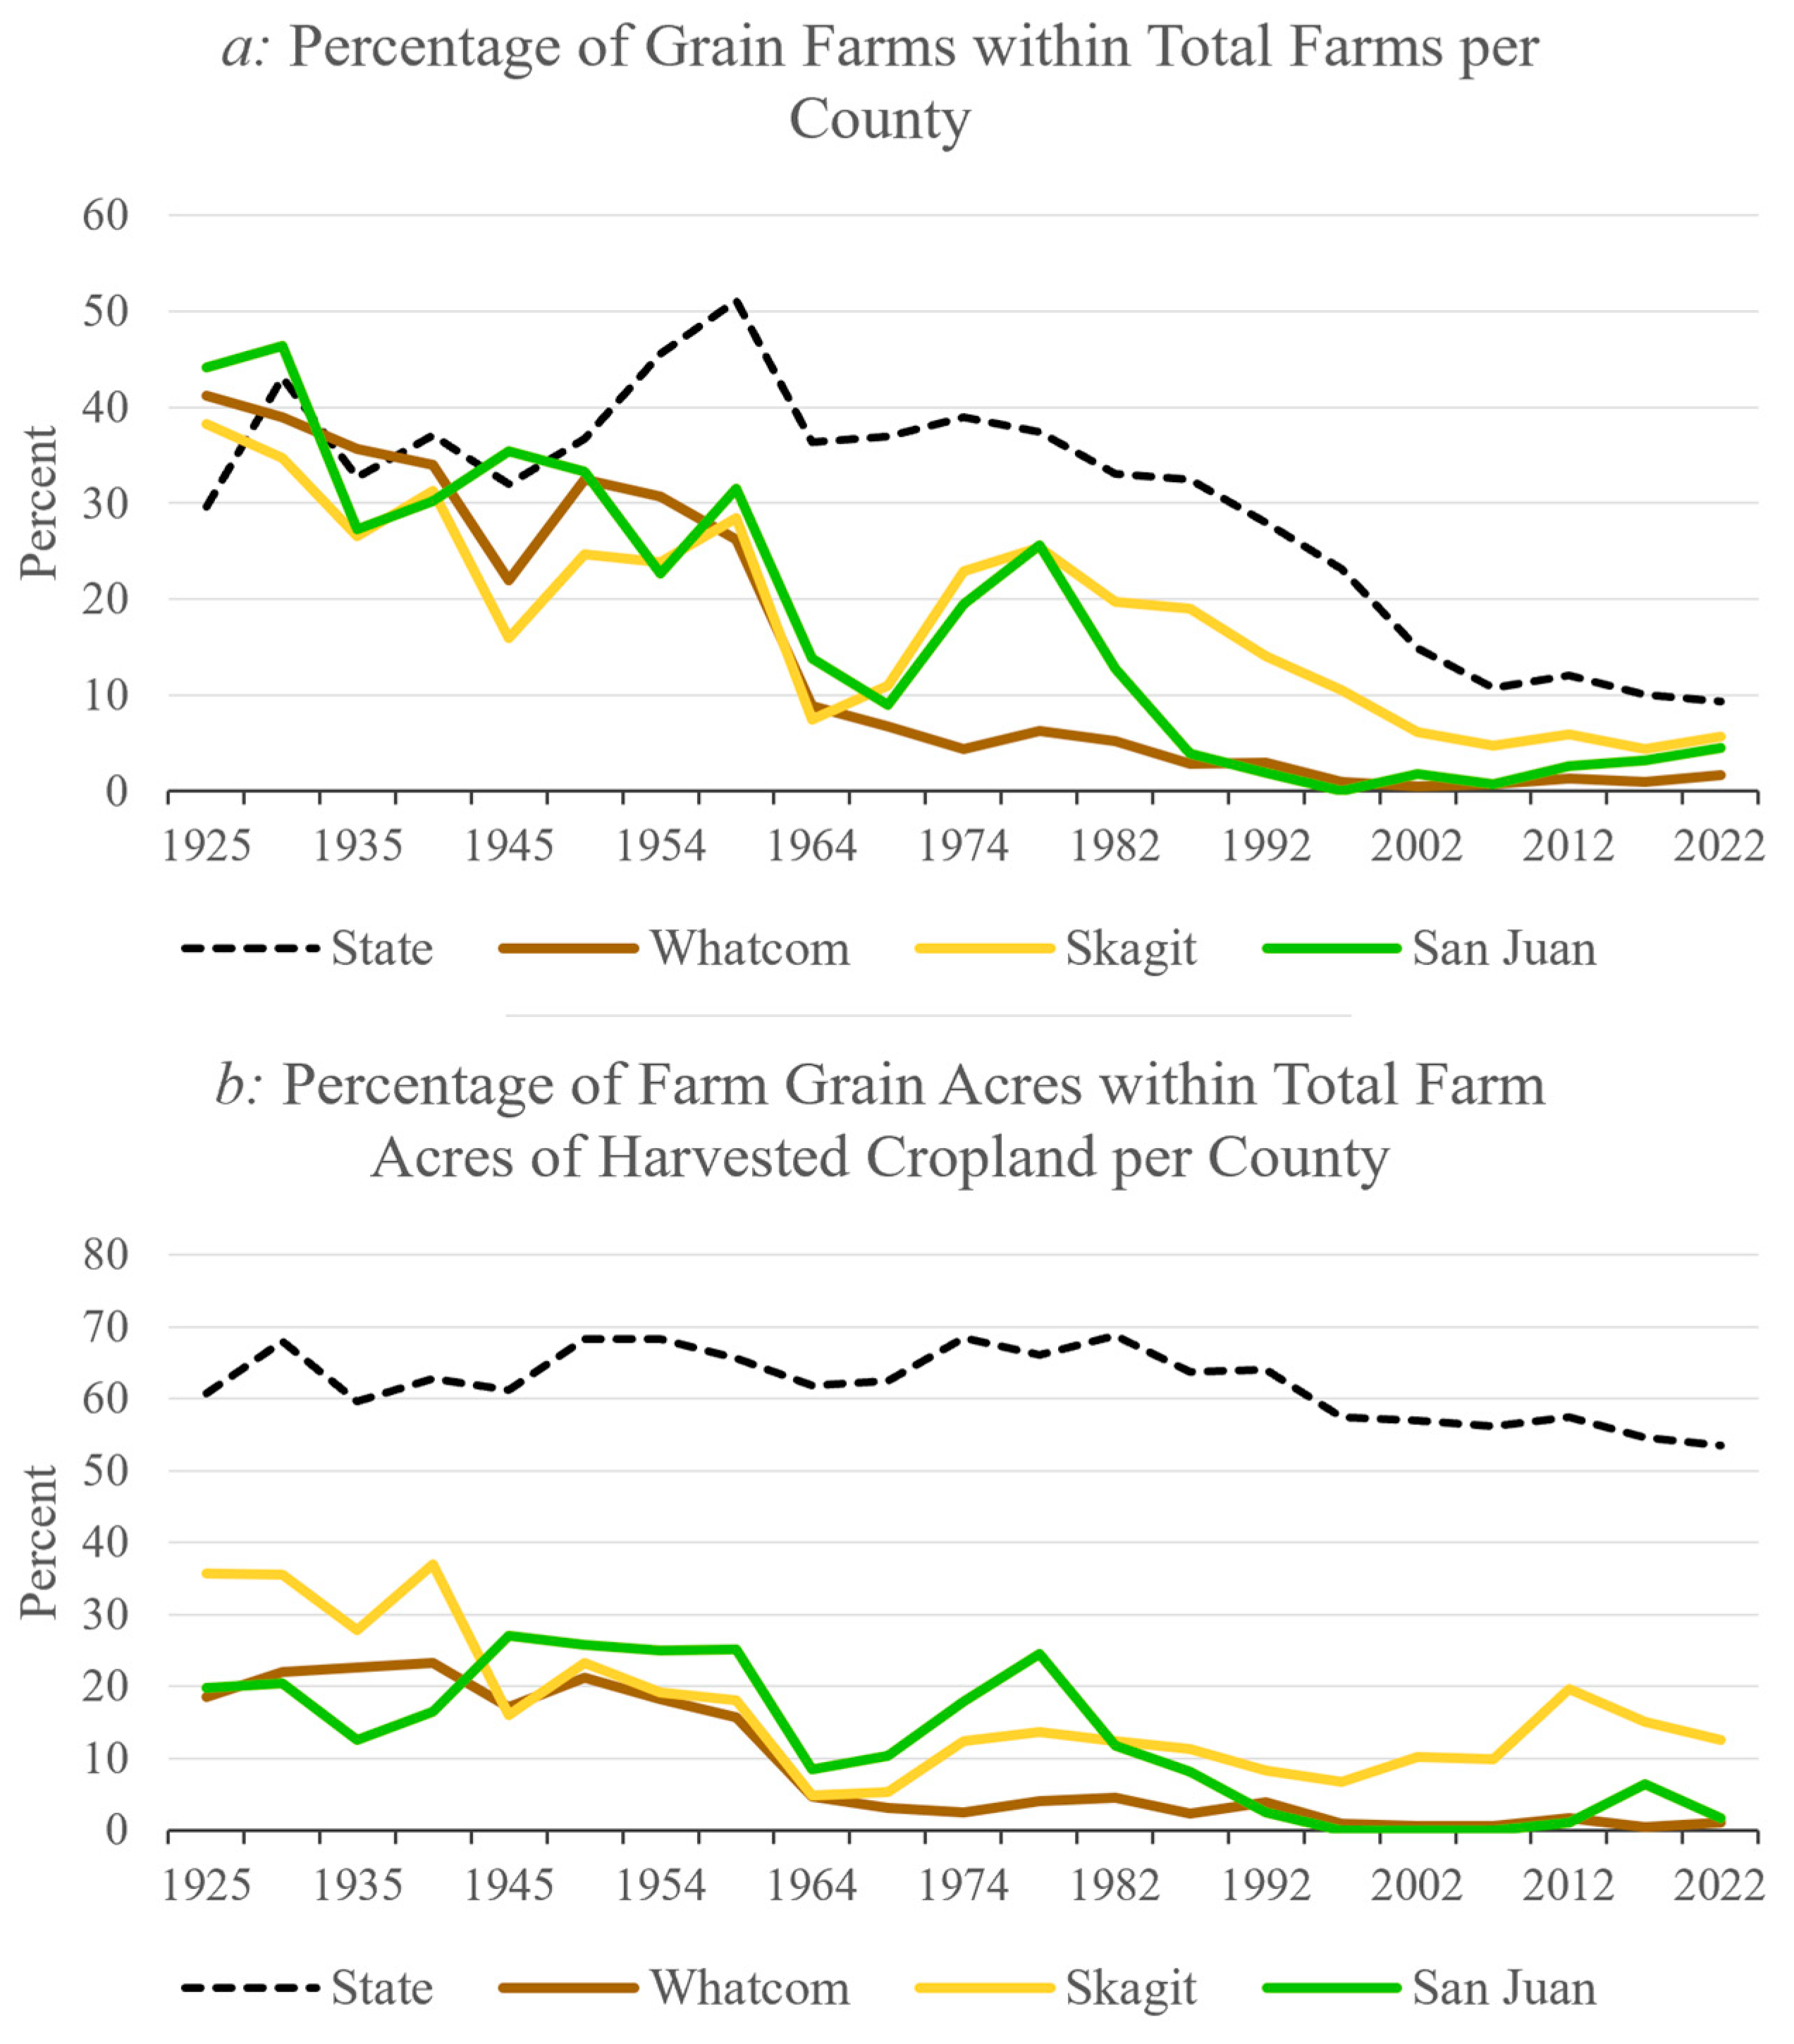
The proportion of farms that grow grains in each county has declined since 1925 (Figure 4a). In Skagit County, 38.21% of farms grew cereal grains in 1925. This number declined to 5.67% in 2022. Whatcom County fared similarly, with 41.27% of farms growing cereal grains in 1925 and only 1.64% of all farms in 2022. San Juan County follows the same overall trend but has experienced more fluctuation. San Juan County had the highest percentage of farms growing grain in 1925 at 44.17%, but this number dropped to 0 in 1997. In 2022, this proportion rose to 4.55%. Interestingly, all three counties experienced a rise in the number of farms growing cereal grains from 2017 to 2022. The entire state also experienced a decline (29.65% in 1925 to 9.29% in 2022), but there is no evidence of the increase at the state level, which was shown in Northwest Washington from 2017 to 2022.
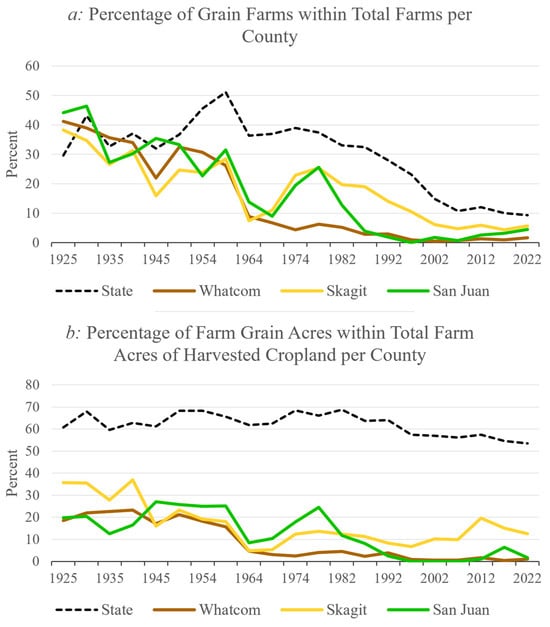
Figure 4.
Percentage of grain farms within total farms per county (a) and percentage of farm grain acres within total farm acres of harvested cropland per county (b). The chart begins in 1925 due to data availability.
For the farms growing grains, there has also been a decline in how many acres are sown with cereal grains (Figure 4b). However, this trend does not decrease as sharply as the farm proportion (Figure 4a). All three counties were above the state average in 1925. In San Juan County, the percentage of grain acreage fell from 19.85% in 1925 to 1.7% in 2022. Whatcom County followed suit, dropping from 18.56% in 1925 to 1.12% in 2022. Skagit County continues to plant more acreage of cereal grains but still follows the declining trend (35.68% in 1925 to 12.54% in 2022). Washington State, on average, followed this decrease as well, falling from 60.71% in 1925 to 53.53% in 2022.
3.2. Changes in Cereal Grain Output
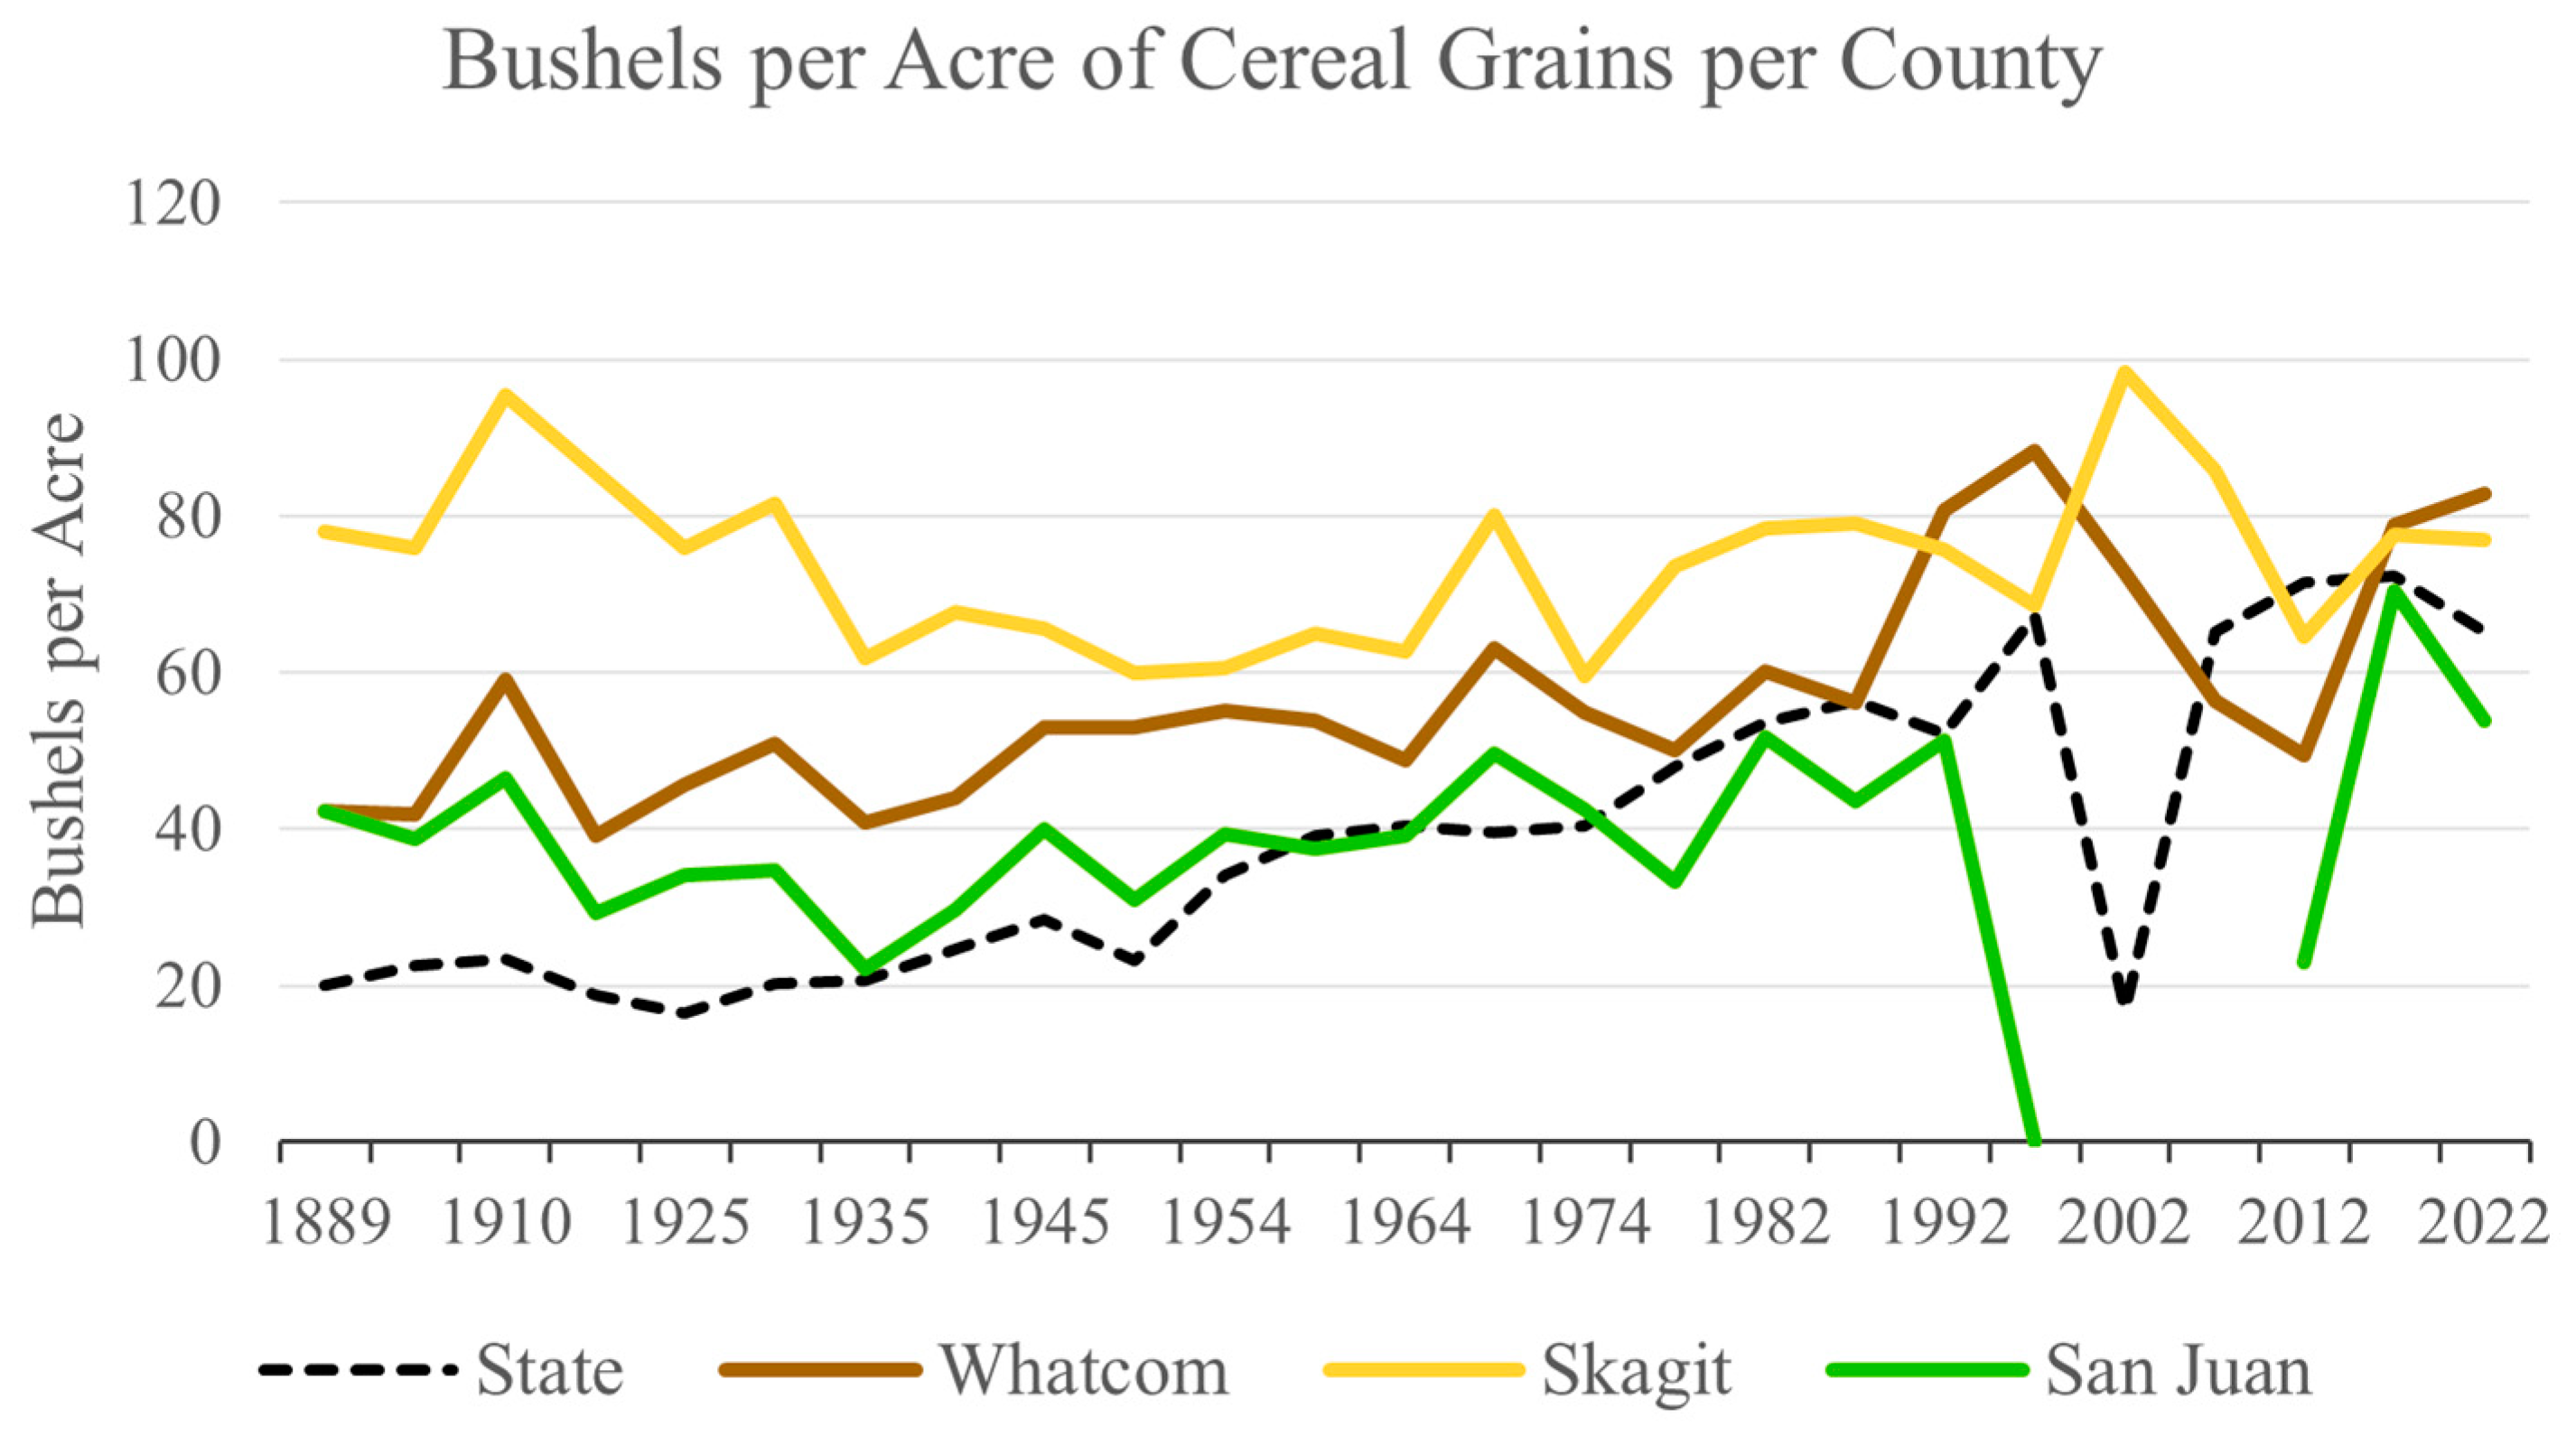
In addition to the changing proportion of cereal grain-growing farms and grain acreage, there has been a fluctuation in the output of bushels (35.2 L) per acre since the late 19th century (Figure 5). While there has been a decline in acreage and number of farms, there has been an increase in bushels per acre in San Juan (+11.47 bushels/acre) and Whatcom (+40.56 bushels/acre) Counties, as well as Washington State overall (+45.11 bushels/acre). Skagit County’s overall trend is a slight decrease (−1.09 bushels/acre). All three counties and the state experienced fluctuating levels of output across the entire period, with San Juan County’s production dropping off completely between 1997 and 2012.
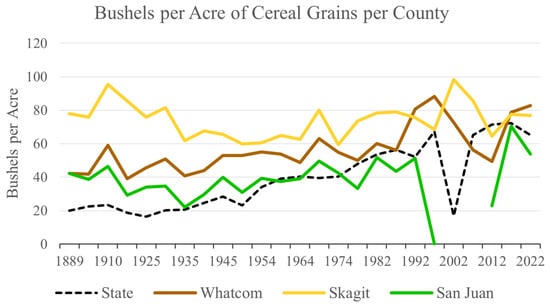
Figure 5.
Bushels per acre of cereal grains per county.
3.3. Historical Shifts in Temperature Suitability for Wheat
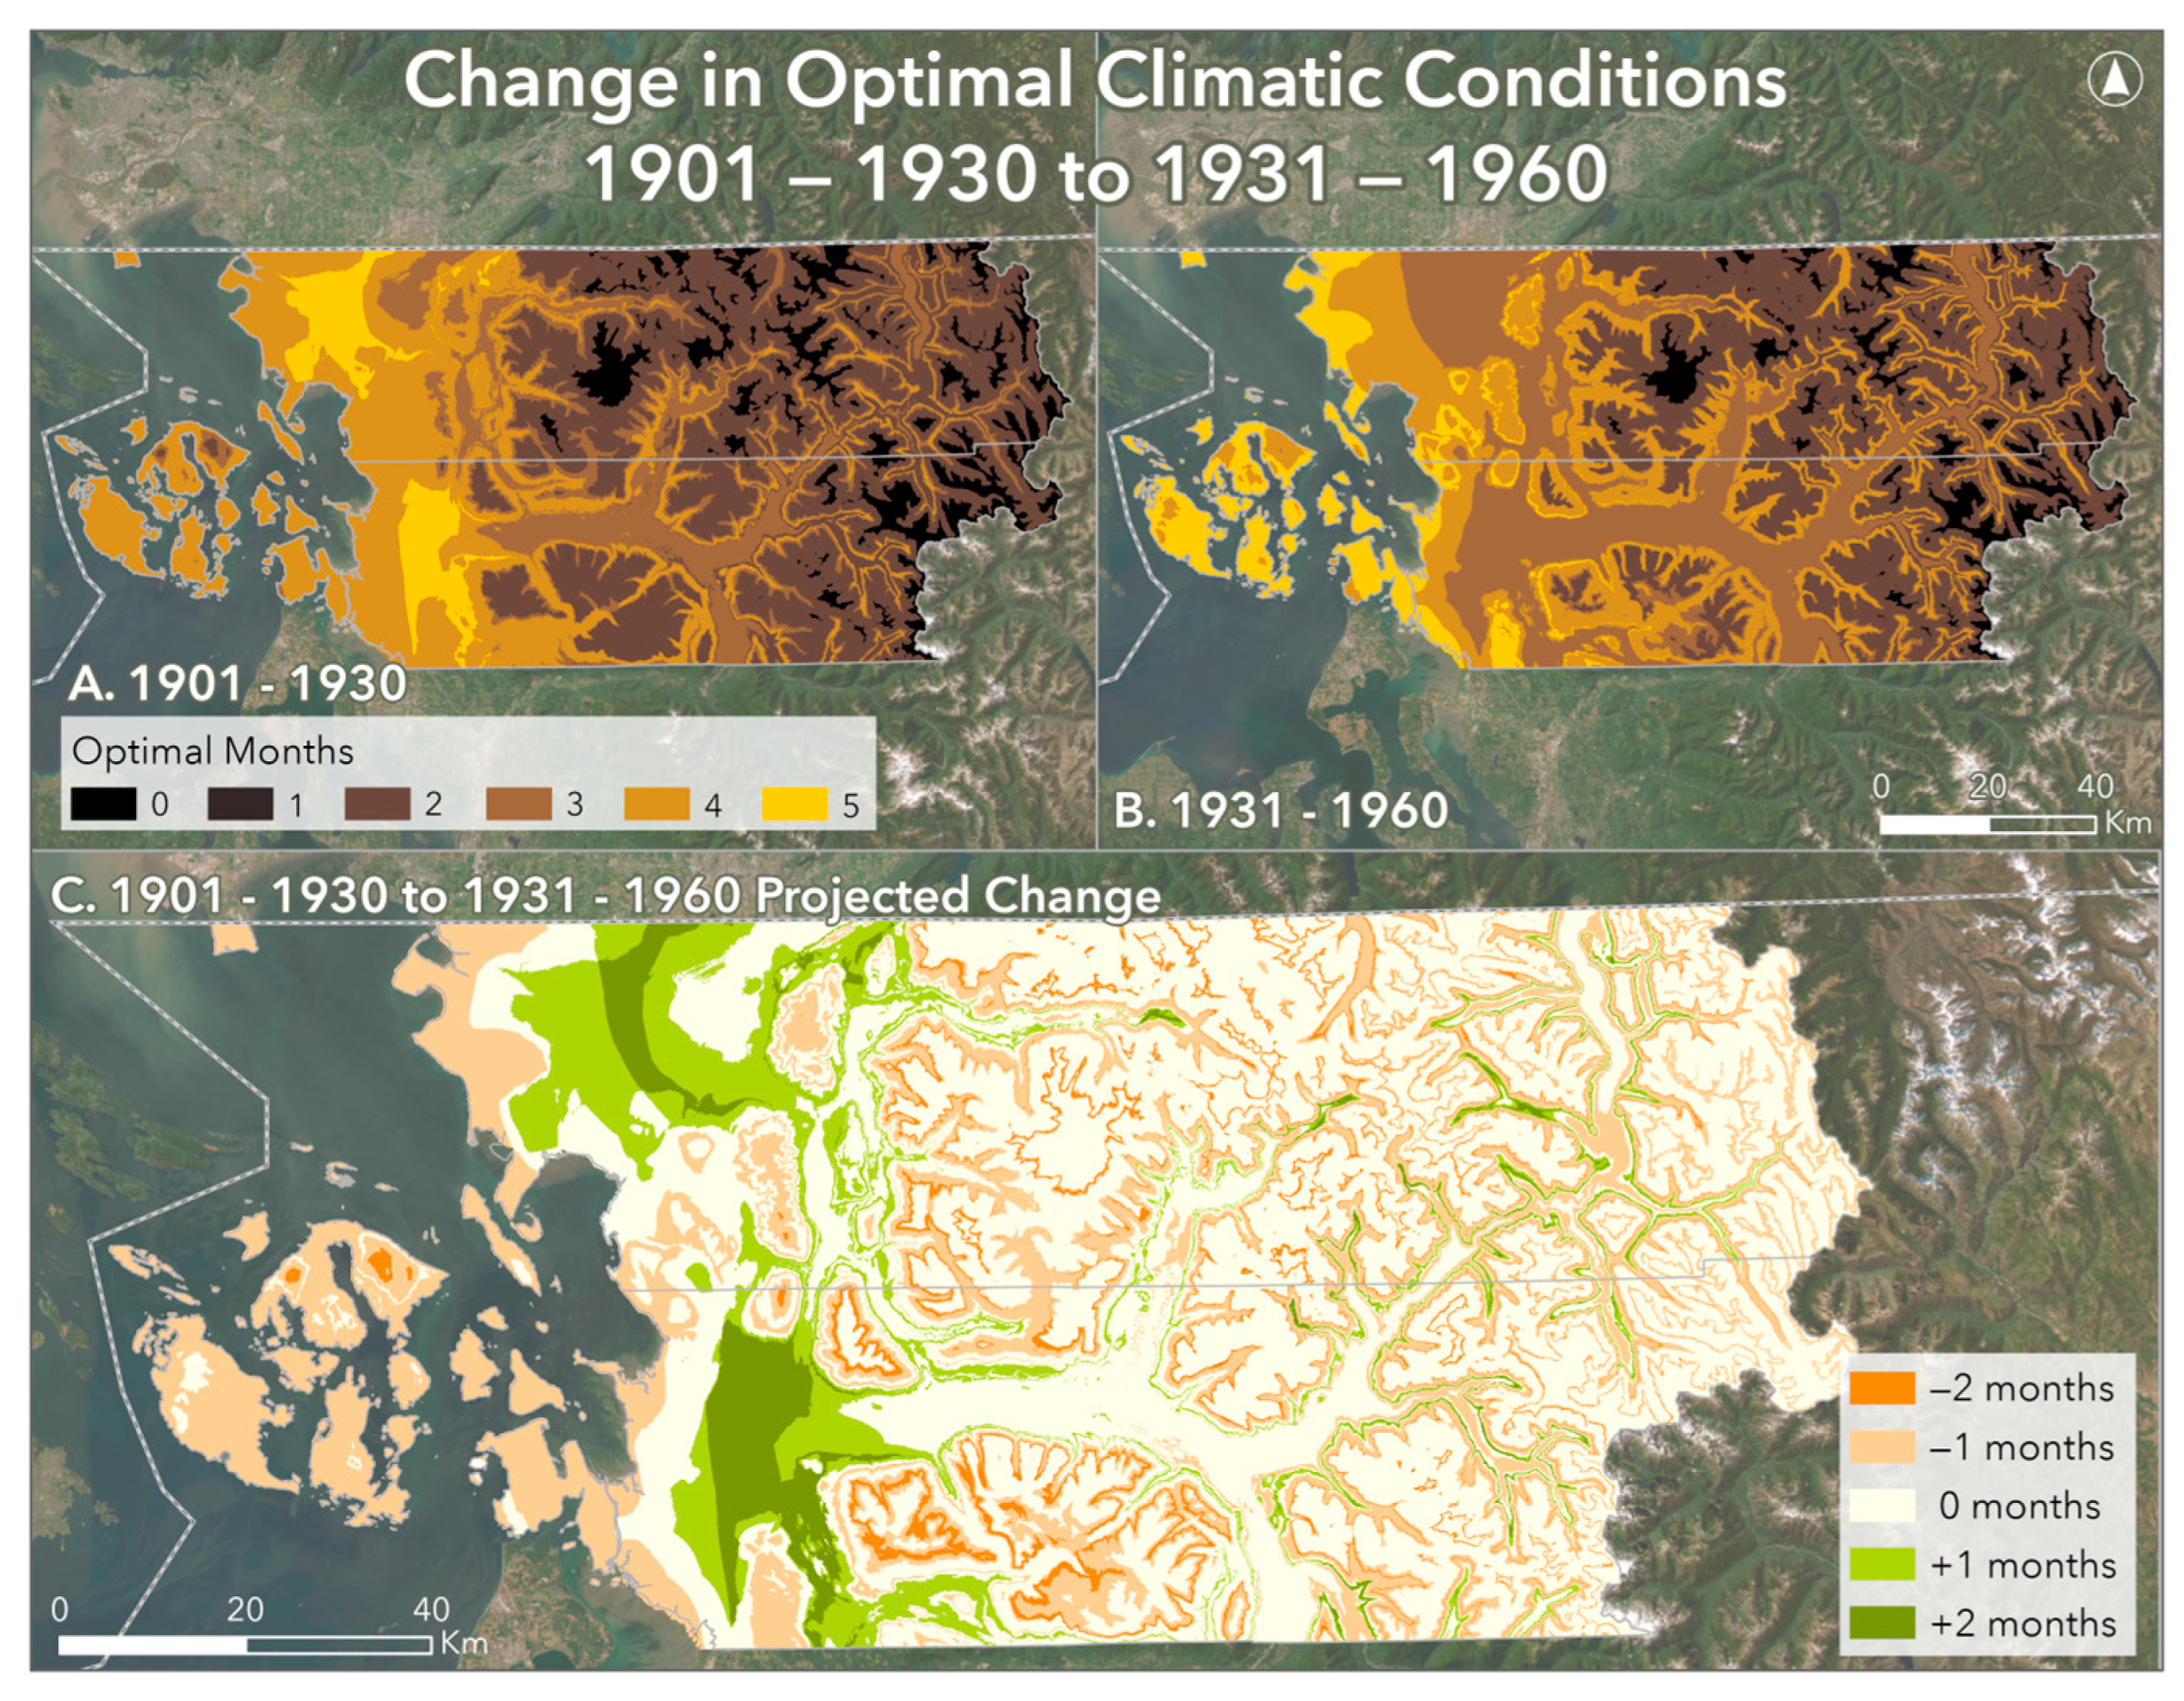
Areas within the optimal climatic thresholds for growing wheat have shifted in Northwest Washington since 1900. Each 30-year climate normal period had at least some areas with five months of optimal temperatures for wheat, but the locations with the longest suitable growing seasons shifted over time. From 1901–1930 to 1931–1960, San Juan County lost one to two months of optimal temperatures but gained up to 2 months of optimal temperatures in the lowlands between the coast and the Cascade Mountain Range (Figure 6). The growing season length required for a successful harvest depends on the wheat variety involved, but we can conservatively treat three months of optimal conditions as the minimum growing season required to consider an area climatically suitable for wheat agriculture.
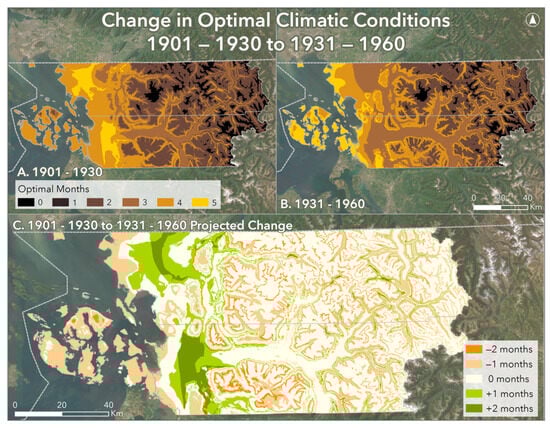
Figure 6.
Optimal climate envelopes and change for 1901–1930 and 1931–1960.
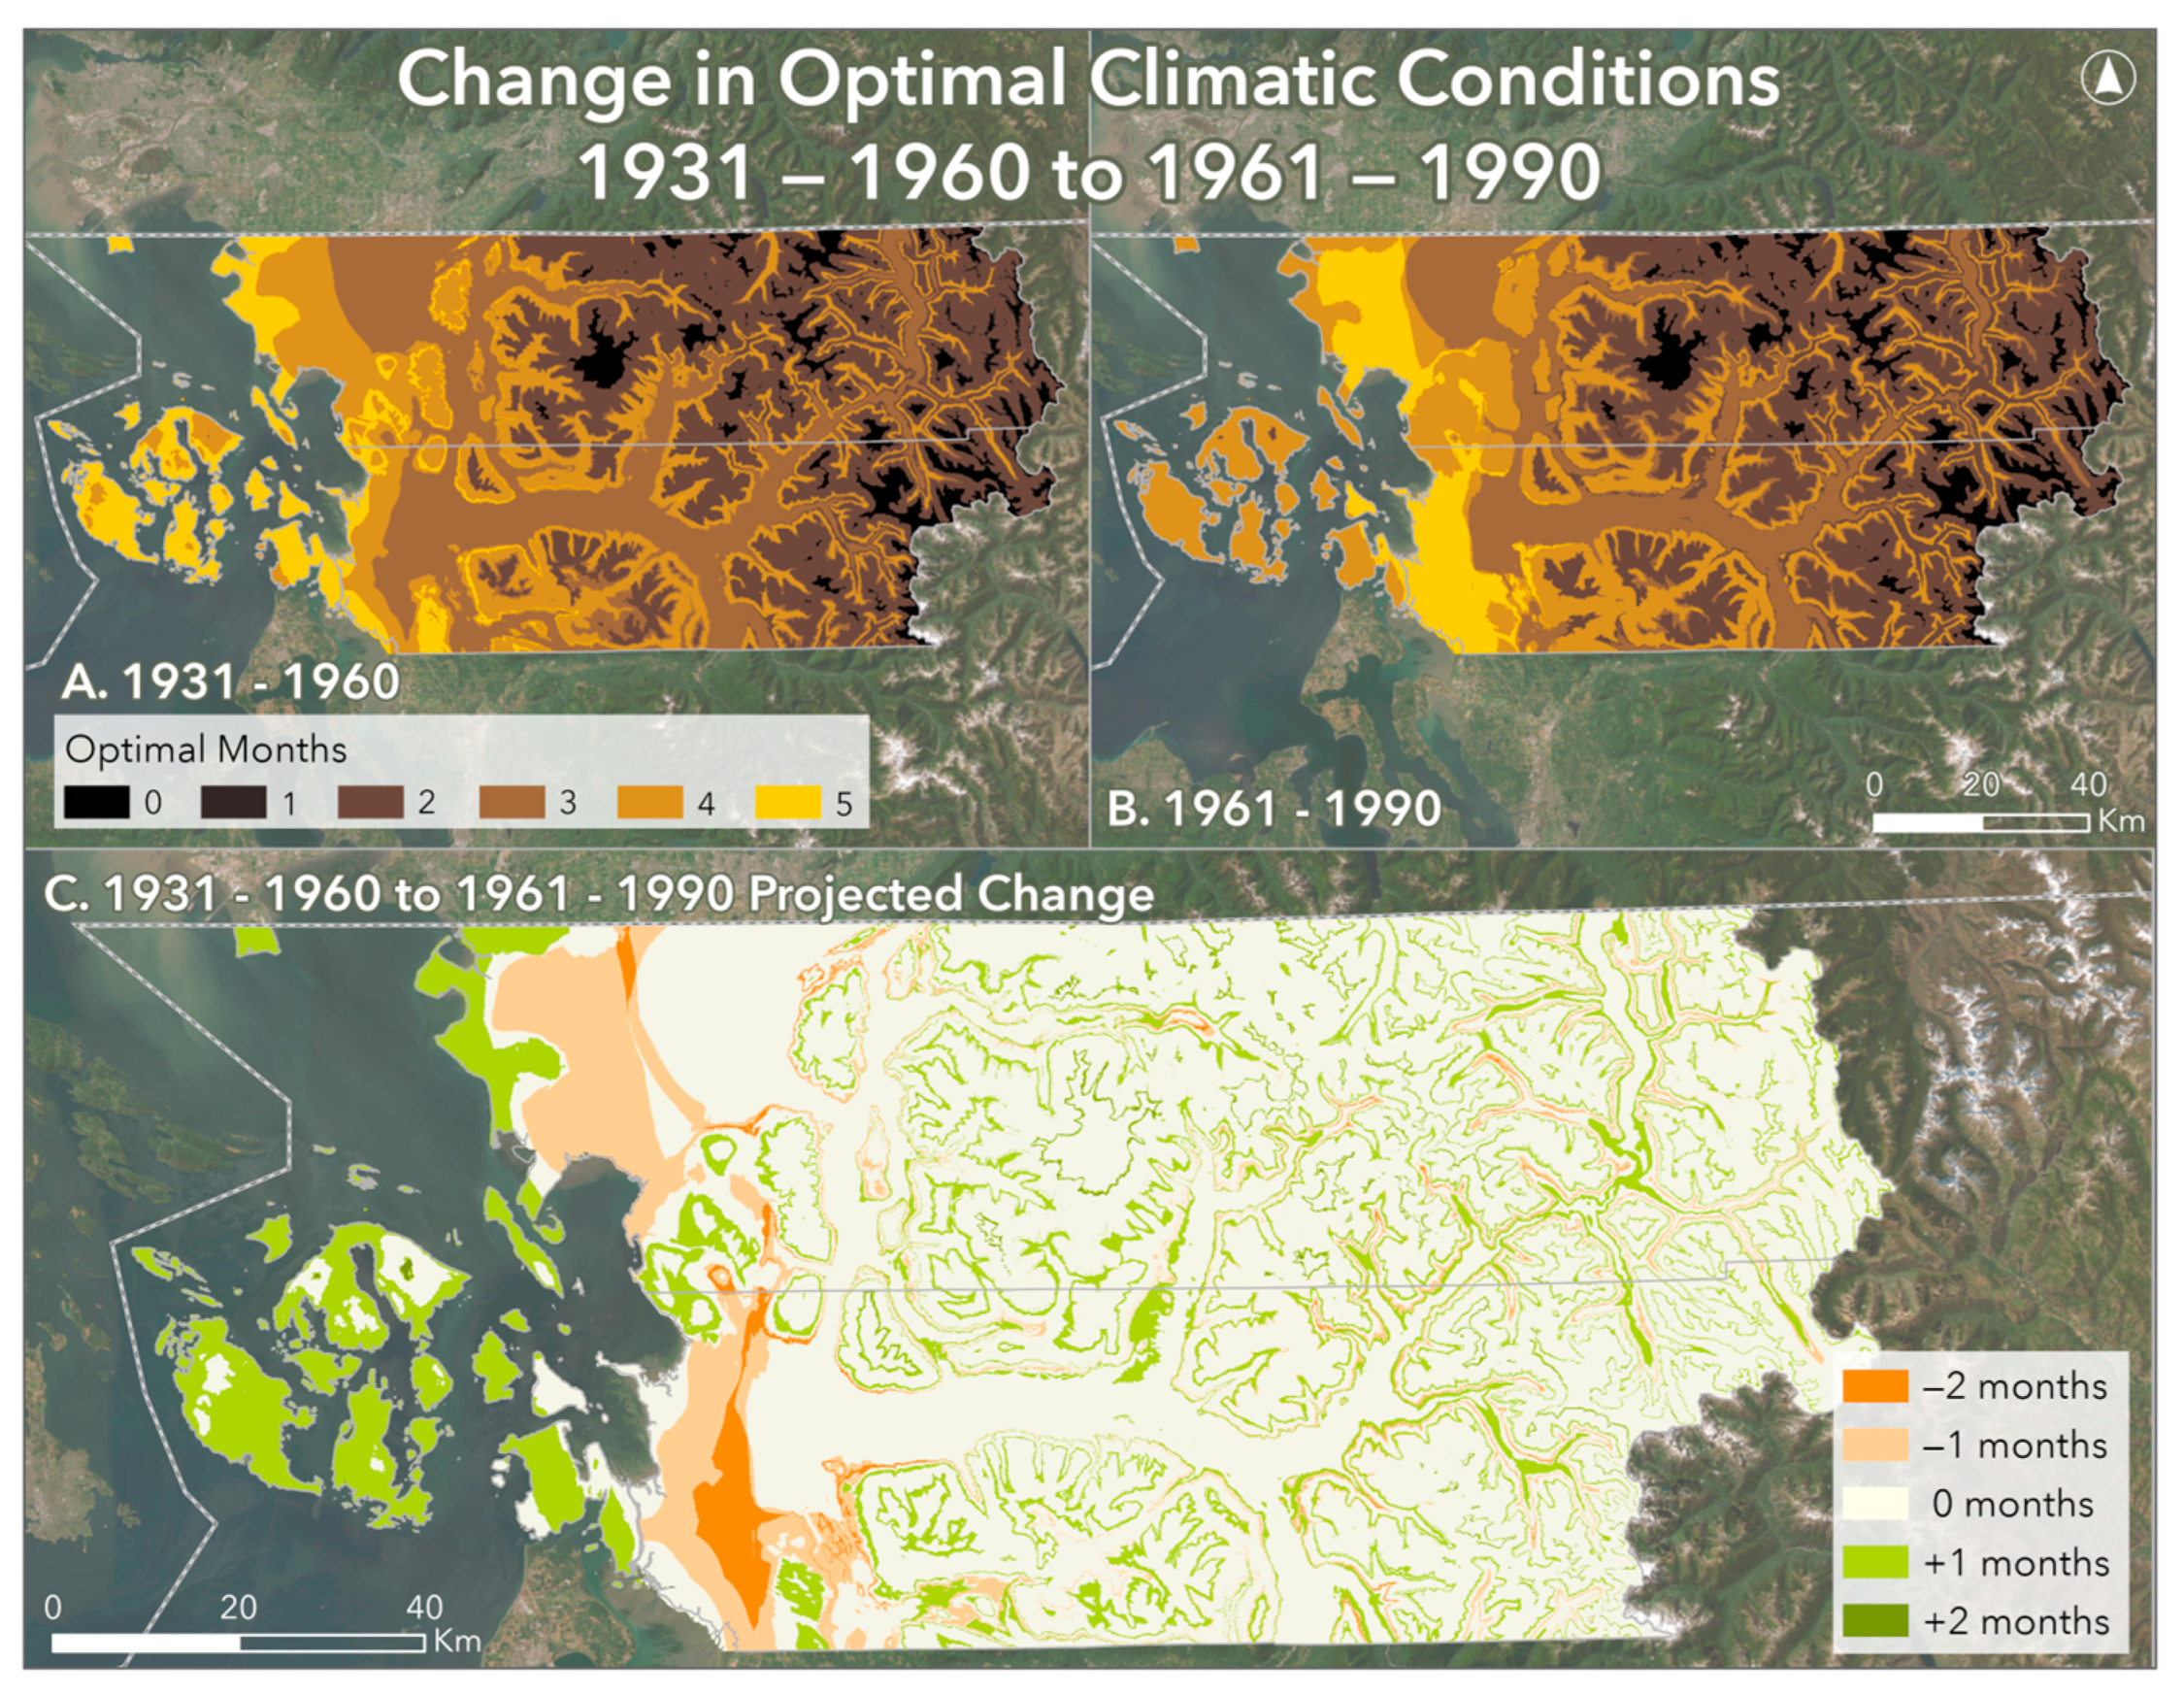
From 1931–1960 to 1961–1990, one month of optimal temperatures was gained across San Juan County, as well as on the coast (Figure 7). Up to 2 months of optimal temperatures were lost beyond the coastal lowland region.

Figure 7.
Optimal climate envelopes and change for 1931–1960 and 1961–1990.
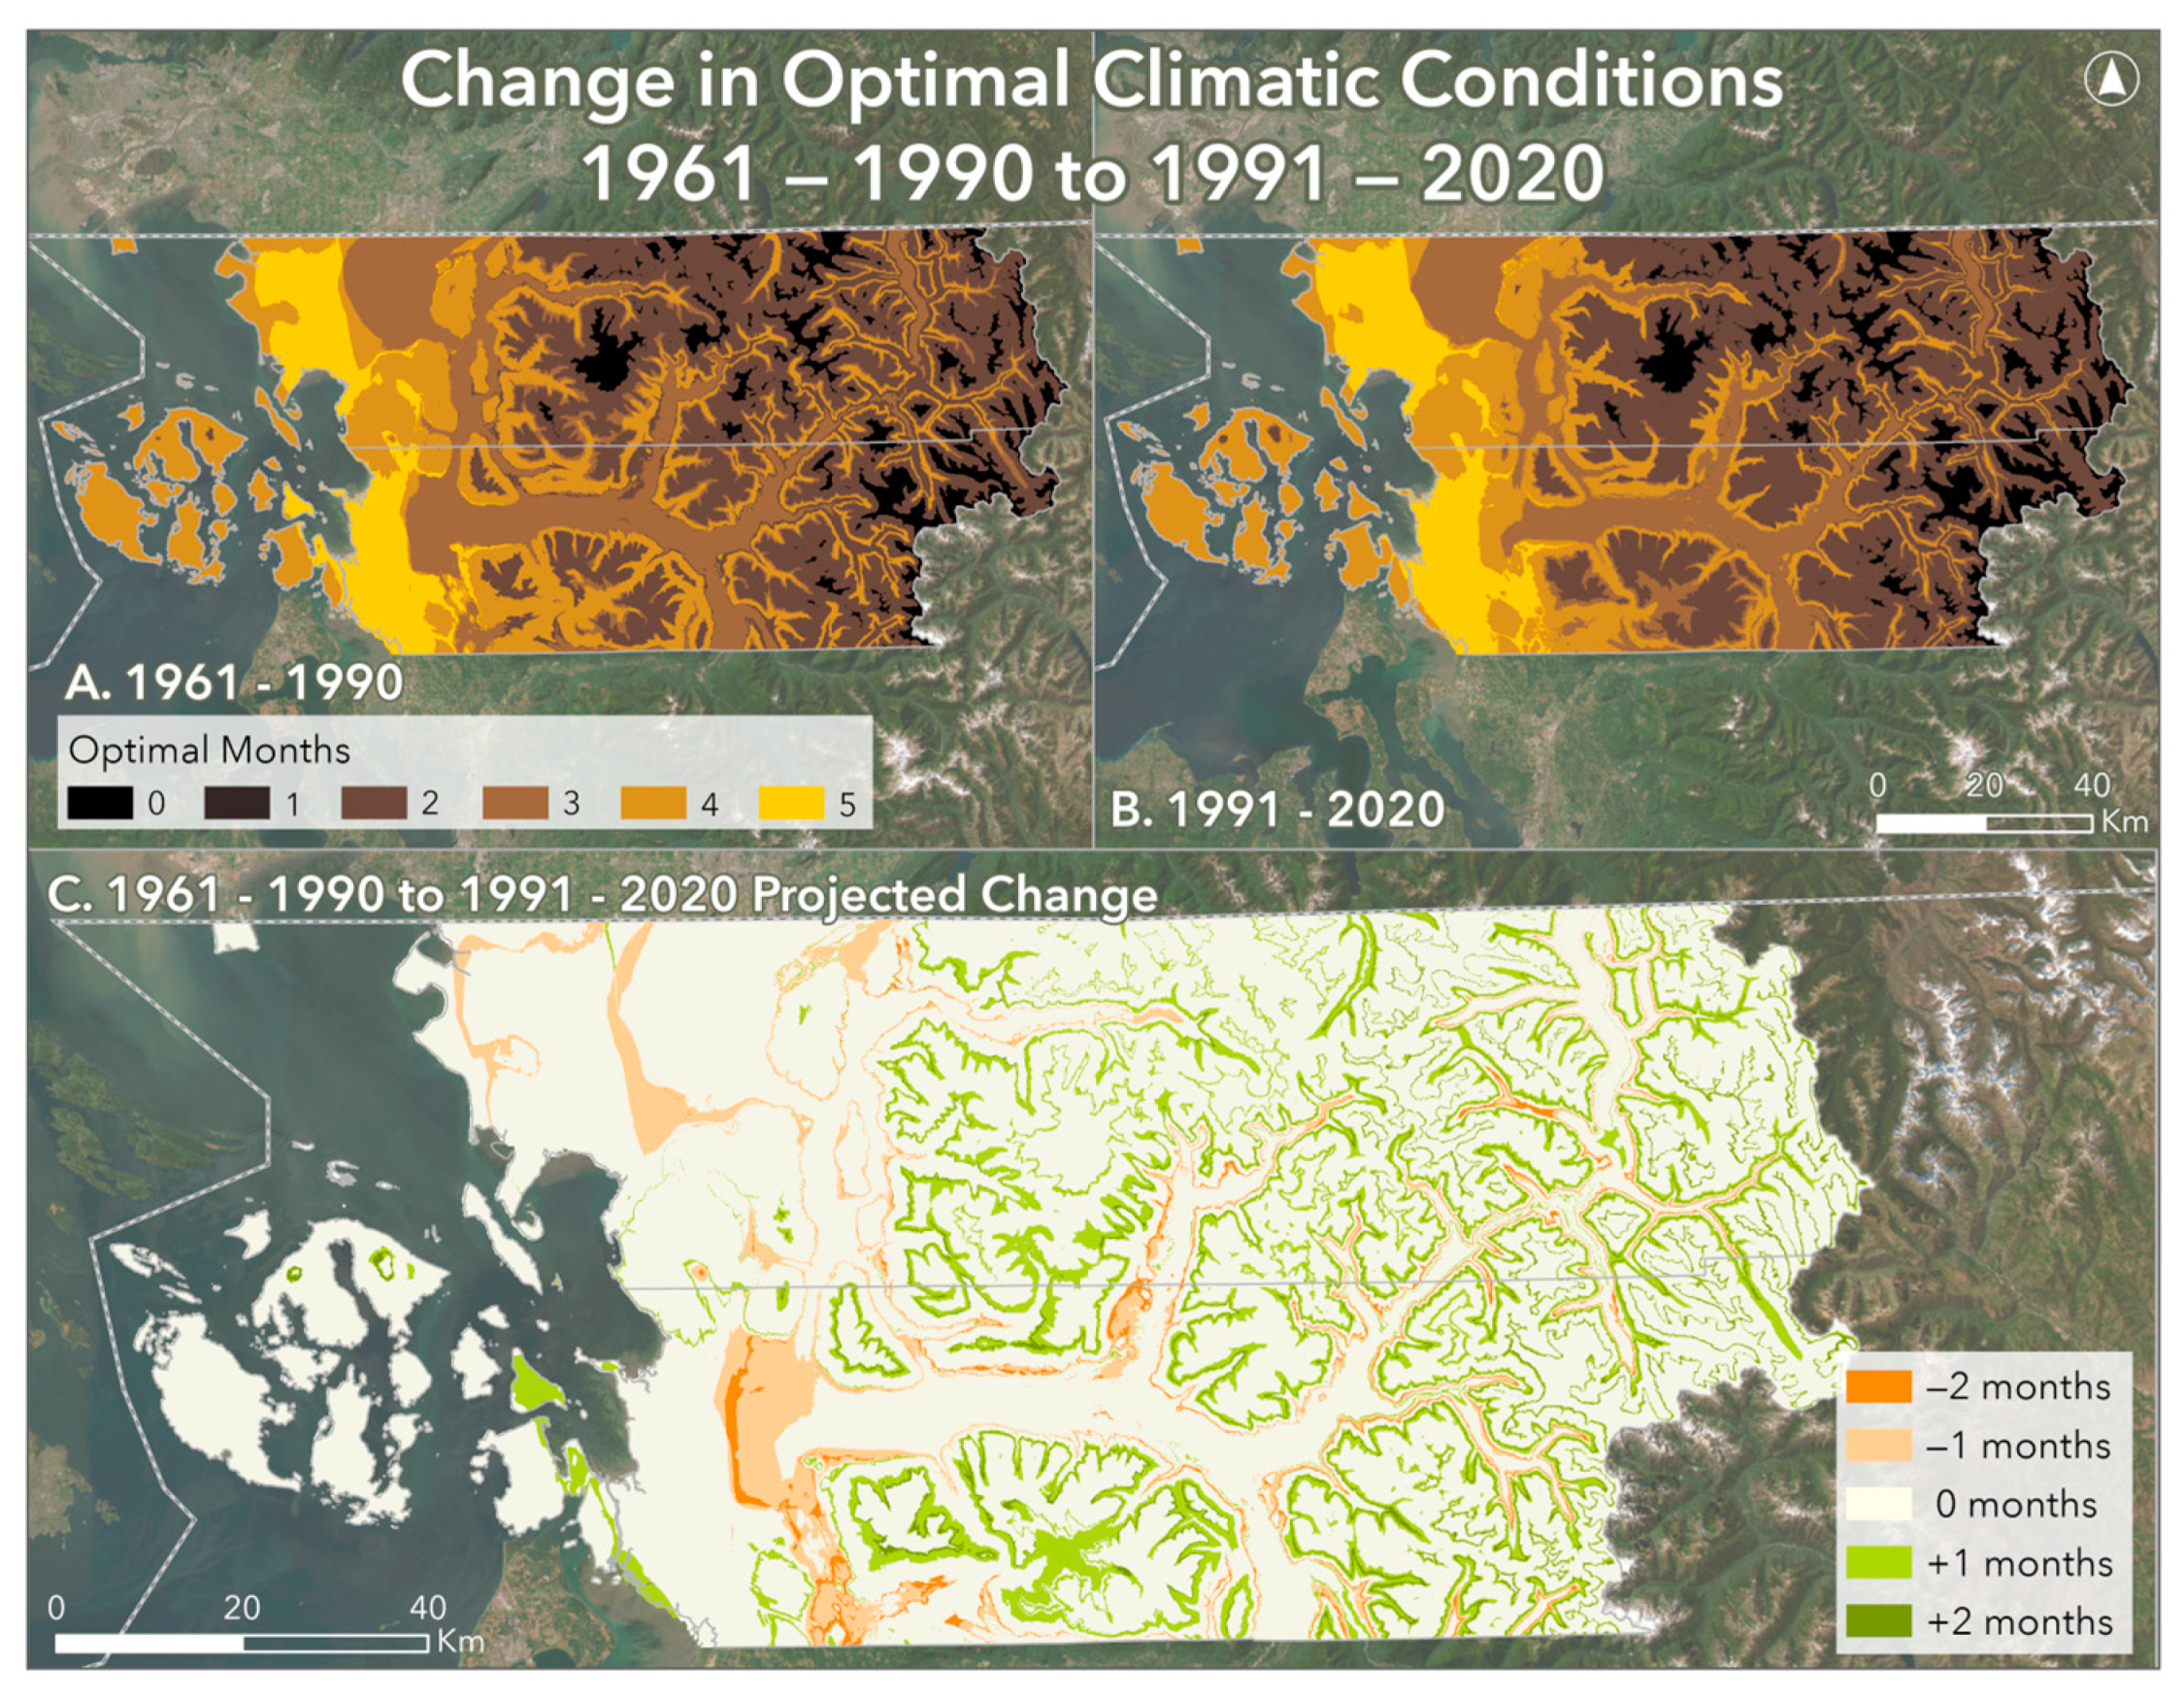
From 1961–1990 to 1991–2020, higher elevation areas in the Cascade Mountain Range gained one to two months of optimal suitability (Figure 8). Coastal areas experienced minor changes, and there continued to be a loss of suitability beyond the coastal region. Looking at the changes across all time periods, areas west of the Cascade Mountains and some areas near the coast on the mainland have undergone the most change in the last 120–123 years.

Figure 8.
Optimal climate envelopes and change for 1961–1990 and 1991–2020.
3.4. Future Temperature Suitability for Wheat
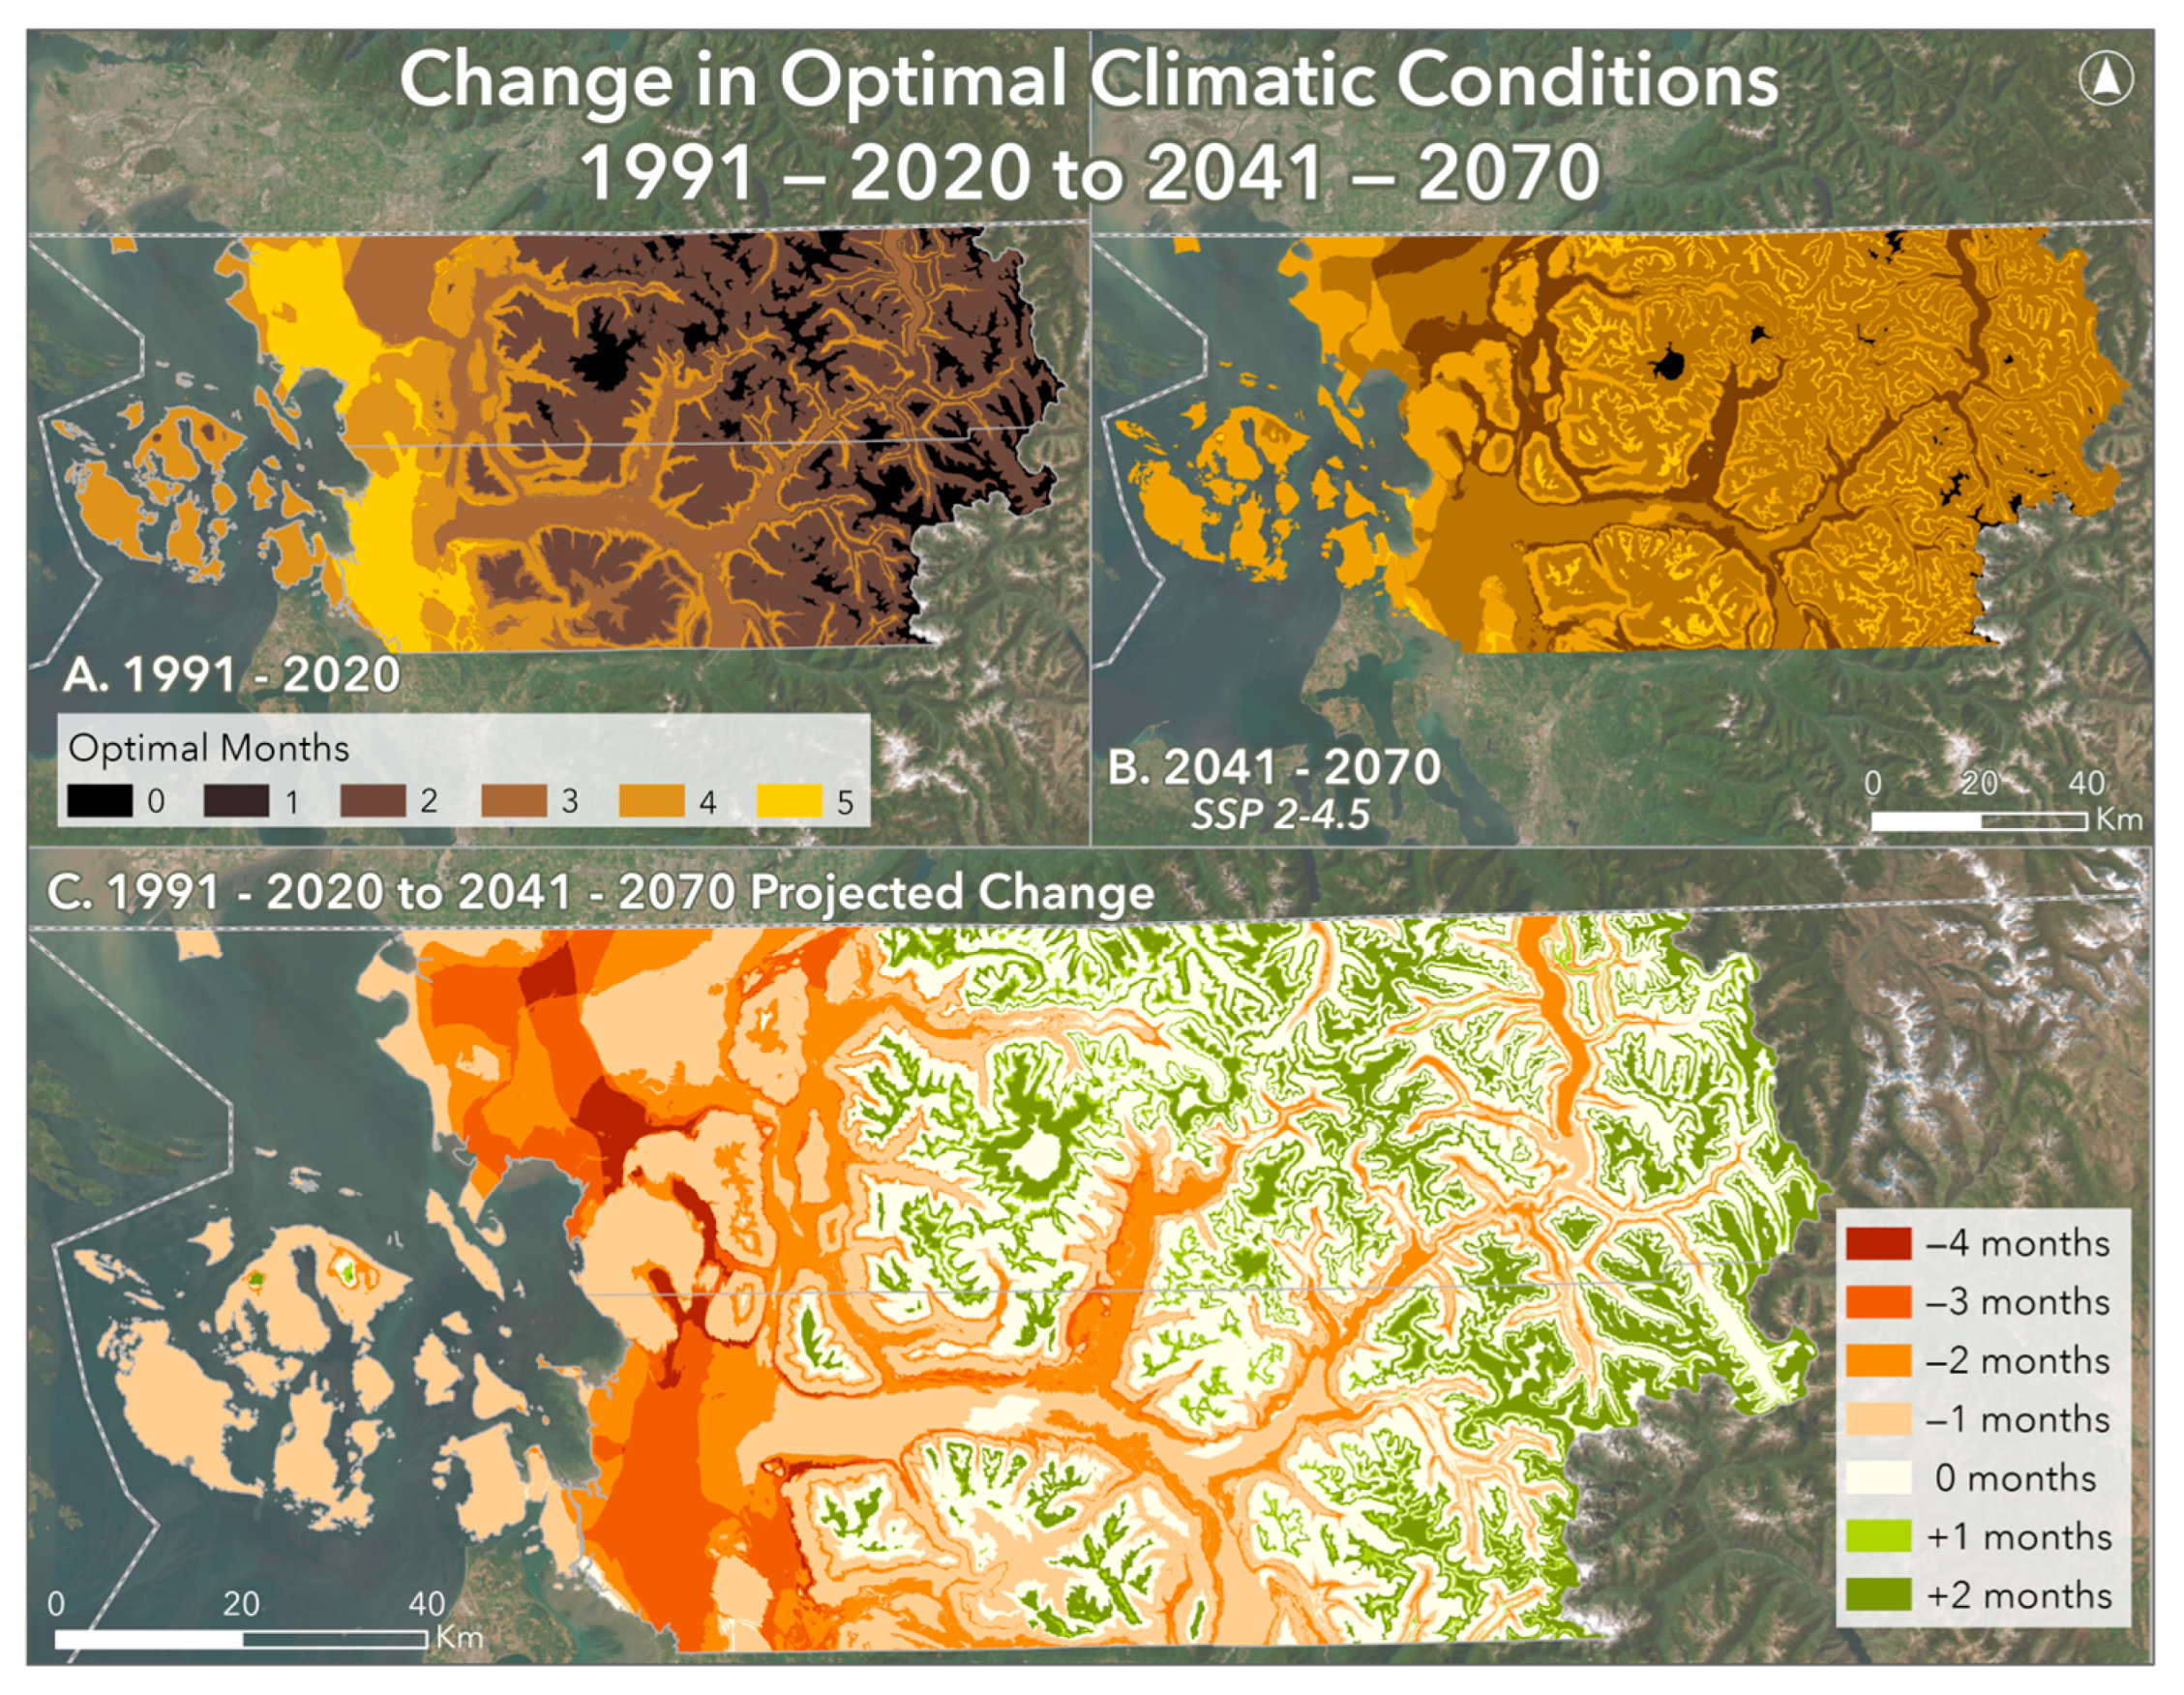
Climatic suitability will continue to change in the future. The most notable change is a large increase in climatic suitability in mountainous areas (Figure 9). Temperatures are projected to become increasingly warmer, leading to more climatic suitability in terms of minimum temperatures but, in some cases, lower climatic suitability due to increased maximum temperatures. Compared to the 1991–2020 climate normal, our 2041–2070 projected suitability maps predict a decrease in the overall area with optimal climatic conditions (Figure 9). Our results based on an ensemble of SSP2-4.5 climate projections show up to 4 months of loss for optimal climatic suitability in the lowlands between the coast and mountains.
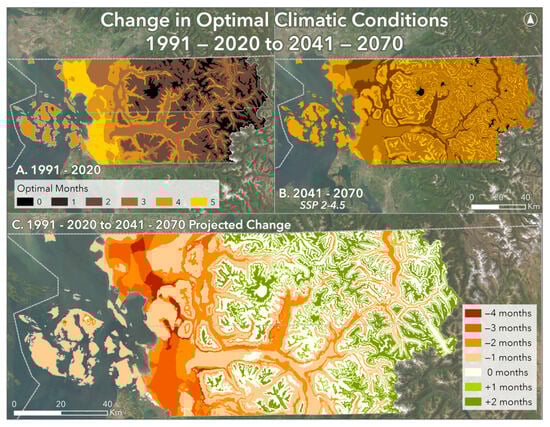
Figure 9.
Projected optimal climate envelopes and change for 1991–2020 and 2041–2070.
3.5. Available Areas to Grow Wheat
A suitable temperature is not the only requirement for growing wheat. Assuming the crop would receive adequate water through rainfall or irrigation, soil types, and land use, zoning should be considered to determine areas that are most suitable for wheat growing in northwest Washington. While there is variable climatic suitability across the study area, only areas zoned for agriculture could grow wheat in large quantities. Similarly, there are multiple soil types in northwest Washington, and not every soil is suited for either agriculture or growing wheat in general, so it is important to select soils that have the best characteristics for growing wheat (Figure 10).
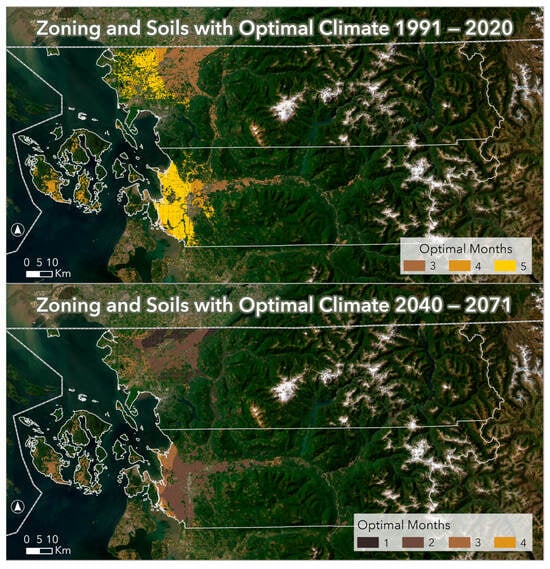
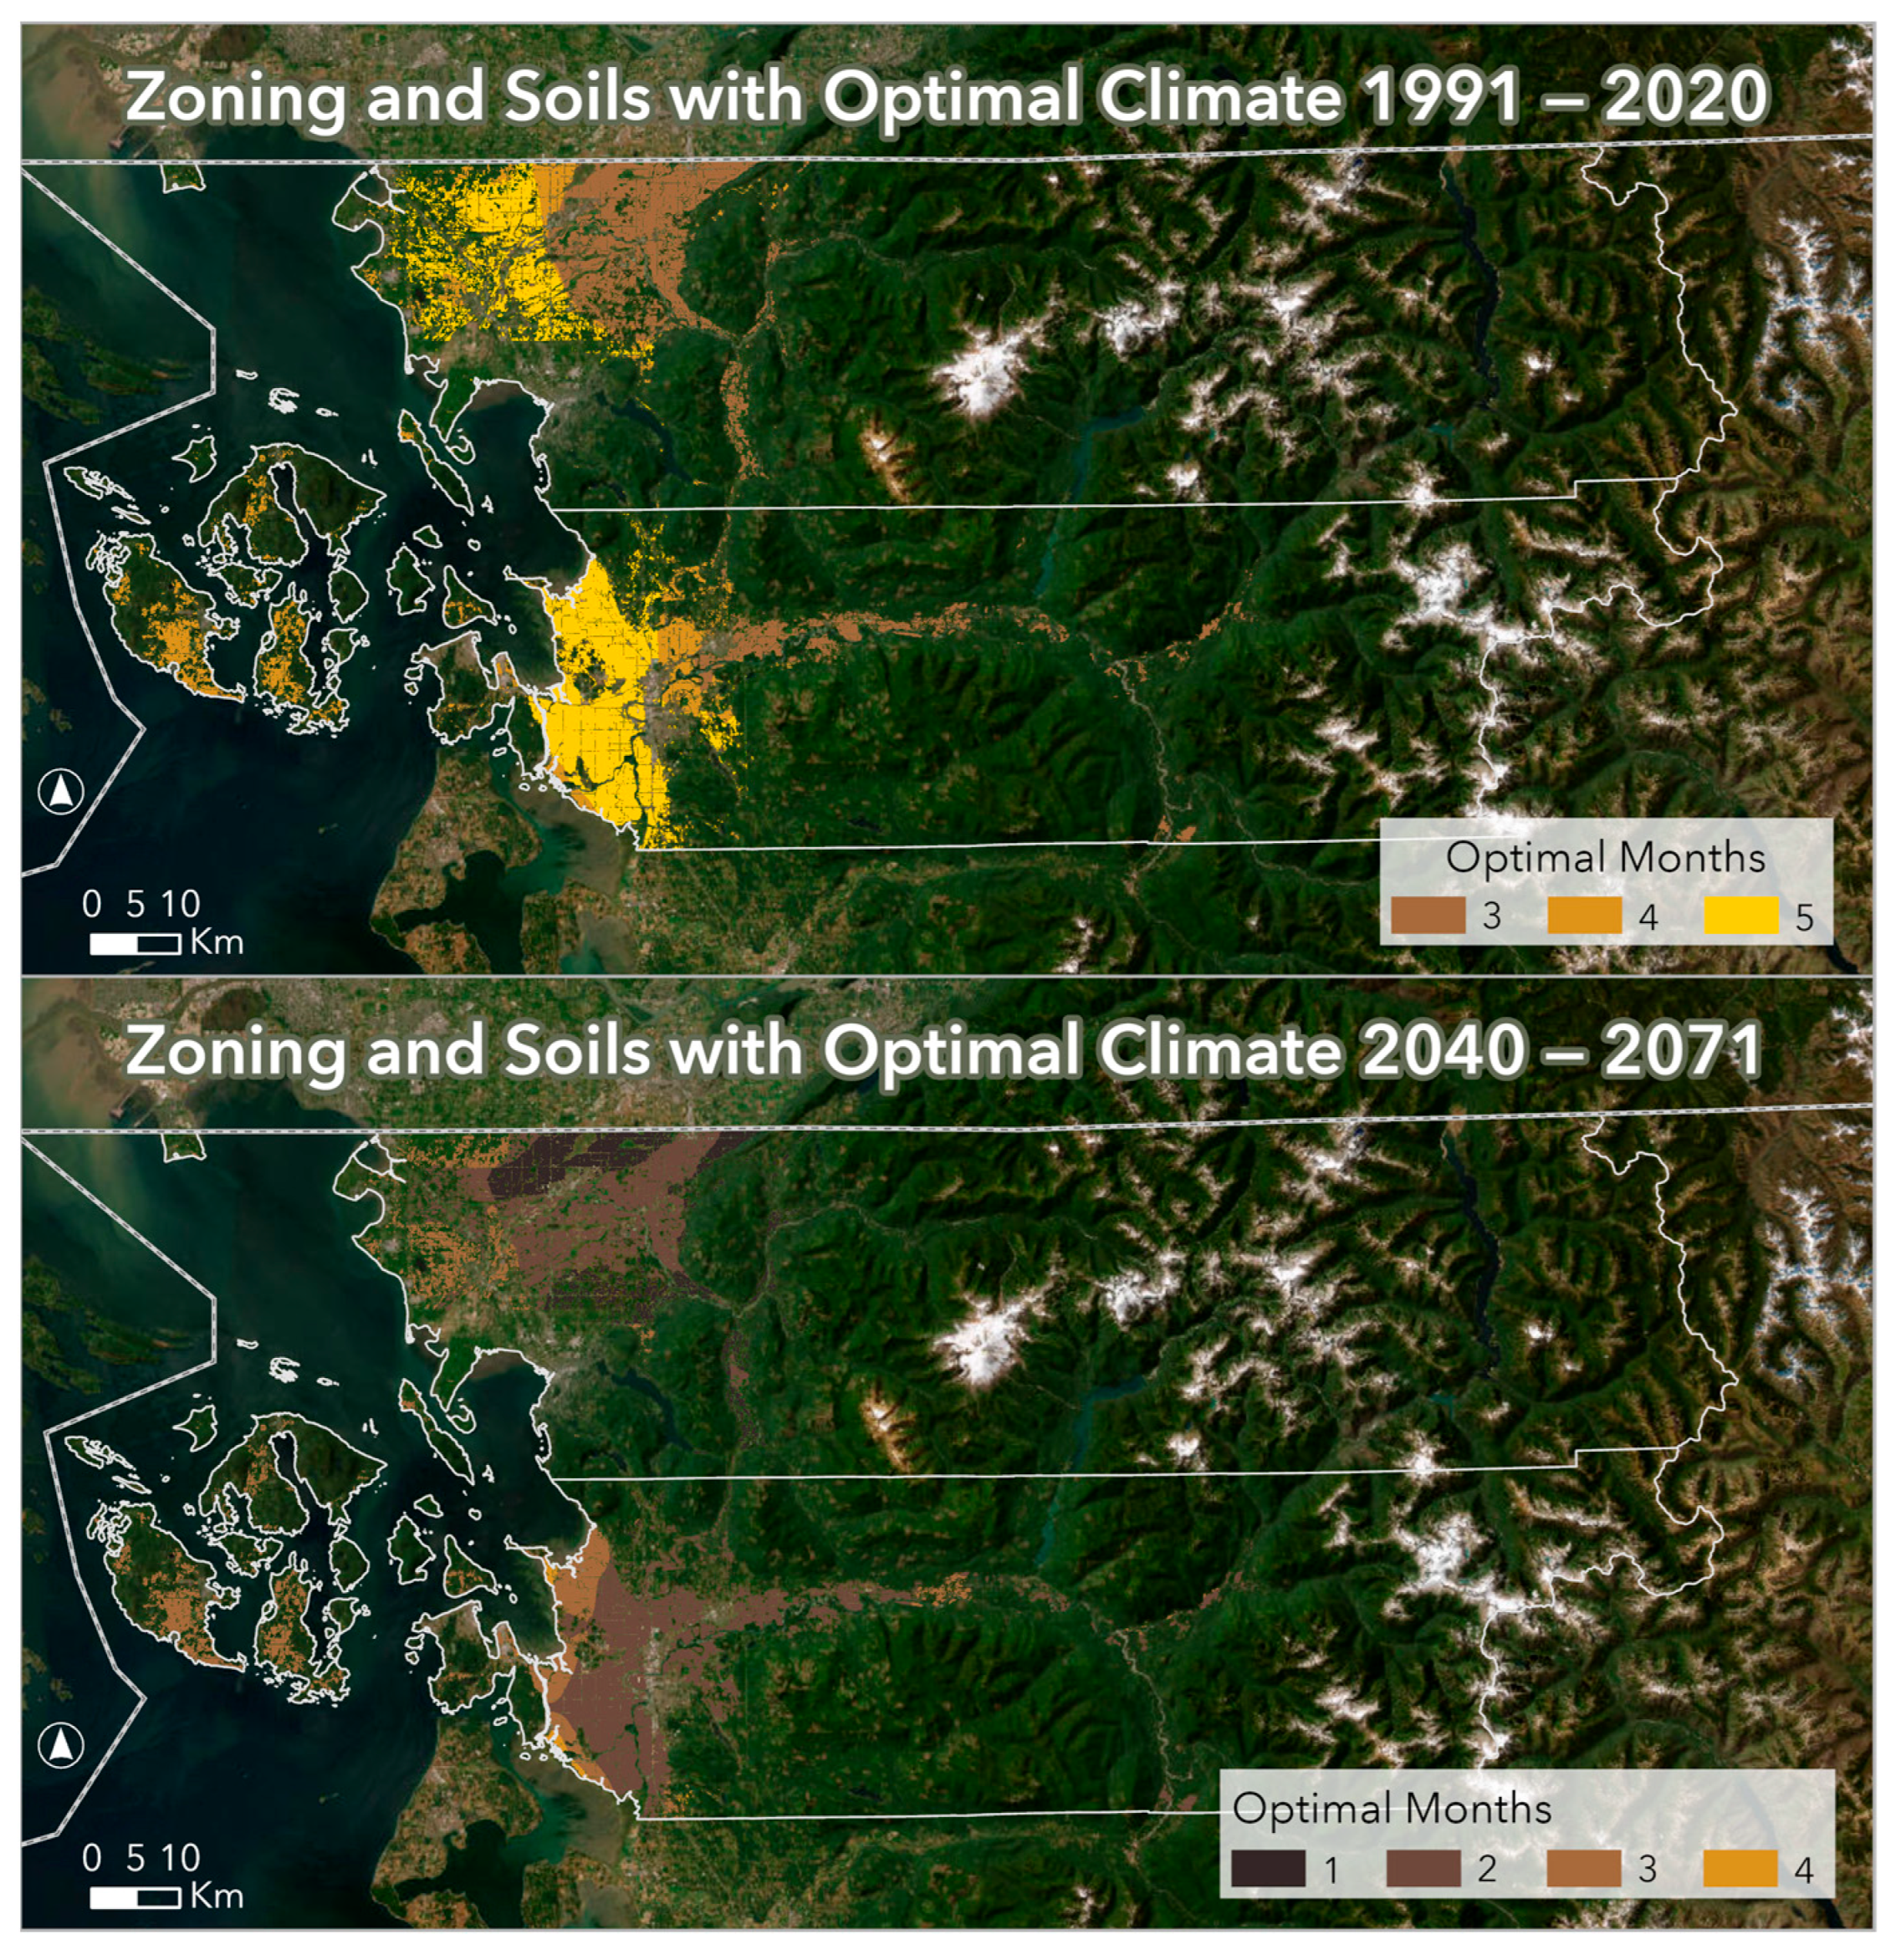
Figure 10.
Areas of optimal suitability that are zoned for agriculture and have optimal soil types.
Combining both soil types and zoning provides the most restricted but also most realistic results for areas that not only can grow wheat but have multiple months of optimal climatic suitability (Figure 10). This shows that many agriculturally zoned areas are on top of soils that are suitable for wheat growth and agriculture in general. Agricultural zoning is more limiting than soil types are. However, zoning does change, which means different areas could become zoned for agriculture in future years. Because there is no way to reliably predict what changes will be made for agricultural zoning from 2040–2071, we applied the same current-day zoning to that time period. This combination of soil, zoning, and temperature analyses identifies areas that can be considered ideal for wheat growth in northwest Washington.
Looking at areas that have both optimal agriculture soils and agricultural zoning, there are 791.67 total square kilometers with 3 to 5 months of optimal climatic suitability for 1991–2020. From 2041 to 2070, there are 790.4 total square kilometers with 1 to 4 months of optimal climatic suitability (Table 3).
Table 3.
Area in square kilometers of suitable areas for zoning and soils split by months of optimal climatic suitability.
3.6. Interview Results
Interviewees had differing reasons for being involved in a local grain system, but many indicated that a large driver to be a part of this system is to invest in the health of their community and local landscape:
Baker 4: There’s a lot of good people here … that’s what kept me here. And the reason I wanted to set up shop here beyond that was just to build our community more.
Farmer and Baker 2: Two drivers making these decisions in terms of the ingredients we use in the bakery and how we use them. One, human health in our community, people eating in our bread, and two, landscape health both in the community and further field as we source our ingredients further away.
Farmer 1: This area’s one of the most sustainable because of the rains we get, the type of soil we have, the proximity to markets … we feel like we’re part of a real, sustainable food system.
The most common theme that interviewees spoke about was an increasing interest in grain growing in Northwest Washington.
Farmer and Baker 2: The concept of growing grain at a small scale seems more available to farmers now than it did when we first moved here.
Baker 3: It seems like it’s only expanding, and people are embracing locally grown grain.
Despite this rising interest, interviewees noted challenges with finances and access to infrastructure that create barriers to growing grain. While the monetary value of wheat and other cereal grains is rising in Northwest Washington, farmers and bakers still must fund hidden costs to grow the crops.
Miller 1: The biggest challenge now is cost increases—fuel, freight, land rent.
Farmer 3: If I was really getting serious about grain … the equipment alone, like a good combine, you can drop fifty grand, a hundred grand, depending on what scale you want.
Baker 1: I think that … through places like Cairnspring [Mill] or maybe wanting to do another mill, we could see more grain being grown here.
Many interviewees expressed uncertainty about the future due to the effects of climate change. One farmer noted that “the climate is tricky” for growing wheat to begin with, echoing the concerns about the feasibility of grain farming as the climate continues to change:
Baker 4: The state of our climate is obviously a huge factor. It’s going to be really rough for all of us. So, [we should] just have hope but also caution and action.
Baker 1: I do worry that just in general, the research being done for climate change is not [going to] happen fast enough for what we’re going through.
Interestingly, despite the worries about climate change impacts, interviewees also expressed optimism about this region’s role as a grain-growing location in the future:
Miller 1: Wheat is one of the most adaptable crops … that we can cultivate to be viable as we see the impacts of climate change. We’re seeing a tremendous amount of market demand for regeneratively grown grains.
Farmer 3: When you look at climate change and other things that affect food production, places like this are more and more being recognized as being of extreme value.
Farmer 1: I think [grain] is just going to get more varieties, more diverse, better for the consumer.
4. Discussion
4.1. Census Records
There are fewer grain farms in northwest Washington than in the early 20th century and fewer acres dedicated to cereal grains. However, the area still had higher productivity in almost all time periods compared to the statewide average. This shows the increasing importance of local cereal grains in northwest Washington, as farmers are working to increase efficiency and output that outpaces the entire state average.
Even if productivity continues to rise in northwest Washington, farms will not look the same as they did in the early 20th century. Efficiency is a large part of the financial success of a farm, but cereal grains are not as lucrative for small farms as crops like vegetables and fruits. However, cereal grains could become part of this crop mix due to the rising community interest in locally sourced grains. Understanding the historical context of these systems can help farmers, bakers, and millers decide what choices to make regarding grains, especially if they should grow or use them at all.
4.2. Changing Temperature
Climatic suitability fluctuated across the last 120 years, but there has been an overall loss of optimal climatic suitability in the lowland areas since the 1901–1930 climate normal. Future climatic suitability from 2041–2070 shows an overall decrease in lowland areas. Despite some loss of climatic suitability, there are areas that have increased in climatic suitability over time. These areas are mostly high-elevation areas. The largest change is from the 1991–2020 climate normal to the 2041–2070 climate normal, with climatic suitability increasing to three months or decreasing up to 4 months. Additionally, while there are up to 5 months of optimal climate suitability from 1991–2020, there are only up to 4 months projected of optimal climate suitability for the 2041–2070 time period.
Looking at the temperatures of each month in the 1991–2020 climate normal, August showed a higher average temperature in those areas than the optimal envelope of 17–23 °C. While this temperature is still in the suitable temperature growth range, it does not register as optimal, bringing climatic suitability down in areas that were previously within the optimal threshold. In the future, July and August will have increasing temperatures that fall outside of the upper limits of the optimal suitability threshold. If temperatures continue to increase as projected through 2065, more climatic suitability could be lost through areas near the coastline. This could also continue to increase temperature suitability in mountainous areas. This is problematic because of the difficulties growing crops like wheat in uneven, mountainous areas where soils are unlikely to be suitable for grain crops. In addition, there is a lack of agricultural zoning that would make it impossible for wheat to be grown by farms in these areas without a zoning change.
Even though optimal climatic suitability is shifting geographically, wheat should still be able to grow in the area. Our analysis of the projected future climate indicates that there will still be many months that have the temperatures to support crop growth, even if they are not the currently defined ideal temperature. Farmers may have to reconsider the timing of their primary growing season, but areas with three or four months of optimal conditions should still give adequate time for a successful harvest.
4.3. Farmer and Baker Decision-Making
Three main themes shared between farmers and bakers can be identified from their interviews. First, there is increasing interest in growing grains and participating in local food systems in Northwest Washington. Second, farmers and bakers agreed that finances and access to infrastructure such as mills are a large barrier to cereal grain farming. Third, many interviewees are worried about the impacts of climate change both on wheat crops and the local food system.
While many of the interviewees share common sentiments regarding these themes, our results are limited by a small sample size (n = 7). The community involved in local grain agriculture in Northwest Washington is small, resulting in a sample size that is reflective of that community. In addition, due to the busy nature of these professions, it was difficult to have steady contact with some interviewees, resulting in fewer interviews than the number of available interviewees in the study area.
Despite this sample size limitation, interviewees provided insight into the growing local grain system in Northwest Washington. Overall, farmers, millers, and bakers engaged in local grain systems in Northwest Washington are hopeful for the future of grains, especially as their value continues to increase. It would be interesting to compare this to a larger sample size of farmers and bakers in the study area to see if these themes continue to appear. In addition, these results provide a basic understanding of why farmers and bakers choose to become involved in local grain systems. A study looking more closely at the financial reasons farmers and bakers make decisions could build on these results, as well as a study looking at changing community demographics affecting the makeup of bakers and farmers in Northwest Washington.
Our research builds on previous findings by Hills et al. [5], Jones [10], and Winkler et al. [15]. These studies found that there is rising interest in bringing back local grain agriculture after the loss of grain agriculture in northwest Washington in the 20th century [5,10,15]. Additionally, findings suggest that while there are infrastructure and funding barriers to reintroducing grain agriculture, local communities are willing to invest in this return [5,10,15].
5. Conclusions
Our analysis of historical records showed that the extent of grain agriculture in northwest Washington declined in the mid-twentieth century. However, climatic suitability for wheat farming actually increased across much of the agricultural land in this region from the early- to mid-twentieth century. The productivity per acre of grain agriculture remained higher than the statewide average throughout the twentieth century. These results show that the decline in grain agriculture was due to cultural and economic factors, not climatic changes.
We used a combination of spatial datasets representing soil types, land use zoning, and both historical and projected future climate data to assess changes in the extent and location of optimal biophysical conditions for wheat farming during the 20th and 21st centuries. We found that the length of the season of optimal climatic conditions for wheat growth will become shorter over the 21st century across areas with optimal soils and zoning. Farmers may need to adjust their agricultural practices to adapt to these changes, but the region will still have enough months of optimal climatic conditions to support successful wheat agriculture.
By combining qualitative analysis of interviews with our quantitative spatial analyses, we were able to explore the motivations and concerns of farmers and bakers working with locally grown grains. Communities in northwest Washington have shown interest in local food movements, especially with their local grain systems. Artisan, nutrient-packed breads have become a popular choice despite northwest Washington not being viewed as a typical grain-growing region. Many farmers, millers, and bakers value community-focused crop systems and understanding the history of cereal grains in northwest Washington. It is difficult to predict the future of local grains in northwest Washington, given uncertainty about future climatic and economic conditions, but the local community shows a focus on resilience and sustainability that indicates growing cereal grains in the area has a chance of continuing to be successful.
Our results show that multiple factors affect a community’s decision to invest in local grain agriculture. There is a connection between social, historical, and physical factors. Farmers, bakers, and millers expressed concerns regarding climate change and agricultural infrastructure but were optimistic about the rising community interest in a local grain system. As climate change continues to affect temperature and precipitation, climatic suitability for growing wheat will continue to change. Agricultural practices may need to be adapted to fit the timing and location of optimal climatic conditions for wheat growth. As temperatures continue to rise in the 21st century, more research should be conducted to understand how climate change, temperature, and other factors will affect grain agriculture in northwest Washington and how those factors interact with climate and community dynamics.
Author Contributions
Conceptualization, N.F. and A.F.; methodology, N.F. and A.F.; software N.F. and A.F.; validation, N.F. and A.F.; formal analysis, N.F. and A.F.; investigation, N.F. and A.F.; resources, N.F. and A.F.; data curation, N.F. and A.F.; writing—original draft preparation, N.F. and A.F.; writing—review and editing, N.F. and A.F., visualization, N.F. and A.F.; supervision, N.F. and A.F. All authors have read and agreed to the published version of the manuscript.
Funding
This research received funding from WWU’s College of the Environment Small Grant #1576936.
Institutional Review Board Statement
This study was conducted in accordance with the Declaration of Helsinki, and the protocol was approved by the Ethics Committee of Western Washington University (#4709EX22) on 21 November 2022.
Informed Consent Statement
Informed consent for participation was obtained from all subjects involved in the study.
Data Availability Statement
The raw data supporting the conclusions of this article will be made available by the authors upon request. Interviewee data is not available for public use.
Acknowledgments
The authors would like to express sincere gratitude to all interviewees for participating in the study. We also thank Western Washington University’s College of the Environment for their support in this research.
Conflicts of Interest
The authors declare no conflicts of interest.
Appendix A. Interview Search Terms
Online search terms used for identification of suitable interviewees:
[Whatcom, Skagit, or San Juan County] local grains.
[Whatcom, Skagit, or San Juan County] farmers.
[Whatcom, Skagit, or San Juan County] bakers.
[Whatcom, Skagit, or San Juan County] millers.
[Whatcom, Skagit, or San Juan County] farmers market.
[Whatcom, Skagit, or San Juan County] grain farmer.
[Whatcom, Skagit, or San Juan County] local food.
[Whatcom, Skagit, or San Juan County] grains.
WSU Bread Lab farmers.
Appendix B. Interview Questions
Can you tell me about your farm?
Can you tell me specifically what you grow on the farm/bake/mill and how you made the selection to grow these particular crops?
How did you become a farmer/baker/miller in this region? Why did you pick this region?
Can you tell me more about your decision to grow/use grains?
What have been the biggest challenges in deciding to grow/use grains?
Do you still face these same challenges now? If so, why do you think that is?
Compared to when you started farming, what are some new challenges that you are facing today?
Since you have been farming/baking/milling for X years, how have you seen farming change in this region?
If you were to predict the future of grain farming in this region, what would you think it would look like and why?
Since starting to farm/use grains, have you connected with any other grain farmers/millers/bakers in the area? Have you relied on these relationships to build a business?
Who specifically or what farms specifically have you connected with that have been particularly helpful? In addition, what farms do you feel you have helped?
How has COVID-19 impacted your farm? Did it impact what crops you grow?
References
- Béné, C.; Oosterveer, P.; Lamotte, L.; Brouwer, I.D.; de Haan, S.; Prager, S.D.; Talsma, E.F.; Khoury, C.K. When food systems meet sustainability–Current narratives and implications for actions. World Dev. 2019, 113, 116–130. [Google Scholar] [CrossRef]
- Brinkley, C. Visualizing the social and geographical embeddedness of local food systems. J. Rural Stud. 2017, 54, 314–325. [Google Scholar] [CrossRef]
- Simons, K. Northeastern bakers’ views on organic and regeneratively certified flours. J. Agric. Food Syst. Community Dev. 2023, 13, 267–279. [Google Scholar] [CrossRef]
- Hoogenboom, A.; Sloane, E.; Canty, D. Planting the Seeds: Moving to More Local Food in Western Washington. Available online: https://farmlandinfo.org/wp-content/uploads/sites/2/2019/09/AFTPlantingTheSeedsF.pdf (accessed on 14 January 2025).
- Hills, K.M.; Goldberger, J.R.; Jones, S.S. Commercial bakers’ view on the meaning of” local” wheat and flour in western Washington State. J. Agric. Food Syst. 2013, 3, 13–32. [Google Scholar] [CrossRef]
- Enthoven, L.; Van den Broeck, G. Local food systems: Reviewing two decades of research. Agric. Syst. 2021, 193, 103226. [Google Scholar] [CrossRef]
- USDA National Agricultural Statistics Service. Market Value of Agricultural Products Sold Including Food Marketing Practices and Value-Added Products. 2022. Available online: https://www.nass.usda.gov/Publications/AgCensus/2022/Full_Report/Volume_1,_Chapter_2_County_Level/Washington/st53_2_002_002.pdf (accessed on 14 January 2025).
- Brouwer, B.O.; Murphy, K.M.; Jones, S.S. Plant breeding for local food systems: A contextual review of end-use selection for small grains and dry beans in Western Washington. Renew. Agric. Food Syst. 2016, 31, 172–184. [Google Scholar] [CrossRef]
- Kershner, J. Wheat Farming in Washington. Available online: https://historylink.org/File/20504?_gl=1*1m2oiwc*_ga*MTkwNTk0NDE1NS4xNzMyODM4MjM2*_ga_3W5XJDRM1X*MTczMjgzODIzNS4xLjEuMTczMjgzODI0OS40Ni4wLjA (accessed on 14 February 2025).
- Jones, S. Kicking the commodity habit: On being grown out of place. Gastronomica 2012, 12, 74–77. [Google Scholar] [CrossRef]
- Dimitri, C.; Effland, A.; Conklin, N.C. The 20th Century Transformation of US Agriculture and Farm Policy. Available online: https://ageconsearch.umn.edu/record/59390// (accessed on 14 January 2025).
- Hendrickson, M.; James, H.S. The Ethics of Constrained Choice: How the Industrialization of Agriculture Impacts Farming and Farmer Behavior. J. Agric. Environ. Ethics 2005, 18, 269–291. [Google Scholar] [CrossRef]
- Schapsmeier, E.; Schapsmeier, F. Eisenhower and Ezra Taft Benson: Farm Policy in the 1950s. Agric. Hist. 1970, 44, 369–378. [Google Scholar]
- Washington Grain Commission. Wheat. Available online: https://wagrains.org/wheat/#:~:text=The%20vast%20majority%20of%20wheat,between%20crops%20to%20accumulate%20moisture (accessed on 14 January 2025).
- Winkler, L.R.; Murphy, K.M.; Jones, S.S. The history of oats in western Washington and the evolution of regionality in agriculture. J. Rural. Stud. 2016, 47, 231–241. [Google Scholar] [CrossRef]
- Cairnspring Mills. Local Milling Is Back. Available online: https://cairnspring.com/pages/our-story (accessed on 14 January 2025).
- WSU Bread Lab. About Us. Available online: https://breadlab.wsu.edu/about-us/ (accessed on 14 January 2025).
- Jones, S.; Econopouly, B. Breeding away from all purpose. Agroecol. Sustain. Food Syst. 2018, 42, 712–721. [Google Scholar] [CrossRef]
- Rempelos, L.; Wang, J.; Sufar, E.K.; Almuayrifi, M.S.B.; Knutt, D.; Leifert, H.; Leifert, A.; Wilkinson, A.; Shotton, P.; Hasanaliyeva, G.; et al. Breeding Bread-Making Wheat Varieties for Organic Farming Systems: The Need to Target Productivity, Robustness, Resource Use Efficiency and Grain Quality Traits. Foods 2023, 12, 1209. [Google Scholar] [CrossRef] [PubMed]
- Murphy, K.; Carter, A.; Jones, S. Evolutionary breeding and climate change. In Genomics and Breeding for Climate-Resilient Crops: Vol. 1 Concepts and Strategies, 1st ed.; Kole, C., Ed.; Springer: Berlin/Heidelberg, Germany, 2013; pp. 377–389. ISBN 978-3-642-37044-1. [Google Scholar]
- Chen, D.; Chen, H.W. Using the Köppen classification to quantify climate variation and change: An example for 1901–2010. Environ. Dev. 2013, 6, 69–79. [Google Scholar] [CrossRef]
- Peel, M.C.; Finlayson, B.L.; McMahon, T.A. Updated world map of the Köppen-Geiger climate classification. Hydrol. Earth Syst. Sci. 2007, 11, 1633–1644. [Google Scholar] [CrossRef]
- Western Regional Climate Center. Climate of Washington. Available online: https://wrcc.dri.edu/Climate/narrative_wa.php (accessed on 14 January 2025).
- PRISM Climate Group. 30-Year Normals Data [Dataset]; PRISM Climate Data: Corvallis, OR, USA, 2022; Available online: https://prism.oregonstate.edu (accessed on 14 January 2025).
- Wang, T.; Hamann, A.; Spittlehouse, D.; Carroll, C. Locally Downscaled and Spatially Customizable Climate Data for Historical and Future Periods for North America [Dataset]; Historical and Projected Climate Data for North America (ClimateNA): Alberta, CA, USA, 2016. [Google Scholar] [CrossRef]
- United States Census Bureau. Agriculture—Cereal Production in 1889: Illinois, Indiana, Oregon, Washington (No. 181). Available online: https://www2.census.gov/library/publications/decennial/1890/bulletins/agriculture/181-agriculture-cereal-production-in-1889-il-in-or-wa.pdf (accessed on 14 January 2025).
- United States Census Bureau. Acreage and Production of Barley, Buckwheat, Corn, Oats, Rye, and Wheat in 1899, by Counties. Available online: https://www2.census.gov/library/publications/decennial/1900/volume-6/volume-6-p3.pdf (accessed on 14 January 2025).
- United States Census Bureau. Agriculture—Washington. Available online: https://www2.census.gov/library/publications/decennial/1910/volume-7/volume-7-p8.pdf (accessed on 14 January 2025).
- United States Census Bureau. Bulletin—Agriculture: Washington, Statistics for the State and Its Counties. Available online: https://www2.census.gov/library/publications/decennial/1920/bulletins/agriculture/agriculture-wa.pdf (accessed on 14 January 2025).
- USDA National Agricultural Statistics Service. Value of Crops and Acreage and Production of Principal Crops. Available online: https://agcensus.library.cornell.edu/wp-content/uploads/1925-Washington-County_Tables-Table-04.pdf (accessed on 14 January 2025).
- USDA National Agricultural Statistics Service. Acreage and Quantity of Small Grains, Hay Crops, Sorghums, Corn, and Other Principal Field Crops, Harvested in 1934 and 1929. Available online: https://agcensus.library.cornell.edu/wp-content/uploads/1935-Washington-COUNTY_TABLES-1514-Table-03.pdf (accessed on 14 January 2025).
- USDA National Agricultural Statistics Service. Specified Crops Harvested: Censuses of 1945. Available online: https://agcensus.library.cornell.edu/wp-content/uploads/1945-Washington-COUNTY_TABLES-1171-Table-02.pdf (accessed on 14 January 2025).
- USDA National Agricultural Statistics Service. Specified Crops Harvested: Censuses of 1954. Available online: https://agcensus.library.cornell.edu/wp-content/uploads/1954-Washington-CHAPTER_B_-_STATISTICS_FOR_COUNTIES-1165-Table-09.pdf (accessed on 14 January 2025).
- USDA National Agricultural Statistics Service. Acreage, Quantity, and Sales of Crops Harvested: 1964. Available online: https://agcensus.library.cornell.edu/wp-content/uploads/1964-Washington-COUNTY_TABLES-809-Table-13.pdf (accessed on 14 January 2025).
- USDA National Agricultural Statistics Service. Corn, Sorghums, Wheat. Available online: https://agcensus.library.cornell.edu/wp-content/uploads/1969-Washington-Chapter_2._County_Summary_Data_For_Selected_Items_1969-483-Table-12.pdf (accessed on 14 January 2025).
- USDA National Agricultural Statistics Service. Grains—Corn, Sorghum, Wheat, and Other Small Grains: 1982. Available online: https://agcensus.library.cornell.edu/wp-content/uploads/1982-Washington-CHAPTER_2_County_Data-122-Table-24.pdf (accessed on 14 January 2025).
- USDA National Agricultural Statistics Service. Grains—Corn, Sorghum, Wheat, and Other Small Grains: 1992. Available online: https://agcensus.library.cornell.edu/wp-content/uploads/1992-Washington-CHAPTER_2_County_Data-1570-Table-26.pdf (accessed on 14 January 2025).
- USDA National Agricultural Statistics Service. Field Crops: Grains—Corn, Sorghum, Wheat, and Other Field Crops: 2002. Available online: https://agcensus.library.cornell.edu/wp-content/uploads/2002-Washington-CountyData-Table-24.pdf (accessed on 14 January 2025).
- USDA National Agricultural Statistics Service. Field Crops: 2012. Available online: https://agcensus.library.cornell.edu/wp-content/uploads/2012-Washington-st53_2_025_025.pdf (accessed on 14 January 2025).
- USDA National Agricultural Statistics Service. Field Crops: 2022. Available online: https://www.nass.usda.gov/Publications/AgCensus/2022/Full_Report/Volume_1,_Chapter_2_County_Level/Washington/st53_2_025_025.pdf (accessed on 14 January 2025).
- Kott, P. SAMPLING ERRORS—NECESSARY BUT CONTROLLABLE. Available online: https://www.nass.usda.gov/Education_and_Outreach/Understanding_Statistics/Statistical_Aspects_of_Surveys/sampling_errors.pdf (accessed on 14 January 2025).
- U.S. Geological Survey. USGS 1/3 Arc Second n49w121 (20220919) [Dataset]. 3D Elevation Program, VA, USA, 2022. Available online: https://www.sciencebase.gov/catalog/item/632a9a8ed34e71c6d67b9598 (accessed on 14 January 2025).
- U.S. Geological Survey. USGS 1/3 Arc Second n49w122 (20220919) [Dataset]. 3D Elevation Program, VA, USA, 2022. Available online: https://www.sciencebase.gov/catalog/item/640824fcd34e76f5f75e4051 (accessed on 14 January 2025).
- U.S. Geological Survey. USGS 1/3 arc-second n49w123 (1 x 1 degree) [Dataset]. 3D Elevation Program, VA, USA, 2022. Available online: https://www.sciencebase.gov/catalog/item/5f7784c682ce1d74e7d6ca60 (accessed on 14 January 2025).
- U.S. Geological Survey. USGS 1/3 arc-second n49w124 (1 x 1 degree) [Dataset]. 3D Elevation Program, VA, USA, 2022. Available online: https://www.sciencebase.gov/catalog/item/5f7783c282ce1d74e7d6c19a (accessed on 14 January 2025).
- Griffee, P. Triticum aestivum L. Available online: http://ecoport.org/perl/ecoport15.pl?searchType=entityDisplay&entityId=2114 (accessed on 14 January 2025).
- Porter, J.R.; Gawith, M. Temperatures and the growth and development of wheat: A review. Eur. J. Agron. 1999, 10, 23–36. [Google Scholar] [CrossRef]
- Sys, C.; Van Ranst, E.; Debaveye, J.; Beernaert, F. Land Evaluation Part III: Crop Requirements; Agricultural Publications n° 7, GADC: Brussels, BE, USA, 1993. [Google Scholar]
- USDA National Agricultural Statistics Service. Field Corn for Grain, Sorghums for Grain, Wheat for Grain. Available online: https://agcensus.library.cornell.edu/wp-content/uploads/1974-Washington-CHAPTER_2._County_Summary_Data-306-Table-18.pdf (accessed on 14 January 2025).
- Zabel, F.; Putzenlechner, B.; Mauser, W. Global Agricultural Land Resources–A High Resolution Suitability Evaluation and Its Perspectives until 2100 under Climate Change Conditions. PLoS ONE 2014, 9, e114980. [Google Scholar] [CrossRef]
- Flower, A. Salish Sea Bioregion Agricultural Areas Data [Dataset]; Salish Sea Atlas: Bellingham, WA, USA; Available online: https://wp.wwu.edu/salishseaatlas/data/ (accessed on 14 February 2025).
- Natural Resources Conservation Service Staff. Web Soil Survey [Database]; SSURGO: Washington, DC, USA, 2022. Available online: https://websoilsurvey.sc.egov.usda.gov/App/WebSoilSurvey.aspx (accessed on 25 November 2024).
- Havilah, E.J. Forages and pastures| Annual forage and pasture crops–establishment and management. In Encyclopedia of Dairy Sciences; Academic Press: Cambridge, MA, USA, 2011; pp. 563–575. [Google Scholar] [CrossRef]
- Lemus, R. Small Grain Cereals for Forage Production. Available online: https://extension.msstate.edu/sites/default/files/newsletter/forage-news/2017/2017_September.pdf (accessed on 14 January 2025).
- Parker, C.; Scott, S.; Geddes, A. Snowball Sampling; SAGE Publications Ltd.: London, UK, 2019. [Google Scholar] [CrossRef]
- Couzy, C.; Dockes, A.C. Are farmers businesspeople? Highlighting transformations in the profession of farmers in France. Int. J. Entrep. Small Bus. 2008, 6, 407–420. [Google Scholar] [CrossRef]
- Horseman, S.V.; Roe, E.J.; Huxley, J.N.; Bell, N.J.; Mason, C.S.; Whay, H.R. The use of in-depth interviews to understand the process of treating lame dairy cows from the farmers’ perspective. Anim. Welf. 2014, 23, 157–165. [Google Scholar] [CrossRef]
- Rev. About Rev. Available online: https://www.rev.com/about-rev?&gclid=Cj0KCQiAhbi8BhDIARIsAJLOludfJMWQmusvlCOqU8abrbwFcm5M3ozomI5BpLZ5ggNNNuHu04A-DWYaAnhCEALw_wcB&utm_source=google&utm_medium=cpc&utm_campaign=22017110835&utm_adgroup=&utm_term=&utm_content=&gad_source=1 (accessed on 14 January 2025).
- Basurto, X.; Speer, J. Structuring the calibration of qualitative data as sets for qualitative comparative analysis (QCA). Field Methods 2012, 24, 155–174. [Google Scholar] [CrossRef]
- Morse, W.C.; Lowery, D.R.; Steury, T. Exploring saturation of themes and spatial locations in qualitative public participation geographic information systems research. Soc. Nat. Resour. 2014, 27, 557–571. [Google Scholar] [CrossRef]
- Ranney, M.L.; Meisel, Z.F.; Choo, E.K.; Garro, A.C.; Sasson, C.; Morrow Guthrie, K. Interview-based qualitative research in emergency care part II: Data collection, analysis and results reporting. Acad. Emerg. Med. 2015, 22, 1103–1112. [Google Scholar] [CrossRef] [PubMed]

Disclaimer/Publisher’s Note: The statements, opinions and data contained in all publications are solely those of the individual author(s) and contributor(s) and not of MDPI and/or the editor(s). MDPI and/or the editor(s) disclaim responsibility for any injury to people or property resulting from any ideas, methods, instructions or products referred to in the content. |
© 2025 by the authors. Licensee MDPI, Basel, Switzerland. This article is an open access article distributed under the terms and conditions of the Creative Commons Attribution (CC BY) license (https://creativecommons.org/licenses/by/4.0/).