Abstract
Dengue is a serious infectious disease worldwide and a climate-sensitive disease. Thus, our goals were to (i) evaluate the relationship between dengue incidence and meteorological variables (rainfall and air temperature); (ii) identify the spatiotemporal pattern of dengue incidence in the municipalities of Mato Grosso from 2001 to 2020; and (iii) verify the spatial dependence of dengue incidence in the dry and wet seasons. We used dengue data from 2001 to 2020, monthly rainfall estimates from GPM, and daily air temperature estimates from ERA-5. The municipalities of the Mato Grosso state are included in 16 healthcare territories. The seasonal rainfall pattern indicates that the peak of the dengue endemic occurred in the wet season. However, drier and/or warmer places had a lower incidence of dengue in the dry season. Furthermore, a lagged effect of meteorological variables on dengue incidence has been identified, ranging from 0 to 7 months. Hotspot areas were identified which might have the potential for an intense spreading of dengue in Mato Grosso. They were mainly concentrated in the healthcare territory of Teles Pires (ID 14) in the dry season, while they were concentrated in the healthcare territories of Garças Araguaia (ID 5), Oeste (ID 11), and Teles Pires (ID 14) in the wet season. In addition, they are located in the Am climate and in the Amazon Forest and Brazilian savanna biomes, which have higher dengue incidence values. These results help to highlight which municipalities decision-makers must intervene in the public health system to prevent and control future epidemics.
1. Introduction
Dengue is one of the most notorious tropical diseases in the world, causing high mortality and morbidity [1]. It has become a growing problem as it spreads geographically and intensifies [2]. Dengue is caused by a virus of the Flaviviridae family, which includes Chikungunya, Yellow fever, and the Zika virus [3]. There are four different serotypes of the dengue virus (DENV 1–4) [4]. Infection by one serotype provides lifelong immunity against it, but only partial and temporary immunity against the other serotypes [5]. However, subsequent infections by different serotypes increase the risk of developing severe dengue [6]. Dengue is transmitted to humans only by female mosquitoes of the species Aedes aegypti in urban areas and Aedes albopictus in rural areas. These mosquitoes become infected when they feed on the blood of an infected person. Once infected, the mosquito can carry the virus for its entire adult life [7].
As an emerging infectious disease, dengue fever only prevailed in nine countries prior to 1970, but now it exists in more than 100 countries [1]. This increase in dengue incidence is attributed to four major factors: (1) extraordinary growth of the global population; (2) deficiency of an effective mosquito control program in dengue-endemic areas; (3) increased travel by airplanes; and (4) deterioration of public health infrastructures in underdeveloped countries over the last 30 years [3]. Its distribution is influenced by local variations such as demographics, social changes, the environment, and climate conditions over the last decade [8,9].
Approximately a third of the world’s population are living in dengue-endemic areas, and about half of the world’s population is now at risk, mostly in tropical and sub-tropical climates of urban and semi-urban areas in developing countries [1]. However, the transmission of dengue is essentially urban, and its occurrence depends on man, the virus, and the vector [10]. Currently, there are no effective antiviral drugs available for dengue infection [8]. Therefore, preventing and controlling dengue fever is mainly based on controlling the population from transmitting mosquitoes and includes improving sanitary conditions, public awareness campaigns, and the use of insecticides [11,12]. These measures are mainly related to controlling the reproduction of Aedes aegypti, which prefer concrete slabs and artificial water storage items to deposit their eggs and develop their larvae [13].
Mosquitoes prefer artificial water accumulation items for their re-production, so the seasonality of rainfall, air temperature, and humidity are the climatic factors that most directly and indirectly influence the ecology of dengue fever [5,11,14,15,16]. However, these relationships are not universal. Studies have shown that climate-dengue associations are region specific and may vary within a country/region or even within a state [14,17].
Previous studies in Brazil have shown that dengue cases follow a seasonal pattern with a higher incidence in months of higher rainfall and high temperatures, supporting the mosquitoes’ development and, consequently, the increase in dengue transmission [10,17,18,19,20,21]. On the other hand, the population density of this vector tends to reduce significantly during periods of lower rainfall and lower average temperatures [22], reducing the number of dengue cases. There are several climatic factors related to dengue epidemic outbreaks, however, this infectious disease is socially conditioned, since it is more likely to reach population groups with specific characteristics, notably those with low socioeconomic status [23].
The Mato Grosso state has three major ecosystems, the Amazon Forest, Brazilian savanna (Cerrado), and the Pantanal (wetland) which vary along climate gradients in space and time [24,25]. As much as the variability of biomes, socioeconomic conditions vary throughout the state depending on the developmental history of its different regions [26,27]: the region of the state capital was populated approximately 3 centuries ago; the northern region of the state (southern Amazon) was populated in the late 1970s; and in the southern region of the state, where the Pantanal is located, there are no urban centers, only small villages, due to the difficulty of accessing this region, especially during the flood season.
Health services in Mato Grosso were municipalized until 2011, resulting in diverse situations regarding service to the population due to different financial and organizational capabilities in the structure and service offering [28]. Since then, a Health Care Network has been created in healthcare territories in the state of Mato Grosso [29,30]. Therefore, public policies to control mosquito reproduction considering the seasonality of rainfall and air temperature and care for those infected with the dengue virus are quite different among the municipalities and healthcare territories in the state of Mato Grosso.
Although the interactions between climate and dengue incidence are relatively well-known, identifying spatiotemporal patterns of dengue incidence on a macro scale is essential for the prevention and control of dengue epidemics in the public health system of the state of Mato Grosso. Thus, the main objectives of this study were to (i) evaluate the relationship between dengue incidence and rainfall and air temperature, including their lags; (ii) identify the spatiotemporal pattern of dengue incidence in the municipalities of Mato Grosso from 2001 to 2020; and (iii) verify the spatial dependence of dengue incidence in dry and wet periods.
2. Material and Methods
2.1. Study Area
The State of Mato Grosso has 141 municipalities, 903,207,050 km2 of area, 3,567,234 inhabitants, and a population density of 3.36 inhabitants per km2 [31]. Mato Grosso has three of the five Brazilian biomes: the Brazilian savanna (Cerrado) in the Central region, the Amazon Forest in the North, and the Pantanal (floodable area) in the South of the state (Figure 1). Mato Grosso’s climate is Am (monsoons) in the Northwest and Aw (dry winter) in the South and East of the state, according to the Köppen classification [32], and its economy is based on agribusiness and the service sector [27].
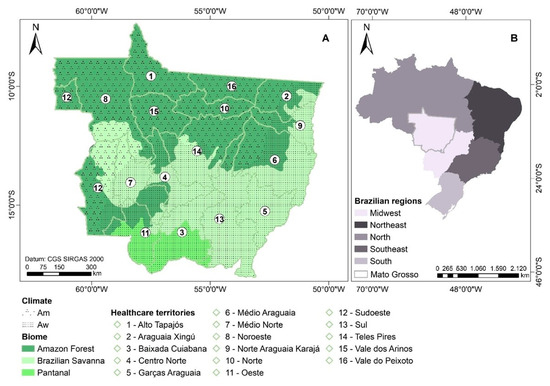
Figure 1.
Location of healthcare territories, biomes and climates, according to the Köppen classification, in the state of Mato Grosso (A), in the Central-West region of Brazil (B) [33].
2.2. Data Collection
Dengue data from 2001 to 2020 were obtained from the Notifiable Diseases Information System (SINAN) and the number of inhabitants of each municipality was obtained from the 2010 Census carried out by the Brazilian Institute of Geography and Statistics (IBGE). As the dengue database used does not have personal information available, there are no ethical issues involved. Monthly rainfall data from 2001 to 2020 of the Global Precipitation Measurement (GPM) version 6 algorithm were obtained on the Giovanni platform of the National Aeronautics and Space Administration (NASA), which was validated to the state of Mato Grosso [34]. We used the minimum, mean, and maximum air temperature data of ERA-5 produced by the Copernicus Climate Change Service (C3S) at the European Centre for Medium-Range Weather Forecasts (ECMWF). The political, financial, and logistical administration of health services in the municipalities of the state of Mato Grosso are concentrated in 16 healthcare territories (locally named as “regionais de saúde”) (Figure 1; Table S1) [30,35].
2.3. Statistical Analysis
The dengue incidence rate is the number of new dengue cases in the population during a specific period (such as one month) divided by the population at risk [36]. The population at risk was calculated by multiplying the number of dengue cases and the number of inhabitants of each municipality per month by 100 thousand inhabitants. The spatial distribution of the dengue incidence level in Mato Grosso was based on this scale: no cases (0); low incidence (up to 100); moderate incidence (100.01 to 300); high incidence (300.01 to 1000); and very high incidence (above 1000.01) [37]. We performed all the analysis and maps using the R statistics programming environment, version 4.2.3 [38].
The similarity between the meteorological variables (precipitation and air temperature) and the incidence of dengue as a function of the lag between them, was measured by the Cross Correlation Function (FCC) [39]. The CCF values range from −1 to 1, where values close to −1 indicate a strong negative linear correlation, values close to 1 indicate a strong positive linear correlation, and values close to zero indicate no significant correlation or no linear relationship between the two variables. The lag between the series was identified considering the meteorological variables (precipitation and air temperature) as the “x” variable and the incidence of dengue as the “y” variable. When x is ahead of y, it represents positive lags, and x behind y means negative lags. Therefore, when the incidence of dengue is behind the meteorological variables, there is a negative lag, and when the incidence of dengue is ahead of the meteorological variables, there is a positive lag. It is important to evaluate the delay time between meteorological variables (precipitation and air temperature) and the incidence of dengue because the dengue mosquito lives, on average, 30 days, and development from egg to adulthood takes 8 to 10 days [40].
The Mann–Whitney test was used to assess whether climate (Aw and Am) by season (wet and dry seasons) would cause significant (p-value < 0.05) differences in dengue incidence. The Kruskal–Wallis’s test was used to assess whether biome (Amazônia, Brazilian savanna, and Pantanal) by season (wet and dry seasons) would cause significant(p-value < 0.05) differences in dengue incidence. A t-test after the Mann–Whitney test and a multiple comparison test after the Kruskal–Wallis’s test indicated which groups were different from each other.
The spatial heterogeneity and clustering of dengue incidence by season were identified using the Moran scatterplot and the Local Moran’s Index. For this, we constructed a queen contiguity weight based on the neighborhood matrix. Then, the Moran’s I statistics were used as an indicator of global autocorrelation whose correlation coefficient indicated the relationship between a variable and its surrounding values [41,42]. Global Moran’s Index (I) was used to assess how much the observed value of a variable in a region is dependent on the values of that same attribute in the surrounding areas [41]. If I < 0, there is a negative autocorrelation with dissimilar values at neighboring locations (regular spatial distribution). If I = 0, there is an absence of a significant spatial autocorrelation (random spatial distribution). If I > 0, there is a positive autocorrelation with similar values at neighboring locations (aggregated spatial distribution).
The Moran dispersion diagram decomposes the nature of spatial autocorrelation into four quadrants and makes it possible to compare the Moran’s Index values of a municipality with those of an adjacent one: in the first quadrant (Q1), municipalities with high values are surrounded by neighbors with higher values (HH); in the second quadrant (Q2), municipalities with low values are surrounded by neighbors with low values (LL); in the third quadrant (Q3), municipalities with low values are surrounded by neighbors with high values (LH); and in the fourth quadrant (Q4), municipalities with high values are surrounded by neighbors with low values (HL). The Moran’s Index scatter diagrams in this study were replaced by Box Maps, where the relationship between each municipality and its neighbor was represented by a color.
The Global Moran’s I was decomposed into its components, based on the Local Moran’s I, which is a localized measure of autocorrelation, thus providing a significant statistic for each municipality and establishing a relationship between the local statistics and a corresponding global one [41]. This measure indicates the presence of outliers and zones of similarity and dissimilarity in nearby locations, therefore, it allows for explicit capture of spatial patterns [43]. A positive Local Moran’s I implies a cluster of municipalities with similar values around an individual municipality, while a negative Local Moran’s I implies a cluster of municipalities with different values and a high variability of neighboring municipalities around an individual municipality.
3. Results and Discussion
Mean annual rainfall was 1752 mm in Mato Grosso from 2001 to 2020 (Figure 2A). Dengue incidence had a cyclic pattern over the years. However, there was no significant trend toward an increase in the incidence of dengue in the study period, corroborating with [44] who also found a non-significant trend of dengue cases in Brazil from 1994 to 2014 in 23 states with positive trends, including Mato Grosso.
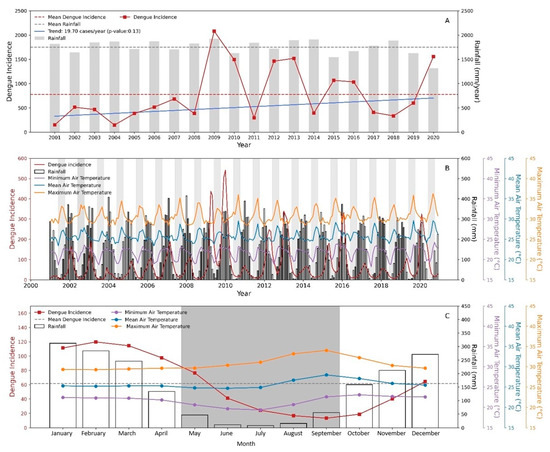
Figure 2.
Total rainfall and annual dengue incidence with Mann and Kendall trend (A); monthly dengue incidence, monthly rainfall, and monthly minimum, mean and maximum air temperatures (B); and monthly mean of dengue incidence, monthly rainfall, and monthly minimum, mean, and maximum air temperatures (C) in Mato Grosso from 2001 to 2020. Gray area represents the dry season in Mato Grosso.
The total annual dengue incidence from 2001 to 2008 was lower than the mean dengue incidence (774.9) during the study period. On the other hand, the highest annual values of dengue incidence occurred in 2009, 2010, 2012, 2013, 2015, 2016, and 2020. Therefore, it is also observed that the occurrence of dengue in the last decade had increasingly higher epidemic peaks and shorter interepidemic periods in Brazil [45].
The highest monthly values of dengue incidence occurred in the wet season in December/2019 (505.8) and January/2010 (514.2) and the lowest values occurred in the dry season (grey area) (Figure 2B). The dry season, characterized by total monthly rainfall < 100 mm [46], occurred from May to September in Mato Grosso (Figure 2C). The monthly mean values of dengue incidence (66.1) were higher than the mean incidence of dengue from June to November (28.1), while their values were lower than the mean dengue incidence from December to May (104.0) (Figure 2C).
The annual average (±95% CI) of the mean, minimum, and maximum air temperature was 25.7 ± 0.1 °C, 21.7 ± 0.2 °C, and 30.7 ± 0.2 °C, respectively. The seasonal average (±95% CI) of the mean, minimum, and maximum air temperature was 25.8 ± 0.3 °C, 20.6 ± 0.2 °C, and 31.7 ± 0.3 °C in the dry season. The seasonal average (±95% CI) of the mean, minimum, and maximum air temperature was 25.7 ± 0.1 °C, 22.5 ± 0.1 °C, and 30.0 ± 0.2 °C in the wet season. Dengue incidence peaked in February (123.2) while the mean air temperature peak (27.9) was in September, indicating the existence of a lag between them.
Air temperature was higher in September (Figure 2C) due to low air humidity [24,47], coinciding with the lower dengue incidence. Whereas temperature has a direct biophysical influence on viral replication and vector development and survival [44], rainfall’s influence on epidemic peaks is related to several aspects of mosquito biology such as eggs, larvae, and pupae mortality and oviposition rates [48]. Although optimal temperatures lead to higher mosquito densities and further breeding in subsequent generations [9], it is rainfall that provides essential habitats for the aquatic stages of the mosquito life cycle [16].
In the dry season, 35.5% of the municipalities had a low dengue incidence, 47.5% a moderate dengue incidence, and 17.0% a high dengue incidence (Figure 3A). The mean monthly rainfall during the dry season ranged from 13 mm to 44 mm, the mean minimum air temperature ranged from 16 °C to 23 °C, the mean air temperature ranged from 22 °C to 28 °C, and the mean maximum air temperature ranged from 27 °C to 34 °C in the dry season. Healthcare territories one and eight (North; humid and hot), seven and 12 (West; humid and cool), three, 11, and 13 (Southwest; humid and cool), five, six, and nine (East; dry and hot) and 10 (North; humid and hot) had the highest number of municipalities with a moderate incidence of dengue in the dry season. Healthcare territories four and 14 (Center; dry and fresh) had the highest number of municipalities with a high dengue incidence in the dry season. Drier and/or warmer places had a lower dengue incidence in the dry season due to water limitation by reducing essential habitats to the mosquito’s life cycle [16] and/or temperature limitation when reaching values greater than 28 °C [49].
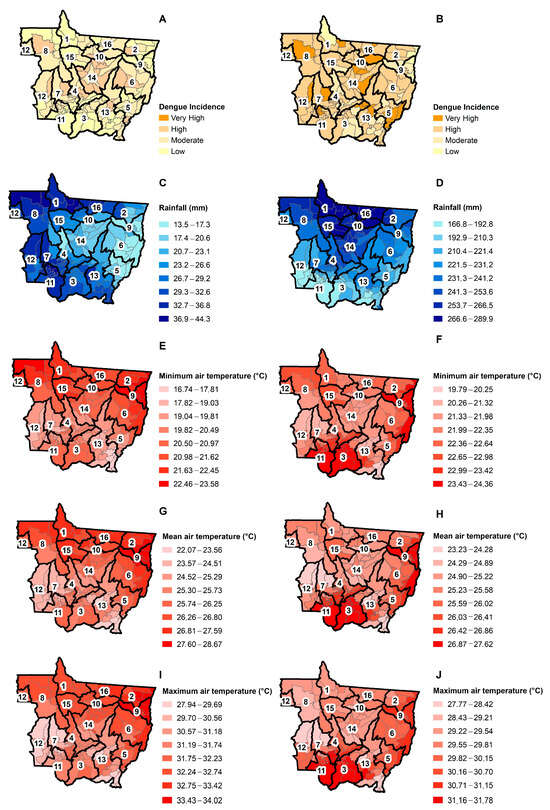
Figure 3.
Classification of dengue incidence in the dry (A) and wet (B) seasons; mean seasonal rainfall in the dry (C) and wet (D) seasons; the minimum air temperatures in the dry (E) and wet (F) seasons; the mean air temperatures in the dry (G) and wet (H) seasons; and the maximum air temperatures in the dry (I) and wet (J) seasons in the municipalities of Mato Grosso from 2001 to 2020.
In the wet season, 2.8% of the municipalities had a low dengue incidence, 15.6% a moderate dengue incidence, 68.8% a high dengue incidence, and 15.6% a very high dengue incidence (Figure 3B). The mean monthly rainfall ranged from 166 mm to 289 mm during the wet season, the mean minimum air temperature from 19 °C to 24 °C, the mean air temperature from 23 °C to 27 °C, and the mean maximum air temperature from 27 °C at 31 °C. Healthcare territories had the largest number of municipalities with a high incidence of dengue in the rainy season, except for healthcare territory five (East; dry and hot), which had the largest number of municipalities with a very high dengue incidence. However, healthcare territories one, two, and nine had some municipalities with a low incidence of dengue.
Out of the 141 municipalities in Mato Grosso, 78.7% of them had a high (0.70–0.89) positive correlation between dengue incidence and rainfall (Figure 4A); and 83.7%, 73.0%, and 90.1% of them had a moderate (0.40–0.69) positive correlation between dengue incidence and the mean, minimum, and maximum air temperature, respectively (Figure 4C,E,G). Considering the time lag, 35.5% of the municipalities had no time lag with a moderate-to-very strong positive correlation between dengue incidence and rainfall, meaning that the dengue incidence coincided with the rainfall peaks (Figure 4A,B). Moreover, 34.0% of the municipalities had a time lag of −1 month with a moderate-to-strong positive correlation between dengue incidence and rainfall in the dry season, meaning that the peak of dengue incidence occurred 1 month after the rainfall peak. It is important to note that some municipalities had time lags between dengue incidence and rainfall of 3 and 7 months. This shows that their mosquito control strategies by eliminating breeding sites were not effective.
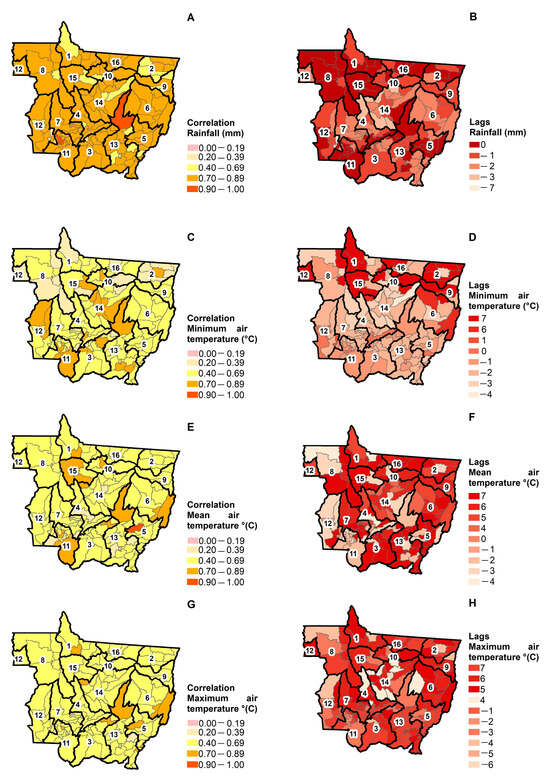
Figure 4.
Spatial distribution of the cross-correlation between dengue incidence and precipitation (A) and its lags (B); with the minimum temperature (C) and its lag (D); with the average air temperature (E) and its lag (F); and with the maximum air temperature (G) and its lag (H) in the municipalities of Mato Grosso from 2001 to 2020.
The seasonal rainfall pattern indicates that the peak of the dengue-endemic in Mato Grosso occurred in the wet season. Rainfall is essential for creating and maintaining breeding sites and has a strong influence on vector distributions [16]. Therefore, higher rainfall is associated with increased Aedes aegypti populations [50,51]. Rainfall generally increases the breeding sites for mosquitoes, which could lead to an increase in dengue incidence [5,16,48]. However, intense rainfall may also wash out breeding sites and thus have a negative effect on vector populations [16] and dengue transmission [49].
The time lag between dengue incidence and the mean, minimum, and maximum air temperature varied among the 141 municipalities of Mato Grosso. Of those 141 municipalities, 42.5% had a time lag of −2 months with a moderate-to-strong positive correlation between dengue incidence and minimum air temperature, meaning that the peak of dengue incidence occurred 2 months after the peak of minimum air temperature (Figure 4C,D). Moreover, 17.0% of the municipalities had a time lag of 7 months with a weak-to-moderate correlation between dengue incidence and minimum air temperature, meaning that the peak of minimum air temperature delayed the peak of dengue incidence by 7 months.
Out of the 141 municipalities of Mato Grosso, 38.3% of them had a time lag of 7 months with a moderate-to-very strong positive correlation between the dengue incidence and the mean air temperature, meaning that the peak of the mean air temperature delayed the peak of dengue incidence by 7 months (Figure 4E,F). Moreover, 18.4% of the municipalities had a time lag of 6 months with a moderate-to-very strong positive correlation between the dengue incidence and the mean air temperature.
Out of the 141 municipalities of Mato Grosso, 34.0% of them had a time lag of 6 months with a weak-to-strong positive correlation between dengue incidence and maximum air temperature, meaning that the peak of maximum air temperature delayed the peak of dengue incidence by 6 months (Figure 4G,H). In addition, 26.9% of the municipalities had a time lag of 7 months with a weak-to-strong positive correlation between dengue incidence and maximum air temperature.
Other studies have found a lagged effect of air temperature on dengue incidence [52,53]. However, the duration of the lag time varied widely from 0 to 8 months, with the most common duration being 1–2 months [54,55,56]. The lagged effects of air temperature on dengue lasted throughout the epidemic season, suggesting that air temperature had a cumulative effect on dengue fever in Mato Grosso [9]. The positive association between air temperature and dengue incidence implies that the increase in air temperature, which has been observed in the state of Mato Grosso [25,57], could increase the number of mosquito vectors. However, the positive correlation between air temperature and dengue incidence had a threshold at 28 °C for mean temperature, 23 °C for minimum temperature, and 32 °C for maximum temperature [49].
The dengue incidence in municipalities with Am climate was significantly higher in both the dry (206.18) and the wet (687.4) seasons than in municipalities with Aw climate in the dry (150.6) and wet (567.9) seasons, respectively. The dengue incidence in the Am climate region was higher than in the Aw climate region because the Am climate is wetter than the Aw climate region [32]. The same seasonal pattern was observed across the biomes, where the dengue incidence during the wet season in the Amazon, Cerrado, and Pantanal was significantly higher than during the dry season. The dengue incidence in the municipalities of the Amazon (182.2) and Cerrado (165.1) was significantly higher than in Pantanal (50.4) in the dry season, and the dengue incidence in the municipalities of the Amazon (649.1) and Cerrado (592.3) was significantly higher than in Pantanal (272.4) in the wet season. As previously mentioned, not only did the greater amount of rainfall influence the higher incidence of dengue in the Amazon region, but also the higher temperature in this region. Greater rainfall created more suitable spots for mosquitoes to lay their eggs and reproduce [48]. In addition, the higher air temperature ensured greater reproduction in subsequent generations [9,11].
The Moran’s Index of dengue incidence had a significant positive correlation in the dry season (I = 0.35; p-value < 0.001) (Figure 5A) and wet season (I = 0.29; p-value < 0.001) (Figure 5B), indicating the existence of spatial dependence with the occurrence of spatial clusters. Municipalities in red (HH) of healthcare territories 10, 13, and 14 had a higher mean dengue incidence with neighbors of similar values both in the dry and wet seasons (Figure 5A,B). Municipalities in yellow (LL) of healthcare territories one, two, three, eight, nine, 11, 12, 13, and 15 had a lower mean dengue incidence with neighbors of similar values both in the dry and wet seasons. Municipalities in red and yellow indicate municipalities with positive spatial autocorrelation, therefore, they present the same spatial dependence process as their neighbors.
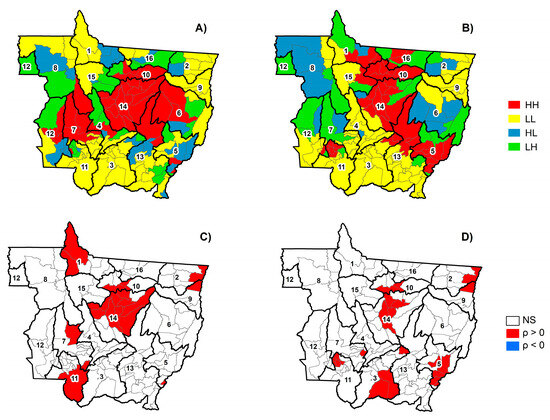
Figure 5.
Moran scatter diagram during the dry (A) and wet (B) seasons and Local Moran Index during the dry (C) and wet (D) seasons in the municipalities of Mato Grosso from 2001 to 2020. HH = high-high (red); LL = low-low (yellow); HL = high-low (blue); and LH = low-high (green). NS = no correlation; ρ > 0 = positive correlation; and ρ < 0 = negative correlation.
Municipalities in blue (HL) of healthcare territories one, two, six, and eight had a high mean dengue incidence in both the dry and wet seasons, surrounded by neighbors with a low mean dengue incidence, which indicates a tendency to decrease dengue incidence due to the influence of their neighbors in the future. On the other hand, municipalities in green (LH) in healthcare territories two, five, six, 12, and 16, both in the dry and rainy season, had a low mean dengue incidence surrounded by neighbors with a high mean dengue incidence, which indicates a tendency to increase dengue incidence due to the influence of their neighbors in the future. Therefore, municipalities in blue and green indicate transition regions, because they do not follow the same spatial dependence process as their neighbors for presenting negative spatial autocorrelation.
Three spatial clusters of low mean dengue incidence were formed in the dry season (Figure 5C). The first cluster was in Apiacás (ID 1) and Nova Bandeirantes (ID 1); the second, in Santa Terezinha (ID 2) and Luciara (ID 9); and the third, in Cáceres (ID 11) and Porto Estrela (ID 7). On the other hand, three local clusters with a high mean dengue incidence formed in Mato Grosso during the dry season. The first cluster was in Ribeirãozinho (ID 5); the second, in Campo Novo do Parecis (ID 7); and the third, in Itaúba (ID 10), Nova Santa Helena (ID 10), Itanhangá (ID 14), Tapurah (ID 14), Ipiranga do Norte (ID 14), Sorriso (ID 14), Sinop (ID 14), Vera (ID 14), Santa Carmen (ID 14), Cláudia (ID 14), Feliz Natal (ID 14), and Nova Ubiratã (ID 14).
Three spatial clusters of low mean dengue incidence formed in Mato Grosso during the wet season (Figure 5D). The first cluster was in Santa Terezinha (ID 2) and Luciara (ID 9); the second, in Santo Antônio do Leverger (ID 3) and Barão de Melgaço (ID 3); and the third, in Denise (ID 7). On the other hand, four local clusters with a high mean dengue incidence formed in Mato Grosso during the wet season. The first cluster was in Sorriso (ID 14), Sinop (ID 14), Vera (ID 14), Santa Carmen (ID 14), Itaúba (ID 10), and Nova Santa Helena (ID 10); the second, in Barra do Garças (ID 5), Ribeirãozinho (ID 5), Torixoréu (ID 5), and Pontal do Araguaia (ID 5); the third, in Araputanga (ID 11), Indiavaí (ID 11), Reserva do Cabaçal (ID 11), and Rio Branco (ID 11); and the fourth, in Planalto da Serra (ID 3). The relationships between the incidence of dengue fever, rainfall, and air temperature vary among the municipalities of Mato Grosso, and among different clusters of municipalities within a healthcare territory. This suggests that each municipality has different strategies or no effective strategy to control mosquitoes. The results of this study can help public authorities evaluate the effectiveness of the strategies used to eliminate mosquito breeding sites.
4. Conclusions
There was no significant trend of increasing or decreasing dengue incidence during the study period. The monthly dengue incidence was highest in the wet season (October-April) and lowest in the dry season (May-September), following the seasonal rainfall pattern in Mato Grosso. However, places that were drier and/or hotter had a lower dengue incidence in the dry period. Moreover, a lagged effect of precipitation and air temperature on dengue incidence was found, ranging from 0 to 7 months. This indicates that some municipalities did not have effective strategies to control the mosquito population, as there was dengue incidence in the dry period when there should not be any water accumulation.
Areas with a high dengue incidence (hotspots) were identified that had the potential for intense dengue transmission in Mato Grosso. The hotspots were concentrated in the Teles Pires healthcare territory (ID 14) in the dry season, and in the Garças Araguaia (ID 5), Oeste (ID 11), and Teles Pires (ID 14) healthcare territories in the wet season. The dengue incidence in these locations had a moderate-to-high positive correlation with precipitation and air temperature. Furthermore, the highest dengue incidence occurred in the Am climate and in the Amazon Forest and Brazilian Cerrado biomes. These results can help municipal managers evaluate the effectiveness of their strategies to eliminate mosquito breeding sites and prevent future epidemics.
This study describes the spatiotemporal relationship between meteorological variables, precipitation and air temperature, and dengue incidence in Mato Grosso. However, the study area does not reflect the climatic and environmental diversity and the dengue incidence in tropical areas such as Brazil, which has a large continental area. Therefore, it is important that future research extend the study area and assess different future scenarios of dengue incidence, since the climate-dengue association is specific to each region. Dengue prevention and control programs developed by the public health system should select meteorological variables that are easy to obtain on a large scale, such as precipitation and air temperature.
Supplementary Materials
The following supporting information can be downloaded at: https://www.mdpi.com/article/10.3390/geographies3040035/s1, Table S1. Healthcare territories in Mato Grosso state, Brazil.
Author Contributions
Conceptualization, N.G.M., M.S.B. and N.L.N.; methodology, N.L.N., M.S.B., N.G.M., J.B.d.S.L. and L.O.F.d.S.; software, N.L.N. and L.O.F.d.S.; formal analysis, L.O.F.d.S., N.L.N., M.S.B. and N.G.M.; investigation, N.L.N., M.S.B., N.G.M., J.B.d.S.L. and L.O.F.d.S.; resources, N.G.M. and M.S.B.; data curation, N.L.N. and L.O.F.d.S.; writing—original draft preparation, N.L.N. and N.G.M.; writing—review and editing, N.L.N., M.S.B., N.G.M., J.B.d.S.L. and L.O.F.d.S.; visualization, M.S.B. and N.G.M.; supervision, N.G.M. and M.S.B.; project administration, N.G.M. and M.S.B.; funding acquisition, N.G.M. and M.S.B. All authors have read and agreed to the published version of the manuscript.
Funding
This research was partially funded by the Instituto Federal de Mato Grosso (IFMT), the Universidade Federal de Mato Grosso (UFMT), the Programa de Pós-Graduação em Física Ambiental (PPGFA/IF/UFMT), the Coordenação de Aperfeiçoamento de Pessoal de Nível Superior (CAPES), and the Conselho Nacional de Desenvolvimento Científico e Tecnológico (CNPq), code #311541/2021-6 and #311907/2021-0.
Data Availability Statement
All data used in this work are available in the Notifiable Diseases Information System (SINAN, https://portalsinan.saude.gov.br/dengue; accessed on 15 April 2022), the Brazilian Institute for Geography and Statistics (IBGE; https://censo2010.ibge.gov.br/; accessed on 15 April 2022) and the Giovanni platform of the National Aeronautics and Space Administration (NASA; https://giovanni.gsfc.nasa.gov/giovanni/; accessed on 15 April 2022).
Acknowledgments
The authors would like to thank the Sistema de Informação de Agravos de Notificação (SINAN), the Instituto Brasileiro de Geografia e Estatística (IBGE), and the National Aeronautics and Space Administration (NASA) for providing data to this research.
Conflicts of Interest
The authors declare no conflict of interest.
References
- WHO Dengue and Severe Dengue. Available online: https://www.who.int/news-room/fact-sheets/detail/dengue-and-severe-dengue (accessed on 5 November 2021).
- Brady, O.J.; Gething, P.W.; Bhatt, S.; Messina, J.P.; Brownstein, J.S.; Hoen, A.G.; Moyes, C.L.; Farlow, A.W.; Scott, T.W.; Hay, S.I. Refining the Global Spatial Limits of Dengue Virus Transmission by Evidence-Based Consensus. PLoS Neglected Trop. Dis. 2012, 6, e1760. [Google Scholar] [CrossRef] [PubMed]
- Saeed, O.; Asif, A. Chapter 2—Dengue Virus Disease; the Origins. In Dengue Virus Disease; Qureshi, A.I., Saeed, O., Eds.; Academic Press: Cambridge, MA, USA, 2020; pp. 9–16. ISBN 978-0-12-818270-3. [Google Scholar]
- Li, C.; Lu, Y.; Liu, J.; Wu, X. Climate Change and Dengue Fever Transmission in China: Evidences and Challenges. Sci. Total Environ. 2018, 622–623, 493–501. [Google Scholar] [CrossRef]
- Polwiang, S. The Time Series Seasonal Patterns of Dengue Fever and Associated Weather Variables in Bangkok (2003–2017). BMC Infect. Dis. 2020, 20, 208. [Google Scholar] [CrossRef] [PubMed]
- Rathore, A.P.; Farouk, F.S.; St. John, A.L. Risk Factors and Biomarkers of Severe Dengue. Curr. Opin. Virol. 2020, 43, 1–8. [Google Scholar] [CrossRef] [PubMed]
- Bhatt, S.; Gething, P.W.; Brady, O.J.; Messina, J.P.; Farlow, A.W.; Moyes, C.L.; Drake, J.M.; Brownstein, J.S.; Hoen, A.G.; Sankoh, O.; et al. The Global Distribution and Burden of Dengue. Nature 2013, 496, 504–507. [Google Scholar] [CrossRef] [PubMed]
- Cucunawangsih, N.; Lugito, N.P.H. Trends of Dengue Disease Epidemiology. Virology 2017, 8, 1178122X17695836. [Google Scholar] [CrossRef]
- Xiang, J.; Hansen, A.; Liu, Q.; Liu, X.; Tong, M.X.; Sun, Y.; Cameron, S.; Hanson-Easey, S.; Han, G.-S.; Williams, C.; et al. Association between Dengue Fever Incidence and Meteorological Factors in Guangzhou, China, 2005–2014. Environ. Res. 2017, 153, 17–26. [Google Scholar] [CrossRef]
- Xavier, L.L.; Honório, N.A.; Pessanha, J.F.M.; Peiter, P.C. Analysis of Climate Factors and Dengue Incidence in the Metropolitan Region of Rio de Janeiro, Brazil. PLoS ONE 2021, 16, e0251403. [Google Scholar] [CrossRef]
- Li, Y.; Dou, Q.; Lu, Y.; Xiang, H.; Yu, X.; Liu, S. Effects of Ambient Temperature and Precipitation on the Risk of Dengue Fever: A Systematic Review and Updated Meta-Analysis. Environ. Res. 2020, 191, 110043. [Google Scholar] [CrossRef]
- Maciel-de-Freitas, R.; Avendanho, F.C.; Santos, R.; Sylvestre, G.; Araújo, S.C.; Lima, J.B.P.; Martins, A.J.; Coelho, G.E.; Valle, D. Undesirable Consequences of Insecticide Resistance Following Aedes Aegypti Control Activities Due to a Dengue Outbreak. PLoS ONE 2014, 9, e92424. [Google Scholar] [CrossRef]
- Dalpadado, R.; Amarasinghe, D.; Gunathilaka, N. Water Quality Characteristics of Breeding Habitats in Relation to the Density of Aedes Aegypti and Aedes Albopictus in Domestic Settings in Gampaha District of Sri Lanka. Acta Trop. 2022, 229, 106339. [Google Scholar] [CrossRef] [PubMed]
- Cheng, Y.-C.; Lee, F.-J.; Hsu, Y.-T.; Slud, E.V.; Hsiung, C.A.; Chen, C.-H.; Liao, C.-L.; Wen, T.-H.; Chang, C.-W.; Chang, J.-H.; et al. Real-Time Dengue Forecast for Outbreak Alerts in Southern Taiwan. PLoS Neglected Trop. Dis. 2020, 14, e0008434. [Google Scholar] [CrossRef] [PubMed]
- Xu, L.; Stige, L.C.; Chan, K.-S.; Zhou, J.; Yang, J.; Sang, S.; Wang, M.; Yang, Z.; Yan, Z.; Jiang, T.; et al. Climate Variation Drives Dengue Dynamics. Proc. Natl. Acad. Sci. USA 2017, 114, 113–118. [Google Scholar] [CrossRef] [PubMed]
- Morin, C.W.; Comrie, A.C.; Ernst, K. Climate and Dengue Transmission: Evidence and Implications. Environ. Health Perspect. 2013, 121, 1264–1272. [Google Scholar] [CrossRef]
- Alves, L.D.; Lana, R.M.; Coelho, F.C. A Framework for Weather-Driven Dengue Virus Transmission Dynamics in Different Brazilian Regions. Int. J. Environ. Res. Public Health 2021, 18, 9493. [Google Scholar] [CrossRef] [PubMed]
- Castro, L.A.; Generous, N.; Luo, W.; Piontti, A.P.Y.; Martinez, K.; Gomes, M.F.C.; Osthus, D.; Fairchild, G.; Ziemann, A.; Vespignani, A.; et al. Using Heterogeneous Data to Identify Signatures of Dengue Outbreaks at Fine Spatio-Temporal Scales across Brazil. PLoS Neglected Trop. Dis. 2021, 15, e0009392. [Google Scholar] [CrossRef]
- Correia Filho, W.L.F. Influence of Meteorological Variables on Dengue Incidence in the Municipality of Arapiraca, Alagoas, Brazil. Rev. Soc. Bras. Med. Trop. 2017, 50, 309–314. [Google Scholar] [CrossRef]
- McGough, S.F.; Clemente, L.; Kutz, J.N.; Santillana, M. A Dynamic, Ensemble Learning Approach to Forecast Dengue Fever Epidemic Years in Brazil Using Weather and Population Susceptibility Cycles. J. R. Soc. Interface 2021, 18, 20201006. [Google Scholar] [CrossRef]
- Viana, D.V.; Ignotti, E. The Ocurrence of Dengue and Weather Changes in Brazil: A Systematic Review. Rev. Bras. Epidemiol. 2013, 16, 240–256. [Google Scholar] [CrossRef]
- Gomes, A.F.; Nobre, A.A.; Cruz, O.G. Temporal Analysis of the Relationship between Dengue and Meteorological Variables in the City of Rio de Janeiro, Brazil, 2001–2009. Cad. Saúde Pública 2012, 28, 2189–2197. [Google Scholar] [CrossRef]
- Johansen, I.C.; do Carmo, R.L.; Correia Alves, L.; Bueno, M.D.C.D. Environmental and Demographic Determinants of Dengue Incidence in Brazil. Rev. Salud Pública 2018, 20, 346–351. [Google Scholar] [CrossRef] [PubMed]
- Biudes, M.S.; Vourlitis, G.L.; Machado, N.G.; Arruda, P.H.Z.; Neves, G.A.R.; Lobo, F.A.; Neale, C.M.U.; Nogueira, J.S. Patterns of energy exchange for tropical ecosystems across a climate gradient in Mato Grosso, Brazil. Agric. For. Meteorol. 2015, 202, 112–124. [Google Scholar] [CrossRef]
- Biudes, M.S.; Geli, H.M.E.; Vourlitis, G.L.; Machado, N.G.; Pavão, V.M.; dos Santos, L.O.F.; Querino, C.A.S. Evapotranspiration Seasonality over Tropical Ecosystems in Mato Grosso, Brazil. Remote Sens. 2022, 14, 2482. [Google Scholar] [CrossRef]
- Toloi, M.N.V.; Toloi, R.C.; Bonilla, S.H.; Silva, H.R.O.; Reiner, J.N. Influence of the agricultural sector on the economic and social development of the municipalities of the state of Mato Grosso/Brazil. Rev. Agrar. 2019, 12, 237–247. [Google Scholar] [CrossRef]
- Machado, N.G.; dos Santos, G.T.; Biudes, M.S.; da Silva, J.L.; Bacarji, A.G.; da Costa, M.E.L.; Bilio, R.D.S. Sustainable development index of municipalities in Mato Grosso. Rev. Bras. Gestão E Desenvolv. Reg. 2020, 16, 222–234. [Google Scholar]
- de Lima, L.D.; de Albuquerque, M.V.; Scatena, J.H.G.; de Melo, E.C.P.; de Oliveira, E.X.G.; Carvalho, M.S.; Pereira, A.M.M.; de Oliveira, R.A.D.; Martinelli, N.L.; de Oliveira, C.F. Arranjos regionais de governança do Sistema Único de Saúde: Diversidade de prestadores e desigualdade espacial na provisão de serviços. Cad. Saúde Pública 2019, 35, e00094618. [Google Scholar] [CrossRef]
- Martinelli, N.L.; Costa, A.A.S.; Scatena, J.H.G.; Soares, N.R.F.; Charbel, S.C.; Castro, M.D.L.; Spinelli, M.A.D.S.; Mota, V.D.A.; Silva, L.M.D.Á. Regionalização e Rede de Atenção à Saúde em Mato Grosso. Saude Soc. 2022, 31, e210195pt. [Google Scholar] [CrossRef]
- dos Santos, A.M.; Giovanella, L. Regional Governance: Strategies and Disputes in Health Region Management. Rev. Saúde Pública 2014, 48, 622–631. [Google Scholar] [CrossRef]
- IBGE Mato Grosso|Cidades e Estados|IBGE. Available online: https://www.ibge.gov.br/cidades-e-estados/mt.html (accessed on 6 November 2021).
- Alvares, C.A.; Stape, J.L.; Sentelhas, P.C.; De Moraes Gonçalves, J.L.; Sparovek, G. Köppen’s Climate Classification Map for Brazil. Meteorol. Z. 2013, 22, 711–728. [Google Scholar] [CrossRef] [PubMed]
- Tasca, B.F.D.C. Time Space Analysis of Morbidities Due to Respiratory Diseases and Their Relationship with Meteorological Variables. Master´s Thesis, Universidade Federal de Mato Grosso, Cuiabá, Brazil, 2023. [Google Scholar]
- Junior, A.L.P.; Biudes, M.S.; Machado, N.G.; Vourlitis, G.L.; Geli, H.M.E.; dos Santos, L.O.F.; Querino, C.A.S.; Ivo, I.O.; Neto, N.L. Assessment of Remote Sensing and Re-Analysis Estimates of Regional Precipitation over Mato Grosso, Brazil. Water 2021, 13, 333. [Google Scholar] [CrossRef]
- SES-MT, M.G. Plano Estadual de Saúde—PES, de Saúde—PES. MT 2016–2019; Secretaria de Estado de Saúde de Mato Grosso: Cuiabá, Brazil, 2017; p. 129.
- Spronk, I.; Korevaar, J.C.; Poos, R.; Davids, R.; Hilderink, H.; Schellevis, F.G.; Verheij, R.A.; Nielen, M.M.J. Calculating Incidence Rates and Prevalence Proportions: Not as Simple as It Seems. BMC Public Health 2019, 19, 512. [Google Scholar] [CrossRef] [PubMed]
- de Siqueira, R.V.; Martins, P.T.D.A. Casos de dengue em Planaltina-DF: Análise espacial e fatores socioambientais em um ano epidêmico/Cases of dengue in Planaltina-DF: Spatial analysis and socio-environmental factors in an epidemic year. Cad. Geogr. 2019, 29, 705–725. [Google Scholar] [CrossRef]
- Core Team R: A Language and Environment for Statistical Computing. Available online: https://www.r-project.org/ (accessed on 2 March 2023).
- Nuraini, N.; Fauzi, I.S.; Fakhruddin, M.; Sopaheluwakan, A.; Soewono, E. Climate-Based Dengue Model in Semarang, Indonesia: Predictions and Descriptive Analysis. Infect. Dis. Model. 2021, 6, 598–611. [Google Scholar] [CrossRef] [PubMed]
- Weber, A.A.; Wollmann, C.A. A influência climática na proliferação do mosquito aedes aegypti em Santa Maria—RS, em 2012. CeN 2016, 38, 1246. [Google Scholar] [CrossRef]
- Anselin, L. Local Indicators of Spatial Association—LISA. Geogr. Anal. 1995, 27, 93–115. [Google Scholar] [CrossRef]
- Anselin, L.; Rey, S.J. Perspectives on Spatial Data Analysis. In Perspectives on Spatial Data Analysis; Anselin, L., Rey, S.J., Eds.; Advances in Spatial Science; Springer: Berlin/Heidelberg, Germany, 2010; pp. 1–20. ISBN 978-3-642-01976-0. [Google Scholar]
- Kowe, P.; Mutanga, O.; Odindi, J.; Dube, T. A Quantitative Framework for Analysing Long Term Spatial Clustering and Vegetation Fragmentation in an Urban Landscape Using Multi-Temporal Landsat Data. Int. J. Appl. Earth Obs. Geoinf. 2020, 88, 102057. [Google Scholar] [CrossRef]
- de Oliveira-Júnior, J.F.; Gois, G.; da Silva, E.B.; Teodoro, P.E.; Johann, J.A.; Junior, C.A.S. Non-Parametric Tests and Multivariate Analysis Applied to Reported Dengue Cases in Brazil. Environ. Monit. Assess. 2019, 191, 473. [Google Scholar] [CrossRef]
- Andrioli, D.C.; Busato, M.A.; Lutinski, J.A. Spatial and Temporal Distribution of Dengue in Brazil, 1990–2017. PLoS ONE 2020, 15, e0228346. [Google Scholar] [CrossRef]
- Hutyra, L.R.; Munger, J.W.; Saleska, S.R.; Gottlieb, E.; Daube, B.C.; Dunn, A.L.; Amaral, D.F.; Camargo, P.B.; Wofsy, S.C. Seasonal Controls on the Exchange of Carbon and Water in an Amazonian Rain Forest. J. Geophys. Res. Biogeosci. 2007, 112, 112. [Google Scholar] [CrossRef]
- Machado, N.G.; Biudes, M.S.; Querino, C.A.S.; Danelichen, V.H.D.M.; Velasque, M.C.S. Seasonal and Interannual Pattern of Meteorological Variables in Cuiabá, Mato Grosso State, Brazil. Rev. Bras. Geofis. 2015, 33, 477–488. [Google Scholar] [CrossRef]
- Dieng, H.; Rahman, G.M.S.; Hassan, A.A.; Che Salmah, M.R.; Satho, T.; Miake, F.; Boots, M.; Sazaly, A. The Effects of Simulated Rainfall on Immature Population Dynamics of Aedes Albopictus and Female Oviposition. Int. J. Biometeorol. 2012, 56, 113–120. [Google Scholar] [CrossRef] [PubMed]
- Wu, X.; Lang, L.; Ma, W.; Song, T.; Kang, M.; He, J.; Zhang, Y.; Lu, L.; Lin, H.; Ling, L. Non-Linear Effects of Mean Temperature and Relative Humidity on Dengue Incidence in Guangzhou, China. Sci. Total Environ. 2018, 628–629, 766–771. [Google Scholar] [CrossRef] [PubMed]
- Goellner, E.; Neckel, A.; Bodah, B.W.; Maculan, L.S.; de Almeida Silva, C.C.O.; Piccinato, D.; Grub, J.; Cambrussi, L.P.; Korcelski, C.; Oliveira, M.L.S. Geospatial Analysis of Ae. Aegypti Foci in Southern Brazil. J. Environ. Chem. Eng. 2021, 9, 106645. [Google Scholar] [CrossRef]
- Whitmire, R.E.; Burke, D.S.; Nisalak, A.; Harrison, B.A.; Watts, D.M. Effect of Temperature on the Vector Efficiency of Aedes Aegypti for Dengue 2 Virus. Am. J. Trop. Med. Hyg. 1987, 36, 143–152. [Google Scholar] [CrossRef]
- Fan, J.; Wei, W.; Bai, Z.; Fan, C.; Li, S.; Liu, Q.; Yang, K. A Systematic Review and Meta-Analysis of Dengue Risk with Temperature Change. Int. J. Environ. Res. Public Health 2015, 12, 1–15. [Google Scholar] [CrossRef] [PubMed]
- Imai, C.; Hashizume, M. Systematic Review on Methodology: Time Series Regression Analysis for Environmental Factors and Infectious Diseases. Trop. Med. Health 2014, 43, 1–9. [Google Scholar] [CrossRef] [PubMed]
- Sang, S.; Gu, S.; Bi, P.; Yang, W.; Yang, Z.; Xu, L.; Yang, J.; Liu, X.; Jiang, T.; Wu, H.; et al. Predicting Unprecedented Dengue Outbreak Using Imported Cases and Climatic Factors in Guangzhou, 2014. PLoS Neglected Trop. Dis. 2015, 9, e0003808. [Google Scholar] [CrossRef]
- Vu, H.H.; Okumura, J.; Hashizume, M.; Tran, D.N.; Yamamoto, T. Regional Differences in the Growing Incidence of Dengue Fever in Vietnam Explained by Weather Variability. Trop. Med. Health 2014, 42, 25–33. [Google Scholar] [CrossRef]
- Wang, C.; Jiang, B.; Fan, J.; Wang, F.; Liu, Q. A Study of the Dengue Epidemic and Meteorological Factors in Guangzhou, China, by Using a Zero-Inflated Poisson Regression Model. Asia Pac. J. Public Health 2014, 26, 48–57. [Google Scholar] [CrossRef]
- dos Santos, L.O.F.; Machado, N.G.; Biudes, M.S.; Geli, H.M.E.; Querino, C.A.S.; Ruhoff, A.L.; Ivo, I.O.; Lotufo Neto, N. Trends in Precipitation and Air Temperature Extremes and Their Relationship with Sea Surface Temperature in the Brazilian Midwest. Atmosphere 2023, 14, 426. [Google Scholar] [CrossRef]
Disclaimer/Publisher’s Note: The statements, opinions and data contained in all publications are solely those of the individual author(s) and contributor(s) and not of MDPI and/or the editor(s). MDPI and/or the editor(s) disclaim responsibility for any injury to people or property resulting from any ideas, methods, instructions or products referred to in the content. |
© 2023 by the authors. Licensee MDPI, Basel, Switzerland. This article is an open access article distributed under the terms and conditions of the Creative Commons Attribution (CC BY) license (https://creativecommons.org/licenses/by/4.0/).