Spatiotemporal Analysis of XCO2 and Its Relationship to Urban and Green Areas of China’s Major Southern Cities from Remote Sensing and WRF-Chem Modeling Data from 2010 to 2019
Abstract
1. Introduction
2. Materials and Methods
2.1. Study Area
2.2. Data
2.2.1. XCO2 Data from Satellite Observation
2.2.2. Input Data for WRF-Chem
2.2.3. XCO2 Data of Ground Observation
2.2.4. Landcover Dataset (CLCD)
2.3. Methods
2.3.1. ARIMA Time Series
2.3.2. Void Filling Workflow
2.3.3. Geo-Statistical Analysis Methods
2.3.4. Correlation Analysis
2.3.5. Statistical Evaluation Indicators
3. Results
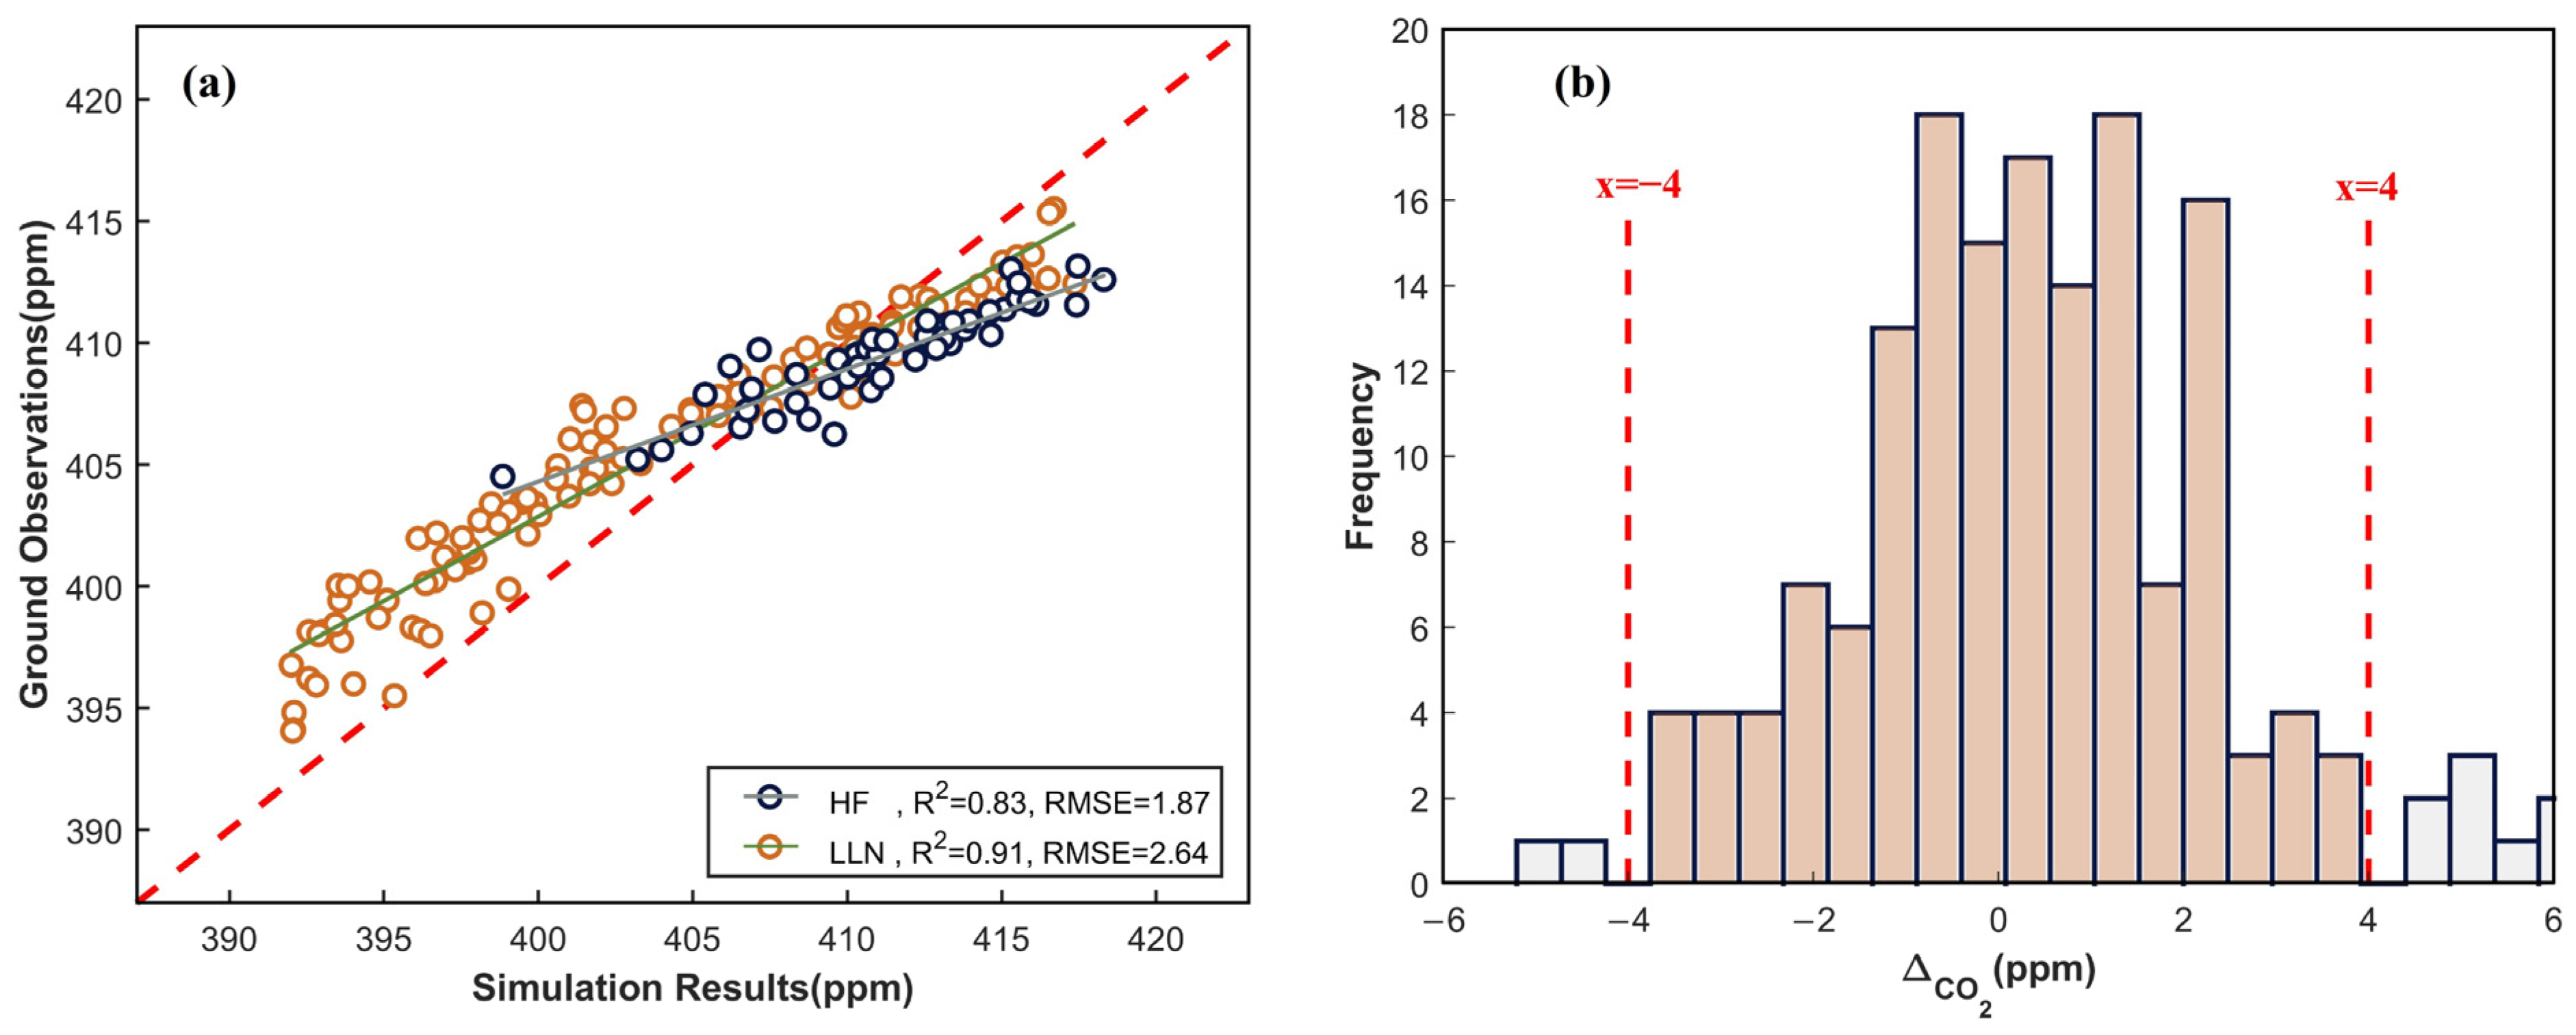
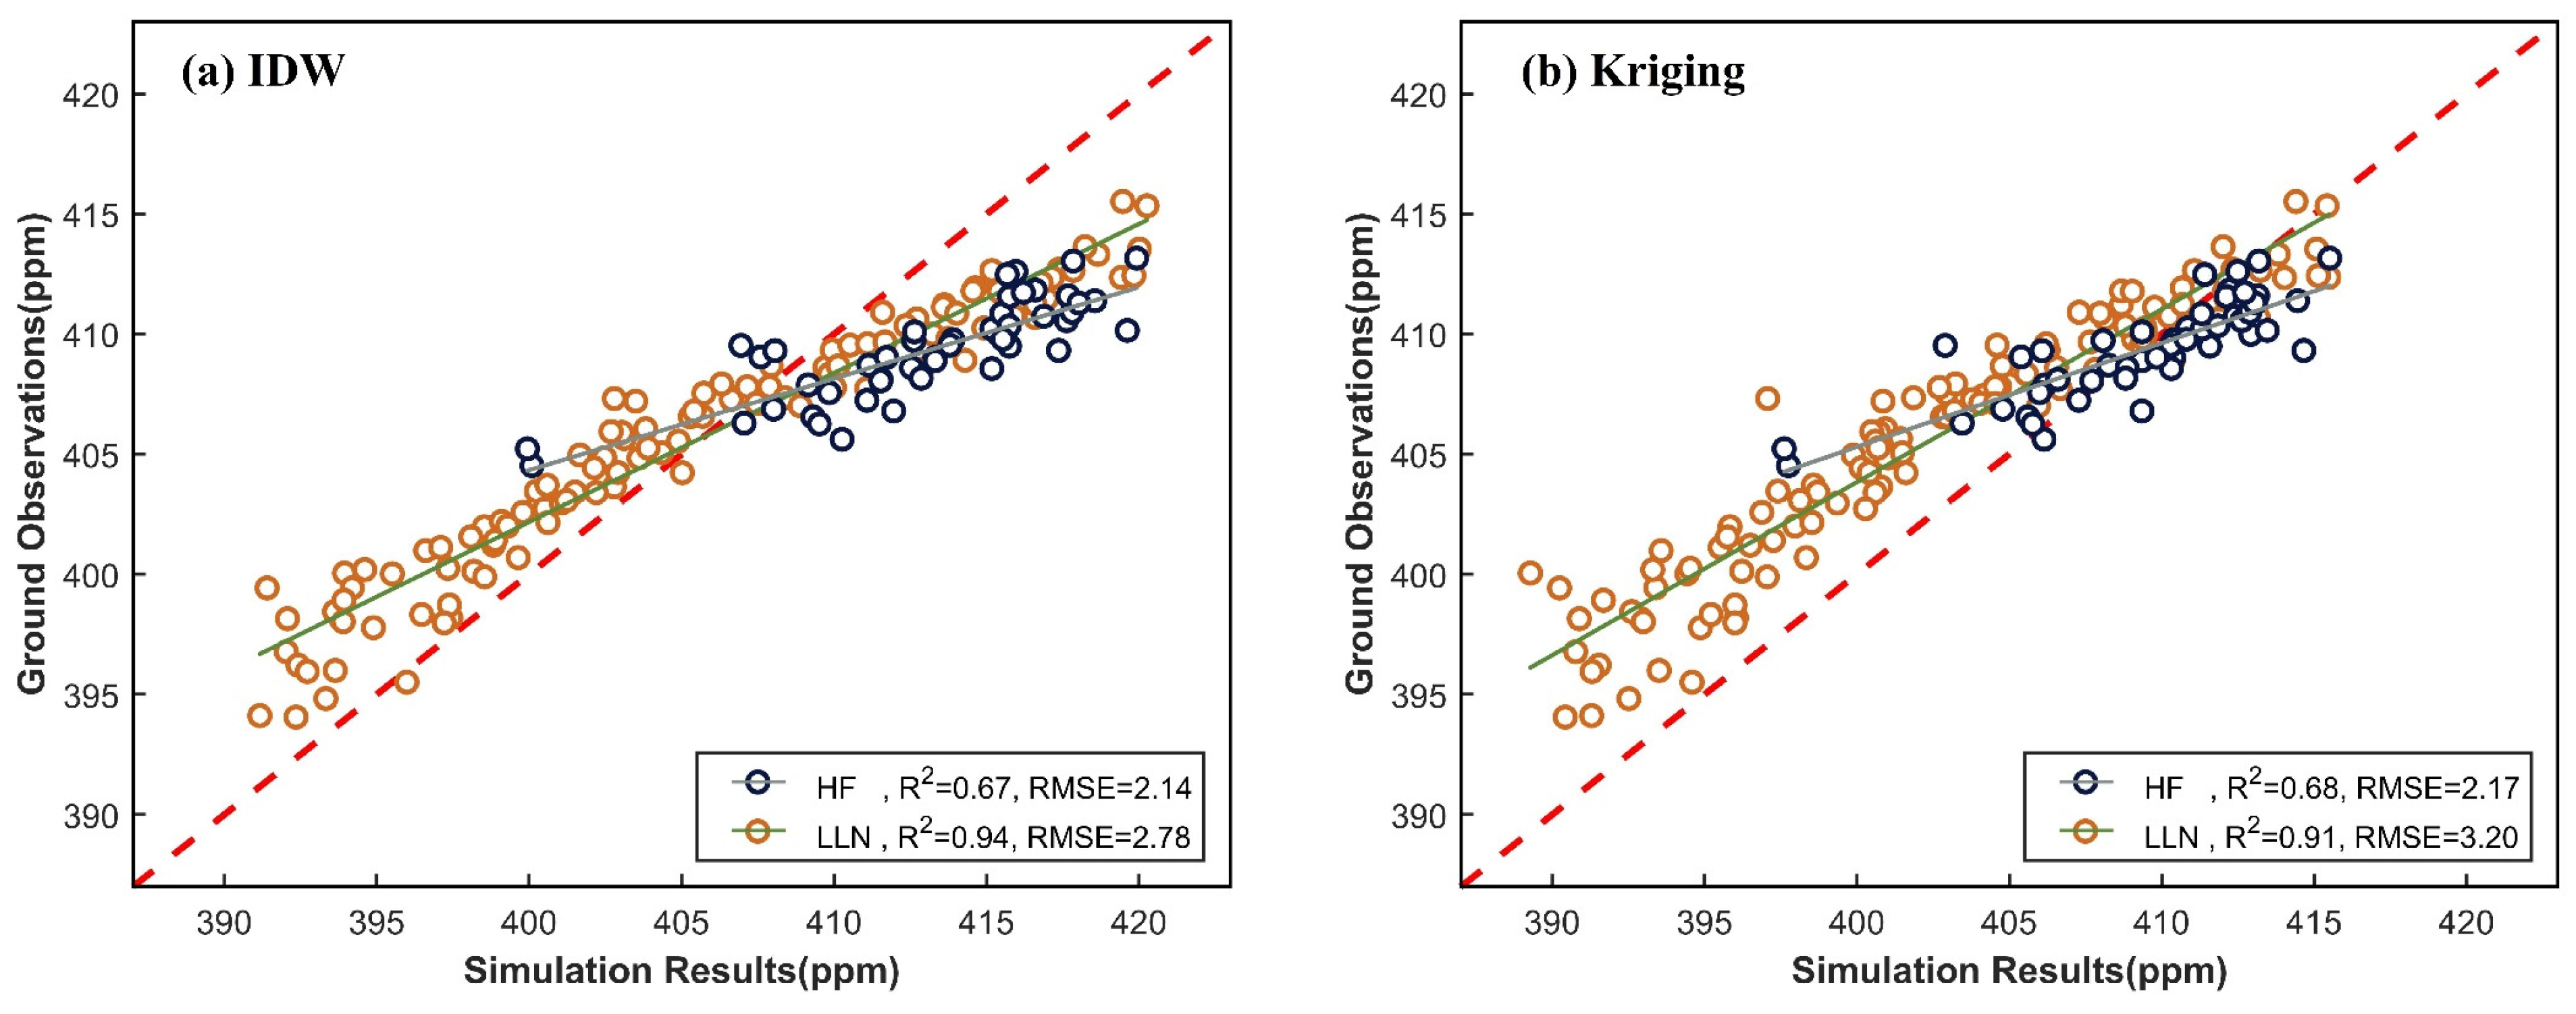
3.1. Ground Validation of Simulation Results
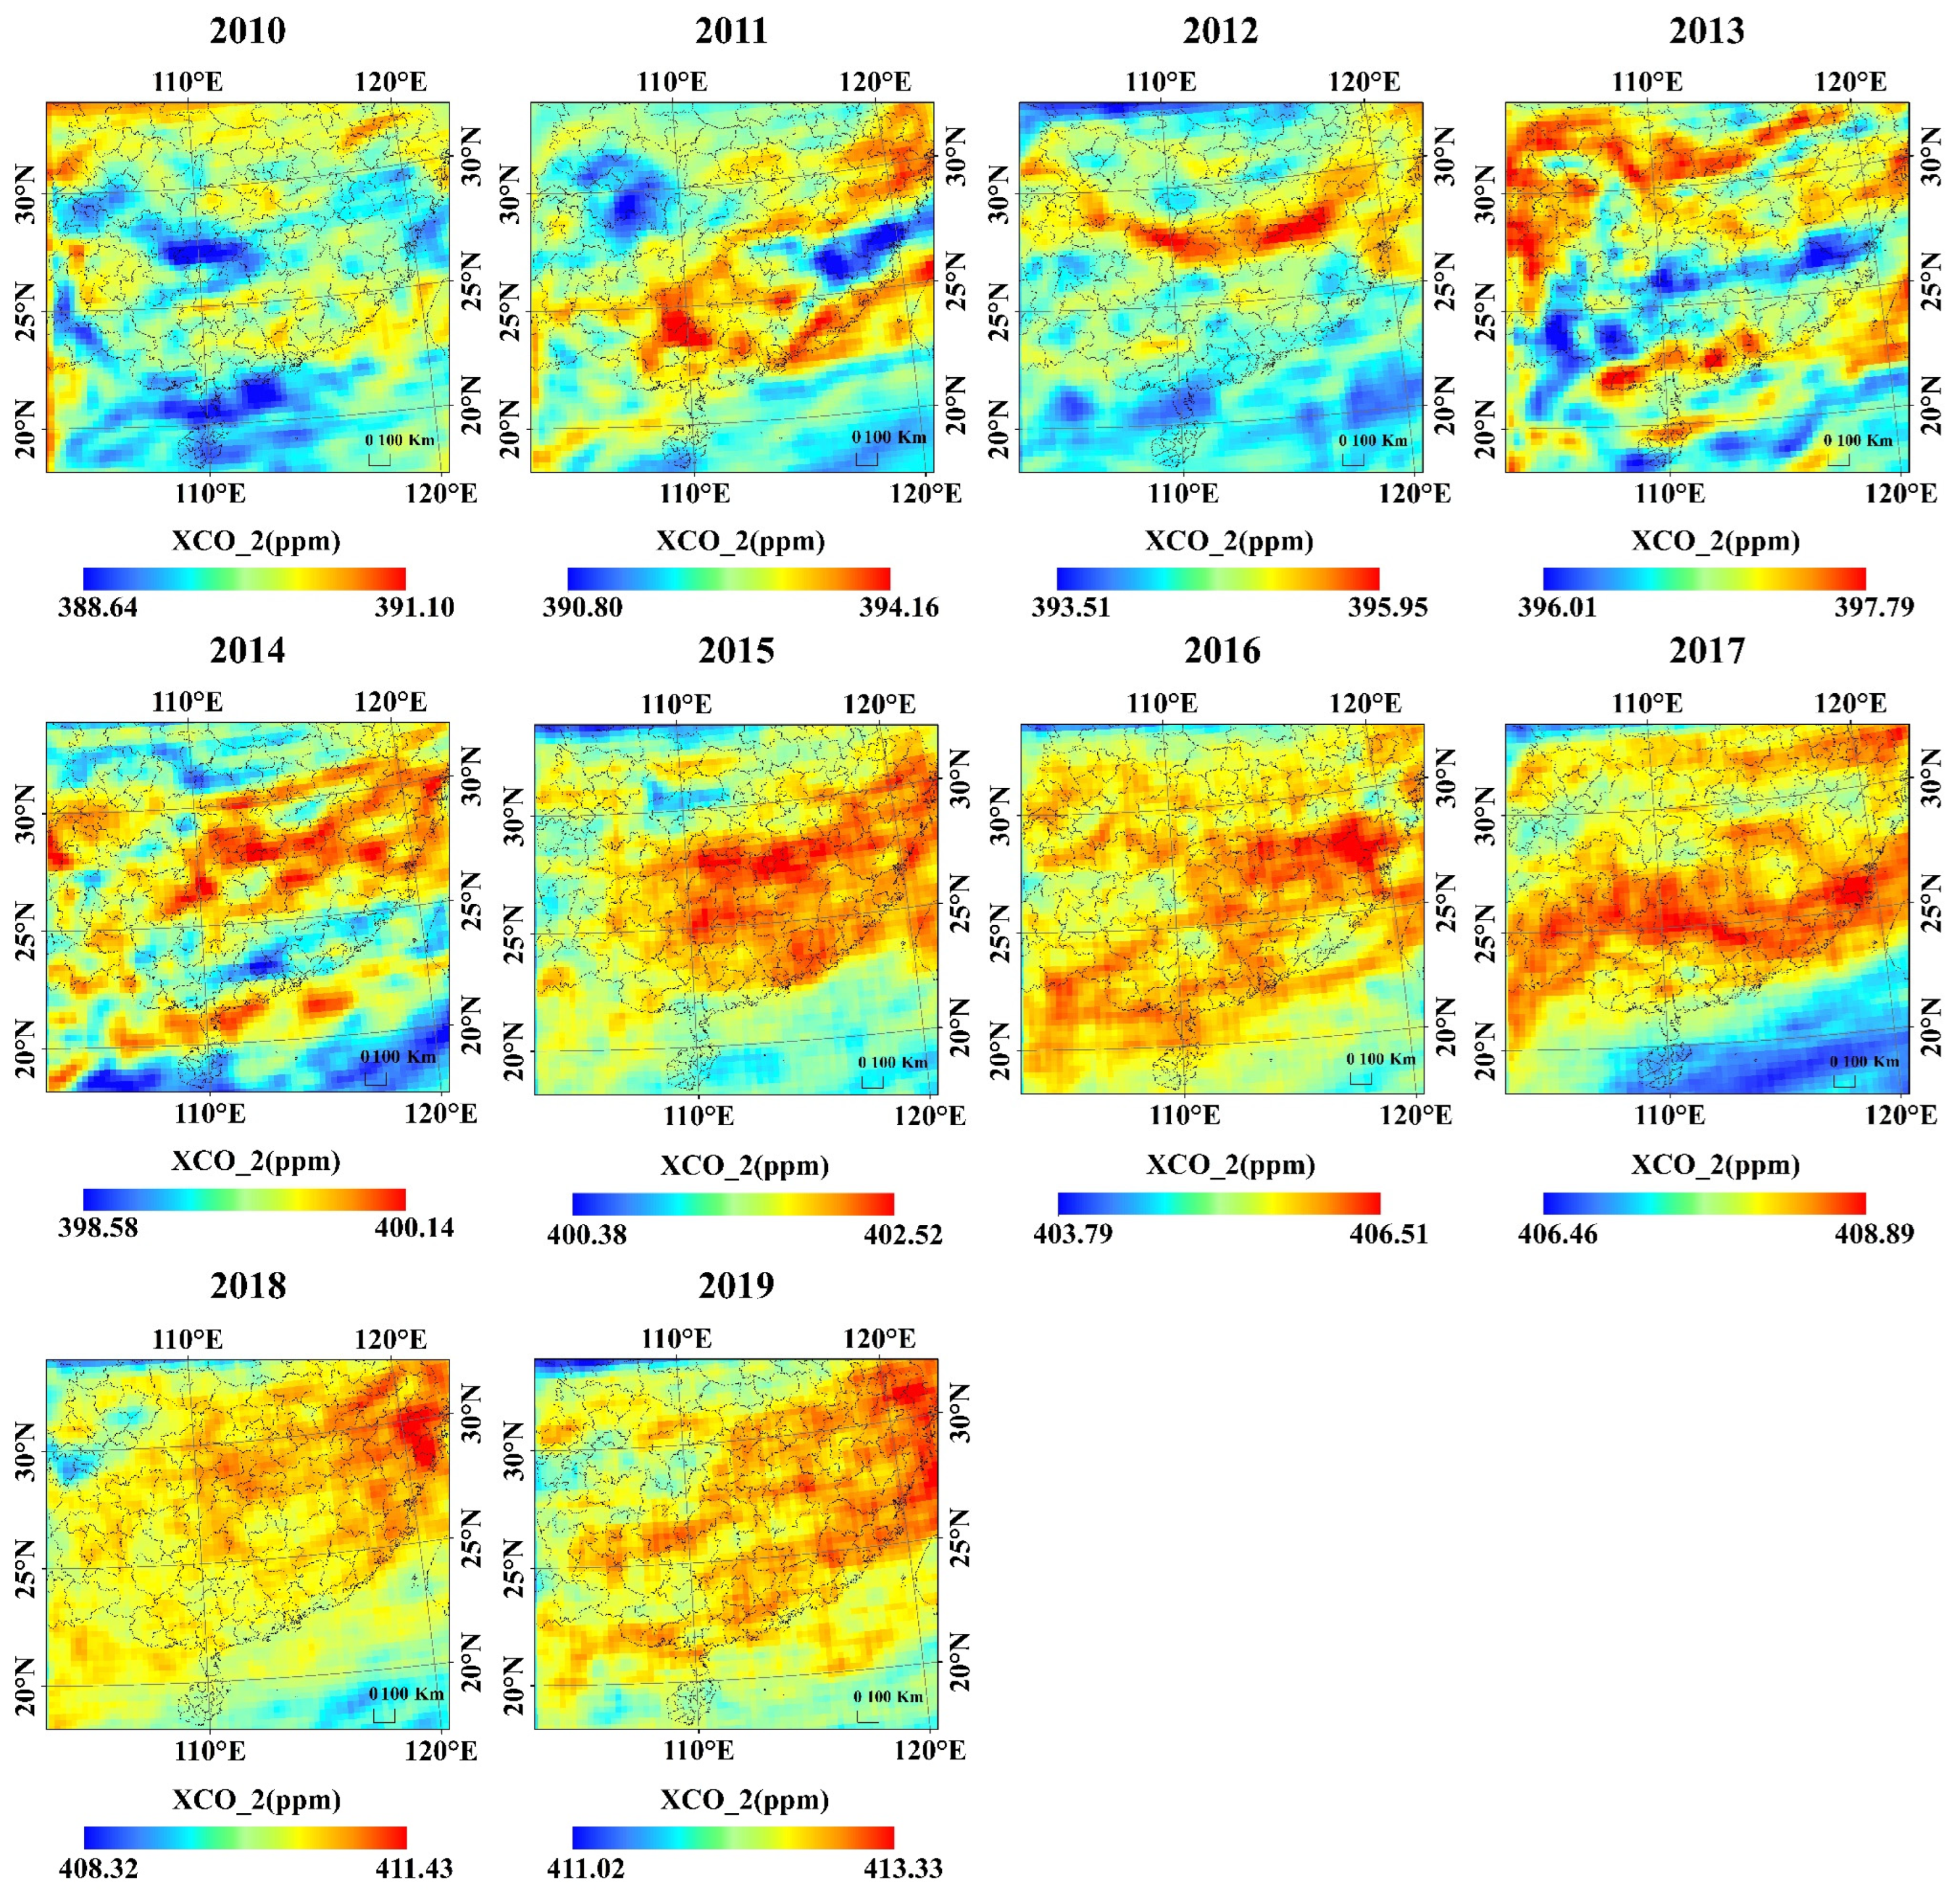
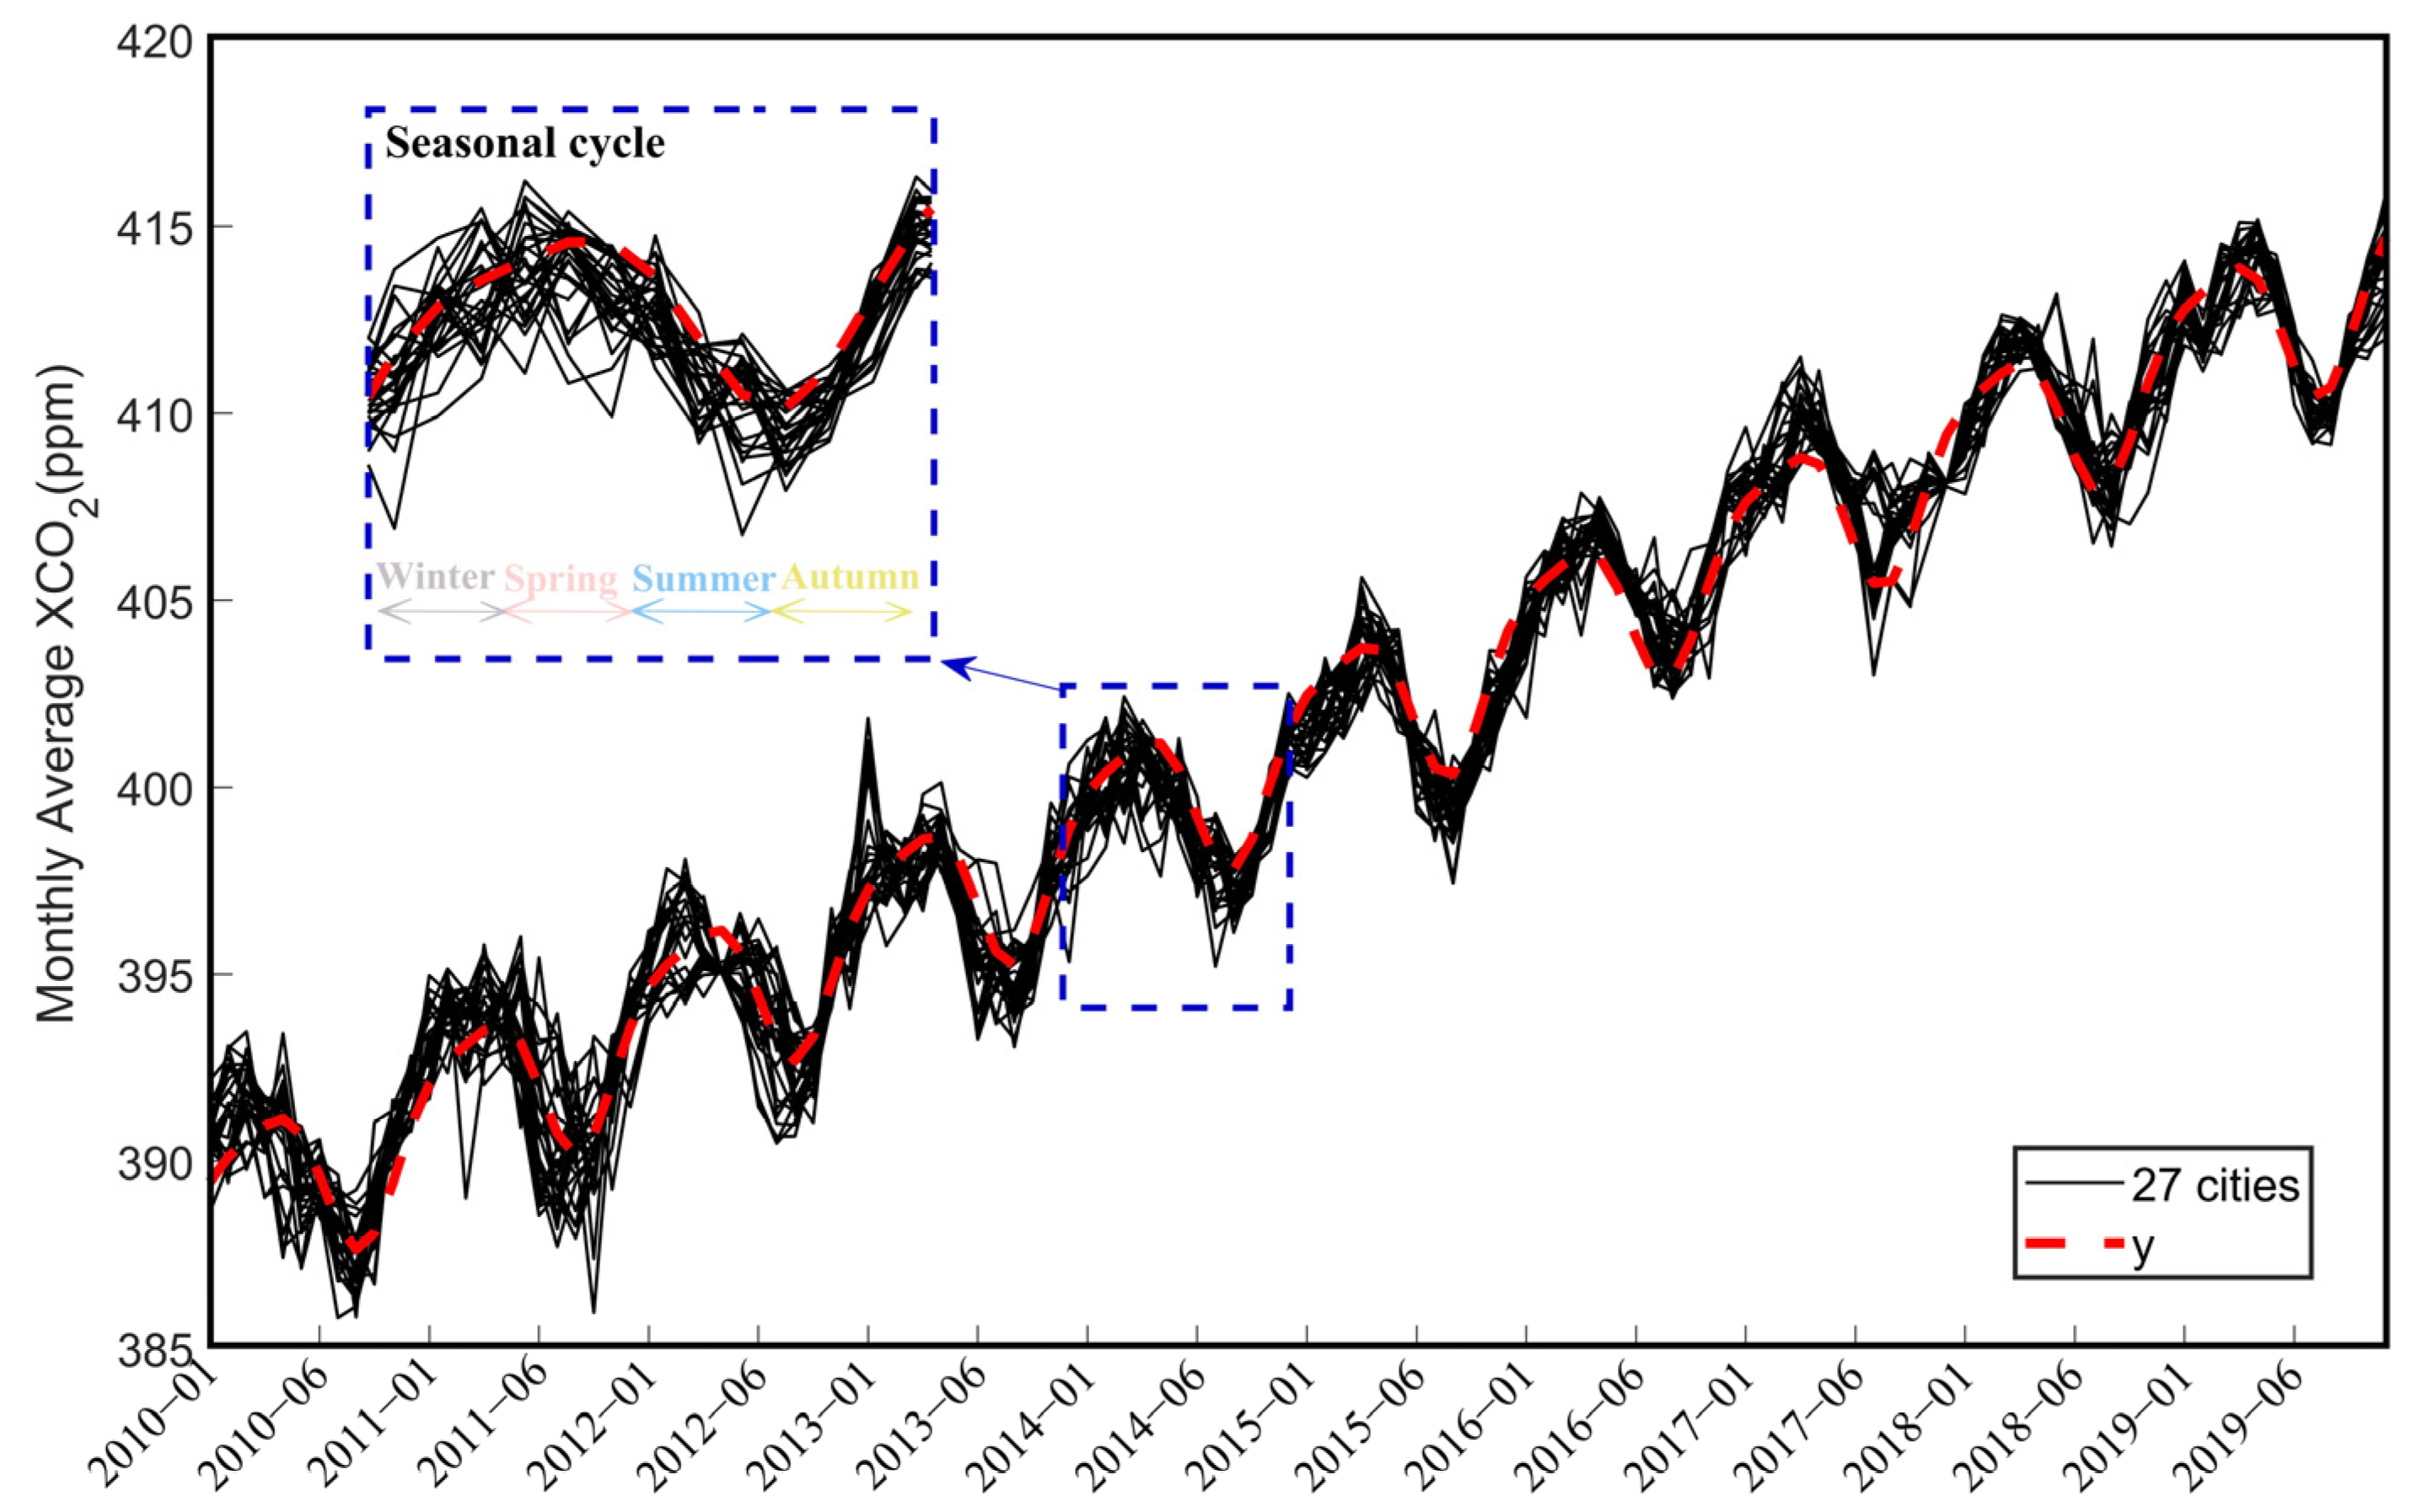
3.2. Spatial and Temporal Trend of XCO2 in 2010–2019
3.3. The Sensitivity of XCO2 to Urban Land Use
4. Discussion
4.1. Ground Validation and Simulation
4.2. Trends and Factors of XCO2 in 2010–2019
4.3. Deficiency and Prospect
5. Conclusions
Author Contributions
Funding
Acknowledgments
Conflicts of Interest
Appendix A

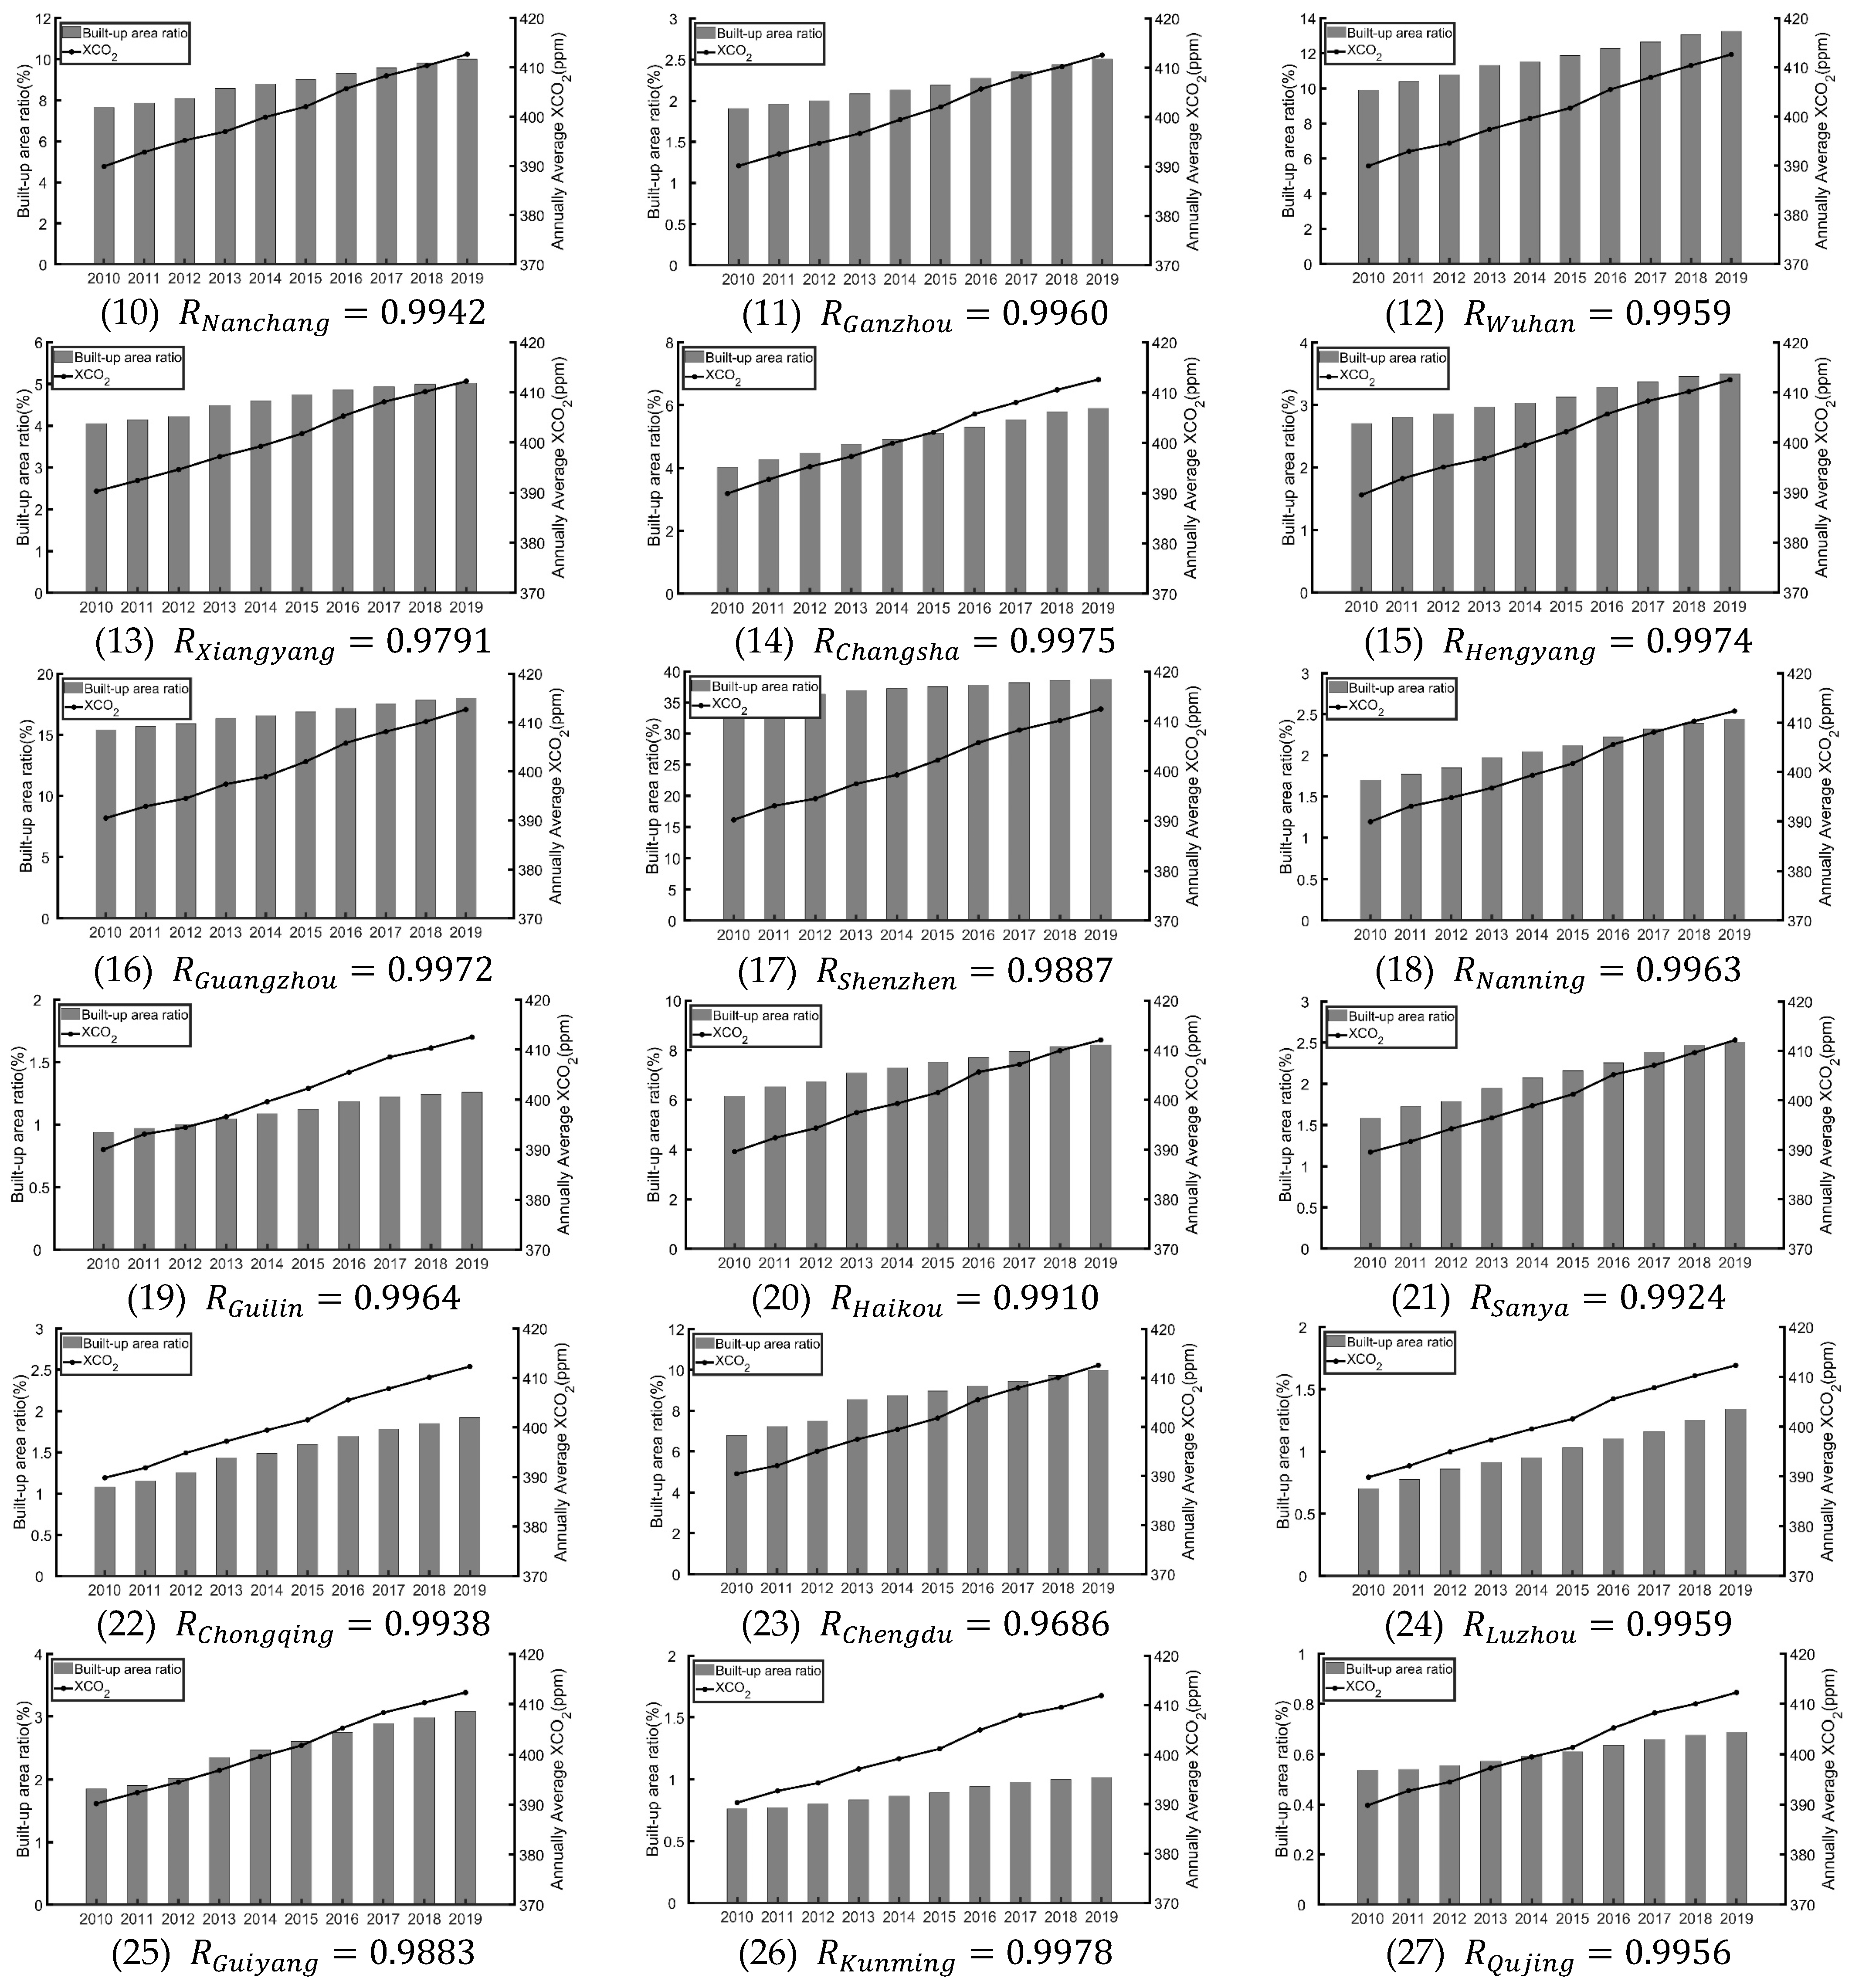

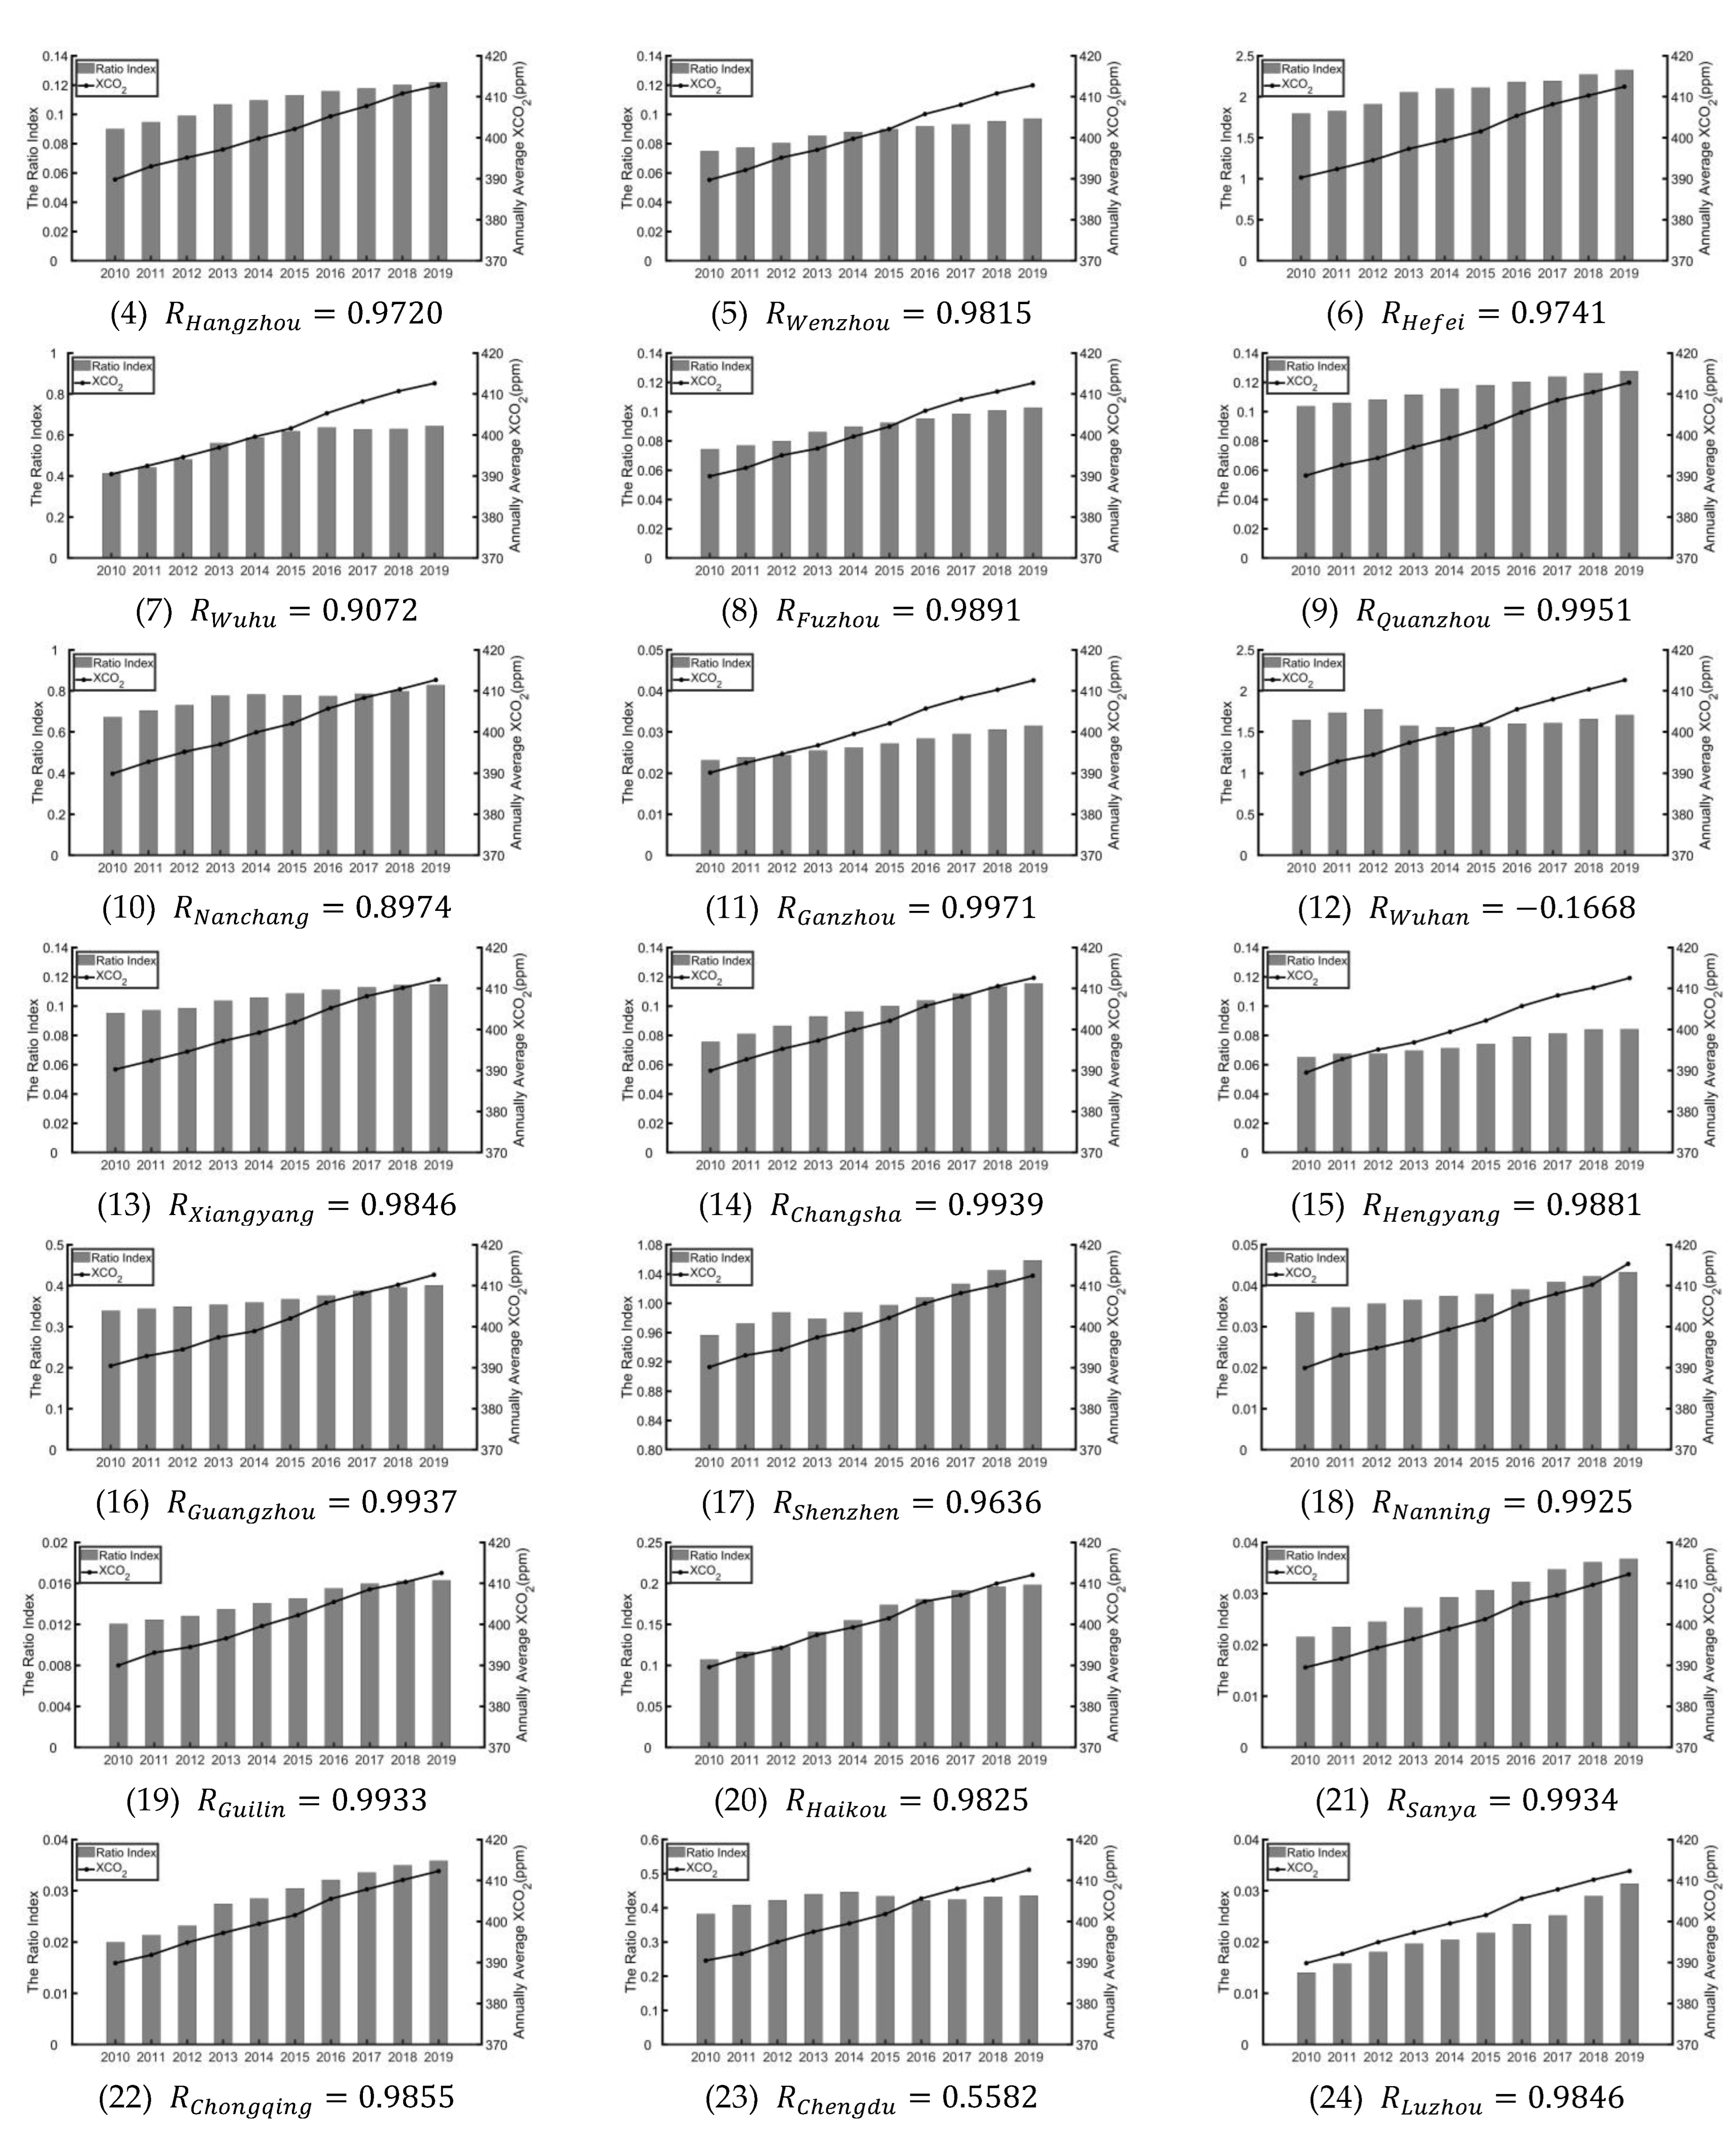

References
- Clerbaux, C.; Hadji-Lazaro, J.; Payan, S.; Camy-Peyret, C.; Megie, G. Retrieval of CO Columns from IMG/ADEOS Spectra. IEEE Trans. Geosci. Remote Sens. 1999, 37, 1657–1661. [Google Scholar] [CrossRef]
- Pan, G.; Xu, Y.; Ma, J. The Potential of CO2 Satellite Monitoring for Climate Governance: A Review. J. Environ. Manag. 2021, 277, 111423. [Google Scholar] [CrossRef]
- Cogan, A.J.; Boesch, H.; Parker, R.J.; Feng, L.; Palmer, P.I.; Blavier, J.F.L.; Deutscher, N.M.; MacAtangay, R.; Notholt, J.; Roehl, C.; et al. Atmospheric Carbon Dioxide Retrieved from the Greenhouse Gases Observing SATellite (GOSAT): Comparison with Ground-Based TCCON Observations and GEOS-Chem Model Calculations. J. Geophys. Res. Atmos. 2012, 117, D21301. [Google Scholar] [CrossRef]
- Yang, D.; Liu, Y.; Cai, Z.; Deng, J.; Wang, J.; Chen, X. An Advanced Carbon Dioxide Retrieval Algorithm for Satellite Measurements and Its Application to GOSAT Observations. Sci. Bull. 2015, 60, 2063–2066. [Google Scholar] [CrossRef]
- Mustafa, F.; Bu, L.; Wang, Q.; Ali, M.A.; Bilal, M.; Shahzaman, M.; Qiu, Z. Multi-Year Comparison of CO2 Concentration from NOAA Carbon Tracker Reanalysis Model with Data from GOSAT and OCO-2 over Asia. Remote Sens. 2020, 12, 2498. [Google Scholar] [CrossRef]
- Hammerling, D.M.; Michalak, A.M.; O’Dell, C.; Kawa, S.R. Global CO2 Distributions over Land from the Greenhouse Gases Observing Satellite (GOSAT). Geophys. Res. Lett. 2012, 39, L08804. [Google Scholar] [CrossRef]
- Yang, D.; Liu, Y.; Cai, Z.; Chen, X.; Yao, L.; Lu, D. First Global Carbon Dioxide Maps Produced from TanSat Measurements. Adv. Atmos. Sci. 2018, 35, 621–623. [Google Scholar] [CrossRef]
- Sheng, M.; Lei, L.; Zeng, Z.C.; Rao, W.; Song, H.; Wu, C. Global Land 1 Mapping Dataset of XCO2 from Satellite Observations of GOSAT and OCO-2 from 2009 to 2020. Big Earth Data 2022, 7, 180–200. [Google Scholar] [CrossRef]
- Bai, D.; Dong, Q.; Khan, S.A.R.; Li, J.; Wang, D.; Chen, Y.; Wu, J. Spatio-Temporal Heterogeneity of Logistics CO2 Emissions and Their Influencing Factors in China: An Analysis Based on Spatial Error Model and Geographically and Temporally Weighted Regression Model. Environ. Technol. Innov. 2022, 28, 102791. [Google Scholar] [CrossRef]
- Guo, M.; Wang, X.F.; Li, J.; Yi, K.P.; Zhong, G.S.; Wang, H.M.; Tani, H.; Schneising, O.; Reuter, M. Spatial Distribution of Greenhouse Gas Concentrations in Arid and Semi-Arid Regions: A Case Study in East Asia. J. Arid Environ. 2013, 91, 119–128. [Google Scholar] [CrossRef]
- Hakkarainen, J.; Ialongo, I.; Tamminen, J. Direct Space-Based Observations of Anthropogenic CO2 Emission Areas from OCO-2. Geophys. Res. Lett. 2016, 43, 11400–11406. [Google Scholar] [CrossRef]
- Hwang, Y.S.; Um, J.S. Comparative Evaluation of XCO2 Concentration among Climate Types within India Region Using OCO-2 Signatures. Spat. Inf. Res. 2016, 24, 679–688. [Google Scholar] [CrossRef]
- Lu, M.; Zhao-cong, W.; Yi, Z. Spatial and Temporal Variations of XCO2 in China and Its Influencing Factors Analysis. China Environ. Sci. 2021, 41, 2562–2570. [Google Scholar] [CrossRef]
- Li, S.; Siu, Y.W.; Zhao, G. Driving Factors of CO2 Emissions: Further Study Based on Machine Learning. Front. Environ. Sci. 2021, 9, 721517. [Google Scholar] [CrossRef]
- Amin, A.; Ameer, W.; Yousaf, H.; Akbar, M. Financial Development, Institutional Quality, and the Influence of Various Environmental Factors on Carbon Dioxide Emissions: Exploring the Nexus in China. Front. Environ. Sci. 2022, 9, 755. [Google Scholar] [CrossRef]
- Yoshida, Y.; Ota, Y.; Eguchi, N.; Kikuchi, N.; Nobuta, K.; Tran, H.; Morino, I.; Yokota, T. Retrieval Algorithm for CO2 and CH4 Column Abundances from Short-Wavelength Infrared Spectral Observations by the Greenhouse Gases Observing Satellite. Atmos. Meas. Tech. 2011, 4, 717–734. [Google Scholar] [CrossRef]
- Yue, T.X.; Zhao, M.W.; Zhang, X.Y. A High-Accuracy Method for Filling Voids on Remotely Sensed XCO2 Surfaces and Its Verification. J. Clean. Prod. 2015, 103, 819–827. [Google Scholar] [CrossRef]
- Liu, Y.; Yue, T.; Zhang, L.; Zhao, N.; Zhao, M.; Liu, Y. Simulation and Analysis of XCO2 in North China Based on High Accuracy Surface Modeling. Environ. Sci. Pollut. Res. 2018, 25, 27378–27392. [Google Scholar] [CrossRef]
- Zhang, L.L.; Yue, T.X.; Wilson, J.P.; Zhao, N.; Zhao, Y.P.; Du, Z.P.; Liu, Y. A Comparison of Satellite Observations with the XCO2 Surface Obtained by Fusing TCCON Measurements and GEOS-Chem Model Outputs. Sci. Total Environ. 2017, 601–602, 1575–1590. [Google Scholar] [CrossRef]
- Kunchala, R.K.; Patra, P.K.; Kumar, K.N.; Chandra, N.; Attada, R.; Karumuri, R.K. Spatio-Temporal Variability of XCO2 over Indian Region Inferred from Orbiting Carbon Observatory (OCO-2) Satellite and Chemistry Transport Model. Atmos. Res. 2022, 269, 106044. [Google Scholar] [CrossRef]
- Giannaros, C.; Dafis, S.; Stefanidis, S.; Giannaros, T.M.; Koletsis, I.; Oikonomou, C. Hydrometeorological Analysis of a Flash Flood Event in an Ungauged Mediterranean Watershed under an Operational Forecasting and Monitoring Context. Meteorol. Appl. 2022, 29, e2079. [Google Scholar] [CrossRef]
- Rizza, U.; Avolio, E.; Morichetti, M.; Di Liberto, L.; Bellini, A.; Barnaba, F.; Virgili, S.; Passerini, G.; Mancinelli, E. On the Interplay between Desert Dust and Meteorology Based on WRF-Chem Simulations and Remote Sensing Observations in the Mediterranean Basin. Remote Sens. 2023, 15, 435. [Google Scholar] [CrossRef]
- OCO-2 Science Team; Gunson, M.; Eldering, A. ACOS GOSAT/TANSO-FTS Level 2 Bias-Corrected XCO2 and Other Select Fields from the Full-Physics Retrieval Aggregated as Daily Files V9r; Goddard Earth Sciences Data and Information Services Center (GES DISC): Greenbelt, MD, USA, 2019.
- OCO-2 Science Team. OCO-2 Level 2 Bias-Corrected XCO2 and Other Select Fields from the Full-Physics Retrieval Aggregated as Daily Files, Retrospective Processing V10r; Goddard Earth Sciences Data and Information Services Center (GES DISC): Greenbelt, MD, USA, 2020.
- National Centers for Environmental Prediction/National Weather Service/NOAA/U.S. Department Of Commerce NCEP FNL Operational Model Global Tropospheric Analyses, Continuing from July 1999. UCAR/NCAR—Res. Data Arch. 2000. Available online: https://rda.ucar.edu/datasets/ds082.0/ (accessed on 1 January 2023).
- Crippa, M.; Oreggioni, G.; Guizzardi, D.; Muntean, M.; Schaaf, E.; Lo Vullo, E.; Solazzo, E.; Monforti-Ferrario, F.; Olivier, J.G.J.; Vignati, E. Fossil CO2 and GHG Emissions of All World Countries; Publication Office of the European Union: Luxemburg, 2019. [Google Scholar]
- Jacobson, A.R.; Schuldt, K.N.; Miller, J.B.; Oda, T.; Tans, P.; Andrews, A.; Mund, J.; Ott, L.; Collatz, G.J.; CarbonTracker CT2019; et al. NOAA Earth Syst. Res. Lab. Glob. Monit. Div. 2020. Available online: https://gml.noaa.gov/ccgg/carbontracker/CT2019/warning.php (accessed on 1 January 2023).
- Buchwitz, M.; Reuter, M.; Schneising, O.; Boesch, H.; Guerlet, S.; Dils, B.; Aben, I.; Armante, R.; Bergamaschi, P.; Blumenstock, T.; et al. The Greenhouse Gas Climate Change Initiative (GHG-CCI): Comparison and Quality Assessment of near-Surface-Sensitive Satellite-Derived CO2 and CH4 Global Data Sets. Remote Sens. Environ. 2015, 162, 344–362. [Google Scholar] [CrossRef]
- Wunch, D.; Wennberg, P.O.; Osterman, G.; Fisher, B.; Naylor, B.; Roehl, M.C.; O’Dell, C.; Mandrake, L.; Viatte, C.; Kiel, M.; et al. Comparisons of the Orbiting Carbon Observatory-2 (OCO-2) XCO2 Measurements with TCCON. Atmos. Meas. Tech. 2017, 10, 2209–2238. [Google Scholar] [CrossRef]
- Wunch, D.; Toon, G.C.; Wennberg, P.O.; Wofsy, S.C.; Stephens, B.B.; Fischer, M.L.; Uchino, O.; Abshire, J.B.; Bernath, P.; Biraud, S.C. Calibration of the Total Carbon Column Observing Network Using Aircraft Profile Data. Atmos Meas Tech 2010, 3, 1351–1362. [Google Scholar] [CrossRef]
- WDCGG, WMO. World Meteorological Organization—Global Atmospheric Watch—World Data Centre for Greenhouse Gases; WDCGG, WMO: Geneva, Switzerland, 2002. [Google Scholar]
- Yang, J.; Huang, X. The 30 m Annual Land Cover Dataset and Its Dynamics in China from 1990 to 2019. Earth Syst. Sci. Data 2021, 13, 3907–3925. [Google Scholar] [CrossRef]
- Contreras, J.; Espínola, R.; Nogales, F.J.; Conejo, A.J. ARIMA Models to Predict Next-Day Electricity Prices. IEEE Trans. Power Syst. 2003, 18, 1014–1020. [Google Scholar] [CrossRef]
- Grell, G.A.; Peckham, S.E.; Schmitz, R.; McKeen, S.A.; Frost, G.; Skamarock, W.C.; Eder, B. Fully Coupled “Online” Chemistry within the WRF Model. Atmos. Environ. 2005, 39, 6957–6975. [Google Scholar] [CrossRef]
- Sekulić, A.; Kilibarda, M.; Heuvelink, G.B.M.; Nikolić, M.; Bajat, B. Random Forest Spatial Interpolation. Remote Sens. 2020, 12, 1687. [Google Scholar] [CrossRef]
- Biau, G. Analysis of a Random Forests Model. J. Mach. Learn. Res. 2012, 13, 1063–1095. [Google Scholar]
- Taylor, R. Interpretation of the Correlation Coefficient: A Basic Review. J. Diagn. Med. Sonogr. 1990, 6, 35–39. [Google Scholar] [CrossRef]
- Quinino, R.C.; Reis, E.A.; Bessegato, L.F. Using the Coefficient of Determination R2 to Test the Significance of Multiple Linear Regression. Teach. Stat. 2013, 35, 84–88. [Google Scholar] [CrossRef]
- Chai, T.; Draxler, R.R. Root Mean Square Error (RMSE) or Mean Absolute Error (MAE)?—Arguments against Avoiding RMSE in the Literature. Geosci. Model Dev. 2014, 7, 1247–1250. [Google Scholar] [CrossRef]
- Keeling, C.D.; Bacastow, R.B.; Bainbridge, A.E.; Ekdahl, C.A.; Guenther, P.R.; Waterman, E.S. Atmospheric Carbon Dioxide Variations at Mauna Loa Observatory, Hawaii. Tellus 1976, 26, 538–551. [Google Scholar] [CrossRef]
- Boesch, H.; Baker, D.; Connor, B.; Crisp, D.; Miller, C. Global Characterization of CO2 Column Retrievals from Shortwave-Infrared Satellite Observations of the Orbiting Carbon Observatory-2 Mission. Remote Sens. 2011, 3, 270–304. [Google Scholar] [CrossRef]
- Butz, A.; Guerlet, S.; Hasekamp, O.; Schepers, D.; Galli, A.; Aben, I.; Frankenberg, C.; Hartmann, J.M.; Tran, H.; Kuze, A.; et al. Toward Accurate CO2 and CH4 Observations from GOSAT. Geophys. Res. Lett. 2011, 38, L14812. [Google Scholar] [CrossRef]
- Crisp, D.; Fisher, B.M.; O’Dell, C.; Frankenberg, C.; Basilio, R.; Bösch, H.; Brown, L.R.; Castano, R.; Connor, B.; Deutscher, N.M.; et al. The ACOS CO2 Retrieval Algorithm—Part II: Global X CO2 Data Characterization. Atmos. Meas. Tech. 2012, 5, 687–707. [Google Scholar] [CrossRef]
- Wennberg, P.; Osterman, G.; Frankenberg, C.; Wunch, D.; Wennberg, P.O.; Toon, G.C.; Connor, B.J.; Fisher, B.; Osterman, G.B.; Frankenberg, C.; et al. A Method for Evaluating Bias in Global Measurements of CO2 Total Columns from Space LBNL ARM Carbon Project View Project Tidal Effects on Ecosystem Exchange of Carbon Dioxide and Methane in Restored Tidal Marshes of San Francisco Bay View Project Atmospheric Chemistry and Physics a Method for Evaluating Bias in Global Measurements of CO2 Total Columns from Space. Atmos. Chem. Phys 2011, 11, 12317–12337. [Google Scholar] [CrossRef]
- Hungershoefer, K.; Peylin, P.; Chevallier, F.; Rayner, P.; Klonecki, A.; Houweling, S.; Marshall, J. Evaluation of Various Observing Systems for the Global Monitoring of CO2 Surface Fluxes. Atmos. Chem. Phys. 2010, 10, 10503–10520. [Google Scholar] [CrossRef]
- Liu, Y.; Yang, D.X.; Cai, Z.N. A Retrieval Algorithm for TanSat XCO2 Observation: Retrieval Experiments Using GOSAT Data. Chin. Sci. Bull. 2013, 58, 1520–1523. [Google Scholar] [CrossRef]
- IPCC (Intergovernmental Panel on Climate Change). Climate Change 2021: The Physical Science Basis; Cambridge University Press: Cambridge, UK, 2021. [Google Scholar] [CrossRef]
- Barrie, L.; Braathen, G. WMO Greenhouse Gas Bulletin: The State of Greenhouse Gases in the Atmosphere Based on Global Observations through 2020; World Meteorological Organization: Geneva, Switzerland, 2020. [Google Scholar]
- Wei, H.; Li, L.; Nian, M. China’s Urbanization Strategy and Policy during the 14th Five-Year Plan Period. Chin. J. Urban Environ. Stud. 2021, 9, 2150002. [Google Scholar] [CrossRef]
- Shan, Y.; Liu, J.; Liu, Z.; Xu, X.; Shao, S.; Wang, P.; Guan, D. New Provincial CO2 Emission Inventories in China Based on Apparent Energy Consumption Data and Updated Emission Factors. Appl. Energy 2016, 184, 742–750. [Google Scholar] [CrossRef]
- IEA. Global Energy & CO2 Status Report 2019; IEA: Paris, France, 2019. [Google Scholar]
- Osterman, G. ACOS Level 2 Standard Product and Lite Data Product Data User’s Guide, v9 Christopher O’Dell, CSU Orbiting Carbon Observatory-2 (OCO-2), Orbiting Carbon Observatory-3 (OCO-3) Algorithm Teams; GES DISC: Greenbelt, MD, USA, 2020.
- Dunn, R.J.H.; Stanitski, D.M.; Gobron, N.; Willett, K.M. Global Climate. Bull. Am. Meteorol. Soc. 2020, 101, S9–S128. [Google Scholar] [CrossRef]
- Gourdji, S.M.; Karion, A.; Lopez-Coto, I.; Ghosh, S.; Mueller, K.L.; Zhou, Y.; Williams, C.A.; Baker, I.T.; Haynes, K.D.; Whetstone, J.R. A Modified Vegetation Photosynthesis and Respiration Model (VPRM) for the Eastern USA and Canada, Evaluated with Comparison to Atmospheric Observations and Other Biospheric Models. J. Geophys. Res. Biogeosci. 2022, 127, e2021JG006290. [Google Scholar] [CrossRef]
- Sønderby, C.K.; Espeholt, L.; Heek, J.; Dehghani, M.; Oliver, A.; Salimans, T.; Agrawal, S.; Hickey, J.; Kalchbrenner, N. MetNet: A Neural Weather Model for Precipitation Forecasting. arXiv 2020, arXiv:2003.12140. [Google Scholar]
- Kurth, T.; Subramanian, S.; Harrington, P.; Pathak, J.; Mardani, M.; Hall, D.; Miele, A.; Kashinath, K.; Anandkumar, A. Fourcastnet: Accelerating Global High-Resolution Weather Forecasting Using Adaptive Fourier Neural Operators. arXiv 2022, arXiv:2208.05419. [Google Scholar]
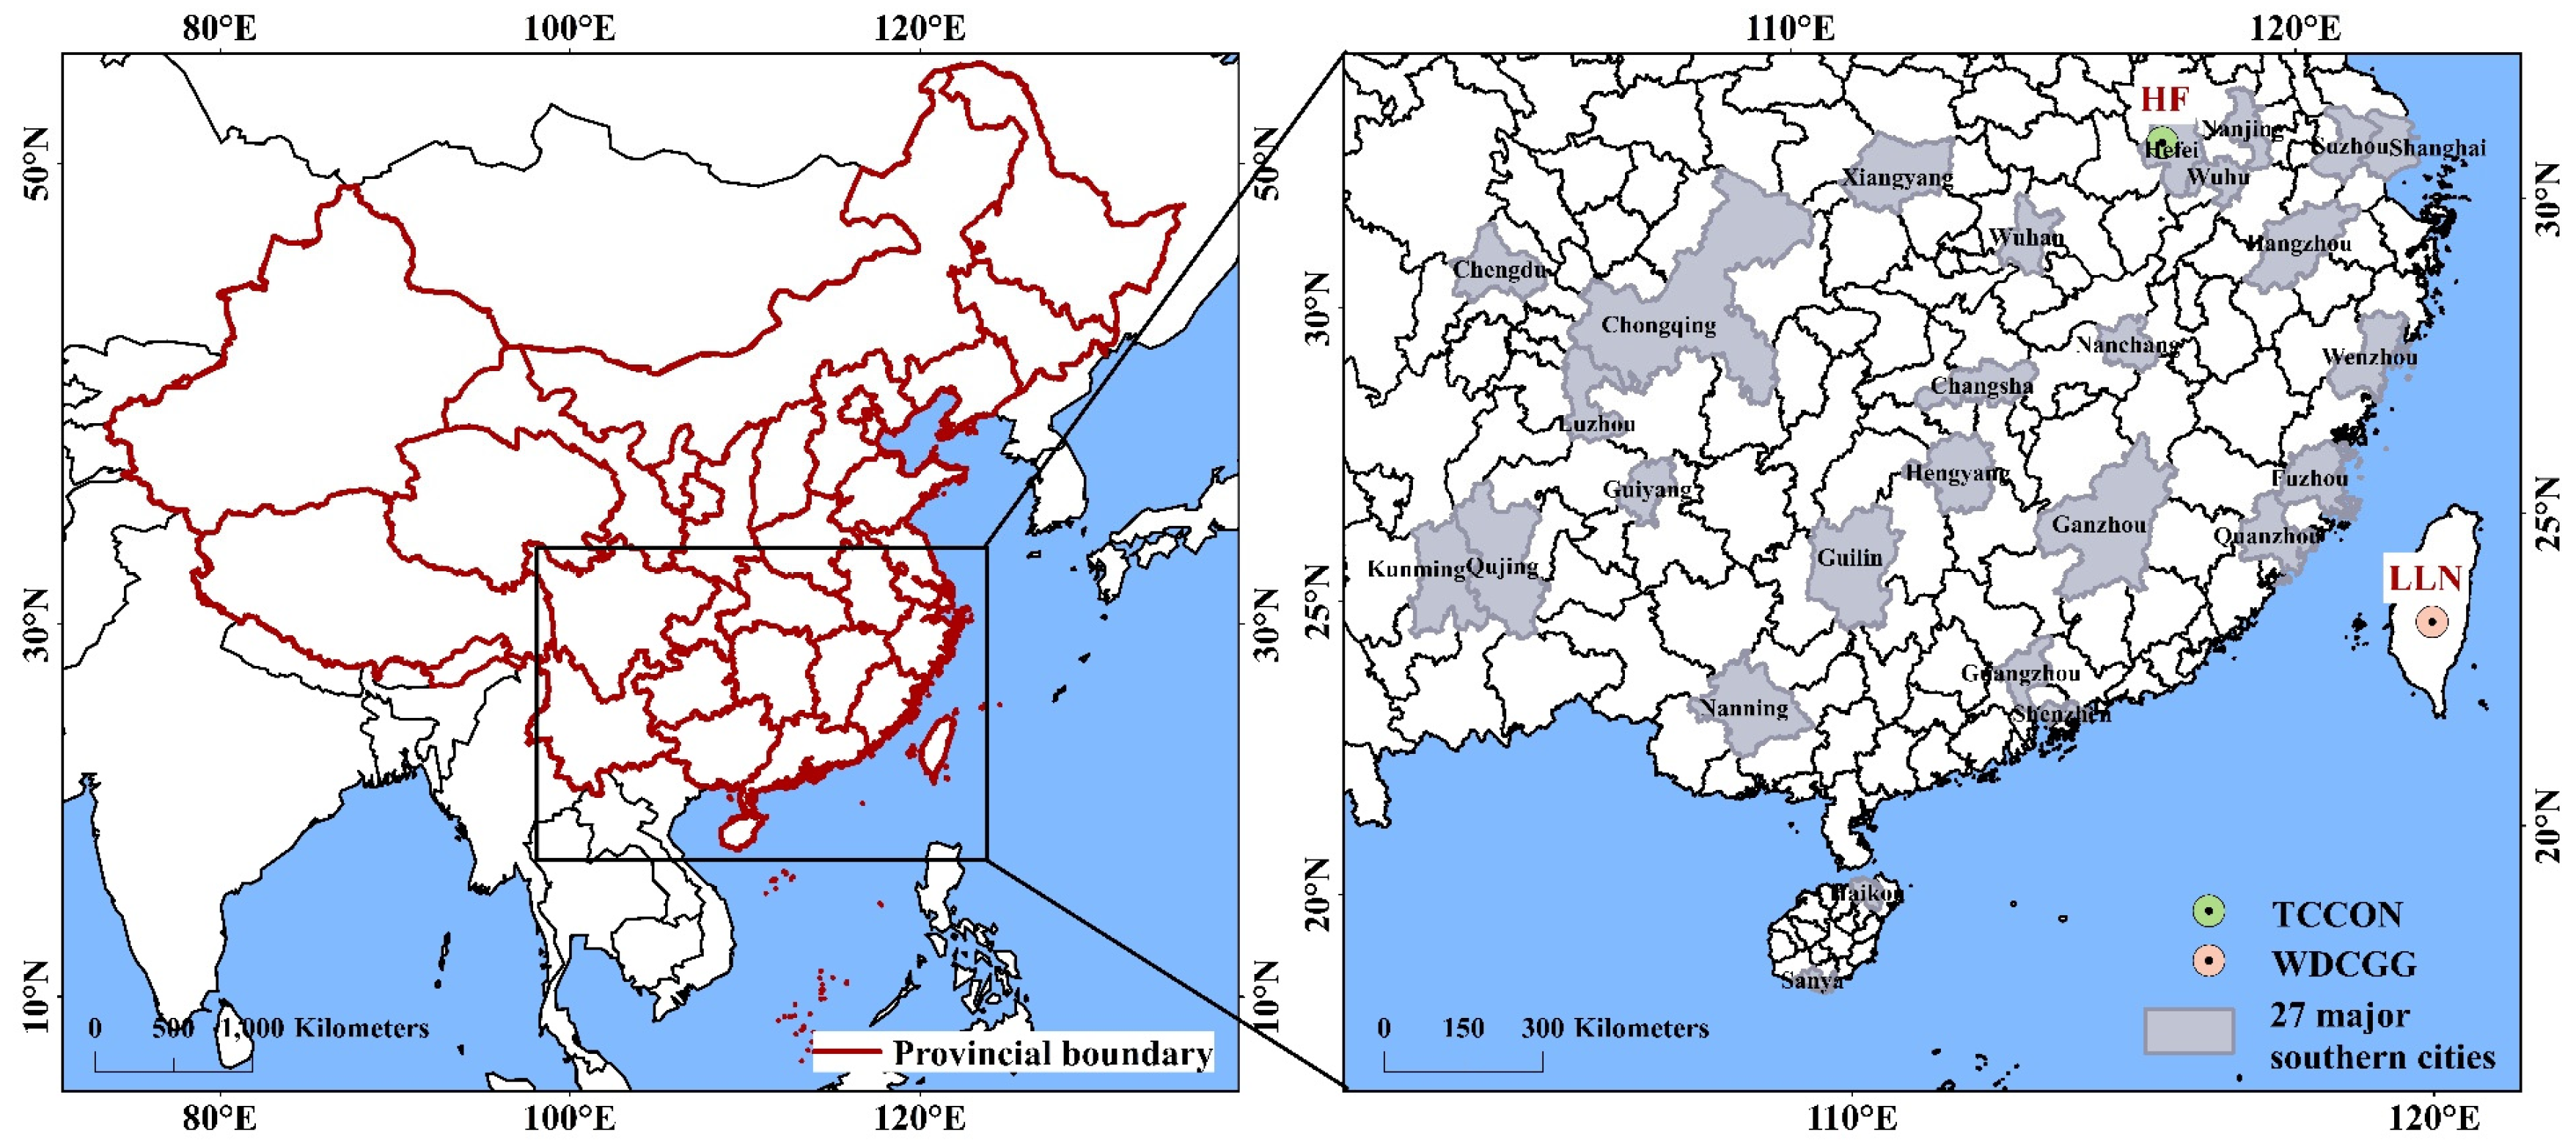
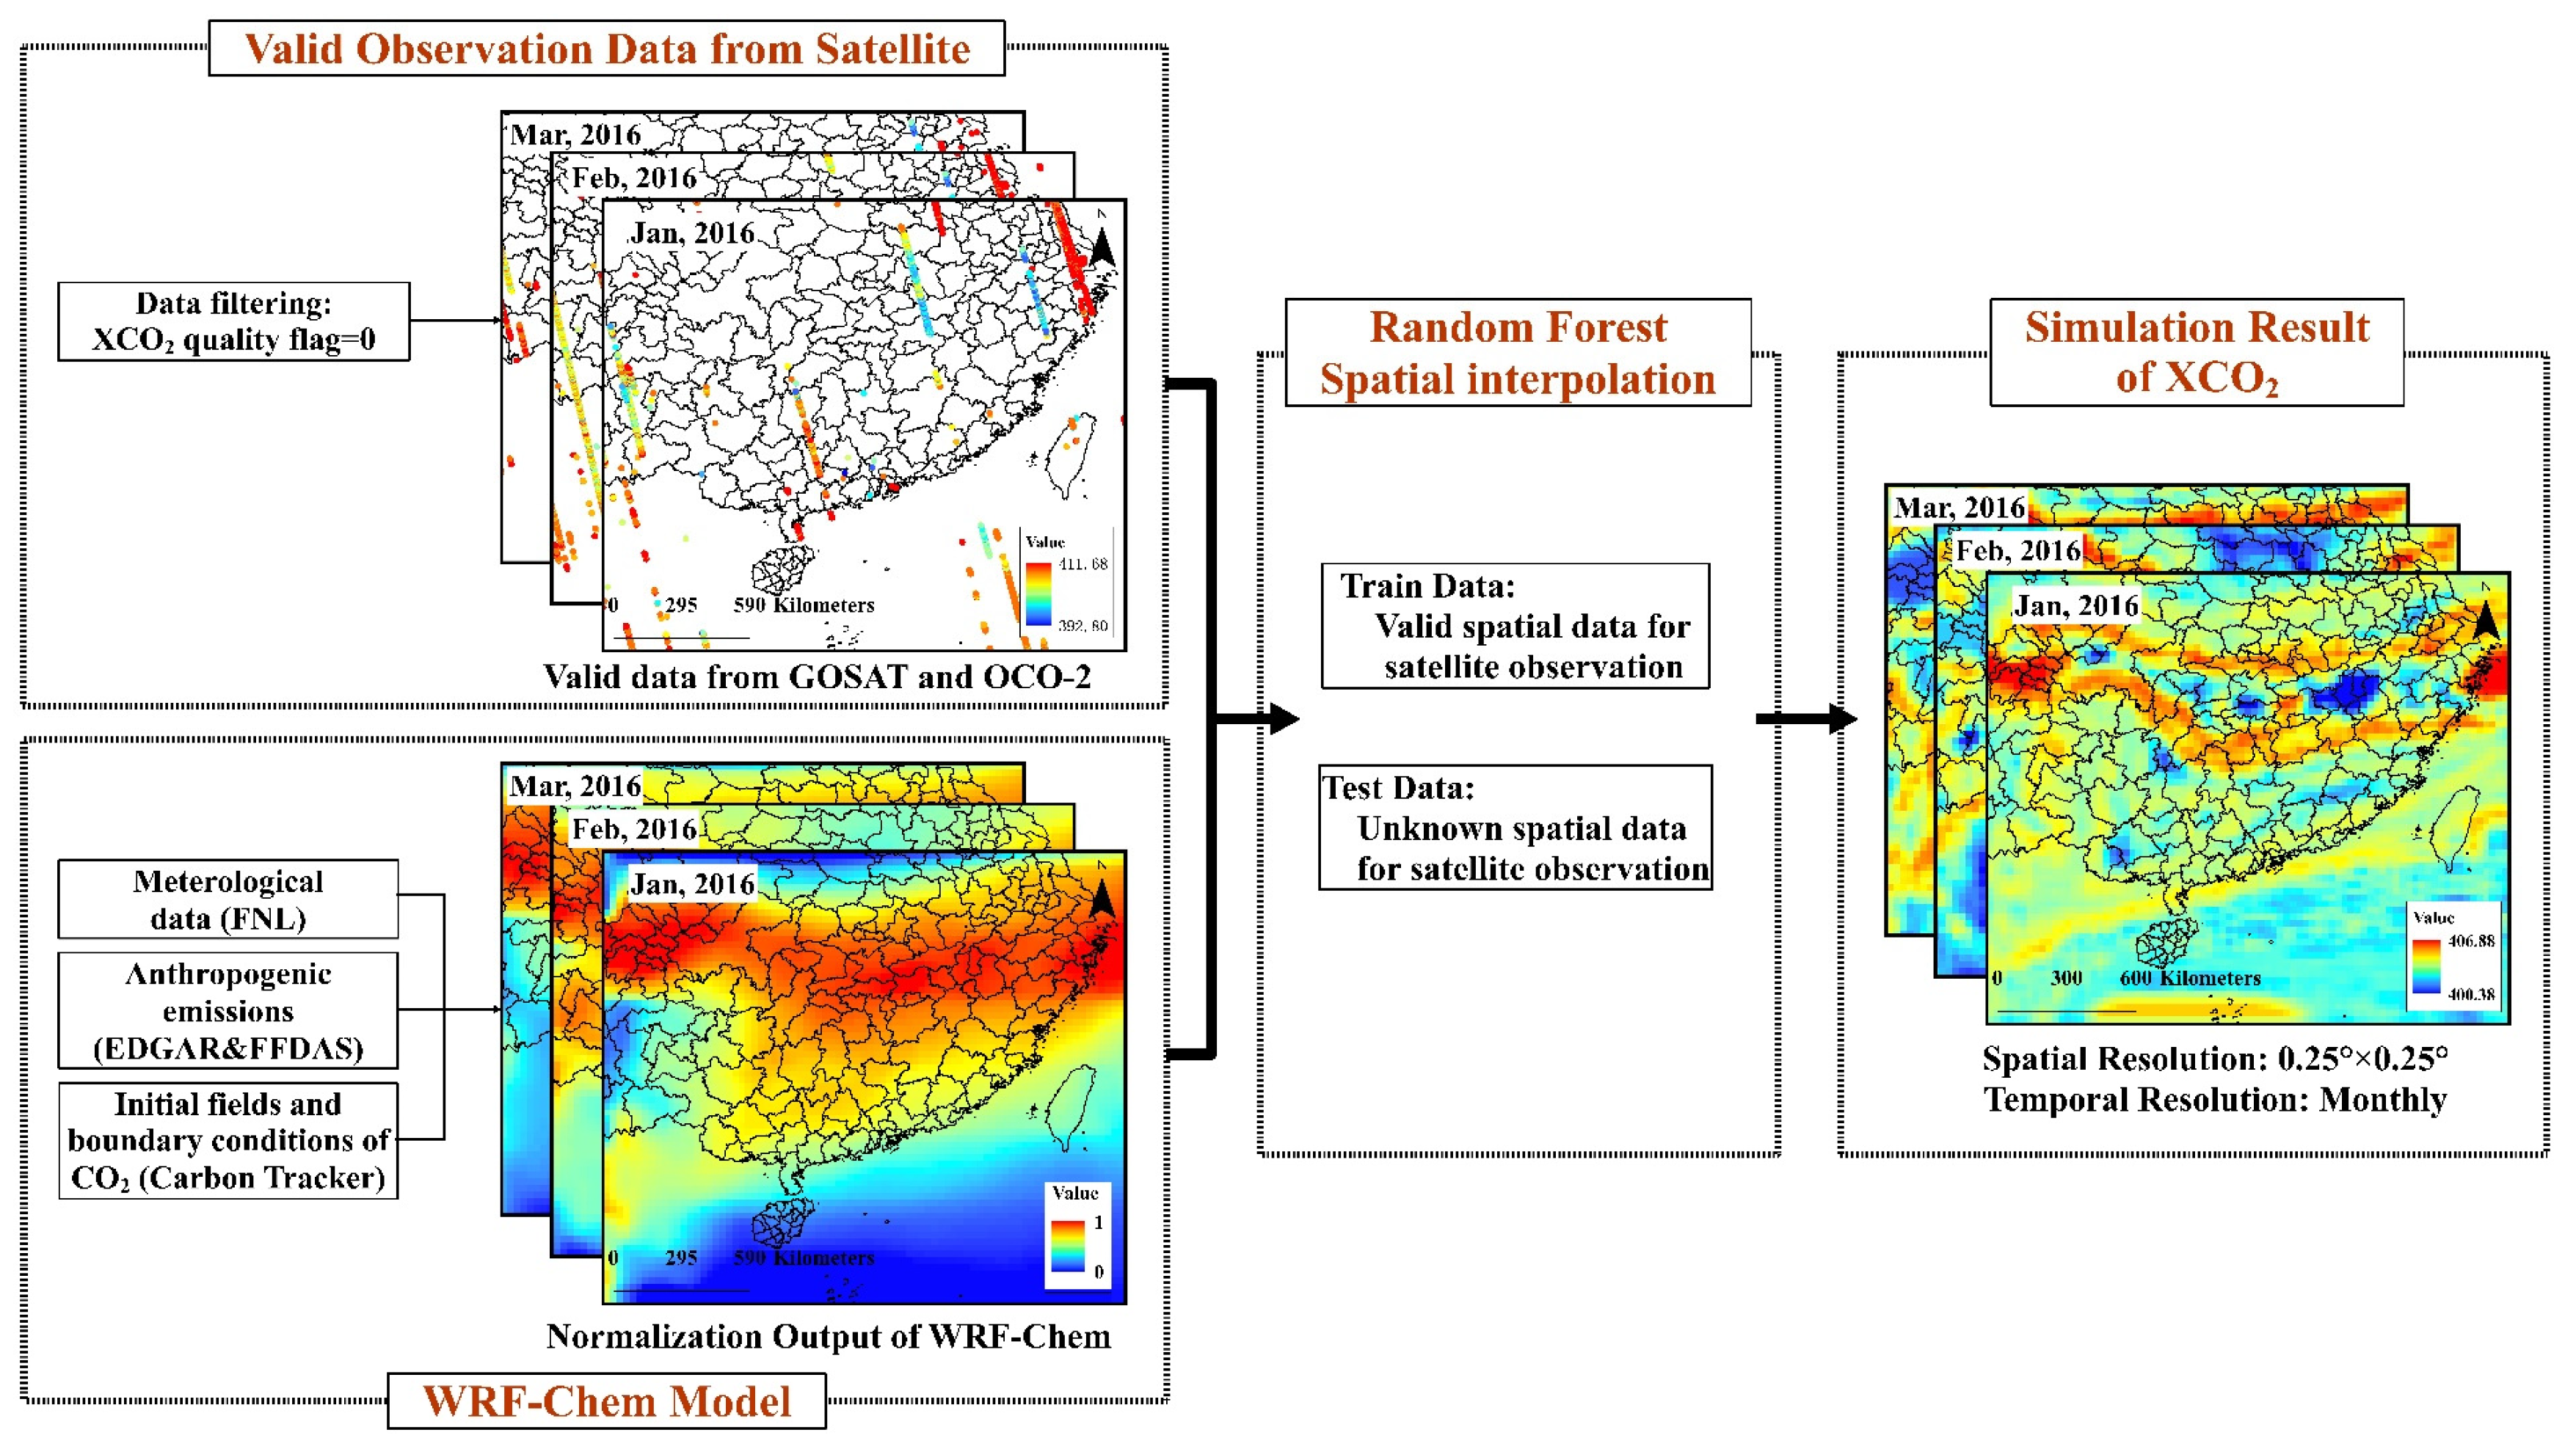


| Province/Municipality | City | Longitude | Latitude | |
|---|---|---|---|---|
| (1) | Shanghai City | Shanghai | 121.48941° E | 31.40527° N |
| (2) | Jiangsu Province | Nanjing | 118.8921° E | 31.32751° N |
| (3) | Suzhou | 120.63132° E | 31.30227° N | |
| (4) | Zhejiang Province | Hangzhou | 120.21201° E | 30.2084° N |
| (5) | Wenzhou | 121.1572° E | 27.83616° N | |
| (6) | Anhui Province | Hefei | 117.30794° E | 31.79322° N |
| (7) | Wuhu | 118.38548° E | 31.34072° N | |
| (8) | Fujian Province | Fuzhou | 119.27345° E | 26.04769° N |
| (9) | Quanzhou | 118.613° E | 24.88946° N | |
| (10) | Jiangxi Province | Nanchang | 115.94422° E | 28.54538° N |
| (11) | Ganzhou | 115.01161° E | 25.86076° N | |
| (12) | Hubei Province | Wuhan | 114.02919° E | 30.58203° N |
| (13) | Xiangyang | 112.13555° E | 32.04487° N | |
| (14) | Hunan Province | Changsha | 112.98626° E | 28.25591° N |
| (15) | Hengyang | 112.73876° E | 27.23258° N | |
| (16) | Guangdong Province | Guangzhou | 113.27324° E | 23.15792° N |
| (17) | Shenzhen | 113.88308° E | 22.55329° N | |
| (18) | Guangxi Province | Nanning | 118.8921° E | 31.32751° N |
| (19) | Guilin | 110.30188° E | 25.31402° N | |
| (20) | Hainan Province | Haikou | 110.32941° E | 20.02971° N |
| (21) | Sanya | 109.7525° E | 18.40005° N | |
| (22) | Chongqing City | Chongqing | 106.54041° E | 29.40268° N |
| (23) | Sichuan Province | Chengdu | 104.10194° E | 30.65984° N |
| (24) | Luzhou | 105.43501° E | 28.87875° N | |
| (25) | Guizhou Province | Guiyang | 106.62298° E | 26.67865° N |
| (26) | Yunnan Province | Kunming | 102.82147° E | 24.88554° N |
| (27) | Qujing | 103.82183° E | 25.60167° N |
| Physical Schemes | Chosen Options | Input Settings |
|---|---|---|
| Microphysics | WSM-5 class | my_physics = 4 |
| Long-wave radiation | RRTM | ra_lw_physics = 1 |
| Short-wave radiation | RRTMG | ra_sw_physics = 4 |
| Surface layer | MM5 | sf_sfclay_physics = 1 |
| Land surface model | Noah | sf_surface_physics = 2 |
| Boundary layer | Yonsei University | bl_pbl_physics = 3 |
| Cumulus | Grell–Devenyi | cu_physics = 3 |
| City | 2010 | 2011 | 2012 | 2013 | 2014 | 2015 | 2016 | 2017 | 2018 | 2019 | |
|---|---|---|---|---|---|---|---|---|---|---|---|
| (1) | Shanghai | 390.25 | 393.04 | 394.94 | 397.00 | 399.49 | 402.02 | 405.58 | 408.40 | 410.64 | 413.07 |
| (2) | Nanjing | 390.38 | 392.26 | 394.62 | 397.27 | 399.50 | 401.61 | 405.34 | 408.26 | 410.40 | 412.74 |
| (3) | Suzhou | 390.22 | 393.07 | 394.87 | 396.85 | 399.62 | 401.91 | 405.65 | 408.37 | 410.34 | 412.99 |
| (4) | Hangzhou | 389.82 | 393.02 | 395.14 | 397.12 | 399.81 | 402.12 | 405.22 | 407.71 | 410.78 | 412.71 |
| (5) | Wenzhou | 389.72 | 392.11 | 395.14 | 397.03 | 399.73 | 402.11 | 405.77 | 408.02 | 410.80 | 412.78 |
| (6) | Hefei | 390.29 | 392.35 | 394.53 | 397.29 | 399.31 | 401.54 | 405.34 | 408.17 | 410.29 | 412.44 |
| (7) | Wuhu | 390.47 | 392.47 | 394.61 | 396.93 | 399.59 | 401.63 | 405.30 | 408.16 | 410.69 | 412.62 |
| (8) | Fuzhou | 389.95 | 391.97 | 395.04 | 396.71 | 399.62 | 402.05 | 405.90 | 408.67 | 410.59 | 412.69 |
| (9) | Quanzhou | 390.11 | 392.66 | 394.39 | 397.02 | 399.26 | 402.00 | 405.51 | 408.47 | 410.46 | 412.77 |
| (10) | Nanchang | 389.89 | 392.79 | 395.17 | 396.96 | 399.89 | 402.03 | 405.66 | 408.29 | 410.38 | 412.66 |
| (11) | Ganzhou | 390.14 | 392.53 | 394.70 | 396.71 | 399.48 | 402.08 | 405.68 | 408.23 | 410.25 | 412.57 |
| (12) | Wuhan | 389.92 | 392.88 | 394.53 | 397.34 | 399.60 | 401.70 | 405.49 | 407.94 | 410.35 | 412.62 |
| (13) | Xiangyang | 390.27 | 392.40 | 394.59 | 397.18 | 399.22 | 401.77 | 405.25 | 408.11 | 410.14 | 412.19 |
| (14) | Changsha | 389.95 | 392.71 | 395.27 | 397.30 | 399.91 | 402.12 | 405.75 | 408.04 | 410.56 | 412.59 |
| (15) | Hengyang | 389.50 | 392.77 | 395.10 | 396.84 | 399.42 | 402.17 | 405.70 | 408.30 | 410.20 | 412.55 |
| (16) | Guangzhou | 390.45 | 392.84 | 394.45 | 397.41 | 398.91 | 402.02 | 405.82 | 408.15 | 410.21 | 412.66 |
| (17) | Shenzhen | 390.16 | 393.02 | 394.44 | 397.40 | 399.22 | 402.16 | 405.68 | 408.19 | 410.12 | 412.43 |
| (18) | Nanning | 389.92 | 393.06 | 394.81 | 396.76 | 399.33 | 401.71 | 405.55 | 408.04 | 410.24 | 412.33 |
| (19) | Guilin | 389.99 | 393.10 | 394.47 | 396.58 | 399.60 | 402.23 | 405.46 | 408.53 | 410.33 | 412.53 |
| (20) | Haikou | 389.57 | 392.36 | 394.29 | 397.43 | 399.27 | 401.47 | 405.60 | 407.13 | 409.93 | 412.05 |
| (21) | Sanya | 389.50 | 391.66 | 394.26 | 396.43 | 398.91 | 401.24 | 405.19 | 407.09 | 409.64 | 412.20 |
| (22) | Chongqing | 389.86 | 391.85 | 394.87 | 397.21 | 399.44 | 401.54 | 405.53 | 407.84 | 410.12 | 412.29 |
| (23) | Chengdu | 390.46 | 392.15 | 395.01 | 397.49 | 399.53 | 401.81 | 405.59 | 407.99 | 410.09 | 412.60 |
| (24) | Luzhou | 389.84 | 392.12 | 394.95 | 397.30 | 399.54 | 401.55 | 405.58 | 407.81 | 410.18 | 412.30 |
| (25) | Guiyang | 390.21 | 392.39 | 394.47 | 396.85 | 399.56 | 401.82 | 405.28 | 408.26 | 410.29 | 412.32 |
| (26) | Kunming | 390.31 | 392.67 | 394.29 | 397.13 | 399.19 | 401.22 | 405.01 | 407.89 | 409.55 | 411.90 |
| (27) | Qujing | 389.81 | 392.71 | 394.47 | 397.26 | 399.47 | 401.40 | 405.28 | 408.19 | 410.03 | 412.28 |
| No. | Municipality | A1 | A2 | A3 | A4 | A5 | A6 |
|---|---|---|---|---|---|---|---|
| (1) | Shanghai | 2.23 | 0.49 | −0.26 | 0.49 | 388.66 | 2.55 |
| (2) | Nanjing | 2.33 | 0.99 | −0.50 | 0.35 | 388.54 | 2.54 |
| (3) | Suzhou | 2.12 | 0.71 | −0.34 | 0.46 | 388.73 | 2.53 |
| (4) | Hangzhou | 1.99 | 0.28 | −0.33 | 0.40 | 388.72 | 2.52 |
| (5) | Wenzhou | 2.35 | 0.42 | −0.38 | 0.44 | 388.38 | 2.58 |
| (6) | Hefei | 2.34 | 0.99 | −0.49 | 0.35 | 388.58 | 2.51 |
| (7) | Wuhu | 2.13 | 0.91 | −0.57 | 0.27 | 388.57 | 2.53 |
| (8) | Fuzhou | 2.05 | 0.24 | −0.44 | 0.32 | 388.31 | 2.60 |
| (9) | Quanzhou | 2.13 | 0.18 | −0.46 | 0.32 | 388.45 | 2.55 |
| (10) | Nanchang | 2.09 | 0.49 | −0.44 | 0.26 | 388.71 | 2.53 |
| (11) | Ganzhou | 1.82 | 0.38 | −0.47 | 0.32 | 388.52 | 2.54 |
| (12) | Wuhan | 2.23 | 1.07 | −0.50 | 0.42 | 388.64 | 2.52 |
| (13) | Xiangyang | 2.31 | 0.69 | −0.54 | 0.21 | 388.63 | 2.49 |
| (14) | Changsha | 2.17 | 0.52 | −0.33 | 0.32 | 388.78 | 2.52 |
| (15) | Hengyang | 1.93 | 0.51 | −0.24 | 0.27 | 388.42 | 2.57 |
| (16) | Guangzhou | 1.87 | 0.28 | −0.24 | 0.46 | 388.73 | 2.51 |
| (17) | Shenzhen | 1.90 | 0.37 | −0.28 | 0.60 | 388.79 | 2.49 |
| (18) | Nanning | 1.89 | 0.26 | −0.46 | 0.43 | 388.65 | 2.50 |
| (19) | Guilin | 1.92 | 0.39 | −0.31 | 0.27 | 388.56 | 2.54 |
| (20) | Haikou | 2.08 | 0.31 | −0.38 | 0.58 | 388.47 | 2.50 |
| (21) | Sanya | 2.00 | 0.36 | −0.29 | 0.43 | 387.93 | 2.54 |
| (22) | Chongqing | 2.24 | 0.78 | −0.46 | 0.31 | 388.40 | 2.52 |
| (23) | Chengdu | 2.17 | 0.63 | −0.51 | 0.25 | 388.76 | 2.49 |
| (24) | Luzhou | 2.24 | 0.79 | −0.39 | 0.21 | 388.52 | 2.52 |
| (25) | Guiyang | 1.98 | 0.20 | −0.30 | 0.30 | 388.54 | 2.52 |
| (26) | Kunming | 1.97 | 0.23 | −0.39 | 0.29 | 388.71 | 2.43 |
| (27) | Qujing | 1.93 | 0.25 | −0.34 | 0.21 | 388.55 | 2.50 |
Disclaimer/Publisher’s Note: The statements, opinions and data contained in all publications are solely those of the individual author(s) and contributor(s) and not of MDPI and/or the editor(s). MDPI and/or the editor(s) disclaim responsibility for any injury to people or property resulting from any ideas, methods, instructions or products referred to in the content. |
© 2023 by the authors. Licensee MDPI, Basel, Switzerland. This article is an open access article distributed under the terms and conditions of the Creative Commons Attribution (CC BY) license (https://creativecommons.org/licenses/by/4.0/).
Share and Cite
Tan, Z.; Wang, J.; Yu, Z.; Luo, Y. Spatiotemporal Analysis of XCO2 and Its Relationship to Urban and Green Areas of China’s Major Southern Cities from Remote Sensing and WRF-Chem Modeling Data from 2010 to 2019. Geographies 2023, 3, 246-267. https://doi.org/10.3390/geographies3020013
Tan Z, Wang J, Yu Z, Luo Y. Spatiotemporal Analysis of XCO2 and Its Relationship to Urban and Green Areas of China’s Major Southern Cities from Remote Sensing and WRF-Chem Modeling Data from 2010 to 2019. Geographies. 2023; 3(2):246-267. https://doi.org/10.3390/geographies3020013
Chicago/Turabian StyleTan, Zixuan, Jinnian Wang, Zhenyu Yu, and Yiyun Luo. 2023. "Spatiotemporal Analysis of XCO2 and Its Relationship to Urban and Green Areas of China’s Major Southern Cities from Remote Sensing and WRF-Chem Modeling Data from 2010 to 2019" Geographies 3, no. 2: 246-267. https://doi.org/10.3390/geographies3020013
APA StyleTan, Z., Wang, J., Yu, Z., & Luo, Y. (2023). Spatiotemporal Analysis of XCO2 and Its Relationship to Urban and Green Areas of China’s Major Southern Cities from Remote Sensing and WRF-Chem Modeling Data from 2010 to 2019. Geographies, 3(2), 246-267. https://doi.org/10.3390/geographies3020013


