
Nature–Human Relational Models in a Riverine Social–Ecological System: San Marcos River, TX, USA


Abstract
1. Introduction
2. Theoretical Background: Toward a Nature–Human Relational Model
3. Materials and Methods
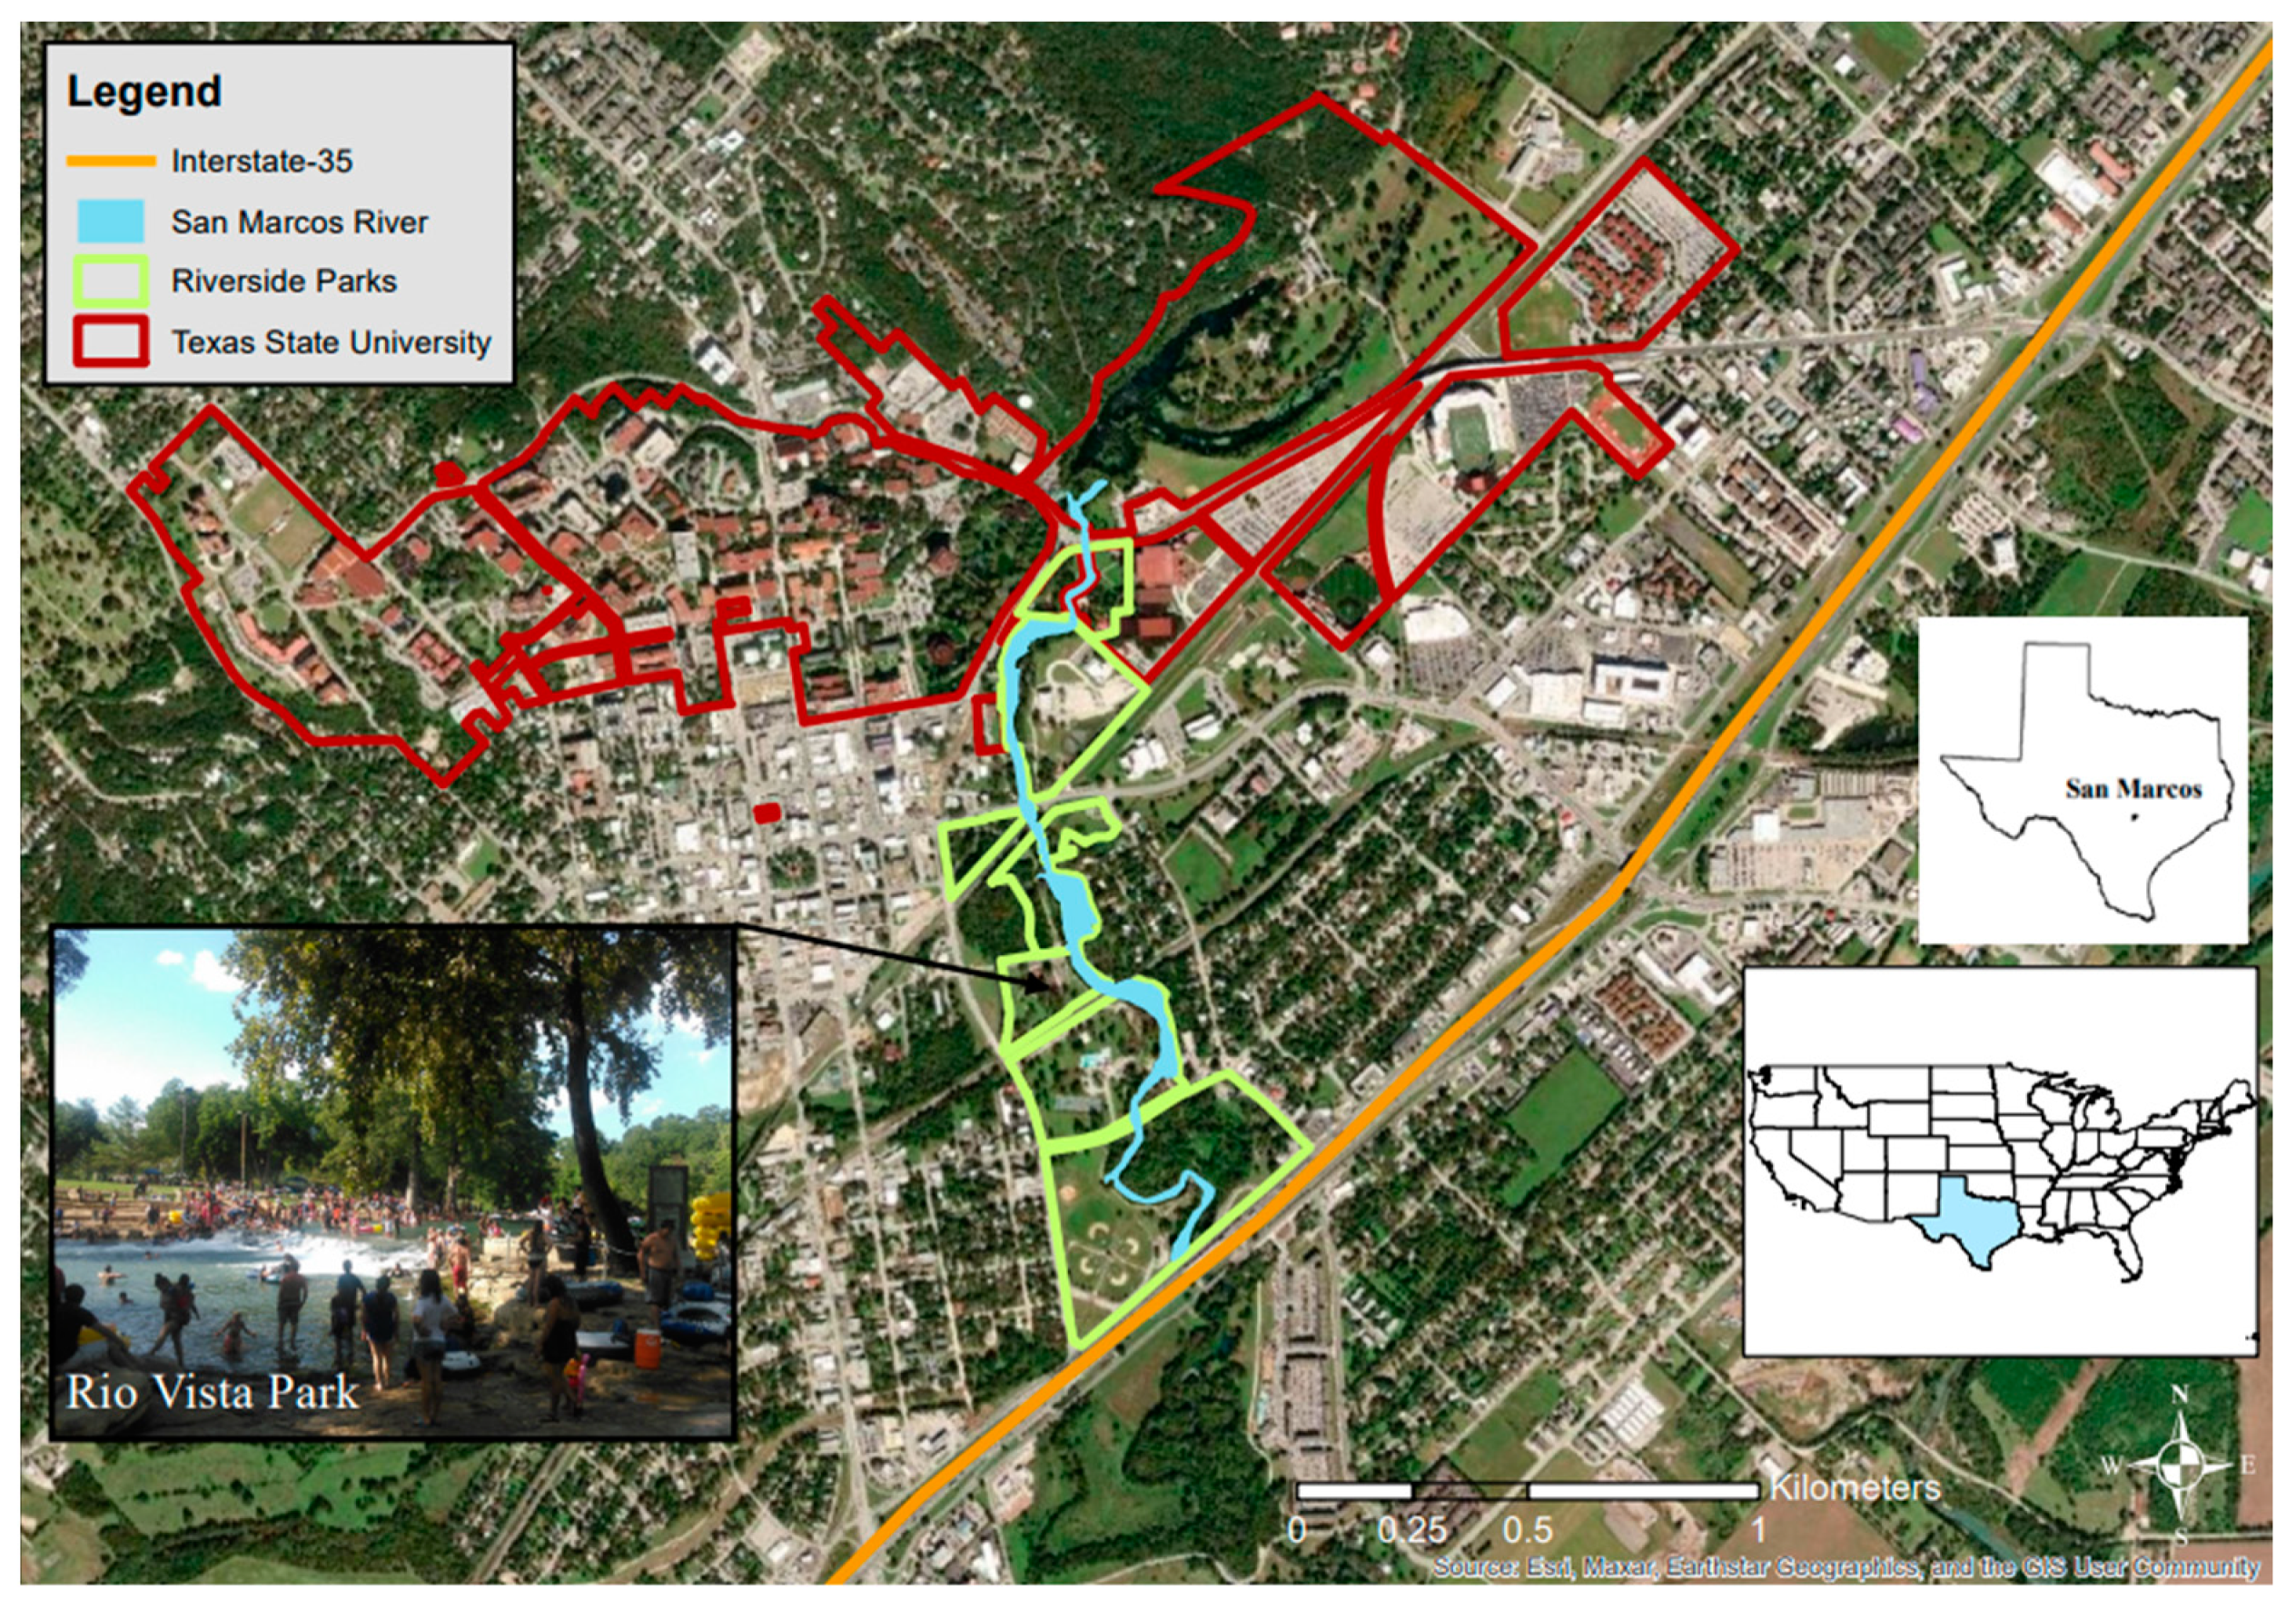
3.1. Study Area: San Marcos River Social–Ecological System (SES)
3.2. Data and Methods
3.3. Framing Conventional Metrics to Relational Models
4. Results
4.1. Social Actors and Social Demand
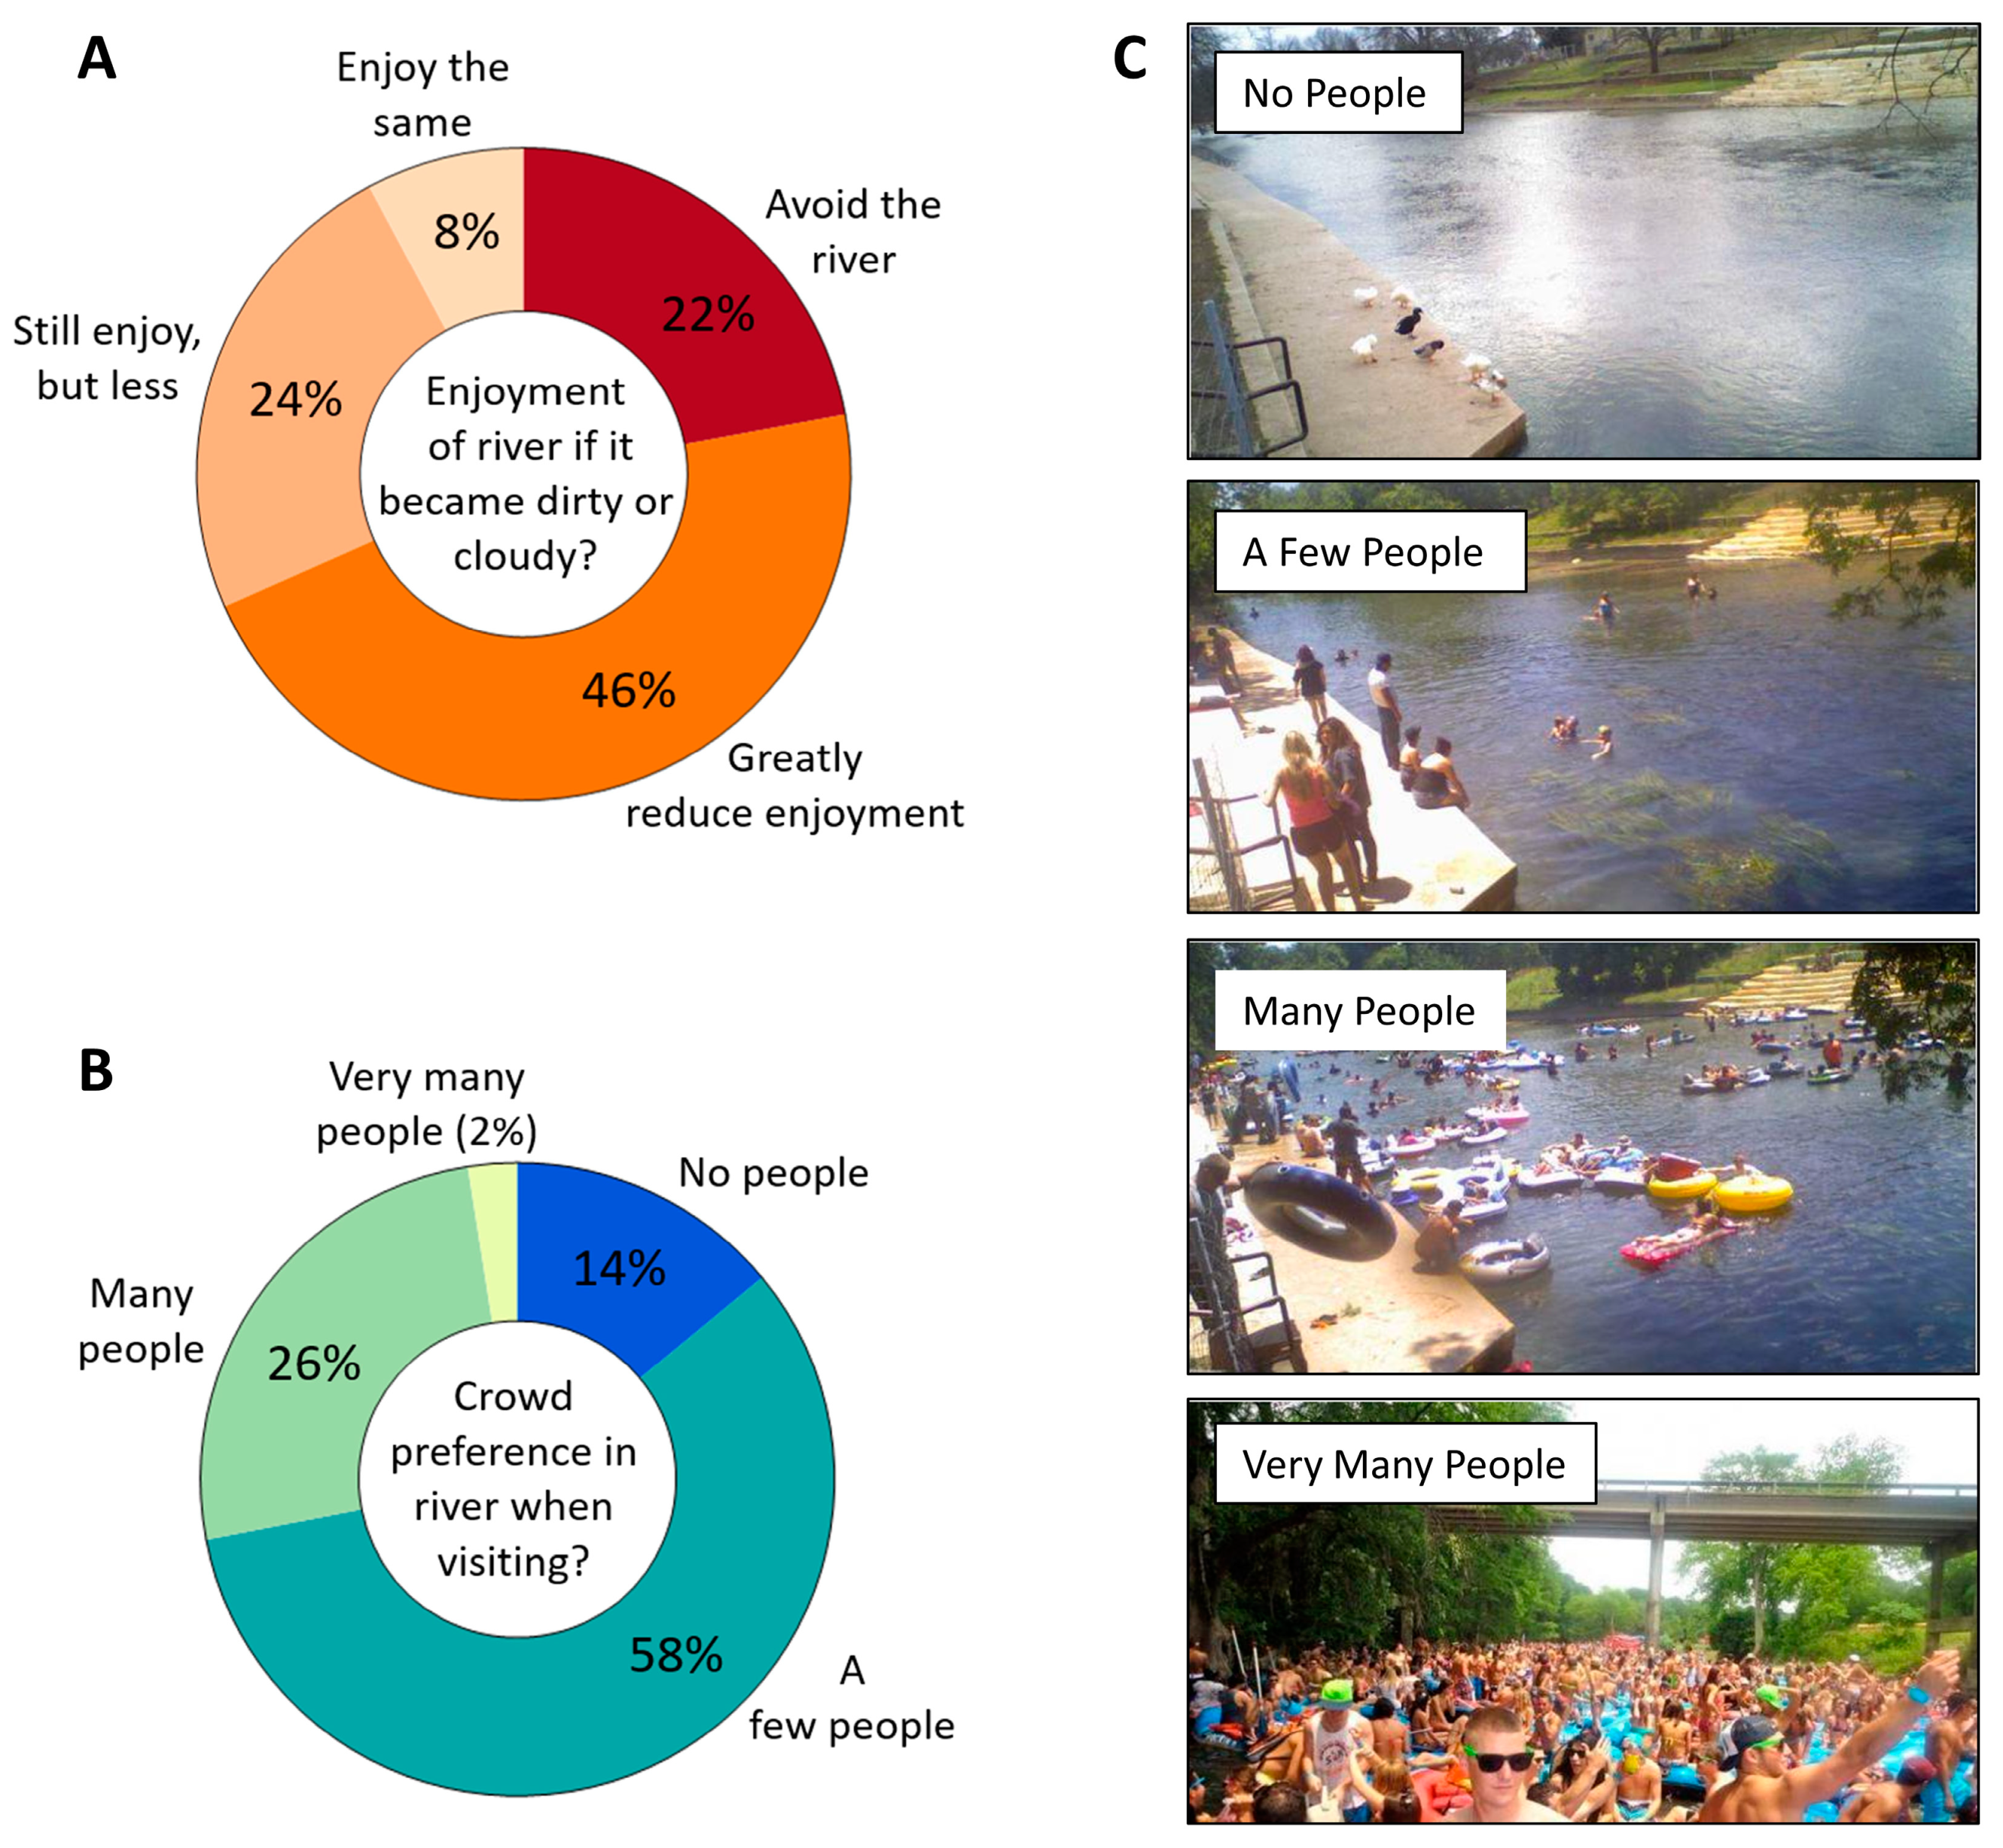
4.2. Perceptions and Preferences
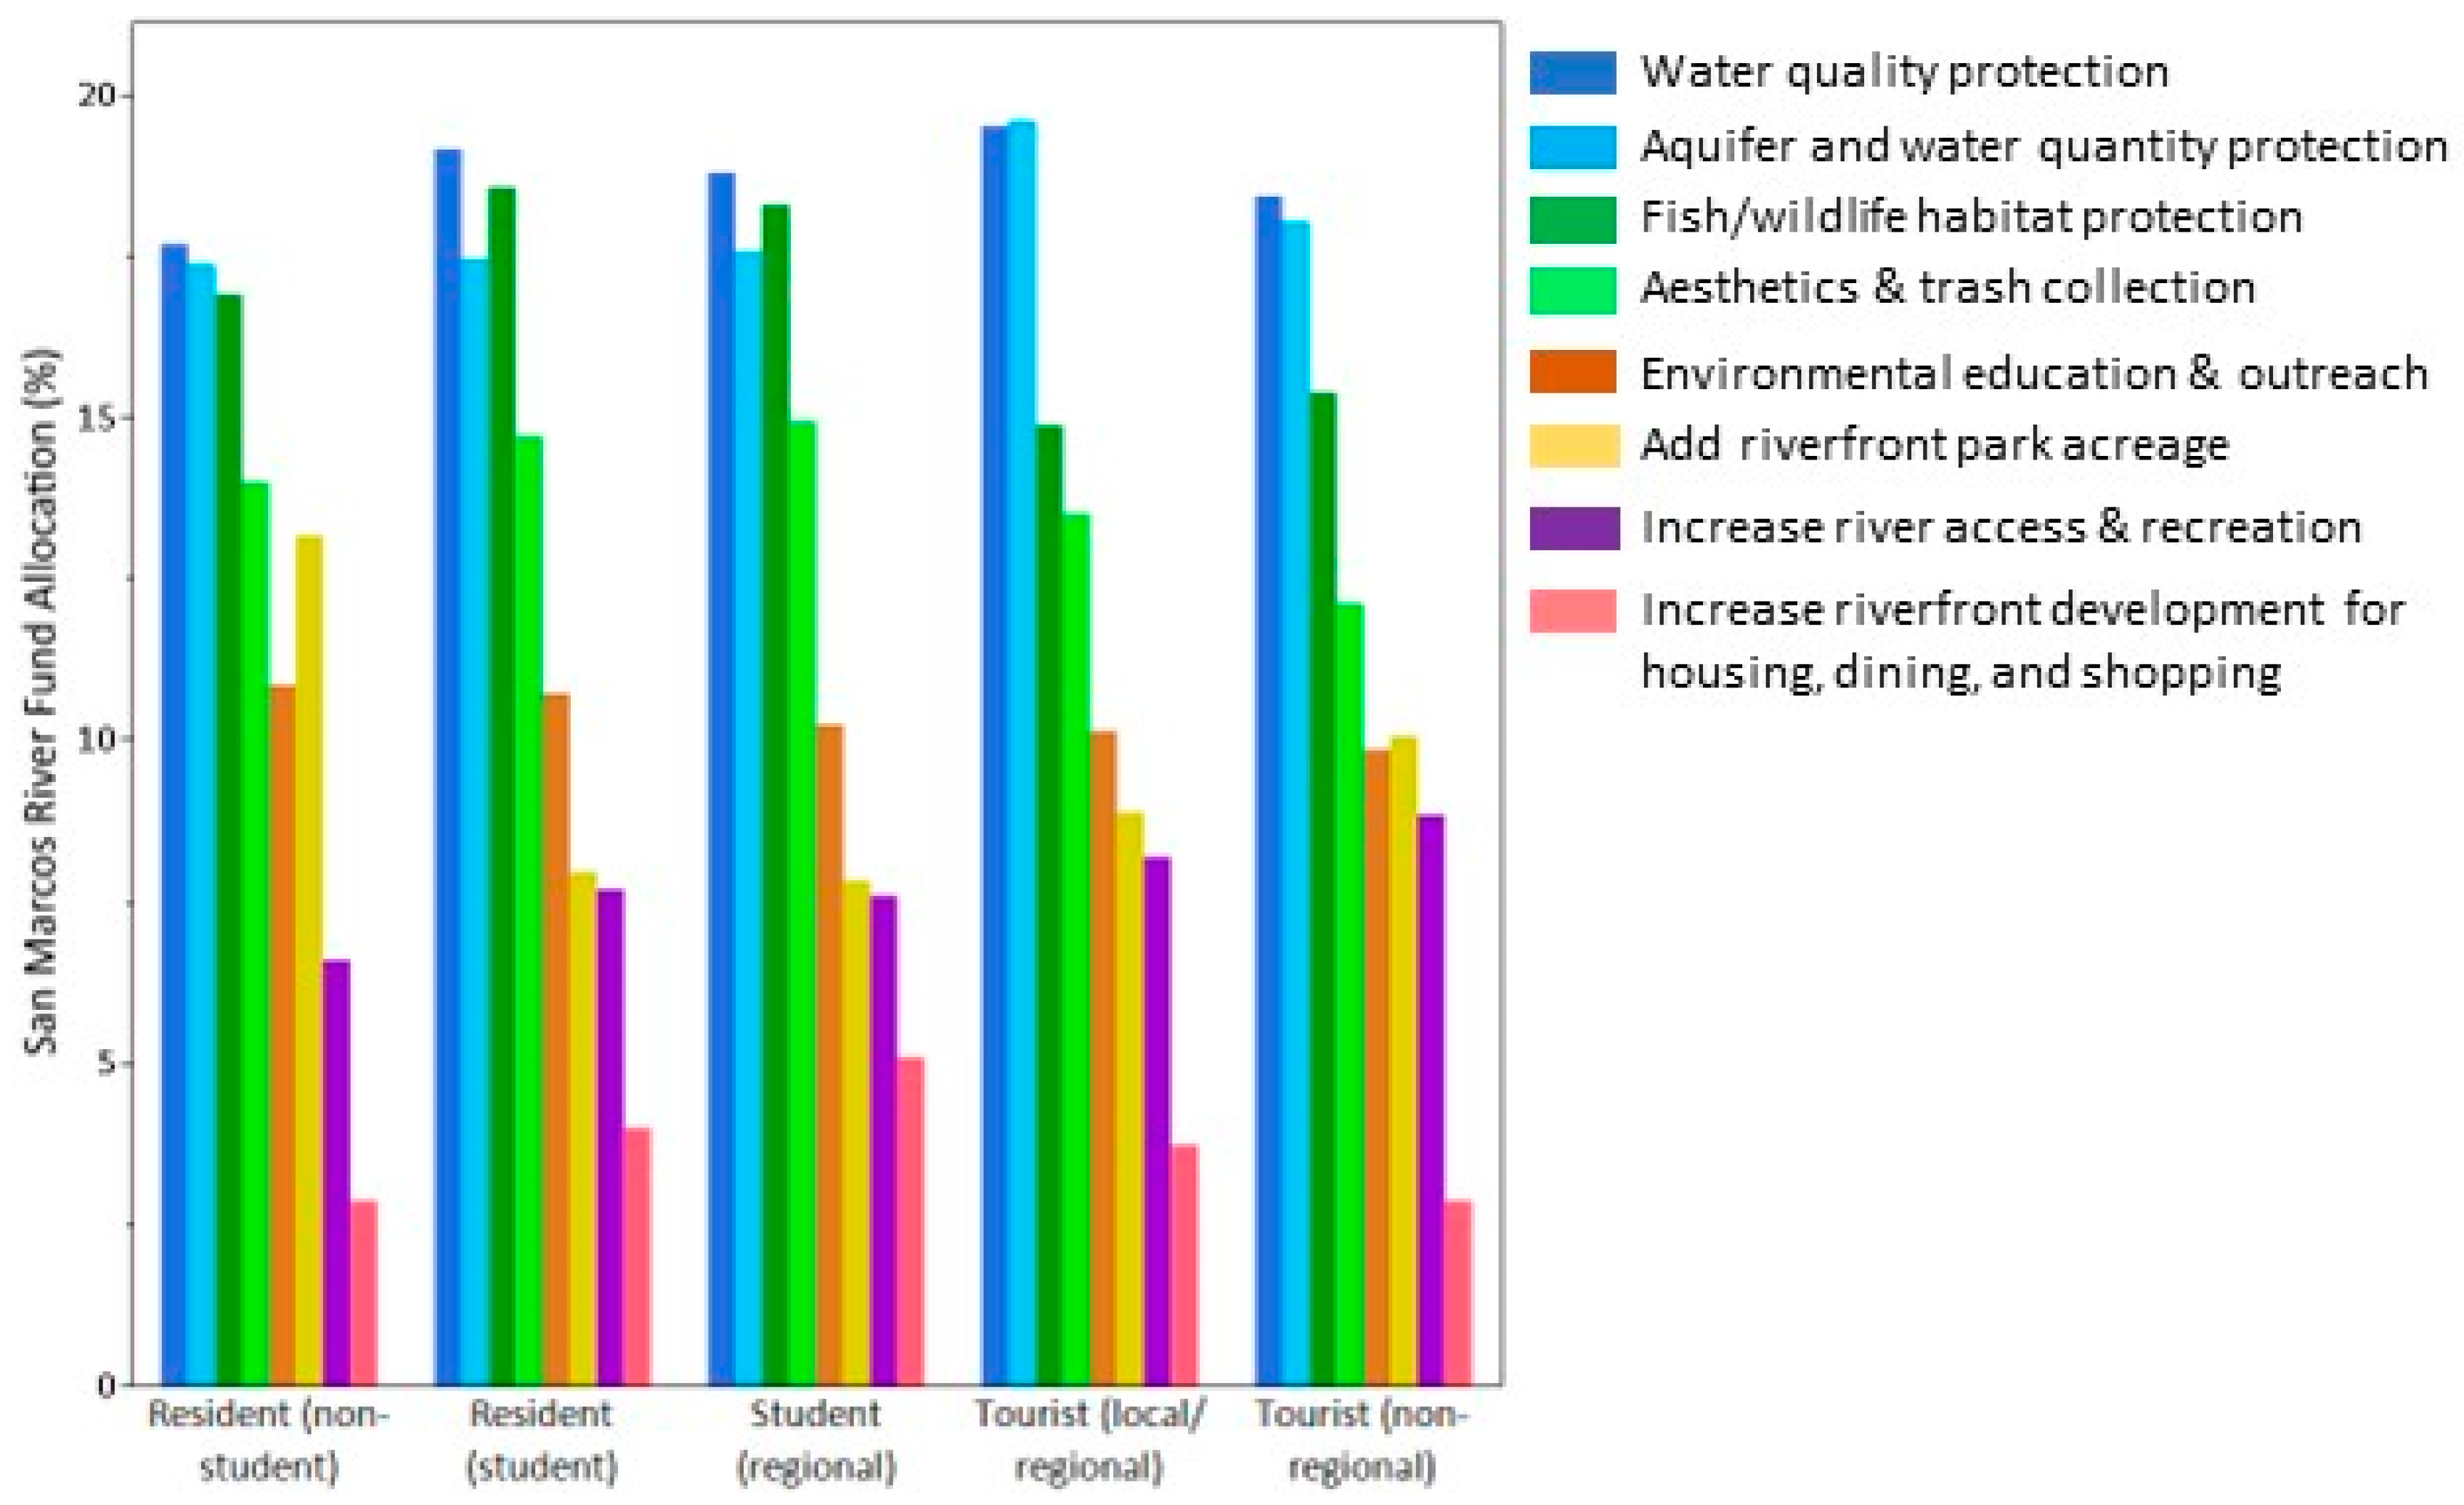
4.3. Ecosystem Services and Environmental Values
4.4. Relational Models
5. Discussion
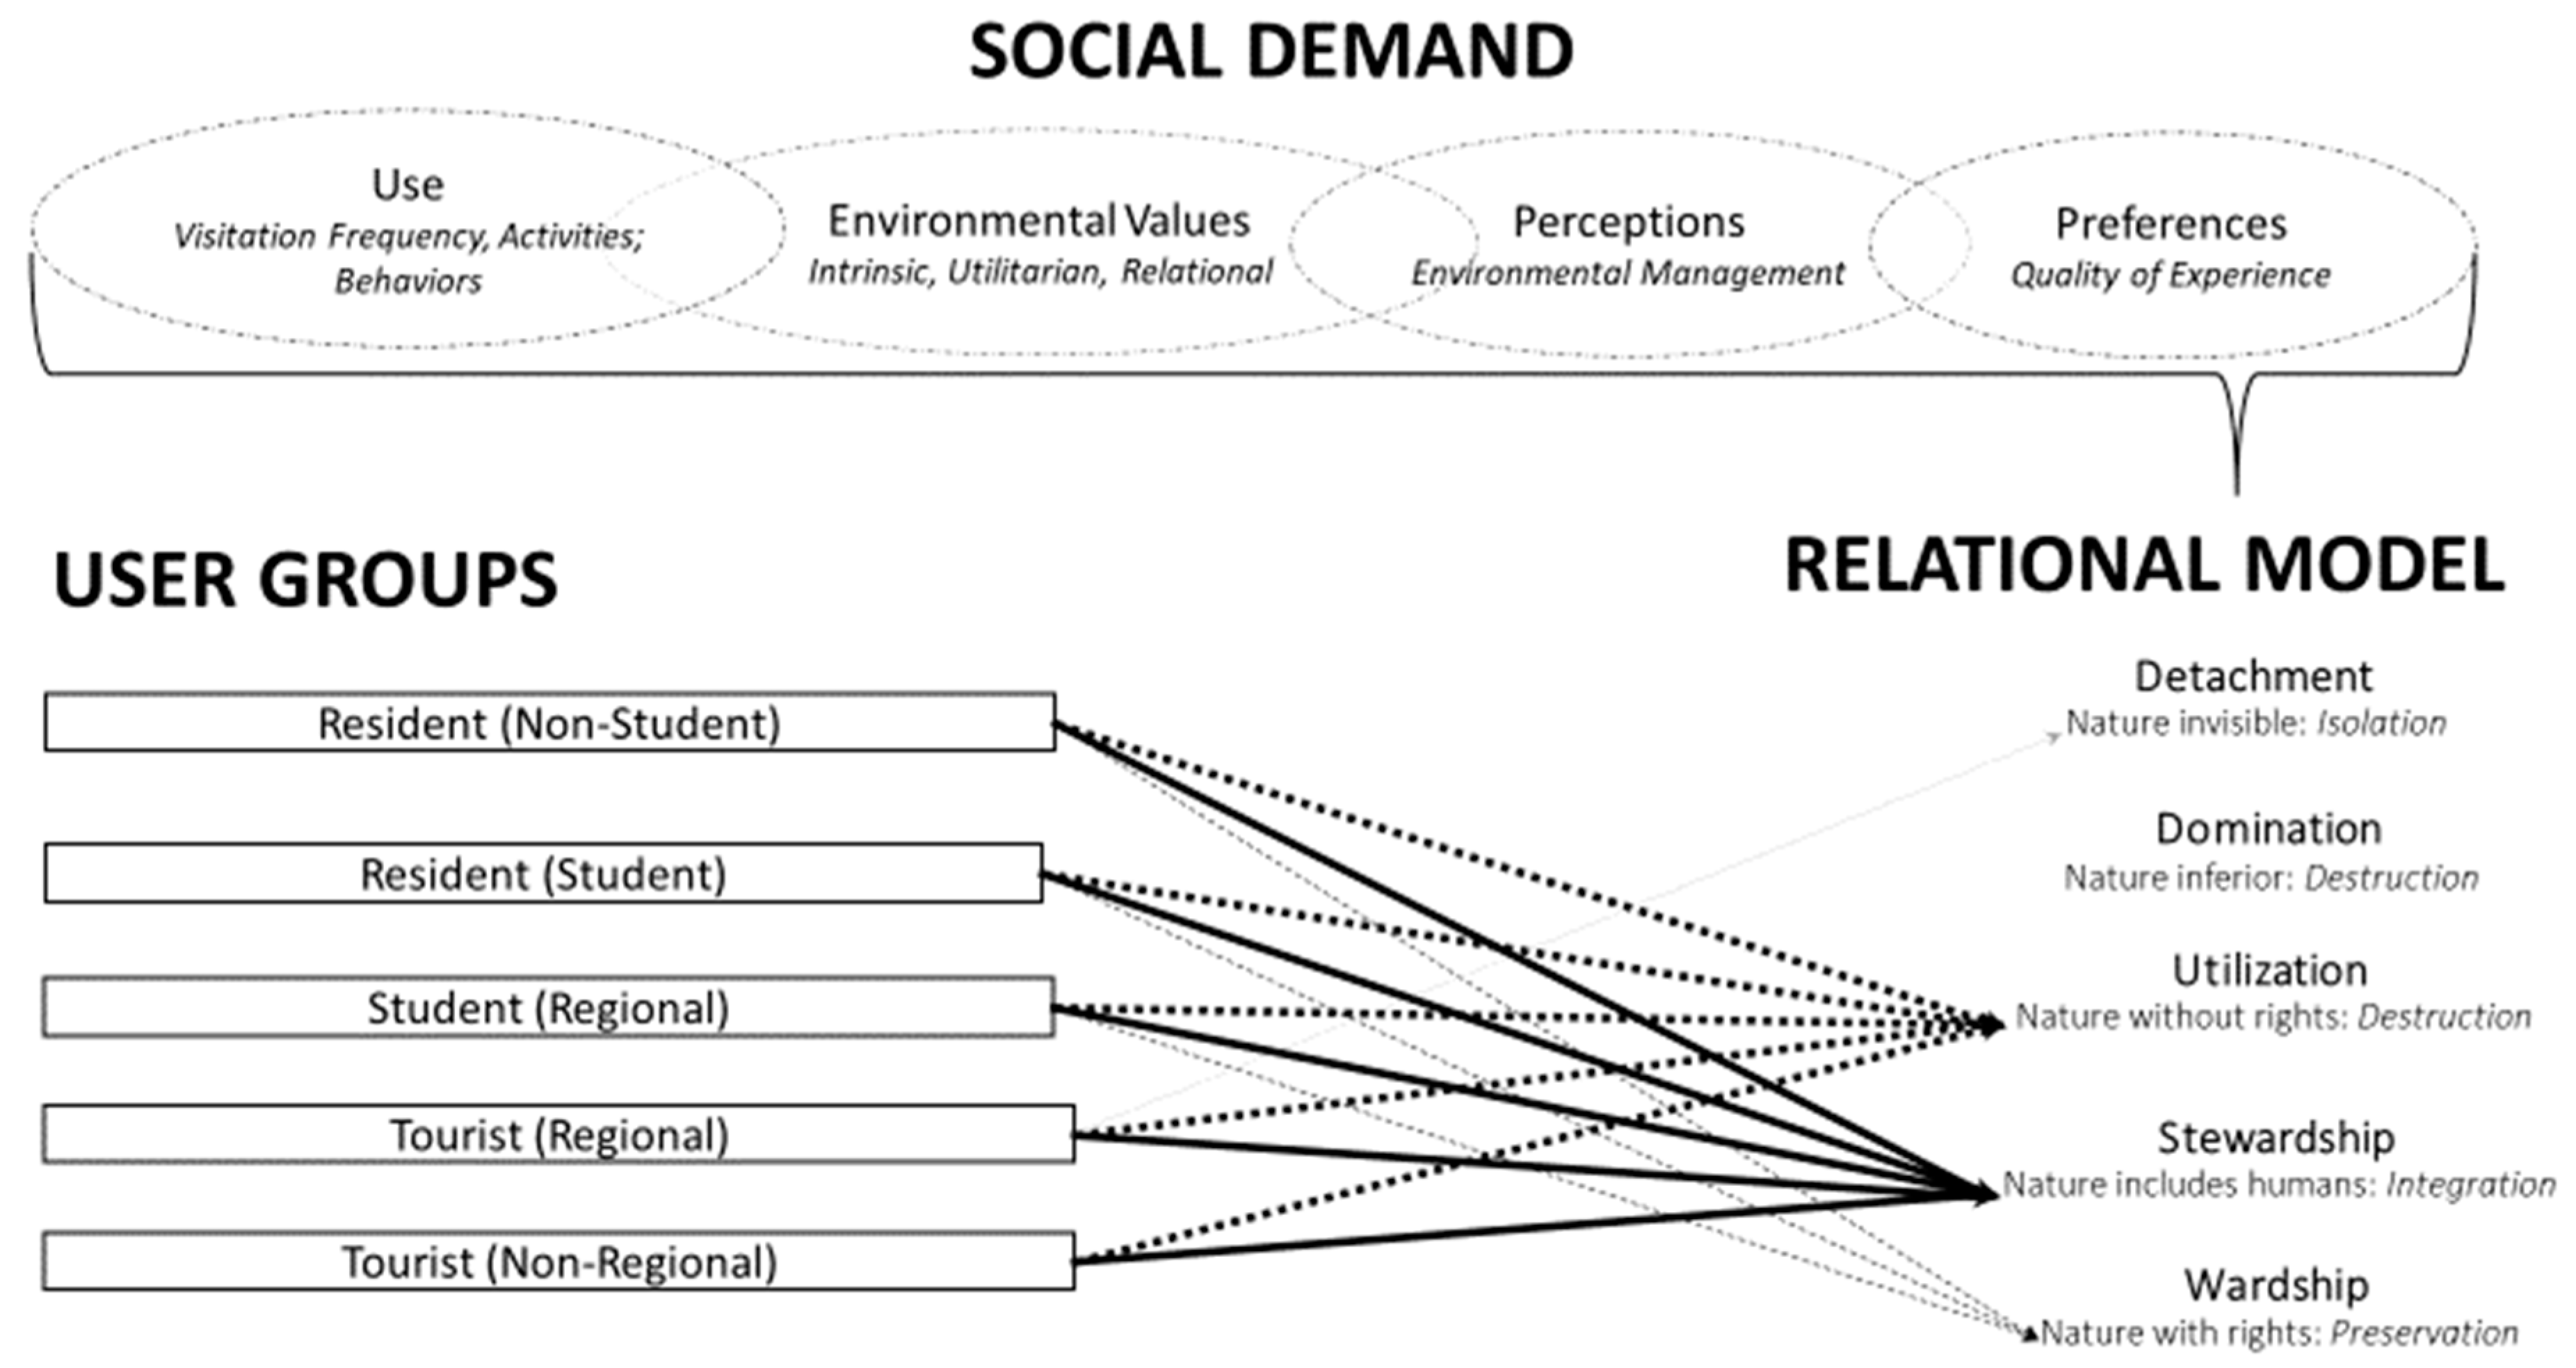
5.1. Relational Models Built from Social Demand
“I think it’s pointless to keep weeds in the water. All to save some rice?? Sorry but I put humans needs over rice....” (Resident, student; punctuation original)
“Don’t restrict access because of wild rice.” (Resident, non-student)
“The rice grass is growing too much it makes the river look really gross and tacky.” (Resident, non-student)
“Sometimes we spend too much time and money protecting the endangered species in preference to making it a nicer recreational area. Cut the weeds, they grow back and I think we pay far too much time and money to protect the wild rice. It grows back.” (Resident, student)
“Stop making barricades in the river to save the over abundance of wild rice grass.” (Resident, student)
“Trim some of the grass so it’s not sticking out of the water.” (Resident, student)
5.2. Our Relationship with Nature Is a Shared Value
5.3. Social Connectivity and Place Identity
6. Conclusions
Author Contributions
Funding
Acknowledgments
Conflicts of Interest
Appendix A. Survey Questionnaire
A Survey of Peoples’ Use and Value of the San Marcos River
- Are you willing to participate in this survey?
- Yes/No
- Have you already taken the San Marcos River Use and Value Survey?
- Yes/No
| Landscaping, beautification, and trash collection | |
| Increase public outreach and environmental education | |
| Aquifer and water quantity protection | |
| Increase access and recreational opportunities for kayaks, canoes, tubes, and swimming | |
| Add acreage to existing riverfront parks | |
| Water quality protection | |
| Increase riverfront development for housing, dinning, and shopping | |
| Fish and wildlife habitat protection and restoration | |
| Total % | 100% |
| Landscaping, beautification, and trash collection | $ |
| Increase public outreach and environmental education | $ |
| Aquifer and water quantity protection | $ |
| Increase access and recreational opportunities for kayaks, canoes, tubes, and swimming | $ |
| Add acreage to existing riverfront parks | $ |
| Water quality protection | $ |
| Increase riverfront development for housing, dinning, and shopping | $ |
| Fish and wildlife habitat protection and restoration | $ |
| Total $ | $ |

Appendix B. User-Group Characteristics

| Characteristics | Resident (n = 362) | Resident (Student) (n = 1984) | Regional Student (n = 564) | Regional Tourist (n = 167) | Nonregional Tourist (n = 68) |
|---|---|---|---|---|---|
| Years in SM | Range: 0–73 | Range: 0–52 | N/A | N/A | N/A |
| Median: 9 | Median: 2 | ||||
| Mean: 15 | Mean: 3 | ||||
| Race/Ethnicity | |||||
| Nonwhite | 31% | 40% | 38% | 54% | 33% |
| White | 69% | 60% | 62% | 46% | 67% |
| Gender | |||||
| Female | 58% | 69% | 72% | 61% | 59% |
| Male | 42% | 31% | 28% | 39% | 41% |
| Age | |||||
| <25 | 21% | 76% | 77% | 18% | 15% |
| 25–34 | 18% | 17% | 16% | 21% | 23% |
| 35–44 | 16% | 4% | 3% | 17% | 22% |
| 45–54 | 14% | 2% | 2% | 16% | 10% |
| 55–64 | 19% | - | 2% | 15% | 17% |
| 65+ | 11% | - | - | 13% | 13% |
| Education | |||||
| High School | 6% | - | - | 10% | 10% |
| Some College | 23% | 83% | 84% | 21% | 24% |
| Associate | 8% | - | - | 13% | 8% |
| Bachelor | 32% | 15% | 12% | 34% | 31% |
| Masters | 22% | 3% | 4% | 16% | 19% |
| Doctorate/Professional | 9% | - | - | 6% | 8% |
| Income | |||||
| <$20 k | 22% | 83% | 81% | 14% | 5% |
| $20–40 k | 19% | 10% | 10% | 12% | 21% |
| $40–60 k | 18% | 4% | 3% | 24% | 18% |
| $60–80 k | 12% | 2% | 2% | 14% | 21% |
| $80 k+ | 29% | 2% | 3% | 37% | 34% |
| Environment Raised | |||||
| Urban | 18% | 18% | 16% | 23% | 24% |
| Suburban | 53% | 57% | 61% | 47% | 53% |
| Rural | 29% | 25% | 23% | 30% | 24% |
| Loss of Water Clarity | |||||
| No change in use | 7% | 7% | 5% | 21% | 14% |
| Use less | 26% | 23% | 24% | 20% | 32% |
| Greatly reduce | 49% | 47% | 44% | 42% | 32% |
| Avoid | 18% | 22% | 26% | 17% | 22% |
| Crowding preference | |||||
| Do not visit | 1% | 3% | 3% | 2% | 3% |
| No people | 14% | 15% | 14% | 4% | 8% |
| A few people | 61% | 56% | 56% | 56% | 62% |
| Many people | 20% | 25% | 26% | 30% | 20% |
| Very many people | 5% | 2% | - | 9% | 8% |
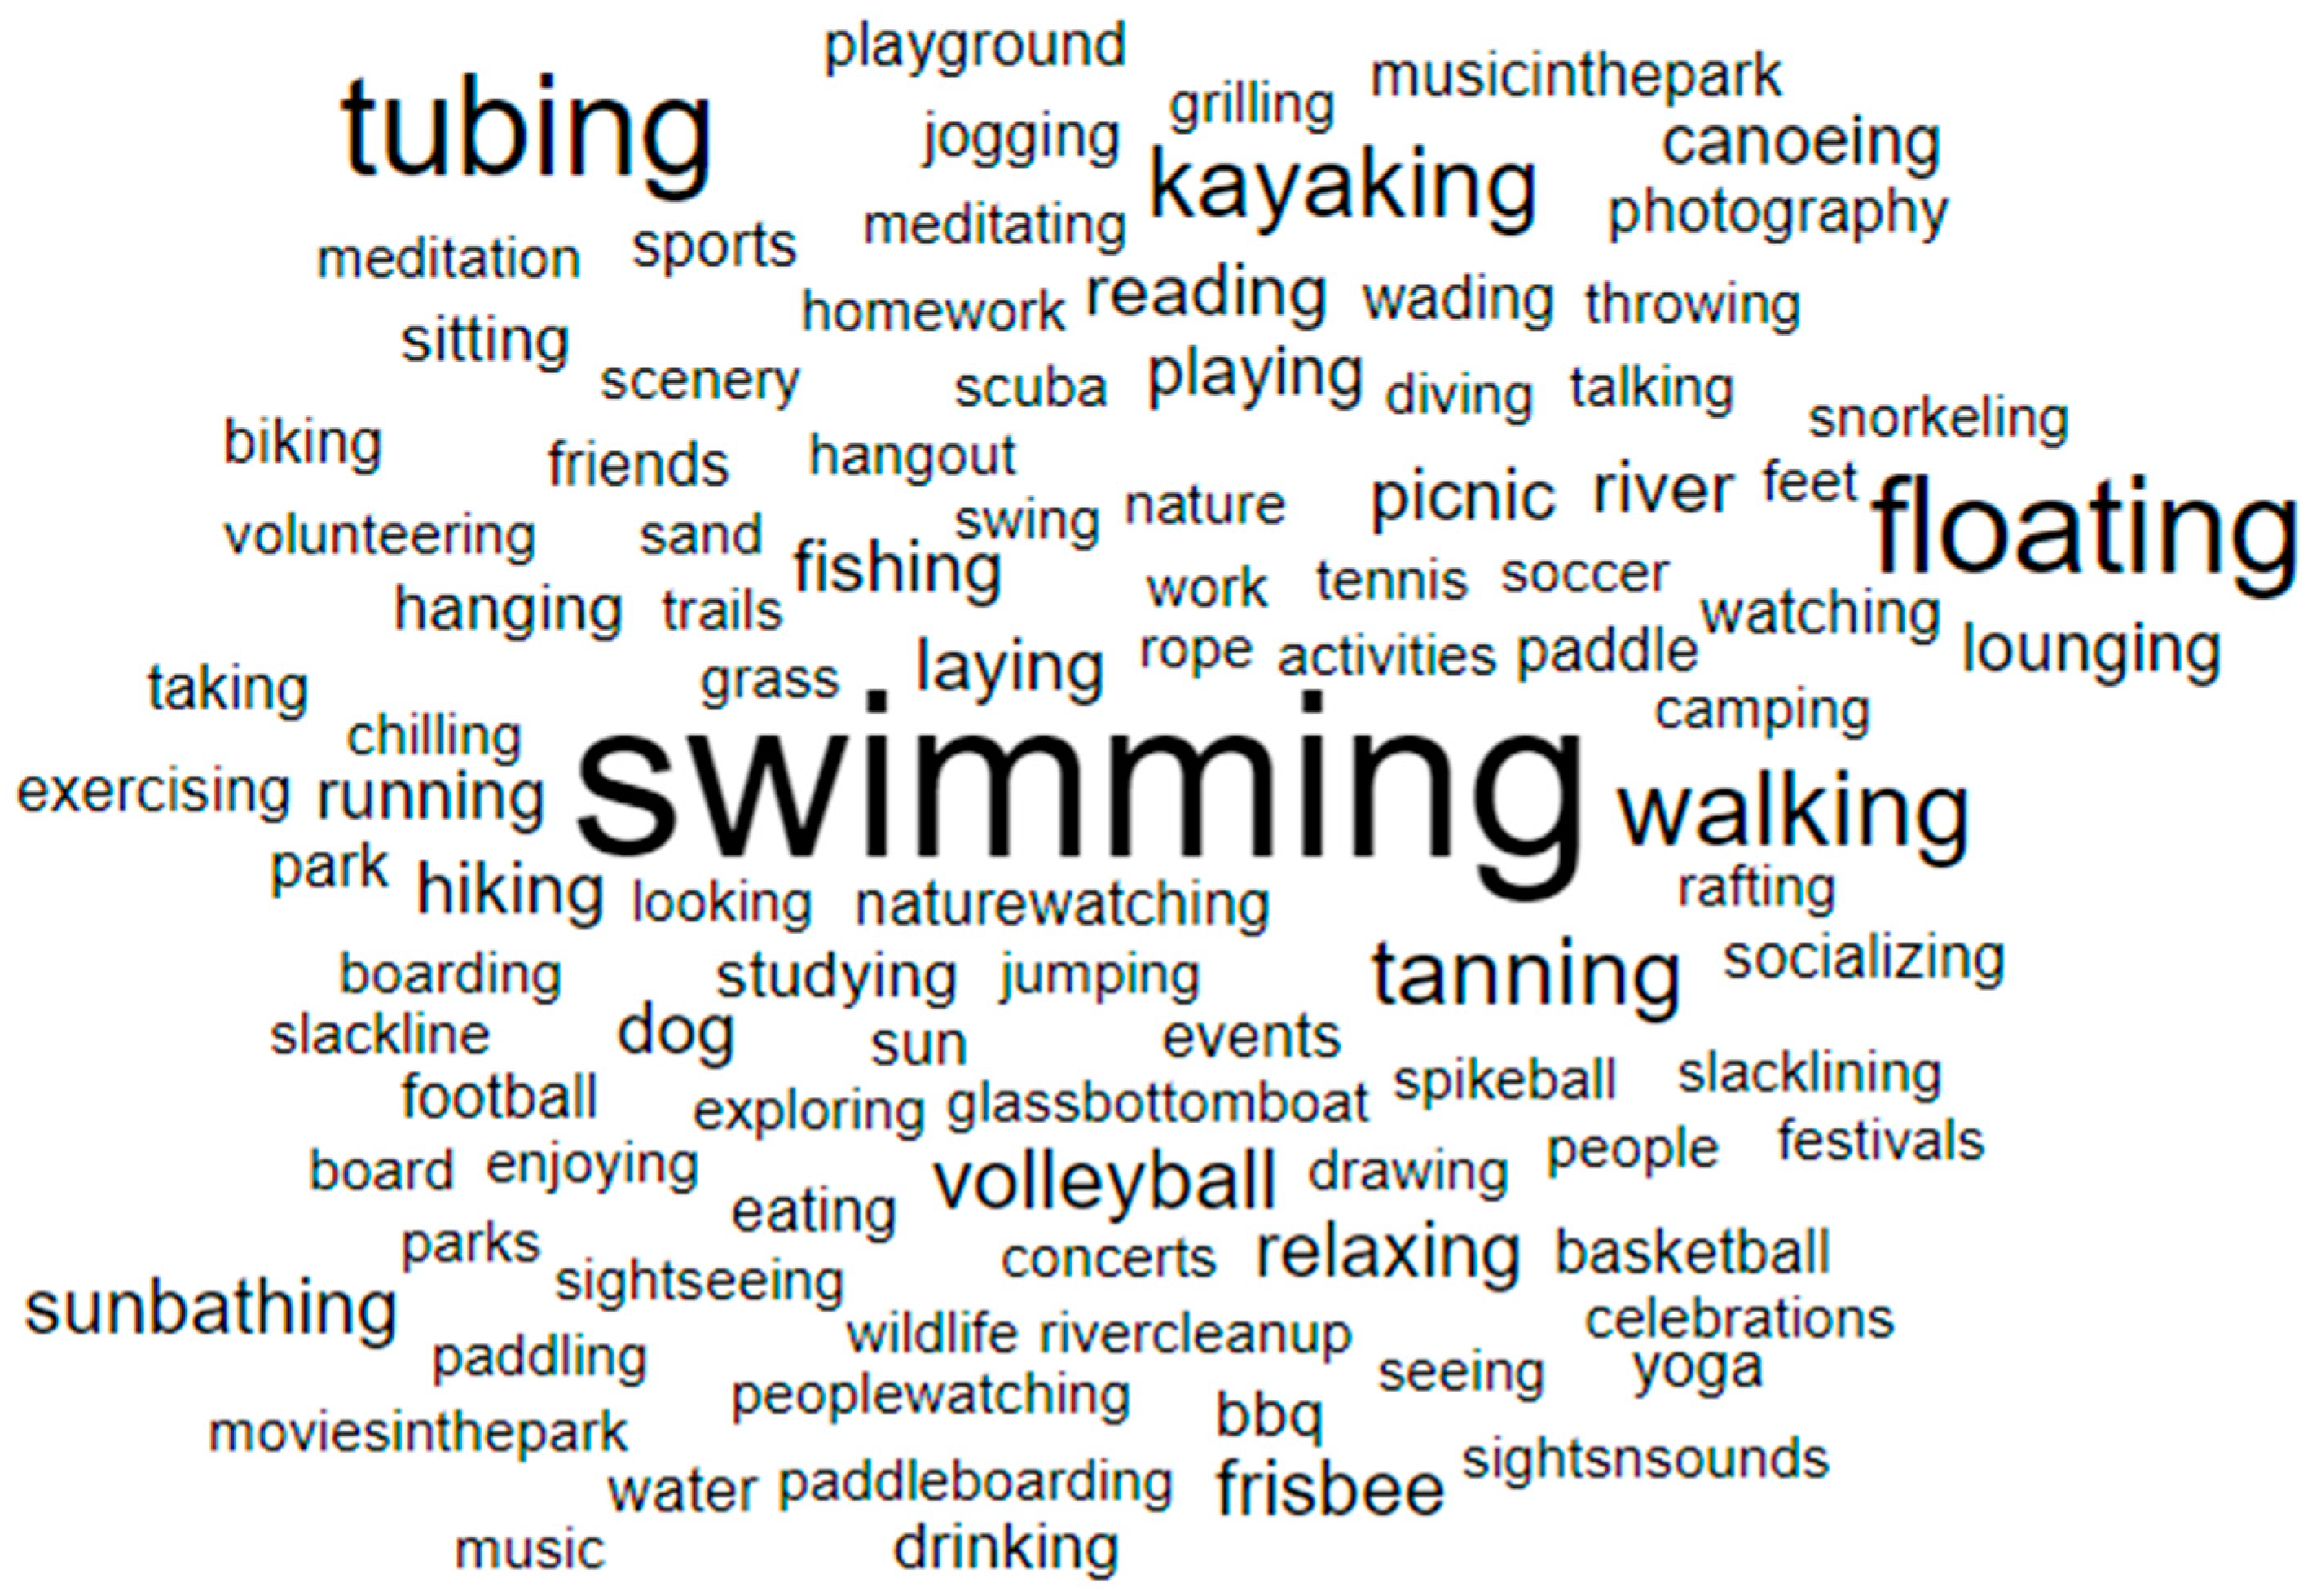
Appendix C. Activities
| User Group | All Participants | Resident Students | Resident Non-Students | Regional Students | Local/Regional Tourist | Non-Regional Tourist |
|---|---|---|---|---|---|---|
| % that listed at least 1 activity | 88.3 | 88.5 | 93.6 | 87.9 | 80.7 | 86.8 |
| Total # of activities | 7956 | |||||
| Avg. # of activities per person | 2.53 | 2.48 | 3.45 | 2.41 | 1.79 | 1.62 |
| Most common activity (#) | Swimming | Swimming (1008) | Swimming (237) | Swimming (295) | Floating/Tubing (65) | Floating/Tubing (31) |
| % of respondents who listed most common activities | 48.1 | 48.3 | 56.8 | 48.8 | 37.8 | 42.6 |
| 2nd most common activity (#) | Floating/Tubing (1326) | Floating/Tubing (845) | Socializing/Community Event/Picnic/Drinking (172) | Floating/Tubing (247) | Swimming (64) | Socializing/Community Event/Picnic/Drinking (16) |
| % of respondents that listed 2nd most common activity | 41.8 | 42.4 | 31.3 | 43.6 | 35.3 | 21.7 |
| 3rd most common activity (#) | Relaxing/Stress Relief/Meditation/Sunbathing (920) | Relaxing/Stress Relief/Meditation/Sunbathing (643) | Park Exercise (168) | Relaxing/Stress Relief/Meditation/Sunbathing (177) | Socializing/Community Event/Picnic/Drinking (43) | Swimming (15) |
| % of respondents that listed 3rd most common activity | 27.2 | 30.3 | 38.8 | 29.6 | 20.3 | 21.7 |
| Swimming | 1618 |
| Floating/Tubing | 1326 |
| Relaxing/Stress Relief/Meditation/Sunbathing | 920 |
| Park Exercise | 717 |
| Water Sports/Recreation | 650 |
| Park Sports/Recreation | 604 |
| Socializing/Community Event/Picnic/Drinking | 589 |
| Wildlife/Nature Viewing | 102 |
| Reading | 94 |
| Work/School/Research | 88 |
| Photography | 26 |
Appendix D. Perceptions and Preferences of Survey Respondents
| Perceptions on River Health and Watershed Management | Social Group: Residency (Years) | |||||||
|---|---|---|---|---|---|---|---|---|
| 1 Year | 2 Years | 3 Years | 4 Years | 5 Years | 6+ Years | Chi-Square p-Value | Post Hoc Summary | |
| The environmental health of the San Marcos River is well-managed and well-protected. | 4 3.9 0.85 | 4 3.77 0.89 | 4 3.85 0.81 | 4 3.74 0.86 | 4 3.67 0.99 | 4 3.46 1.08 | 40.0422 <0.0001 | 6 years differs from 1 year, 2 years, and 3 years 4 years differs from 1 year |
| Please describe how clean the San Marcos River is. | 4 4.0 0.80 | 4 3.94 0.83 | 4 3.99 0.77 | 4 3.91 0.78 | 4 3.94 0.94 | 4 3.83 0.90 | 12.6337 0.0271 | 6 years differs from 1 year |
| The San Marcos River and its environment are sensitive to rapid urban growth. | 5 4.40 0.74 | 5 4.41 0.75 | 5 4.39 0.72 | 5 4.47 0.76 | 5 4.40 0.74 | 5 4.65 0.65 | 34.8574 <0.0001 | 6 years differs from all years except 4 years |
| Perceptions on River Health and Watershed Management | Nonwhite | White | ||
|---|---|---|---|---|
| Med Mean SD | Chi p-Value | Interpretation | ||
| The environmental health of the San Marcos River is well-managed and well-protected. | 4 3.71 0.90 | 4 3.80 0.90 | 4.3497 0.0370 | White users perceive as more healthy. |
| Please describe how clean the San Marcos River is. | 4 3.92 0.82 | 4 3.96 0.83 | 2.4025 0.1212 | |
| The San Marcos River and its environment are sensitive to rapid urban growth. | 5 4.40 0.75 | 5 4.46 0.72 | 2.4789 0.1154 |
| Perceptions on River Health and Watershed Management | Social Group: Age | |||||||
|---|---|---|---|---|---|---|---|---|
| <25 | 25–34 | 35–44 | 45–54 | 55–64 | 65+ | Chi-Square p-Value | Post Hoc | |
| Med Mean SD | ||||||||
| The environmental health of the San Marcos River is well-managed and well-protected. | 4 3.79 0.88 | 4 3.79 0.84 | 4 3.63 0.96 | 4 3.64 1.06 | 4 3.58 1.08 | 4 3.44 0.94 | 13.6353 0.0188 | No differences |
| Please describe how clean the San Marcos River is. | 4 3.93 0.82 | 4 3.93 0.83 | 4 3.82 0.94 | 4 3.95 0.91 | 4 3.96 0.86 | 4 3.76 0.90 | 4.9279 0.4247 | |
| The San Marcos River and its environment are sensitive to rapid urban growth. | 5 4.40 0.74 | 5 4.45 0.72 | 5 4.46 0.73 | 5 4.57 0.70 | 5 4.68 0.63 | 5 4.69 0.64 | 33.8761 <0.0001 | <25 differs from 55–64 and 65+ 25–34 differs from 55–64 |
| Perceptions on River Health and Watershed Management | Social Group: Household Income in Thousands of Dollars per Year | ||||||
|---|---|---|---|---|---|---|---|
| <20 | 20–40 | 40–60 | 60–80 | 80+ | Chi-Square p-Value | Post Hoc Summary | |
| Med Mean SD | |||||||
| The environmental health of the San Marcos River is well-managed and well-protected. | 4 3.76 0.88 | 4 3.79 0.88 | 4 3.78 0.98 | 4 3.68 1.09 | 4 3.76 0.89 | 0.8783 0.9276 | |
| Please describe how clean the San Marcos River is. | 4 3.91 0.83 | 4 3.94 0.79 | 4 3.99 0.83 | 4 3.87 1.02 | 4 4.01 0.80 | 4.8909 0.2987 | |
| The San Marcos River and its environment are sensitive to rapid urban growth. | 5 4.40 0.73 | 5 4.47 0.73 | 5 4.59 0.72 | 5 4.53 0.71 | 5 4.54 0.70 | 24.7413 <0.0001 | <20 diff from 40–60 and 80 + |
| Perceptions on River Health and Watershed Management | Social Group: Education | |||||||
|---|---|---|---|---|---|---|---|---|
| High School | Some College | Associate | Bachelor | Master | PhD | Chi-Square p-Value | Post Hoc Summary | |
| Med Mean SD | ||||||||
| The environmental health of the San Marcos River is well-managed and well-protected. | 4 4.18 0.88 | 4 3.8 0.87 | 4 3.87 0.89 | 4 3.58 0.97 | 4 3.67 0.95 | 4 3.35 0.89 | 33.6249 <0.0001 | High School differs from Master and PhD Some College differs from PhD Bachelors differs from Some College and High School |
| Please describe how clean the San Marcos River is. | 4 4.11 0.85 | 4 3.94 0.67 | 4 4.02 0.8 | 4 3.86 0.9 | 4 3.9 0.8 | 4 3.97 0.82 | 4.8220 0.4380 | |
| The San Marcos River and its environment are sensitive to rapid urban growth. | 5 4.40 0.77 | 5 4.39 0.75 | 5 4.49 0.75 | 5 4.50 0.71 | 5 4.75 0.50 | 5 4.64 0.67 | 46.5611 <0.0001 | Bachelors differs from Some College and Masters Masters differs from Some College |
| Perceptions on River Health and Watershed Management | User Group | ||||||
|---|---|---|---|---|---|---|---|
| Resident (Non-Student) | Resident (Student) | Regional Student | Regional Tourist | Non-Regional Tourist | Chi-Square p-Value | Post Hoc Summary | |
| Med Mean SD | |||||||
| The environmental health of the San Marcos River is well-managed and well-protected. | 4 3.55 1.1 | 4 3.77 0.88 | 4 3.8 0.85 | 4 3.86 0.94 | 4 3.92 0.83 | 12.9956 0.0013 | Resident (Non-Student) differs from Regional Tourist and Student Resident |
| Please describe how clean the San Marcos River is. | 4 3.86 0.91 | 4 3.93 0.83 | 4 3.93 0.76 | 4 3.93 0.95 | 4 4.03 0.91 | 3.2786 0.5123 | |
| The San Marcos River and its environment are sensitive to rapid urban growth. | 5 4.71 0.59 | 5 4.40 0.74 | 5 4.42 0.73 | 5 4.34 0.77 | 5 4.39 0.76 | 58.3521 <0.0001 | Resident (Non-Student) differs from all other user groups. |
| Perceptions on River Health and Watershed Management | User Groups: Frequency | ||||
|---|---|---|---|---|---|
| Low | Medium | High | Chi p-Value | Post Hoc Summary | |
| The environmental health of the San Marcos River is well-managed and well-protected. | 4 3.87 0.88 | 4 3.78 0.90 | 4 3.73 0.92 | 11.0091 0.0041 | Low differs from High |
| Please describe how clean the San Marcos River is. | 4 4.00 0.83 | 4 3.96 0.78 | 4 3.91 0.85 | 8.4987 0.0143 | Low differs from High |
| The San Marcos River and its environment are sensitive to rapid urban growth. | 5 4.43 0.72 | 5 4.43 0.73 | 5 4.48 0.73 | 4.476 0.1067 | |
| Social Group: Residency (Years) | Chi-Square p-Value | |||||||
|---|---|---|---|---|---|---|---|---|
| 1 Year | 2 Years | 3 Years | 4 Years | 5 Years | 6+ Years | Post | ||
| Loss of Water Quality | 3 2.79 0.85 | 3 2.85 0.85 | 3 2.85 0.83 | 3 2.88 0.80 | 3 2.79 0.76 | 3 2.82 0.84 | 3.3980 0.6389 | |
| Crowding Preference | 2 2.26 0.68 | 2 2.17 0.66 | 2 2.20 0.65 | 2 2.11 0.71 | 2 2.04 0.63 | 2 2.04 0.68 | 29.7388 <0.0001 | 1 year differs from 4, 5, and 6 years 2 years differs from 6 years |
| White | Nonwhite | Chi-Square p-Value | |
|---|---|---|---|
| Loss of Water Quality | 3 2.79 0.84 | 3 2.83 0.88 | 9.554 0.3284 |
| Crowding Preference | 2 2.15 0.70 | 2 2.30 0.84 | 13.8414 0.0002 |
| Social Group: Age | |||||||
|---|---|---|---|---|---|---|---|
| <25 | 25–34 | 35–44 | 45–54 | 55–64 | 65+ | Chi-Square p-Value | |
| Loss of WQ | 3 2.85 0.84 | 3 2.83 0.90 | 3 2.75 0.88 | 3 2.74 0.88 | 3 2.82 0.83 | 3 2.65 0.93 | 5.1199 0.4014 |
| Crowding Preference | 2 2.16 0.7 | 2 2.15 0.67 | 2 2.28 0.75 | 2 2.24 0.64 | 2 2.18 0.67 | 2 2.08 0.60 | 5.6094 0.3461 |
| Income: | <20 k | 20–40 | 40–60 | 60–80 | |||
| Loss of WQ | 3 2.87 0.85 | 3 2.76 0.88 | 3 2.73 0.86 | 3 2.75 0.86 | 10.9633 0.0270 | ||
| Crowding Preference | 2 2.14 0.69 | 2 2.24 0.71 | 2 2.22 0.71 | 2 2.11 0.69 | 9.2198 0.0558 | ||
| Social Group: Education | Post Hoc | |||||||
|---|---|---|---|---|---|---|---|---|
| High School | Some College | Associate | Bachelor | Masters | PhD | Chi-Square p-Value | ||
| Loss of WQ | 3 2.66 1.11 | 3 2.85 0.85 | 3 2.52 0.98 | 3 2.83 0.87 | 3 2.82 0.8 | 3 2.76 0.85 | 5.7568 0.3306 | |
| Crowding Preference | 2 2.54 0.66 | 2 2.16 0.69 | 2 2.5 0.82 | 2 2.11 0.68 | 2 2.16 0.63 | 2 2.18 0.69 | 20.6223 0.0010 | Bachelors differs from Associate and High School High School differs from Some College |
| User Group: Residential Status | |||||||
|---|---|---|---|---|---|---|---|
| Resident (Non-Student) | Resident (Student) | Regional Student | Regional Tourist | Non-Regional Tourist | Chi-Square p-Value | Post Hoc | |
| Loss of WQ | 3 2.8 0.82 | 3 2.85 0.85 | 3 2.9 0.85 | 3 2.56 1 | 3 2.62 0.98 | 17.2383 0.0017 | Regional Tourist differs from Resident (Student) and Regional Student |
| Crowding Preference | 2 2.15 0.71 | 2 2.15 0.68 | 2 2.14 0.64 | 2 2.44 0.71 | 2 2.28 0.72 | 20.8940 0.0003 | Regional Tourist differs from Resident (Student), Resident (non-student) and Regional Student |
| User group: Frequency | |||||||
| Low | Medium | High | |||||
| Loss of WQ | 3 2.81 0.85 | 3 2.79 0.86 | 3 2.83 0.86 | 0.9415 0.6245 | |||
| Crowding preference | 2 2.21 0.69 | 2 2.16 0.68 | 2 2.14 0.68 | 4.1133 0.1279 | |||
Appendix E. Ecosystem Services and Environmental Values of Survey Respondents
| Ecosystem Service (Benefits of SM River) | Social Group: Age | Chi-Square p-Value | ||||||
|---|---|---|---|---|---|---|---|---|
| <25 | 25–34 | 35–44 | 45–54 | 55–64 | 65+ | Post Hoc Summary | ||
| Median Mean SD | Med Mean | Med Mean | Med Mean | Med Mean | ||||
| Habitat For plants and animals | 5 4.7 1.36 | 5 4.65 1.41 | 5 4.61 1.43 | 5 4.72 1.39 | 5 4.75 1.23 | 5 4.57 1.42 | 1.4142 0.9228 | |
| Food A source of fish for your meals | 1 1.37 0.84 | 1 1.40 0.84 | 1 1.48 0.94 | 1 1.52 0.98 | 1 1.39 0.93 | 1 1.29 0.79 | 9.3724 0.0960 | |
| Recreation A place for recreational activities | 3 3.61 1.45 | 3 3.60 1.51 | 3 3.73 1.49 | 3 3.57 1.37 | 4 3.72 1.46 | 4 3.75 1.26 | 2.2203 0.8179 | |
| Clean Water Clean and reliable water from the aquifer groundwater | 4 3.9 0.8 | 4 3.9 0.8 | 4 3.8 0.9 | 4 4 0.9 | 4 4 0.9 | 4 3.8 0.9 | 4.9279 0.4247 | |
| Water Source A source for municipal, industrial, or agricultural water uses | 3 2.91 1.33 | 3 3.03 1.35 | 3 3.11 1.47 | 3 2.99 1.43 | 2 2.93 1.39 | 3 3.02 1.26 | 4.9879 0.4174 | |
| Culture A place for relaxing or enjoying the scenery and local culture | 4 4.16 1.38 | 4 4.04 1.43 | 4 3.68 1.46 | 4 3.60 1.44 | 4 3.70 1.42 | 3 3.33 1.31 | 52.5633 <0.0001 | <25 different from 35–44; 45–54; and 55–64; 65+ 25–34 diff from 64+ |
| Cultural Ecosystem Services (Benefits of SM River) | Social Group—Age | |||||||
|---|---|---|---|---|---|---|---|---|
| <25 | 25–34 | 35–44 | 45–54 | 55–64 | 65 + | |||
| Med Mean SD | ||||||||
| Inspiration Artistic, cultural, or work-related activities | 3 2.76 1.32 | 2 2.67 1.43 | 2.5 2.77 1.38 | 2 2.62 1.31 | 3 2.90 1.28 | 2 2.25 1.06 | 14.1331 0.0148 | 65+ and 55–64 different |
| Aesthetics Relaxation, scenery, or sentimental value | 5 4.26 1.42 | 5 4.27 1.36 | 5 4.28 1.51 | 4 4.30 1.23 | 5 4.36 1.37 | 5 4.59 1.30 | 3.5172 0.6208 | |
| Education Opportunity to experience, learn about, or appreciate nature | 4 3.77 1.56 | 4 3.8 1.57 | 4 3.67 1.52 | 4 3.74 1.60 | 4 3.63 1.62 | 5 4.44 1.28 | 13.2574 0.0211 | 65+ different from all except 45–54. |
| Identity Cultural heritage, local pride, sense of place, symbol of San Marcos | 4 3.71 1.66 | 4 3.76 1.60 | 3 3.43 1.60 | 3 3.59 1.72 | 4 3.7 1.70 | 3 3.23 1.68 | 10.1497 0.0711 | |
| Spirituality Sacred, religious, or mental health activities | 2 2.23 1.52 | 2 2.37 1.56 | 2 2.49 1.61 | 2 2.65 1.77 | 2 2.64 1.80 | 2 2.20 1.40 | 14.9423 0.0106 | No differences |
| Recreation Physical activities | 5 4.27 1.66 | 4 4.12 1.75 | 5 4.35 1.74 | 4 4.11 1.79 | 4 3.757 1.87 | 5 4.3 1.55 | 9.4042 0.0940 | |
| Ecosystem Service (Benefits of SM River) | Social Group: Residency (Years) | Chi-Square p-Value | ||||||
|---|---|---|---|---|---|---|---|---|
| 1 Year | 2 Years | 3 Years | 4 Years | 5 Years | 6 Years+ | Post Hoc Summary | ||
| Median Mean SD | Med Mean | Med Mean | Med Mean | Med Mean | ||||
| Habitat For plants and animals | 5 4.52 1.40 | 5 4.64 1.42 | 5 4.82 1.25 | 5 4.77 1.29 | 5 4.82 1.36 | 5 4.71 1.14 | 13.2328 0.0213 | 1 year and 3 years (p <0.05). |
| Food A source of fish for your meals | 1 1.36 0.84 | 1 0.33 0.81 | 1 1.27 0.71 | 1 1.35 0.79 | 1 1.22 0.56 | 1 1.41 0.87 | 8.9910 0.1094 | |
| Recreation A place for recreational activities | 4 3.77 1.47 | 4 3.67 1.45 | 4 3.70 1.37 | 3 3.53 1.45 | 3 3.58 1.43 | 4 3.71 1.36 | 6.3053 0.2776 | |
| Clean Water Clean and reliable water from the aquifer groundwater | 4 4.11 1.38 | 4 4.23 1.35 | 4 4.25 1.34 | 5 4.34 1.37 | 5 4.31 1.33 | 5 4.59 1.26 | 26.5827 <0.0001 | 6 years + different from 1–2–3-years (p < 0.05) |
| Water Source) A source for municipal, industrial, or agricultural water uses | 3 2.95 1.30 | 3 2.94 1.32 | 2 2.85 1.27 | 3 2.86 1.34 | 3 3.05 1.36 | 2 2.77 1.33 | 7.2293 0.2041 | |
| Culture A place for relaxing or enjoying the scenery and local culture | 4 4.29 1.45 | 4 4.18 1.36 | 4 4.12 1.43 | 4 4.14 1.32 | 4 4.02 1.31 | 4 3.80 1.37 | 27.5988 <0.0001 | 6 years + differ from 2 years and 1 year, and 3 yrs |
| Cultural Ecosystem Services (Benefits of SM River) | Social Group—Years Lived in San Marcos | |||||||
|---|---|---|---|---|---|---|---|---|
| 1 Year | 2 Years | 3 Years | 4 Years | 5 Years | 6 Years | |||
| Med Mean SD | ||||||||
| Inspiration Artistic, cultural, or work-related activities | 3 2.91 1.41 | 2 2.70 1.31 | 2 2.66 1.32 | 2 2.64 1.28 | 2 2.8 1.37 | 2 2.57 1.35 | 16.2336 0.0062 | 6 years or more diff. from 1 year |
| Aesthetics Relaxation, scenery, or sentimental value | 5 4.25 1.74 | 5 4.32 1.36 | 4 4.22 1.42 | 4 4.26 1.42 | 4 3.9 1.58 | 4 4.27 1.38 | 5.8591 0.3202 | |
| Education Opportunity to experience, learn about, or appreciate nature | 4 3.61 1.54 | 4 3.77 1.58 | 4 3.77 1.55 | 4 3.82 1.56 | 3 3.64 1.63 | 4 3.86 1.51 | 7.4792 0.1874 | |
| Identity Cultural heritage, local pride, sense of place, symbol of San Marcos | 3 3.52 1.61 | 4 3.79 1.65 | 4 3.79 1.70 | 4 3.85 1.59 | 4 4.08 1.63 | 4 3.98 1.61 | 22.5570 0.0004 | 1 year different from 5 years and 6 years or more |
| Spirituality Sacred, religious, or mental health activities | 2 2.27 1.58 | 2 2.14 1.45 | 2 2.17 1.43 | 2 2.37 1.66 | 2 2.37 1.58 | 2 2.60 1.75 | 13.2376 0.0213 | 6 years or more different from 2 years |
| Recreation Physical activities | 5 4.44 1.61 | 5 4.28 1.60 | 5 4.39 1.59 | 4 4.1 1.74 | 5 4.21 1.64 | 4 3.72 1.80 | 39.5480 <0.0001 | 6 years or more different from, 1 year, 2 years, and 3 years 4 years diff from 1 year |
| Ecosystem Service (Benefits of SM River) | Social Groups: Race/Ethnicity | |||
|---|---|---|---|---|
| Nonwhite | White | Chi-Square p-Value | Interpretation | |
| Median Mean SD | Median Mean SD | |||
| Habitat For plants and animals | 5 4.65 1.39 | 5 4.67 1.36 | 0.0142 0.9053 | |
| Food A source of fish for your meals | 1 1.36 0.83 | 1 1.36 0.82 | 0.0010 0.9747 | |
| Recreation A place for recreational activities | 3 3.60 1.48 | 4 3.70 1.44 | 3.1896 0.0714 | |
| Clean Water Clean and reliable water from the aquifer groundwater | 5 4.29 1.35 | 4 4.30 1.35 | 0.0041 0.9490 | |
| Water Source A source for municipal, industrial, or agricultural water uses | 3 3 1.33 | 3 2.9 1.33 | 3.2037 0.0735 | |
| Culture A place for relaxing or enjoying the scenery and local culture | 4 4.1 1.40 | 4 4 1.41 | 0.2175 0.6409 | |
| Cultural Ecosystem Services (Benefits of SM River) | Social Groups –Race | ||
|---|---|---|---|
| Nonwhite | White | Chi-Square p-Value | |
| Med Mean (SD) | |||
| Inspiration Artistic, cultural, or work-related activities | 3 2.80 1.32 | 2 2.64 1.32 | 9.0052 0.0027 |
| Aesthetics Relaxation, scenery, or sentimental value | 5 4.35 1.40 | 4 4.3 1.38 | 1.7554 0.1852 |
| Education Opportunity to experience, learn about, or appreciate nature | 4 3.7 1.56 | 4 3.8 1.54 | 1.3803 0.2401 |
| Identity Cultural heritage, local pride, sense of place, symbol of San Marcos | 4 3.62 1.64 | 4 3.7 1.65 | 1.5537 0.2126 |
| Spirituality Sacred, religious, or mental health activities | 2 2.27 1.56 | 2 2.27 1.54 | 0.0947 0.7583 |
| Recreation Physical activities | 5 4.21 1.70 | 5 4.26 1.68 | 0.3548 0.5514 |
| Ecosystem Service (Benefits of SM River) | Social Group: Income | Chi-Square p-Value | ||||||
|---|---|---|---|---|---|---|---|---|
| <20 k | 20–40 | 40–60 | 60–80 | 80+ | Post Hoc Summary | |||
| Median Mean SD | Med Mean | Med Mean | Med Mean | Med Mean | ||||
| Habitat For plants and animals | 5 4.72 1.36 | 5 4.59 1.38 | 5 4.72 1.37 | 5 4.64 1.35 | 5 4.52 1.43 | 5.6955 0.2231 | ||
| Food A source of fish for your meals | 1 1.35 0.82 | 1 1.49 0.97 | 1 1.38 0.86 | 1 1.51 0.96 | 1 1.45 0.95 | 8.9166 0.0632 | ||
| Recreation A place for recreational activities | 3 3.61 1.45 | 3 3.61 1.48 | 3 3.70 1.48 | 4 3.81 1.39 | 4 3.68 1.50 | 2.5019 0.6443 | ||
| Clean Water Clean and reliable water from the aquifer groundwater | 4 4.26 1.34 | 4 4.24 1.43 | 5 4.55 1.26 | 5 4.43 1.26 | 5 4.41 1.39 | 9.3721 0.0524 | ||
| Water Source A source for municipal, industrial, or agricultural water uses | 3 2.9 1.31 | 3 3.07 1.49 | 2 2.98 1.39 | 2 2.91 1.42 | 3 3.25 1.35 | 12.1323 0.0164 | <20 k diff from 80+ | |
| Cultural Ecosystem Services (Benefits of SM River) | Social Group–Income | |||||
|---|---|---|---|---|---|---|
| <20 k | 20–40 | 40–60 | 60–80 | 80+ | Chi-Square p-Value | |
| Med Mean SD | ||||||
| Inspiration Artistic, cultural, or work-related activities | 2 2.72 1.34 | 3 2.83 1.37 | 3 2.85 1.40 | 2 2.63 1.35 | 2 2.59 1.18 | 4.2081 0.3786 |
| Aesthetics Relaxation, scenery, or sentimental value | 5 4.28 1.41 | 4 4.17 1.41 | 5 4.32 1.36 | 4 4.21 1.47 | 5 4.42 1.36 | 4.2736 0.3702 |
| Education Opportunity to experience, learn about, or appreciate nature | 4 3.76 1.57 | 4 3.87 1.60 | 3 3.53 1.57 | 4 4.02 1.42 | 4 3.9 1.45 | 8.5737 0.0727 |
| Identity Cultural heritage, local pride, sense of place, symbol of San Marcos | 4 3.73 1.66 | 4 3.65 1.59 | 3 3.50 1.59 | 3 3.48 1.78 | 3 3.61 1.64 | 5.6271 0.2288 |
| Spirituality Sacred, religious, or mental health activities | 2 2.30 1.54 | 1.5 2.20 1.56 | 2 2.52 1.81 | 2 2.50 1.60 | 2 2.17 1.47 | 6.4630 0.1671 |
| Recreation Physical activities | 5 4.21 1.69 | 5 4.29 1.67 | 5 4.28 1.69 | 5 4.16 1.72 | 5 4.31 1.76 | 2.1985 0.6993 |
| Ecosystem Service (Benefits of SM River) | Social Group: Education | Chi-Square p-Value | ||||||
|---|---|---|---|---|---|---|---|---|
| High School | Some College | Associate | Bachelor | Master | PhD | Post Hoc Summary | ||
| Median Mean SD | Med Mean | Med Mean | Med Mean | Med Mean | ||||
| Habitat For plants and animals | 4.5 4.22 1.64 | 5 4.69 1.36 | 5 4.56 1.56 | 5 4.58 1.37 | 6 4.99 1.32 | 5 5.03 1.18 | 18.4964 0.0024 | Master diff from bach and some college |
| Food A source of fish for your meals | 1 1.91 1.33 | 1 1.35 0.81 | 1 2.02 1.47 | 1 1.44 0.92 | 1 1.34 0.82 | 1 1.26 0.68 | 30.7748 <0.0001 | HS differ from some college, master, phd Assoc. differs from some college, masters, and phd |
| Recreation A place for recreational activities | 3 3.13 1.48 | 3.5 3.63 1.45 | 3 3.49 1.35 | 4 3.68 1.52 | 3 3.58 1.33 | 3 3.62 1.33 | 4.7410 0.4483 | |
| Clean Water Clean and reliable water from the aquifer groundwater | 4 4.66 1.23 | 4 4.25 1.34 | 4 4 1.43 | 5 4.4 1.37 | 5 4.47 1.34 | 5 4.62 1.23 | 15.7517 0.0091 | No between group differences |
| Water Source A source for municipal, industrial, or agricultural water uses | 4 3.63 1.45 | 3 2.9 1.33 | 3 3.3 1.73 | 3 3.05 1.41 | 3 3.01 1.23 | 3 3.1 1.19 | 15.0863 0.0100 | No between group differences |
| Culture A place for relaxing or enjoying the scenery and local culture | 3 3.47 1.76 | 4 4.18 1.38 | 4 3.56 1.65 | 4 3.84 1.42 | 4 3.6 1.41 | 3 3.38 1.5 | 53.3079 <0.0001 | Some college differs from phd; master; and bach |
| Cultural Ecosystem Services (Benefits of SM River) | Social Group—Education | ||||||
|---|---|---|---|---|---|---|---|
| High School | Some College | Associate | Bachelor | Masters | PhD | ||
| Med Mean SD | |||||||
| Inspiration Artistic, cultural, or work-related activities | 3 2.7 1.54 | 3 2.8 1.33 | 3 3.1 1.32 | 2 2.66 1.34 | 2 2.57 1.33 | 2 2.72 1.49 | 8.1204 0.1497 |
| Aesthetics Relaxation, scenery, or sentimental value | 5 4.58 1.50 | 5 4.27 1.40 | 5 4.33 1.60 | 5 4.30 1.38 | 5 4.23 1.41 | 5 4.67 1.47 | 6.7386 0.2408 |
| Education Opportunity to experience, learn about, or appreciate nature | 4 3.74 1.48 | 4 3.76 1.58 | 4 3.9 1.48 | 4 3.77 1.55 | 4 4 1.41 | 3 3.56 1.59 | 4.5821 0.4690 |
| Identity Cultural heritage, local pride, sense of place, symbol of San Marcos | 4 3.61 1.45 | 4 3.74 1.66 | 3 3.42 1.62 | 3 3.54 1.60 | 3 3.52 1.71 | 3 3.69 1.61 | 8.9959 0.1092 |
| Spirituality Sacred, religious, or mental health activities | 2 2.45 1.50 | 2 2.23 1.50 | 1 2.30 1.77 | 2 2.52 1.73 | 2 2.43 1.59 | 2 2.21 1.38 | 8.9775 0.1100 |
| Recreation Physical activities | 4 3.74 2.00 | 5 4.25 1.68 | 4 4 1.72 | 5 4.21 1.74 | 5 4.23 1.74 | 4 4.15 1.53 | 2.8634 0.7210 |
| Types of Values | User Group | Chi-Square p-Value | |||||
|---|---|---|---|---|---|---|---|
| Resident (Non-Student) | Resident (Student) | Regional Student | Regional Tourist | Non-Regional Tourist | Post Hoc Summary | ||
| Med Mean SD | |||||||
| Habitat For plants and animals | 5 4.7 1.4 | 5 4.72 1.36 | 5 4.69 1.35 | 5 4.55 1.5 | 4 4.29 1.45 | 6.9618 0.1379 | |
| Food A source of fish for your meals | 1 1.49 1 | 1 1.34 0.8 | 1 1.34 0.83 | 1 1.72 1.23 | 1 1.5 0.93 | 25.5370 <0.0001 | Regional Tourist different from Regional Student and Resident (Student). |
| Clean Water Clean and reliable water from the aquifer groundwater | 5 4.58 1.3 | 4 4.24 1.3 | 4 4.26 1.38 | 5 4.45 1.35 | 5 4.56 1.53 | 26.5124 <0.0001 | Resident (Non-Student) differs from Student Resident and Regional Student. |
| Water Source A source for municipal, industrial, or agricultural water uses | 3 3 1.37 | 3 2.9 1.31 | 3 2.96 1.31 | 3 3.35 1.44 | 4 3.65 1.5 | 30.8199 <0.0001 | Nonregional Tourist differs from Student Resident, Regional Student, and Resident (non-student) Regional Tourist differs from Student Resident and Regional Student |
| Culture A place for relaxing or enjoying the scenery and local culture | 4 3.631.43 | 4 4.2 1.37 | 4 4.12 1.4 | 3 3.4 1.53 | 3 3.27 1.44 | 97.7462 <0.0001 | Resident (non-student) differs from: Student Residents and Regional Students Residents (students) differs from Nonregional Tourist and Regional Tourist Regional Students differs from Nonregional Tourist and Regional Tourist |
| Inspiration Artistic, cultural, or work-related activities | 2 2.73 1.44 | 2 2.73 1.32 | 2 2.65 1.31 | 3 2.8 1.25 | 3 2.89 1.53 | 3.1691 0.5299 | |
| Aesthetics Relaxation, scenery, or sentimental value | 4 4.24 1.46 | 5 4.26 1.42 | 4 4.27 1.37 | 5 4.27 1.44 | 5 4.35 1.33 | 0.02199 0.9944 | |
| Education Opportunity to experience, learn about, or appreciate nature | 4 3.81 1.53 | 4 3.78 1.57 | 4 3.84 1.57 | 4 3.91 1.55 | 4 3.62 1.57 | 2.5734 0.6315 | |
| Identity Cultural heritage, local pride, sense of place, symbol of San Marcos | 4 3.82 1.60 | 4 3.7 1.64 | 4 3.8 1.66 | 3 3.26 1.6 | 3 3.24 1.64 | 19.3270 0.0007 | Regional Tourist differs from Student Resident; Resident (Non-student), and Regional Student |
| Spirituality Sacred, religious, or mental health activities | 2 2.66 1.78 | 2 2.26 1.54 | 2 2.17 1.46 | 2 2.38 1.54 | 2 2.3 1.5 | 16.4590 0.0025 | Resident (non-student) differs from Student Resident and Regional Student |
| Recreation Physical activities | 4 3.74 1.79 | 5 4.27 1.67 | 5 4.25 1.67 | 5 4.38 1.78 | 5 4.59 1.56 | 33.2091 <0.0001 | Resident (Non-Student) differs from Resident (Student), Regional Student, Regional Tourist, and Nonregional Tourist. |
| Types of Values | User Groups | ||||
|---|---|---|---|---|---|
| Low | Medium | High | |||
| Med Mean (SD) | Chi-Square p-Value | ||||
| Habitat For plants and animals | 5 4.63 (1.40) | 5 4.65 (1.40) | 5 4.70 (1.36) | 0.9945 0.6082 | |
| Food A source of fish for your meals | 1 1.36 (0.81) | 1 1.38 (0.83) | 1 1.33 (0.80) | 2.8755 0.2375 | |
| Clean Water Clean and reliable water from the aquifer groundwater | 4 4.29 (1.35) | 4 4.22 (1.34) | 5 4.33 (1.33) | 2.8386 0.2419 | |
| Water Source A source for municipal, industrial, or agricultural water uses | 3 2.96 (1.35) | 3 2.95 (1.36) | 3 2.92 (1.29) | 0.2053 0.9024 | |
| Culture A place for relaxing or enjoying the scenery and local culture | 4 4.1 (1.4) | 4 4.1 (1.43) | 4 4.1 (1.4) | 0.3420 0.8428 | |
| Inspiration Artistic, cultural, or work-related activities | 2 2.74 (1.28) | 2 2.64 (1.35) | 3 2.74 (1.33) | 3.5733 0.1675 | |
| Aesthetics Relaxation, scenery, or sentimental value | 4 4.19 (1.4) | 5 4.38 (1.4) | 5 4.38 (1.38) | 12.7286 0.0017 | Low differs from Medium and High |
| Education Opportunity to experience, learn about, or appreciate nature | 4 3.78 (1.55) | 4 3.83 (1.55) | 4 3.74 (1.56) | 0.8967 0.6387 | |
| Identity Cultural heritage, local pride, sense of place, symbol of San Marcos | 4 3.70 (1.66) | 4 3.76 (1.62) | 4 3.62 (1.64) | 3.1672 0.2052 | |
| Spirituality Sacred, religious, or mental health activities | 1.50 2.20 (1.54) | 2 2.17 (1.39) | 2 2.37 (1.62) | 5.8892 0.0526 | |
| Recreation Physical activities | 5 4.39 (1.66) | 5 4.23 (1.67) | 5 4.15 (1.71) | 9.6379 0.0081 | Low different from High |
References
- Mulder, M.B.; Coppolillo, P. Conservation: Linking Ecology, Economics, and Culture, 1st ed.; Princeton University Press: Princeton, NJ, USA, 2005; p. 368. [Google Scholar]
- Sandbrook, C. What is Conservation? Oryx 2015, 49, 565–566. [Google Scholar] [CrossRef]
- Muradian, R.; Gómez-Baggethun, E. Beyond ecosystem services and nature’s contributions: Is it time to leave utilitarian environmentalism behind? Ecol. Econ. 2021, 185, 107038. [Google Scholar] [CrossRef]
- Kubiszewski, I.; Concollato, L.; Constanza, R.; Stern, D. Changes in authorship, networks, and research topics in ecosystems services. Ecosyst. Serv. 2023, 59, 101501. [Google Scholar] [CrossRef]
- Millennium ecosystem assessment (MEA). Ecosystems and Human Well-Being; Island Press: Washington, DC, USA, 2005; Volume 5, p. 563. [Google Scholar]
- Costanza, R.; d’Arge, R.; De Groot, R.; Farber, S.; Grasso, M.; Hannon, B.; Limburg, K.; Naeem, S.; O’Neil, R.; Pauerlo, J.; et al. The value of the world’s ecosystem services and natural capital. Nature 1997, 387, 253–260. [Google Scholar] [CrossRef]
- Muradian, R.; Pascual, U. A typology of elementary forms of human-nature relations: A contribution to the valuation debate. Curr. Opin. Environ. Sustain. 2018, 35, 8–14. [Google Scholar] [CrossRef]
- Carpenter, S.R.; Mooney, H.A.; Agard, J.; Capistrano, D.; DeFries, R.S.; Díaz, S.; Whyte, A. Science for managing ecosystem services: Beyond the Millennium Ecosystem Assessment. Proc. Nat. Acad. Sci. USA 2009, 106, 1305–1312. [Google Scholar] [CrossRef]
- De Vos, A.; Joana, C.B.; Dirk, R. Relational values about nature in protected area research. Curr. Opin. Environ. Sustain. 2018, 35, 89–99. [Google Scholar] [CrossRef]
- Maund, P.R.; Irvine, K.N.; Dallimer, M.; Fish, R.; Austen, G.E.; Davies, Z.G. Do ecosystem service frameworks represent people’s values? Ecosyst. Serv. 2020, 46, 101221. [Google Scholar] [CrossRef]
- Costanza, R.; De Groot, R.; Sutton, P.; Van der Ploeg, S.; Anderson, S.J.; Kubiszewski, I.; Farber, S.; Turner, R.K. Changes in the global value of ecosystem services. Glob. Environ. Chang. 2014, 26, 152–158. [Google Scholar] [CrossRef]
- Díaz, S.; Pascual, U.; Stenseke, M.; Martín-López, B.; Watson, R.T.; Molnár, Z.; Shirayama, Y. Assessing nature’s contributions to people. Science 2018, 359, 270–272. [Google Scholar] [CrossRef]
- Chan, K.M.; Balvanera, P.; Benessaiah, K.; Chapman, M.; Díaz, S.; Gómez-Baggethun, E.; Turner, N. Opinion: Why protect nature? Rethinking values and the environment. Proc. Nat. Acad. Sci. USA 2016, 113, 1462–1465. [Google Scholar] [CrossRef]
- Piccolo, J.J. Intrinsic values in nature: Objective good or simply half of an unhelpful dichotomy? J. Nat. Conserv. 2017, 37, 8–11. [Google Scholar] [CrossRef]
- Arias-Arévalo, P.; Martín-López, B.; Gómez-Baggethun, E. Exploring intrinsic, instrumental, and relational values for sustainable management of social-ecological systems. Ecol. Soc. 2017, 22, 43. [Google Scholar] [CrossRef]
- Klain, S.C.; Olmsted, P.; Chan, K.M.; Satterfield, T. Relational values resonate broadly and differently than intrinsic or instrumental values, or the New Ecological Paradigm. PLoS ONE 2017, 12, E0183962. [Google Scholar] [CrossRef] [PubMed]
- Díaz, S.; Demissew, S.; Carabias, J.; Joly, C.; Lonsdale, M.; Ash, N.; Larigauderie, A.; Ram Adhikari, J.; Arico, S.; Bldi Zlatanova, D. The IPBES Conceptual Framework—Connecting nature and people. Curr. Opin. Environ. Sustain. 2015, 14, 1–16. [Google Scholar] [CrossRef]
- Stålhammar, S.; Thorén, H. Three perspectives on relational values of nature. Sustain. Sci. 2019, 14, 1201–1212. [Google Scholar] [CrossRef]
- Himes, A.; Muraca, B. Relational values: The key to pluralistic valuation of ecosystem services. Curr. Opin. Environ. Sustain. 2018, 35, 1–7. [Google Scholar] [CrossRef]
- Maier, D.S.; Feest, A. The IPBES conceptual framework: An unhelpful start. J. Agric. Environ. Ethics 2016, 29, 327–347. [Google Scholar] [CrossRef]
- Hahn, T.; McDermott, C.; Ituarte-Lima, C.; Schultz, M.; Green, T.; Tuvendal, M. Purposes and degrees of commodification: Economic instruments for biodiversity and ecosystem services need not rely on markets or monetary valuation. Ecosyst. Serv. 2015, 16, 74–82. [Google Scholar] [CrossRef]
- Gale, T.; Ednie, A. Can intrinsic, instrumental, and relational value assignments inform more integrative methods of protected area conflict resolution? Exploratory findings from Aysén, Chile. J. Tour. Cult. Chang. 2020, 18, 690–710. [Google Scholar] [CrossRef]
- Edwards Aquifer Habitat Conservation Plan. Edwards Aquifer Recovery Implementation Program; City of New Braunfels: New Braunfels, TX, USA, 2021.
- Kimmel, J. The San Marcos: A River’s Story; Texas A&M University Press: College Station, TX, USA, 2006. [Google Scholar]
- Van Oudekerke, R. Historic San Marcos: An Illustrated History; HPN Books: San Antonio, TX, USA, 2011. [Google Scholar]
- Butler, D.R. San Marcos (Images of America); Arcadia Publishing: Dover, NH, USA, 2016. [Google Scholar]
- Poole, J.; Hutchinson, J.T.; Hathcock, C.R.; Han, D. A thirty-year assessment of the endangered aquatic macrophyte, Zizania texana, endemic to the upper reach of the San Marcos River in Central Texas, USA. Aquat. Bot. 2022, 177, 103482. [Google Scholar] [CrossRef]
- Alexander, M.L.; Phillips, C.T. Habitats used by the endangered fountain darter (Etheostoma fonticola) in the San Marcos River, Hays County, Texas. Southwest. Nat. 2012, 57, 449–452. [Google Scholar] [CrossRef]
- Hardy, T.; Kollaus, K.; Tolman, K.; Heard, T.; Howard, M. Ecohydraulics in applied river restoration: A case study in the San Marcos River, Texas, USA. J. Appl. Water Eng. Res. 2016, 4, 2–10. [Google Scholar] [CrossRef]
- Wade, M. Blue Index San Marcos: Emotional Experiences, Values, and Use Patterns of Waterscapes in San Marcos, Texas. Master’s Thesis, Texas State University, San Marcos, TX, USA, 2022. Available online: https://digital.library.txstate.edu/handle/10877/15755 (accessed on 28 October 2022).
- Maleki, S.; Julian, J.P.; Weaver, R.C.; Lopez, C.; Kraft, M. Social Demand for Urban Wilderness in Purgatory. In Human-Nature Interactions; Misiune, I., Depellegrin, D., Egarter Vigl, L., Eds.; Springer Cham: New York City, NY, USA, 2022; pp. 247–260. [Google Scholar] [CrossRef]
- Julian, J.P.; Daly, G.S.; Weaver, R.C. University students’ social demand of a blue space and the influence of life experiences. Sustainability 2018, 10, 3178. [Google Scholar] [CrossRef]
- Martin-Lopez, B.; Iniesta-Arandia, I.; Garcia-Llorente, M.; Palomo, I.; Casado-Arzuaga, I.; Amo, D.G.; Gomez-Baggethun, E.; Oteros-Rozas, E.; Palacios-Agundez, I.; Willaarts, B.; et al. Uncovering ecosystem service bundles through social preferences. PLoS ONE 2012, 7, e38970. [Google Scholar] [CrossRef]
- Lookingbill, T.R.; Meitzen, K.M.; Julian, J.P. Riverscapes. In The Routledge Handbook of Landscape Ecology; Francis, R.A., Millington, J.D.A., Perry, G.L.W., Minor, E.S., Eds.; Routledge: London, UK, 2021; pp. 411–429. [Google Scholar]
- US Census Bureau. American Community Survey. 2019. Available online: https://data.census.gov/cedsci/all?q=hays%20county (accessed on 15 September 2021).
- Osborn, C. Census: San Marcos Fastest-Growing US City—Again. Austin American Statesman. 2016. Available online: https://www.statesman.com/story/news/2016/09/23/census-san-marcos-fastest-growing-us-city-again/10040009007/ (accessed on 3 February 2023).
- Texas Water Development Board. Texas State Water Plan-Water for Texas. Available online: https://www.twdb.texas.gov/waterplanning/swp/2022/index.asp (accessed on 15 September 2021).
- United States Fish and Wildlife Service. Draft Environmental Impact Statement: Edwards Aquifer Recovery Implementation Program, Habitat Conservation Program; U.S. Fish and Wildlife Service: Austin, TX, USA, 2012; p. 1728. [Google Scholar]
- Biggs, R.; Clements, H.; de Vos, A.; Folke, C.; Manyani, A.; Maciejewski, K.; Schlüter, M. What are social-ecological systems and social-ecological systems research? In The Routledge Handbook of Research Methods for Social-Ecological Systems; Routledge: London, UK, 2021; pp. 3–26. [Google Scholar]
- Berkes, F.; Folke, C. Linking Social and Ecological Systems: Management Practices and Social Mechanisms for Building Resilience; Cambridge University Press: New York, NY, USA, 1998. [Google Scholar]
- Buijs, A.E.; Arts, B.J.; Elands, B.H.; Lengkeek, J. Beyond environmental frames: The social representation and cultural resonance of nature in conflicts over a Dutch woodland. GeoForum 2011, 42, 329–341. [Google Scholar] [CrossRef]
- Porter, S.R.; Whitcomb, M.E. Non-Response in Student Surveys: The Role of Demographics, Engagement and Personality. Res. Higher Educ. 2005, 46, 127–152. [Google Scholar] [CrossRef]
- Martin-Lopez, B.; Montes, C.; Benayas, J. Influence of user characteristics on valuation of ecosystem services in Donana Natural Protected Area (south-west Spain). Environ. Conserv. 2007, 34, 215–224. [Google Scholar] [CrossRef]
- Casado-Arzuaga, I.; Madariaga, I.; Onaindia, M. Perception, demand and user contribution to ecosystem services in the Bilbao Metropolitan Greenbelt. J. Environ. Manag. 2013, 129, 33–43. [Google Scholar] [CrossRef]
- Castro, A.J.; Vaughn, C.C.; Julian, J.P.; García-Llorente, M. Social demand for ecosystem services and implications for watershed management. J. Am. Water Resour. Assoc. 2016, 52, 209–221. [Google Scholar] [CrossRef]
- van Riper, C.J.; Thiel, A.; Penker, M.; Braito, M.; Landon, A.C.; Thomsen, J.M. Incorporating multilevel values into the social-ecological systems framework. Ecol. Soc. 2018, 23, 25. [Google Scholar] [CrossRef]
- Lehnen, L.; Arbieu, U.; Böhning-Gaese, K.; Díaz, S.; Glikman, J.A.; Mueller, T. Rethinking individual relationships with entities of nature. People Nat. 2022, 4, 596–611. [Google Scholar] [CrossRef]
- Keeler, B.L.; Wood, S.A.; Polasky, S.; Kling, C.; Filstrup, C.T.; Downing, J.A. Recreational demand for clean water: Evidence from geotagged photographs by visitors to lakes. Front. Ecol. Environ. 2015, 13, 76–81. [Google Scholar] [CrossRef] [PubMed]
- Foley, R.; Kistemann, T. Blue space geographies: Enabling health in place. Health Place 2015, 35, 157–165. [Google Scholar] [CrossRef] [PubMed]
- Šebo, J.; Gróf, M.; Šebová, M. A contingent valuation study of a polluted urban lake in Košice, Slovakia: The case of the positive distance effect. J. Environ. Manag. 2019, 243, 331–339. [Google Scholar] [CrossRef]
- Khan, I.; Zhao, M. Water resource management and public preferences for water ecosystem services: A choice experiment approach for inland river basin management. Sci. Total Environ. 2019, 646, 821–831. [Google Scholar] [CrossRef]
- McDougall, C.W.; Hanley, N.; Quilliam, R.S.; Needham, K.; Oliver, D.M. Valuing inland blue space: A contingent valuation study of two large freshwater lakes. Sci. Total Environ. 2020, 715, 136921. [Google Scholar] [CrossRef]
- Stephenson, J. The Cultural Values Model: An integrated approach to values in landscapes. Landsc. Urban Plan. 2008, 84, 127–139. [Google Scholar] [CrossRef]
- Anciaes, P. Revealed preference valuation of beach and river water quality in Wales. J. Environ. Econ. Policy 2022, 11, 75–94. [Google Scholar] [CrossRef]
- House, M. Public perception and water quality management. Water Sci. Technol. 1996, 34, 25–32. [Google Scholar] [CrossRef]
- Kirillova, K.; Fu, X.; Cai, L. What makes a destination beautiful? Dimensions of tourist aesthetic judgement. Tour. Manag. 2014, 41, 282–293. [Google Scholar] [CrossRef]
- Ganzevoort, W.; van den Born, R.J. Exploring place attachment and visions of nature of water-based recreationists: The case of the longitudinal dams. Landsc. Res. 2019, 44, 149–161. [Google Scholar] [CrossRef]
- Verbrugge, L.; Buchecker, M.; Garcia, X.; Gottwald, S.; Müller, S.; Præstholm, S.; Stahl Olafsson, A. Integrating sense of place in planning and management of multifunctional river landscapes: Experiences from five European case studies. Sustain. Sci. 2019, 14, 669–680. [Google Scholar] [CrossRef]
- Tuan, Y.F. Space and Place: The Perspective of Experience; University of Minnesota Press: Minneapolis, MN, USA, 1977. [Google Scholar]
- Lopez, C.W.; Weaver, R.C. On the Possible Existence of a ‘First Law of Environmental Stewardship’: How Organisations Bring Volunteers Together in Social and Geographic Space. Environ. Values 2022, 31, 463–492. [Google Scholar] [CrossRef]
- Williams, D.R. Making sense of ‘place’: Reflections on pluralism and positionality in place research. Landsc. Urban Plan. 2014, 131, 74–82. [Google Scholar] [CrossRef]
- Kondolf, G.M.; Pinto, P.J. The social connectivity of urban rivers. Geomorphology 2017, 277, 182–196. [Google Scholar] [CrossRef]
- Dunham, J.B.; Angermeier, P.L.; Crausbay, S.D.; Cravens, A.E.; Gosnell, H.; McEvoy, J.; Moritz, M.; Raheem, N.; Sanford, T. Rivers are social–ecological systems: Time to integrate human dimensions into riverscape ecology and management. Wiley Interdiscip. Rev. Water 2018, 5, e1291. [Google Scholar] [CrossRef]
- Wantzen, K.M.; Ballouche, A.; Longuet, I.; Bao, I.; Bocoum, H.; Cisse, L.; Chauhan, M.; Girard, P.; Gopal, B.; Kane, A.; et al. River Culture: An eco-social approach to mitigate the biological and cultural diversity crisis in riverscapes. Ecohydrol. Hydrobiol. 2016, 16, 7–18. [Google Scholar] [CrossRef]
- Manzo, L.C.; Perkins, D.D. Finding common ground: The importance of place attachment to community participation and planning. J. Plan. Lit. 2006, 20, 335–350. [Google Scholar] [CrossRef]
- Vaske, J.J.; Kobrin, K.C. Place attachment and environmentally responsible behavior. J. Environ. Educ. 2001, 32, 16–21. [Google Scholar] [CrossRef]
- Uzzell, D.; Pol, E.; Badenas, D. Place identification, social cohesion, and environmental sustainability. Environ. Behav. 2002, 34, 26–53. [Google Scholar] [CrossRef]
- Lewicka, M. Place attachment: How far have we come in the last 40 years? J. Environ. Psychol. 2011, 31, 207–230. [Google Scholar] [CrossRef]
- Darvill, R.; Lindo, Z. The inclusion of stakeholders and cultural ecosystem services in land management trade-off decisions using an ecosystem services approach. Landsc. Ecol. 2016, 31, 533–545. [Google Scholar] [CrossRef]
- Welchman, J. A defense of environmental stewardship. Environ. Values 2012, 21, 297–316. [Google Scholar] [CrossRef]
- Lopez, C.W.; Weaver, R.C. Understanding impacts of environmental stewardship programs through community geography: Pro-environment behaviors cultivated and reinforced. Electron. Green J. 2021, 1, 1–27. [Google Scholar] [CrossRef]
- Bennett, N.J.; Whitty, T.S.; Finkbeiner, E.; Pittman, J.; Bassett, H.; Gelcich, S.; Allison, E.H. Environmental stewardship: A conceptual review and analytical framework. Environ. Manag. 2018, 61, 597–614. [Google Scholar] [CrossRef] [PubMed]
- Svendsen, E.; Campbell, L.K. Urban ecological stewardship: Understanding the structure, function and network of community-based urban land management. Cities Environ. (CATE) 2008, 1, 4. [Google Scholar]
- Bramston, P.; Pretty, G.; Zammit, C. Assessing environmental stewardship motivation. Environ. Behav. 2011, 43, 776–788. [Google Scholar] [CrossRef]
- Asah, S.T.; Blahna, D.J. Motivational functionalism and urban conservation stewardship: Implications for volunteer involvement. Conserv. Lett. 2012, 5, 470–477. [Google Scholar] [CrossRef]
- Lopez, C. Motives for Citizen Science Program Participation and the Role of the Organization: Lessons from Water Quality Monitors in Texas. Citiz. Sci. Theory Pract. 2021, 6, 3. [Google Scholar] [CrossRef]
- Hernández-Blanco, M.; Costanza, R.; Chen, H.; DeGroot, D.; Jarvis, D.; Kubiszewski, I.; Montoya, J.; Sangha, K.; Stoeckl, N.; Turner, K.; et al. Ecosystem health, ecosystem services, and the well-being of humans and the rest of nature. Glob. Chang. Biol. 2022, 28, 5027–5040. [Google Scholar] [CrossRef] [PubMed]
- Loorbach, D.; Frantzeskaki, N.; Avelino, F. Sustainability Transitions Research: Transforming Science and Practice for Societal Change. Ann. Rev. Environ. Resour. 2017, 42, 599–626. [Google Scholar] [CrossRef]
- Shackleton, S.; Bezerra, J.C.; Cockburn, J.; Reed, M.G.; Abu, R. Interviews and surveys. In The Routledge Handbook of Research Methods for Social-Ecological Systems; Routledge: London, UK, 2021; pp. 107–118. [Google Scholar]
- Obeng, E.A.; Aguilar, F.X. Value orientation and payment for ecosystem services: Perceived detrimental consequences lead to willingness-to-pay for ecosystem services. J. Environ. Manag. 2018, 206, 458–471. [Google Scholar] [CrossRef] [PubMed]
- Thapa, S.; Shrestha, S.; Adhikari, R.K.; Bhattarai, S.; Paudel, D.; Gautam, D.; Koirala, A. Residents’ willingness-to-pay for watershed conservation program facilitating ecosystem services in Begnas watershed, Nepal. Environ. Dev. Sustain. 2022, 24, 7811–7832. [Google Scholar] [CrossRef]
- Kliskey, A.; Alessa, L.; Griffith, D.; Oslen, S.; Williams, P.; Matsaw, S.; Cenek, M.; Gosz, J.; Dengler, S. Transforming sustainability science for practice: A social–ecological systems framework for training sustainability professionals. Sustain. Sci. 2021, 16, 283–294. [Google Scholar] [CrossRef]
- Von Döhren, P.; Haase, D. Ecosystem disservices research: A review of the state of the art with a focus on cities. Ecol. Indic. 2015, 52, 490–497. [Google Scholar] [CrossRef]


| Survey Questions | Grammar (s) | |
|---|---|---|
| Ecosystem Services | ||
| Rank the importance of water in the San Marcos River for the following: |
|
|
| Rank the importance of fish in the San Marcos River for the following: |
| |
| Environmental Values | ||
| Rank the following benefits of the San Marcos River: |
|
|
| Rank the following cultural benefits of the San Marcos River: |
|
|
| Perceptions | ||
| The environmental health of the San Marcos River is well managed and well protected. |
|
|
| Please describe how clean the San Marcos River is. |
| |
| The San Marcos River and its environment are sensitive to rapid urban growth. |
|
|
| Preferences | ||
| Usually the water in the San Marcos River is clean and clear. If the river became dirty or cloudy, would you still use and enjoy it the way you do now? |
|
|
| What is your personal preference of the amount of people in the river and parks when you visit? |
|
|
| Behaviors and Environmental Management Priorities | ||
| What activities do you participate in when visiting the San Marcos River and its neighboring parks? |
|
|
| If you were in charge of an annual fund dedicated to improvement projects for the San Marcos River, how would you distribute the money? The 100% is representative of all of the money in the fund. Total must add up to 100%; whole numbers only. |
|
|
| Relational Model | How Nature Is Positioned | Goal Orientation | Question Hierarchy | Answer |
|---|---|---|---|---|
| Detachment | Nature as inexistent | Preference for urban spaces; nature not important | River provides benefits to fish and wildlife. | Disagree/Neutral |
| And River provides benefits to human well-being. | Disagree/Neutral | |||
| And Importance of water. | NOT (Env Health) | |||
| Domination | Nature as inferior | Preference for human control over nature. | River provides benefits to human well-being. | Disagree/Neutral |
| And Importance of fish. | Human consumption or Cultural uses | |||
| And Importance of water. | Human consumption or Cultural uses | |||
| Utilization | Nature as separate entity (no rights) | Preference for maximizing benefit–costs; nature as a source of services | River provides benefits to human well-being. | Agree/Neutral |
| And Importance of water. | NOT (Env Health) | |||
| Stewardship | Humans are part of nature | Preference for human restraint to respect nature; nature as comprehensive system with humans | River provides benefits to human well-being. | Agree/Neutral |
| And Importance of water. | Env Health | |||
| Wardship | Nature as separate entity with distinct rights | Preference for pristine conditions; nature to be protected | Importance of water. | Environmental health |
| And Primary river benefit. | Habitat | |||
| And People amount preference. | No people |
| Respondent Characteristics | Categories | Distribution | San Marcos 2015 ACS Data | Categories | Distribution |
|---|---|---|---|---|---|
| Age | <25 | 66% | Age | <25 | 56% |
| 25–34 | 18% | 25–34 | 17% | ||
| 35–44 | 6% | 35–44 | 8% | ||
| 45–54 | 4% | 45–54 | 6% | ||
| 55–64 | 4% | 55–64 | 5% | ||
| 65+ | 2% | 65+ | 7% | ||
| Race/Ethnicity | White alone Hispanic/Latino | 61% 28% | Race/Ethnicity | White alone Hispanic/Latino | 51% 40% |
| Black alone | 5% | Black alone | 4% | ||
| Asian alone | 2% | Asian alone | 2% | ||
| Mixed race (Not Hispanic) | 2% | Mixed race (Not Hispanic) | 2% | ||
| Other | 2% | Other | 1% | ||
| Gender | Female | 68% | Gender | Female | 52% |
| Male | 32% | Male | 48% | ||
| Annual Household Income | <$20,000 | 71% | Annual Household Income | <$25,000 | 43% |
| $20,000–40,000 | 11% | $25,000–50,000 | 29% | ||
| $40,000–60,000 | 7% | $50,000–75,000 | 14% | ||
| $60,000–80,000 | 4% | $75,000–100,000 | 6% | ||
| >$80,000 | 7% | >$100,000 | 8% | ||
| Educational Attainment | No degree | <1% | Educational Attainment | No degree | 14% |
| High school | 1% | High school | 25% | ||
| Some college | 74% | Some college | 30% | ||
| Bachelor’s degree | 17% | Bachelor’s degree | 22% | ||
| Graduate/Professional degree | 7% | Graduate/Professional degree | 9% |
| User Group | Respondents | Annual Visits (Median) (Q1–Q3) (Mean ± SD) | Group Size When Visiting River | Top 3 Activities (% of Participants That Mentioned Activity at Least Once) |
|---|---|---|---|---|
| Resident (non-student) | 362 | 30 10–100 72.1 ± 92.0 | 1: 15% 2: 28% 3–4: 44% 5+: 13% | Swimming (61%) Park exercise (41%) Socializing (34%) |
| Resident (student) | 1984 | 10 5–30 30.0 ± 50.9 | 1: 8% 2: 22% 3–4: 52% 5+: 18% | Swimming (56%) Floating (50%) Relaxing (37%) |
| Student (regional) | 564 | 10 5–30 29.4 ± 50.4 | 1: 7% 2: 21% 3–4: 51% 5+: 22% | Swimming (57%) Floating (51%) Relaxing (36%) |
| Tourist (regional) | 167 | 10 5–20 39.4 ± 81.2 | 1: 6% 2: 14% 3–4: 42% 5+: 38% | Floating (38%) Swimming (35%) Socializing (20%) |
| Tourist (non-regional) | 68 | 1 1–2 1.6 ± 0.9 | 1: 5% 2: 20% 3–4: 26% 5+: 49% | Floating (47%) Socializing (26%) Swimming (22%) |
| Social Groups | The Environmental Health of the San Marcos River Is Well-Managed and Well-Protected. | Please Describe How Clean the San Marcos River Is. | The San Marcos River and Its Environment Are Sensitive to Rapid Urban Growth. |
|---|---|---|---|
| Age | Older perceived as more sensitive | ||
| Residency (Years) | Newer residents had more positive perceptions | Newer residents had more positive perceptions | Long-term residents perceived as more sensitive |
| Race/Ethnicity | White had more positive perceptions | ||
| Income | Higher incomes perceived as more sensitive | ||
| Education | Less education had more positive perceptions | More educated perceived as more sensitive | |
| User Groups | |||
| Residential Status | Resident (Non-Student) perceived as less well managed than Regional Tourist and Student Resident | Resident (Non-Student) perceived as more sensitive than all other user groups. | |
| Frequency of Visits to SMR | Low frequency visitors had more positive perceptions | Low frequency visitors had more positive perceptions |
| Loss of Water Quality | Crowding Preferences | Interpretation | |
|---|---|---|---|
| Social Groups | |||
| Residency (Years) | 0.6389 (3.3980) | <0.0001 *** (29.7388) | Longer residency preferred fewer people |
| Race/ethnicity | 0.3283 (0.9554) | 0.0002 ** (13.8414) | White preferred fewer people in the river |
| Age | 0.4014 (5.1199) | 0.3461 (5.6094) | |
| Income | 0.0270 * (10.9633) | 0.0558 (9.2198) | Higher income were more likely to avoid a dirty river. |
| Education | 0.3306 (5.7568) | 0.0010 ** (20.6223) | More education preferred less crowded |
| User Groups | |||
| Residential Status | 0.0017 ** (17.2383) | 0.0003 ** (20.8940) | Regional Tourists preferred more than a few people and were less likely to reduce use with degraded water quality |
| Frequency | 0.6245 (0.415) | 0.1279 (4.1133) |
| Types of Values | Social Groups | ||||
|---|---|---|---|---|---|
| Age | Residency (Years) | Race/Ethnicity | Annual Household Income | Education Attainment | |
| Intrinsic | |||||
| Habitat for plants and animals | Residents living in San Marcos for 1 and 3 years valued higher | Higher education valued higher | |||
| Clean Water Clean and reliable water from the aquifer groundwater | Long-term residents valued higher | ||||
| Utilitarian | |||||
| Food A source of fish for your meals | Highly varied; inversed with education (less education valued higher | ||||
| Water Source A source for municipal, industrial, or agricultural water uses | Higher income valued higher | ||||
| Relational | |||||
| Culture A place for relaxing or enjoying the scenery and local culture | Younger value higher | Newer residents valued higher | Lower income valued higher | College students valued higher than those with degrees | |
| Recreation Physical activities in nature | Not valued as high by those 6 years+ | ||||
| Inspiration Artistic, cultural, or work-related activities | Difference between age groups 55–64 and 65+; 55–64 valued higher | New residents (1 year) valued higher than 6 years or more | Nonwhite visitors valued higher than white | ||
| Aesthetics Relaxation, scenery, or sentimental value | |||||
| Education Opportunity to experience, learn about, or appreciate nature | Older users valued higher | ||||
| Identity Cultural heritage, local pride, sense of place, symbol of San Marcos | More years valued higher | ||||
| Spirituality Sacred, religious, or mental health activities | More years valued higher | ||||
| Types of Values | User Groups | |
|---|---|---|
| Residential Status | Frequency | |
| Intrinsic | ||
| Habitat for plants and animals | ||
| Clean Water Clean and reliable water from the aquifer groundwater | Resident (Non-Student) valued higher than Student Resident and Regional Student | |
| Utilitarian | ||
| Food A source of fish for your meals | Least valued Regional Tourist valued higher than Regional Student and Resident (Student) | |
| Water Source A source for municipal, industrial, or agricultural water uses | Nonregional Tourist valued higher than Student Resident, Regional Student, and Resident (non-student) Regional Tourist valued higher than Student Resident and Regional Student | |
| Relational | ||
| Culture A place for relaxing or enjoying the scenery and local culture | Resident (non-student) valued lower than Student Residents and Regional Students Residents (students) valued higher than Nonregional Tourist and Regional Tourist Regional Students valued higher than Nonregional Tourist and Regional Tourist | |
| Recreation Physical activities in nature | Resident (Non-Student) valued lower than Resident (Student), Regional Student, Regional Tourist, and Nonregional Tourist | Visitors in the “Low” group valued more than visitors in the “High” group |
| Inspiration Artistic, cultural, or work-related activities | ||
| Aesthetics Relaxation, scenery, or sentimental value | Visitors in the “Low” group valued more than visitors in the “Medium” and “High” groups | |
| Education Opportunity to experience, learn about, or appreciate nature | ||
| Identity Cultural heritage, local pride, sense of place, symbol of San Marcos | Regional Tourist valued higher than Student Resident; Resident (Non-student), and Regional Student | |
| Spirituality Sacred, religious, or mental health activities | Resident (non-student) valued higher than Student Resident and Regional Student | |
| Relational Model | User Groups | |||||
|---|---|---|---|---|---|---|
| Resident (Non-Student) (n = 355) | Resident (Student) (n = 1905) | Student (Regional) (n = 540) | Tourist (Regional) (n = 156) | Tourist (Non-Regional) (n = 67) | Total (% of Total) | |
| Detachment | 1 (<1%) | 25 (1%) | 5 (1%) | 7 (4%) | -- | 38 (1%) |
| Domination | 1 (<1%) | 4 (<1%) | 2 (<1%) | -- | -- | 7 (<1%) |
| Utilization | 95 (27%) | 651 (34%) | 201 (37%) | 48 (31%) | 24 (36%) | 1019 (34%) |
| Stewardship | 239 (67%) | 1107 (58%) | 300 (56%) | 99 (63%) | 42 (63%) | 1787 (59%) |
| Wardship | 19 (5%) | 118 (6%) | 32 (6%) | 2 (1%) | 1 (1%) | 172 (6%) |
| Relational Model | Social Actor Comment (User Group) |
|---|---|
| Detachment | Is urban growth sensitive to the San Marcos River? (Resident, Student) |
| Have they ever thought of lifeguards? We would love it. (Tourist, Regional) | |
| It needs more publicity. (Resident, Student) | |
| Domination | I don’t have a problem with [the sensitivity of the SMR]. (Resident, Student) |
| Utilization | Love it but it should be privately owned. This would lead to greater efficiency in projects. (Resident, Non-student) |
| Would love more handicap accessible parking spots and more parking in general. (Tourist, Regional) | |
| I would like to see more consideration for the HUMANS who recreate/there by cutting back the wild rice. (Resident, Non-student) | |
| I think the San Marcos River is underutilized, but I would hate to see it turn into the Comal River in New Braunfels. Maybe some more events "along" the river but not "IN" the river. (Resident, Non-student) | |
| Stewardship | I think we should be more aware of the damage we can do to our environment in order to enjoy it more responsibly. (Resident, Student) |
| I really care about the protection of the clarity of the water and the fish. (Resident, Non-student) | |
| It is part of who we are...best to honor and protect it. (Resident, Non-student) | |
| It should be treasured and preserved. (Tourist, Regional) | |
| More strict on actions of people within the river and less enjoyment by the local traffic. (Resident, Student) | |
| Wardship | It’s time for a more concerted effort from City Council. The river isn’t just a money making tourist attraction. It’s the life of this beautiful city. (Resident, Non-student) |
| I suggest there has to be policies that increment strict habits to protect San Marcos river. (Student, Regional) | |
| Use as much money and man power it takes to keep the river clean and habitable for the rare species of wildlife that live in the river. (Resident, Student) | |
| I would be willing to pay more or limit my recreational use of the river for its sake, and I think that through education other people may begin to agree with that. (Resident, Non-student) | |
| I feel the river needs to be more protected. As far as the ecosystem and all the animals that use it as a resource. (Student, Regional) |
| Place-Based Asset | Identity-Expressive |
|---|---|
| “The river is a holy place, a blessing to mankind.”—Resident, non-student | “[I] see myself as a keeper of the river.”—Resident, non-student |
| “San Marcos residents and government need to realize the importance of the river in our town, as well as how to protect it, to the fullest.”—Resident, non-student | “I’ve noticed in the past 43 years that as people become acquainted with our river, they develop an intimate desire to call it their own. Perhaps for its beauty and clarity, or ability to change your overall mood during the hot summers, but there is certainly something special about this river for each of us.”—Resident, non-student |
| “Our river truly is a gem, and an important resource to enrich the environment, and the lives of many. It needs to be protected.”—Resident, student | “SM river is an amazing place that should be preserved, and if that means that I (and others) should not use it, I wouldn’t.”—Resident, student |
Disclaimer/Publisher’s Note: The statements, opinions and data contained in all publications are solely those of the individual author(s) and contributor(s) and not of MDPI and/or the editor(s). MDPI and/or the editor(s) disclaim responsibility for any injury to people or property resulting from any ideas, methods, instructions or products referred to in the content. |
© 2023 by the authors. Licensee MDPI, Basel, Switzerland. This article is an open access article distributed under the terms and conditions of the Creative Commons Attribution (CC BY) license (https://creativecommons.org/licenses/by/4.0/).
Share and Cite
Lopez, C.W.; Wade, M.T.; Julian, J.P. Nature–Human Relational Models in a Riverine Social–Ecological System: San Marcos River, TX, USA. Geographies 2023, 3, 197-245. https://doi.org/10.3390/geographies3020012
Lopez CW, Wade MT, Julian JP. Nature–Human Relational Models in a Riverine Social–Ecological System: San Marcos River, TX, USA. Geographies. 2023; 3(2):197-245. https://doi.org/10.3390/geographies3020012
Chicago/Turabian StyleLopez, Christina W., Madeline T. Wade, and Jason P. Julian. 2023. "Nature–Human Relational Models in a Riverine Social–Ecological System: San Marcos River, TX, USA" Geographies 3, no. 2: 197-245. https://doi.org/10.3390/geographies3020012
APA StyleLopez, C. W., Wade, M. T., & Julian, J. P. (2023). Nature–Human Relational Models in a Riverine Social–Ecological System: San Marcos River, TX, USA. Geographies, 3(2), 197-245. https://doi.org/10.3390/geographies3020012