Article

The Effect of Twitter App Policy Changes on the Sharing of Spatial Information through Twitter Users

Geomatics Sciences, Fort Lauderdale Research and Education Center, University of Florida, Davie, FL 33314, USA
*
Author to whom correspondence should be addressed.
Geographies 2022, 2(3), 549-562; https://doi.org/10.3390/geographies2030033
Submission received: 16 July 2022 / Revised: 22 August 2022 / Accepted: 31 August 2022 / Published: 5 September 2022
(This article belongs to the Special Issue Advanced Technologies in Spatial Data Collection and Analysis)

Abstract

:
Social media data have been widely used to gain insight into human mobility and activity patterns. Despite their abundance, social media data come with various data biases, such as user selection bias. In addition, a change in the Twitter app functionality may further affect the type of information shared through tweets and hence influence conclusions drawn from the analysis of such data. This study analyzes the effect of three Twitter app policy changes in 2015, 2017, and 2019 on the tweeting behavior of users, using part of London as the study area. The policy changes reviewed relate to a function allowing to attach exact coordinates to tweets by default (2015), the maximum allowable length of tweet posts (2017), and the limitation of sharing exact coordinates to the Twitter photo app (2019). The change in spatial aspects of users’ tweeting behavior caused by changes in user policy and Twitter app functionality, respectively, is quantified through measurement and comparison of six aspects of tweeting behavior between one month before and one month after the respective policy changes, which are: proportion of tweets with exact coordinates, tweet length, the number of placename mentions in tweet text and hashtags per tweet, the proportion of tweets with images among tweets with exact coordinates, and radius of gyration of tweeting locations. The results show, among others, that policy changes in 2015 and 2019 led users to post a smaller proportion of tweets with exact coordinates and that doubling the limit of allowable characters as part of the 2017 policy change increased the number of place names mentioned in tweets. The findings suggest that policy changes lead to a change in user contribution behavior and, in consequence, in the spatial information that can be extracted from tweets. The systematic change in user contribution behavior associated with policy changes should be specifically taken into consideration if jointly analyzing tweets from periods before and after such a policy change.

1. Introduction

Social media platforms are virtual communication channels for sharing local and international news and opinions [1]. The advent of smartphones facilitated the collection of accurate location information within various operating systems and applications based on built-in Global Navigation Satellite System (GNSS) capabilities and WiFi modules [2]. The most prominent among over 100 social media platforms include Twitter for microblogging, YouTube for videos, Facebook for social networking, and LinkedIn for jobs [3]. Social media content shared can be classified by information type, such as geotagged text (Twitter), geotagged photos (Instagram, Flickr), and check-in information (Swarm) [4]. Geotagged social media messages are increasingly used for a better understanding of public behavior patterns [5,6], the monitoring and prediction of worldwide events [7,8] and natural disasters [9], and to support public health essential services [10,11]. Its information can supplement or replace data collected from traditional surveys, e.g., for modeling urban mobility patterns [12], visitation rates in protected natural areas [13], or the use of building blocks [14,15]. Social media platforms also help governmental sectors improve communication with citizen participation in community-related questions and the transfer of best practices [16,17]. Social media usage varies over time, and its use is affected by local, regional, and global events [18,19].
Twitter is one of the most popular social media apps. It allows registered users to communicate and share information through posts (tweets). Each tweet can hold up to 280 characters and may contain location data with exact coordinates, a place name from a variety of administrative levels, and a bounding box with the coordinates of its four corners [20,21,22]. Twitter geolocation contributions are used to identify human flow patterns based on the characteristics of mobility rate, the radius of gyration, diversity of destinations, and inflow–outflow balance [23,24].
Despite the abundance, extensive spatial and temporal coverage, and an enormous user base of social media data, they come with various types of biases that can lead to inaccurate analysis results [25,26,27]. Data bias exists not only on social media but generally in user-generated content and may be caused by user selection, socioeconomic factors, or specially targeted user groups for certain social media platforms [26,28,29,30]. For example, users of bicycle tracking apps are not representative of the general cyclist population because the app user base is skewed towards male and younger cyclists in the case of Strava [31,32]. An examination of user samples from several bicycle smartphone apps in North America revealed that the apps tended to under-sample females, older adults, and lower-income populations [33].
User selection bias varies across different social media platforms, in part because different social media platforms have different target users. In addition, social media use varies by socioeconomic factors, including education, type of occupation, income, age, and race [34]. One study found that black and Hispanic neighborhoods feature fewer PokéStops than commercial, recreational, touristic, and university locations and thus disadvantage the local population in black and Hispanic neighborhoods [31,35]. Gender bias was observed in OpenStreetMap (OSM) editing and tagging activities, which were primarily conducted by male users [36]. In addition, platform policy and app functionality also affect user contribution behavior. For example, the Twitter policy change, which increased the maximum allowable tweet length from 140 to 280 characters in 2017, resulted in tweets containing more hashtags, definite articles, characters per sentence, and punctuation marks, but also in tweets with fewer abbreviations [37,38]. Twitter has gone through multiple policy updates. Whereas various studies analyzed the character change policy from 2017, other policy changes are rarely discussed. This may be because these policy changes do not directly change constraints on tweets themselves but rather on tweet metadata (i.e., sharing of exact coordinates). As for the 2017 policy change, previous studies analyzed primarily linguistic effects, whereas other changes, such as the use of geographic placenames or photos, or users’ traveled activity space, were not discussed, although these characteristics can be of interest for spatial analysis tasks.
User behavior and information diffusion in social media can be analyzed from different perspectives, e.g., alongside a spatial and temporal dimension [39]. User policies can affect how users interact and share data on a social media platform [40] and, in consequence, the information that can be harvested from shared information, such as user posts. Policy changes have, for example, been implemented to reduce the spread of false content on Twitter and Facebook [41]. Another study reviewed how changes in the functionality (e.g., privacy settings, accepting friendships) on social networking sites, such as Facebook, Twitter, and YouTube, may make these technologies less perilous for health professionals [42].
The main objective of this paper was to identify the underexplored effects of three policy changes for the Twitter app on user contribution behavior and, thus, the spatial information that can be retrieved from contributed data, i.e., posts. These effects are identified by comparing contributed data before and after the following three Twitter policy changes: (1) The removal of a default option to share exact coordinates with each tweet (April 2015); (2) The increase in the allowable tweet length from 140 to 280 characters (November 2017); (3) Limiting the sharing of exact coordinates to the Twitter photo app only (June 2019) [43]. In order to quantify the change in user behavior, six behavioral characteristics (variables) were extracted from one month before and after the policy update period. These variables are the proportion of tweets with exact coordinates, tweet length, the average number of placenames in tweet text or hashtag per tweet (rate), the proportion of tweets with images among tweets with exact coordinates, and the radius of gyration of tweet locations.
The remainder of the paper is structured as follows: Section 2 describes data collection, data processing, and data analysis methods and formulates research hypotheses. Section 3 shows the results of pre-post policy comparisons of user contribution behavior along the six contribution variables, which is followed by a discussion of the results in Section 4 and conclusions and directions for future work in Section 5.

2. Materials and Methods

2.1. Study Area

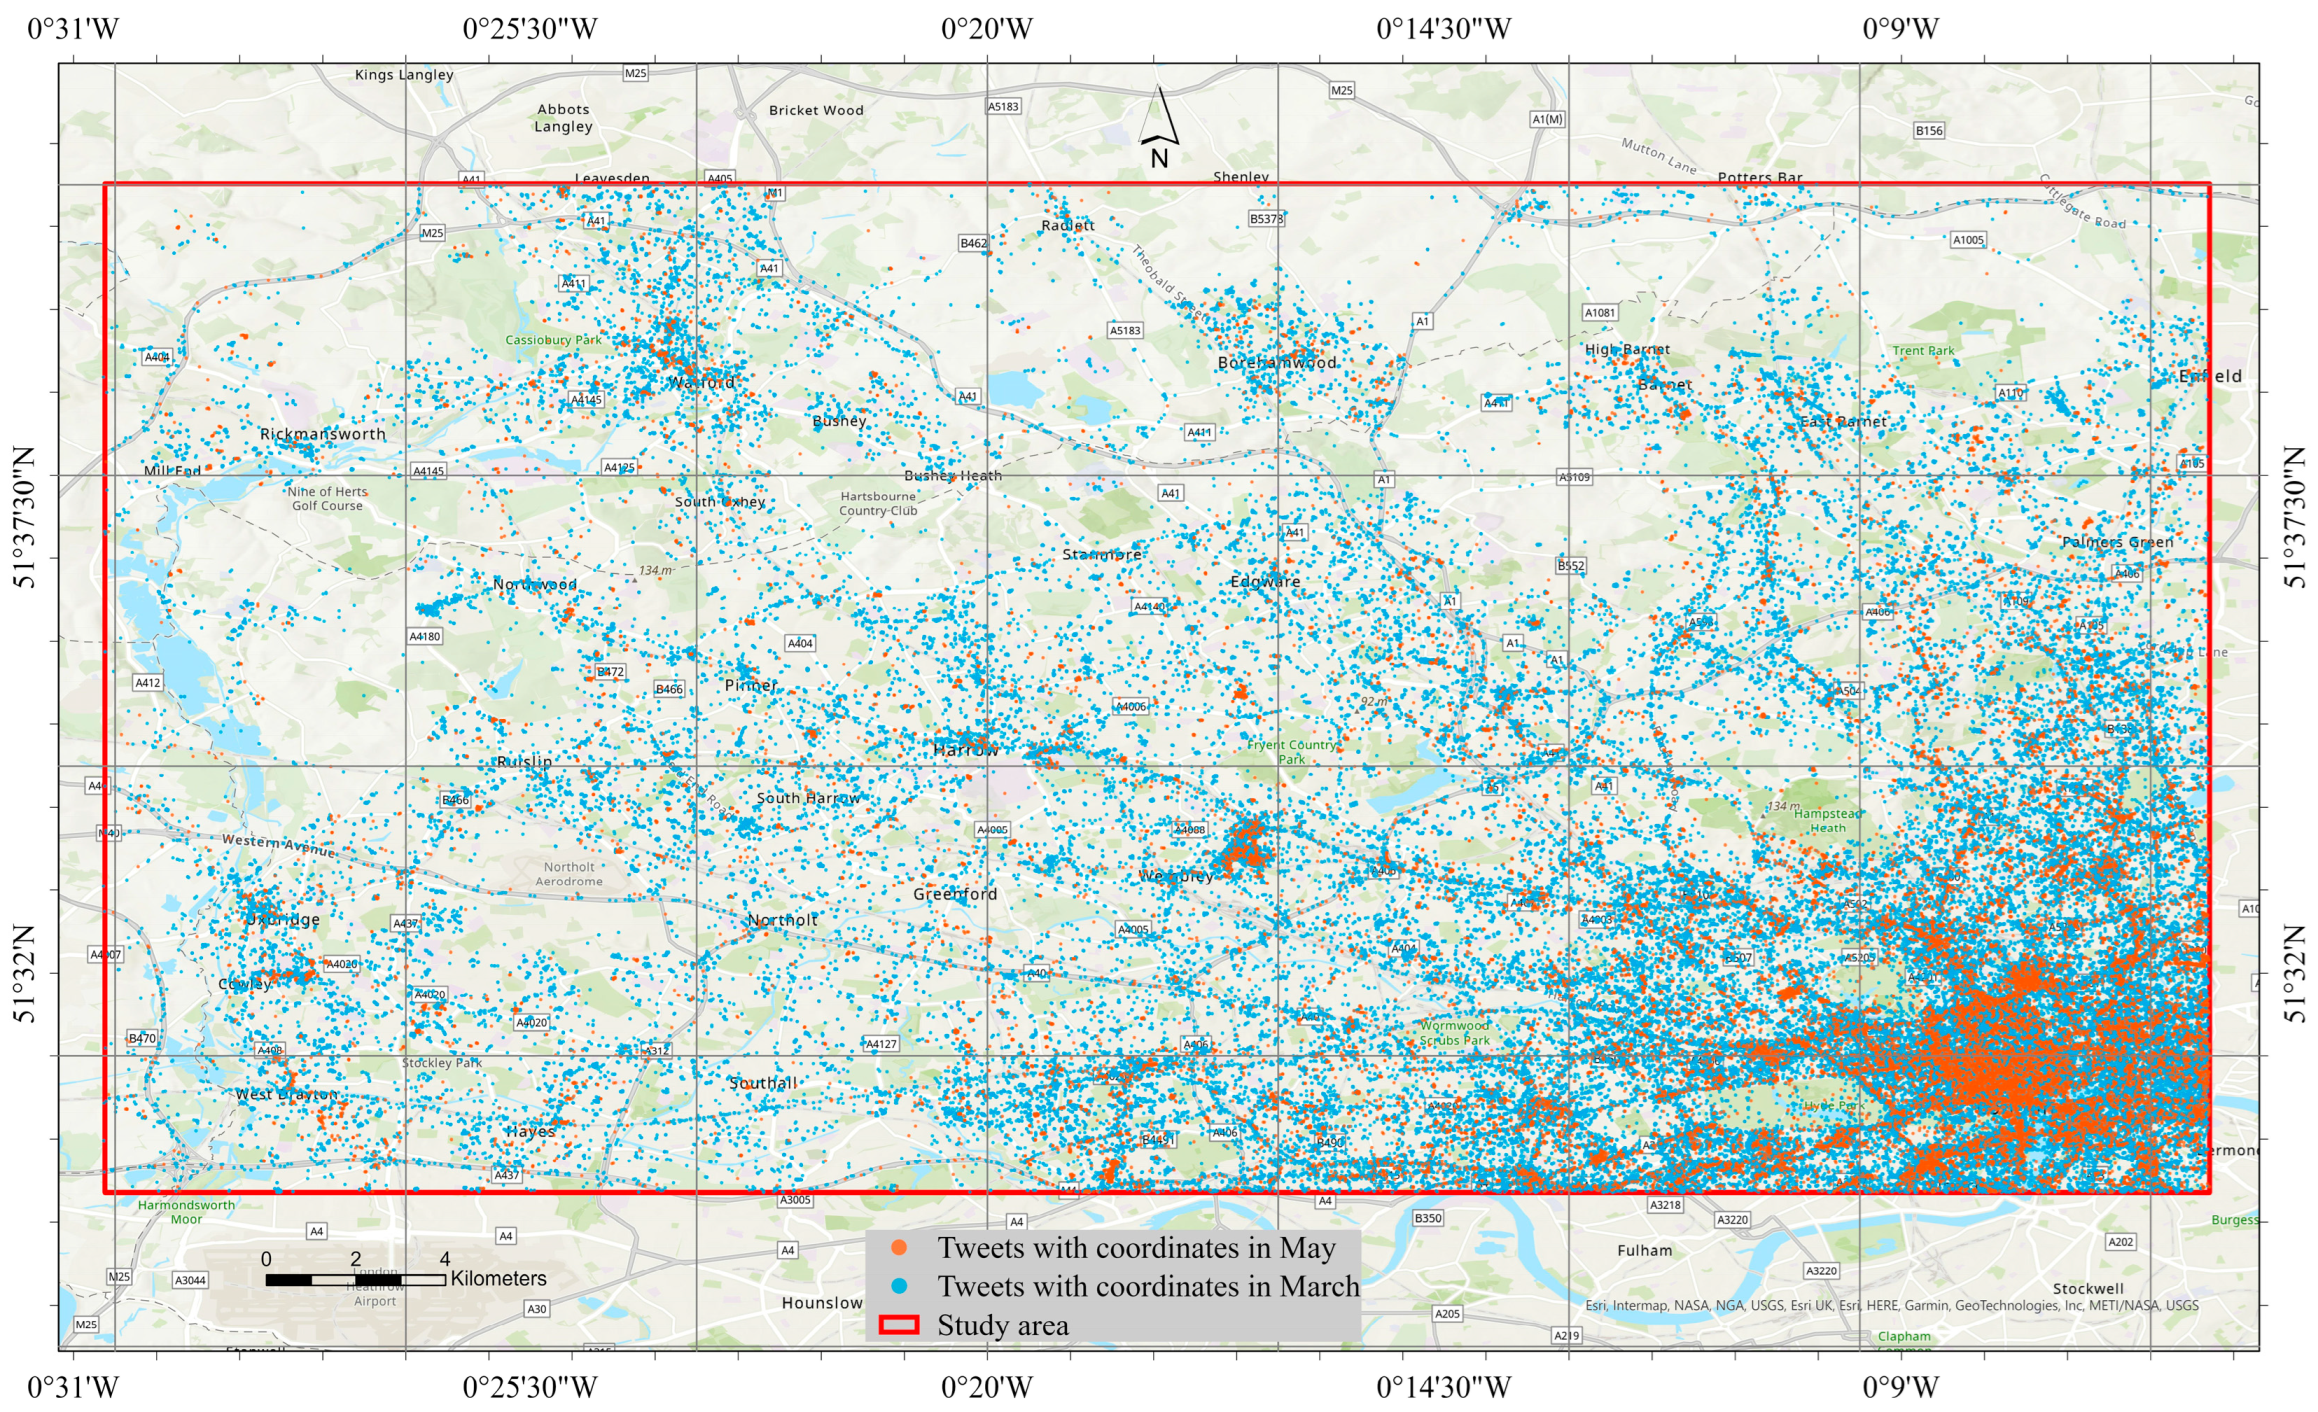
Geotagged tweets were collected from the northwestern part of London, which covers approximately 659 km2 (red rectangle in Figure 1). This London test region was chosen since it covers both urban and suburban areas, provides sufficient data for the analysis of the three policy changes, and has most tweets posted in English.
Blue dots in Figure 1 show the location of tweets with exact coordinates in March 2015, which was before the first policy change. As opposed to this, orange dots show tweet locations after the policy change in May 2015. Figure 1 clearly illustrates the decline in the number of tweets with exact coordinates through the 2015 policy change. The same study area was used to assess the effects of 2017 and 2019 policy changes on contribution patterns.

2.2. Data Collection

Geotagged tweets were downloaded in JavaScript Object Notation (JSON) format through the Twitter Application Programming Interface (API) in combination with the “request” Python library. To specify the download area, the “bounding_box” operator was applied, which allows a maximum allowable length of each bounding box side of 25 miles.
For each policy change analyzed, the data of one month before and one month after the policy updates were collected (Table 1) and stored in a PostgreSQL database. This procedure resulted in the download of tweets that were mostly geotagged with exact coordinates, whereas a small number of tweets were geocoded at the city-, administrative-, or country level or through a Point of Interest (POI).
The following attributes were extracted for each tweet from the raw JSON data: tweet id, text, language, time created, author id, source platform, place id, geotag type, coordinates, hashtags, bounding box, feature type, place name, place name code, country, place type.
Tweets can come in over 50 languages from over 180 sources, including Flickr, the Twitter Web client, or Instagram. For this study, only tweets in English were considered. Moreover, since the focus of this research is on assessing the effect of changes in the Twitter app on tweeting behavior, only tweets posted from mobile tweeting platforms were used for the analysis, which includes the following sources: Twitter for iPhone, Twitter for Android, Twitter for iPad, and Twitter for Android Tablets. Table 1 shows the number of tweets in the study area before and after language and source filtering for the months around the three considered policy changes.

2.3. Research Hypotheses

A research hypothesis can be defined by posing the expected direction of change, i.e., larger (>) or smaller (<), for each of the six behavioral variables that are assessed with respect to policy changes. Technically, in connection with the Monte Carlo permutation tests, these hypotheses denote alternative hypotheses since a null hypothesis in a statistical test postulates no change in the population parameter under consideration (e.g., mean or median) [44]. The six hypotheses are stated for each policy change, resulting in a total of 18 hypotheses (H1 through H18) across the three years (Table 2).
The alternative assumptions were made based on the expected effect of a policy update on a variable of interest. Explanations for the expected directional change of variable means after a policy change for the 18 hypotheses are detailed in Table 3.
In addition, it was hypothesized that when expanding the comparison period beyond the month before and after a policy, the change results in a more distinct observed effect on the analyzed variables. This is because there may be a delay in updating apps on mobile devices to the newest app version for various reasons and hence a delay in policy changes taking effect for some users. To test this hypothesis, change in variable means across multiple years, i.e., between March 2015 and December 2017 and between March 2015 and July 2019, was compared to changes associated with individual policy updates in the corresponding years. The first multi-year time span comprises two policy changes, and the second one three policy changes.

2.4. Variable Calculation

The following items describe the steps involved in computing the behavioral variables for one month before and one month after the month of the policy update. The sample size for before and after equals the number of users who meet the criteria to be included in the pre-post comparison.
  • Proportion of tweets with exact coordinates
This is the number of tweets with exact coordinates divided by the total number of geotagged tweets posted by a user. Only tweets from users who posted at least one tweet with exact coordinates in the month before and in the month after the policy change period were considered;
2.
Tweet length
The tweet length is the average text length of tweets posted by a user. Only tweets from users who posted at least one tweet in the month before and in the month after the policy change period were considered. Although the maximum tweet length was set to 280 characters after the policy change in November 2017, tweets can sometimes exceed 280 characters. This is because, through the Twitter API, some symbols are replaced with a string of characters. For example, “>” is converted to “&gt;” during the download process;
3.
Rate of placename mentions in the text and hashtags
These rates are computed as the number of times a placename is mentioned in the text or in the hashtags, respectively, divided by the number of tweets posted by that user. Only tweets from users who posted at least one tweet in the month before and in the month after the policy change period were considered. In order to identify a placename in a post, the Python language processing library “spaCy” was applied, which can recognize entity names, such as companies, agencies, or countries. The “en_core_web_sm” model was applied to extract geopolitical entities such as countries, cities, and streets. Due to potential false positives, identified place names had to be checked manually regarding their existence using Google Maps. Further, to disambiguate ambiguous terms, the entire tweet text was used in a manual check. For example, the ambiguous name “Primark” can point to a brand or a store. The correct meaning becomes evident when reviewing the tweet text;
4.
Proportion of tweets with images among tweets with exact coordinates
The first step in this computation involves the identification of images or videos attached to tweets. An image or video in tweets is shown as a link. However, a link does not always point toward a picture or video. Instead, it could also, for example, point to a website a user wants to share. Therefore, each link needed to be checked.
For this analysis, only tweets from users who posted at least one tweet in the month before or after the policy change period were considered. In order to check each link for the presence of images or videos, several libraries were applied. The Python library “Selenium” was used to simulate the browser to call the extracted links one after another. Xpath is an XML (Extensible Markup Language) Path language and can be used to navigate to elements and attributes of an XML document. Upon server return, the loaded website source code is parsed for “Alt = Image” using XPath. If this relation is present, at least one image exists in the tweet content.
In addition, the presence of videos was checked manually for tweets whose links were not pointing towards an image. Whenever the image or video exists, the corresponding tweet is counted as one. The sum of all tweets with images or videos by a user was then divided by the total number of tweets of that user;
5.
Radius of gyration
The radius of gyration, rg, measures the geometric spread of locations, in this case, tweets, and is computed as
r g = 1 n i ( r i r c ) 2
where n is the number of geotagged tweet locations of an individual user, r i is the location of tweet i , and r c is the geometric center of the geotagged tweets.
For this analysis, only tweets from users who posted at least two tweets with exact coordinates before or after the policy change period were considered. The radius of gyration of each user was computed using the R package “Mobility” in the month before and after the policy change.

2.5. Monte Carlo Permutation Test

The mean values of variables across eligible users before and after the policy change were compared through a Monte Carlo permutation test [45] to identify whether the means changed as hypothesized.
The null hypothesis of the Monte Carlo permutation test is that both samples (i.e., before and after policy change variable values) come from the same distribution. The distribution of the test statistic, i.e., the mean difference between before and after policy variable values, was obtained through permutation, that is, by randomly assigning all observed variable values (e.g., average tweet length of each user from before and after policy change) to a before and after bin, followed by taking mean differences between both bins, and repeating this step 10,000 times. Next, the difference of means between observed variable values from tweets before and after the policy change was computed. The one-sided p-value of the test was computed as the proportion of sampled permutations for which the difference in means is greater (or smaller) than the mean difference of the randomized sample, where the direction of testing depends on the hypothesis (compare Table 2).

3. Results

This section reports the change in variable means for the three policy changes in the years 2015, 2017, and 2019 as well as for the across-year comparisons.

3.1. Results of the 2015 Policy Change

Table 4 reports the mean values of variables and their standard deviation before and after the 2015 policy change together with the p-value, which is shown in boldface if p < 0.05. Hypothesis numbers shown to the right refer to Table 3.
The results show that the decrease in the proportion of tweets with exact coordinates from 97.3% to 17.5% and the decrease in the radius of gyration by about 107 m through this policy change is statistically significant. The directions of observed differences for these two variables are in line with the predicted change directions (compare Table 2). Figure 2 shows that tweets with exact coordinates dropped from about 6000 to 1000 per day around April 25th, with a slight gradual decrease afterward. Moreover, tweets of geotagging type “city” gradually increased from zero to about 400 per day, which compensates for some of the loss in exact coordinate information.
Tweets with other geotagging types, including “admin”, “country”, and “POI” were close to zero.
For more details, Table 5 juxtaposes the number of different types of geotagged tweets for the month before and after the 2015 policy change, revealing a strong drop in the use of exact coordinates but an increase in city-level tagging. A Chi-square test of independence found that there was a statistically significant association between geotag type and month, X2 (1, N = 4) = 200,893, p < 0.0001. This means that the proportion of geotagging types used changes between before and after the policy change.

3.2. Results of the 2017 Policy Change

Table 6 shows that the increase in tweet length from 97.4 to 111.0 characters and the increase in the rate of placename mentions in tweet text from 0.086 to 0.093 is statistically significant. Where significant, the directions of observed changes were in-line with predictions (compare Table 2).
Figure 3 shows the daily average text length for the three months surrounding the 2017 policy change, with a clear weekly fluctuation pattern (lower tweet numbers on weekends) and a pronounced general increase around 5 November. Tweets are exceptionally short on 25 December (Christmas), suggesting that holiday greetings tend to be shorter than individualized tweet posts.

3.3. Results of the 2019 Policy Change

Table 7 shows that significant changes in the proportion of tweets with exact coordinates, the rate of placename mentions in text and hashtags, and the proportion of tweets with images among tweets with exact coordinates occurred in the hypothesized directions according to Table 2.

3.4. Results of Across-Year Comparisons

In Table 8, underlined p-values in boldface refer to those multi-year time spans where the significance level of mean change increased compared to individual policy updates (compare Table 4, Table 6, and Table 7). It shows that in four cases, an extension of the analyzed time span beyond a plus-minus one-month analysis period strengthens the significance of observed effects. This suggests that planned policy changes, at least in part, take more time to take effect beyond the announced change date. Values in the SD column express the standard deviation of the simulated difference in the mean values between the two listed months, whereas theΔ obs column denotes the observed change in mean values between these two months.

4. Discussion

This study analyzed the change in tweeting behavior and information sharing for six variables in response to policy changes on Twitter apps. The six variables cover different aspects of user contribution behavior and their spatial information.
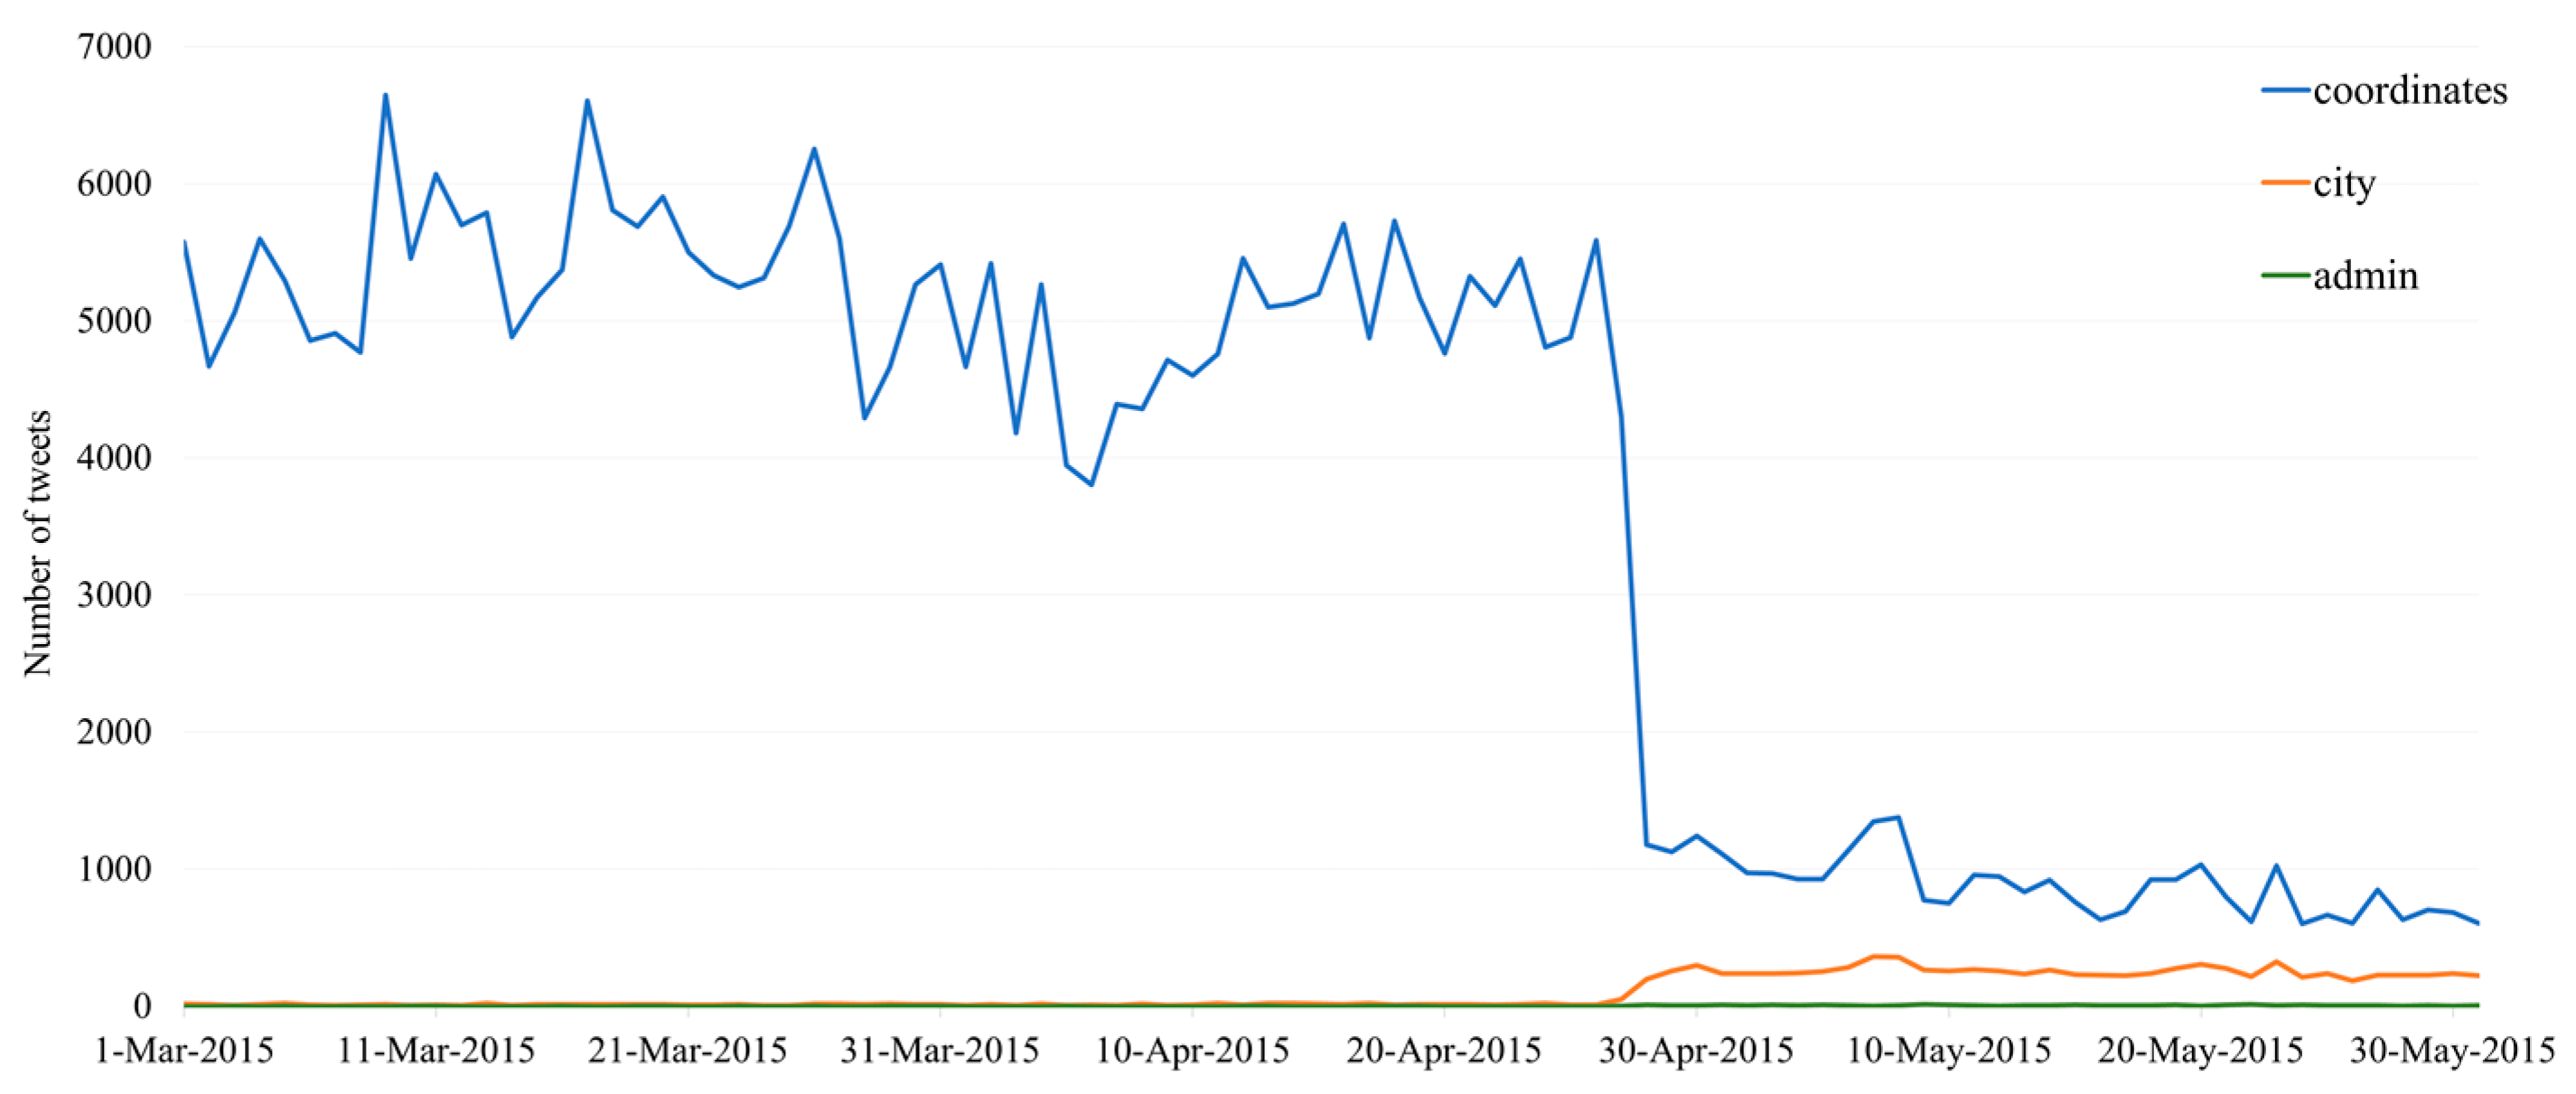
After the 2015 policy update, which removed the function to opt-in for default sharing of exact coordinates with each tweet, the proportion of tweets with exact coordinates among geotagged tweets decreased from 97.3% to 17.5%, which is consistent with H1. The policy, therefore, clearly contributed to a drop in precise location information available in tweets [46]. Whereas the number of tweets with exact coordinates declined through this policy change, tweets with other types of geotags (e.g., at the city level) increased at the same time, albeit to a much lesser degree, leading to an overall decline in geotagged information (compare Figure 2). This can affect travel behavioral analyses at multiple geographic levels. Tweets have been used in longitudinal studies to analyze traffic flows between geographic regions, such as between countries, e.g., for tourism management and policy [47]. A change in the number of geotagged tweets posted per user, e.g., caused by the 2015 policy change, introduces biases when comparing traveler flow data between periods before and after the policy change and would therefore have to be mathematically corrected. Tweets have also been used in the context of natural disasters, such as tracking evacuation travels prior and concurrent to hurricanes. One study, which collected tweets between September and November 2016 for the U.S., found that around 11.34% of tweets had coordinates [48]. This percentage was considered too small to capture enough movements between cities during the evacuation, so more coarse data with a bounding box diagonal of up to 20 km had to be used instead. Tweets with exact coordinates also play a critical role in intra-urban mobility analysis in the context of different domains, such as epidemiological modeling, since human mobility contributes to the spread of viruses at different scales, and humans tend to contract an infection outside the place of residence [49]. These examples of mobility analysis demonstrate how a reduction in tweets with exact coordinates due to policy change limits fine-grained analysis of people’s movement associated with natural disasters or epidemiological modeling.
The 2015 policy update also led to a significant decrease in the radius of gyration derived from tweets. This does not mean that the actual user mobility changed but rather that the extracted information became more biased by omitting part of a user’s local travel patterns, which adds to the general problem of sampling bias for any technology capturing mobility dynamics [50]. It also adds to other Twitter contribution biases that exist. For example, Twitter users’ age and income do not represent the demographic composition of the general population [51]. The radius of gyration is often used to describe people’s activity or travel areas, such as visiting patterns and travel distances to football games [52].
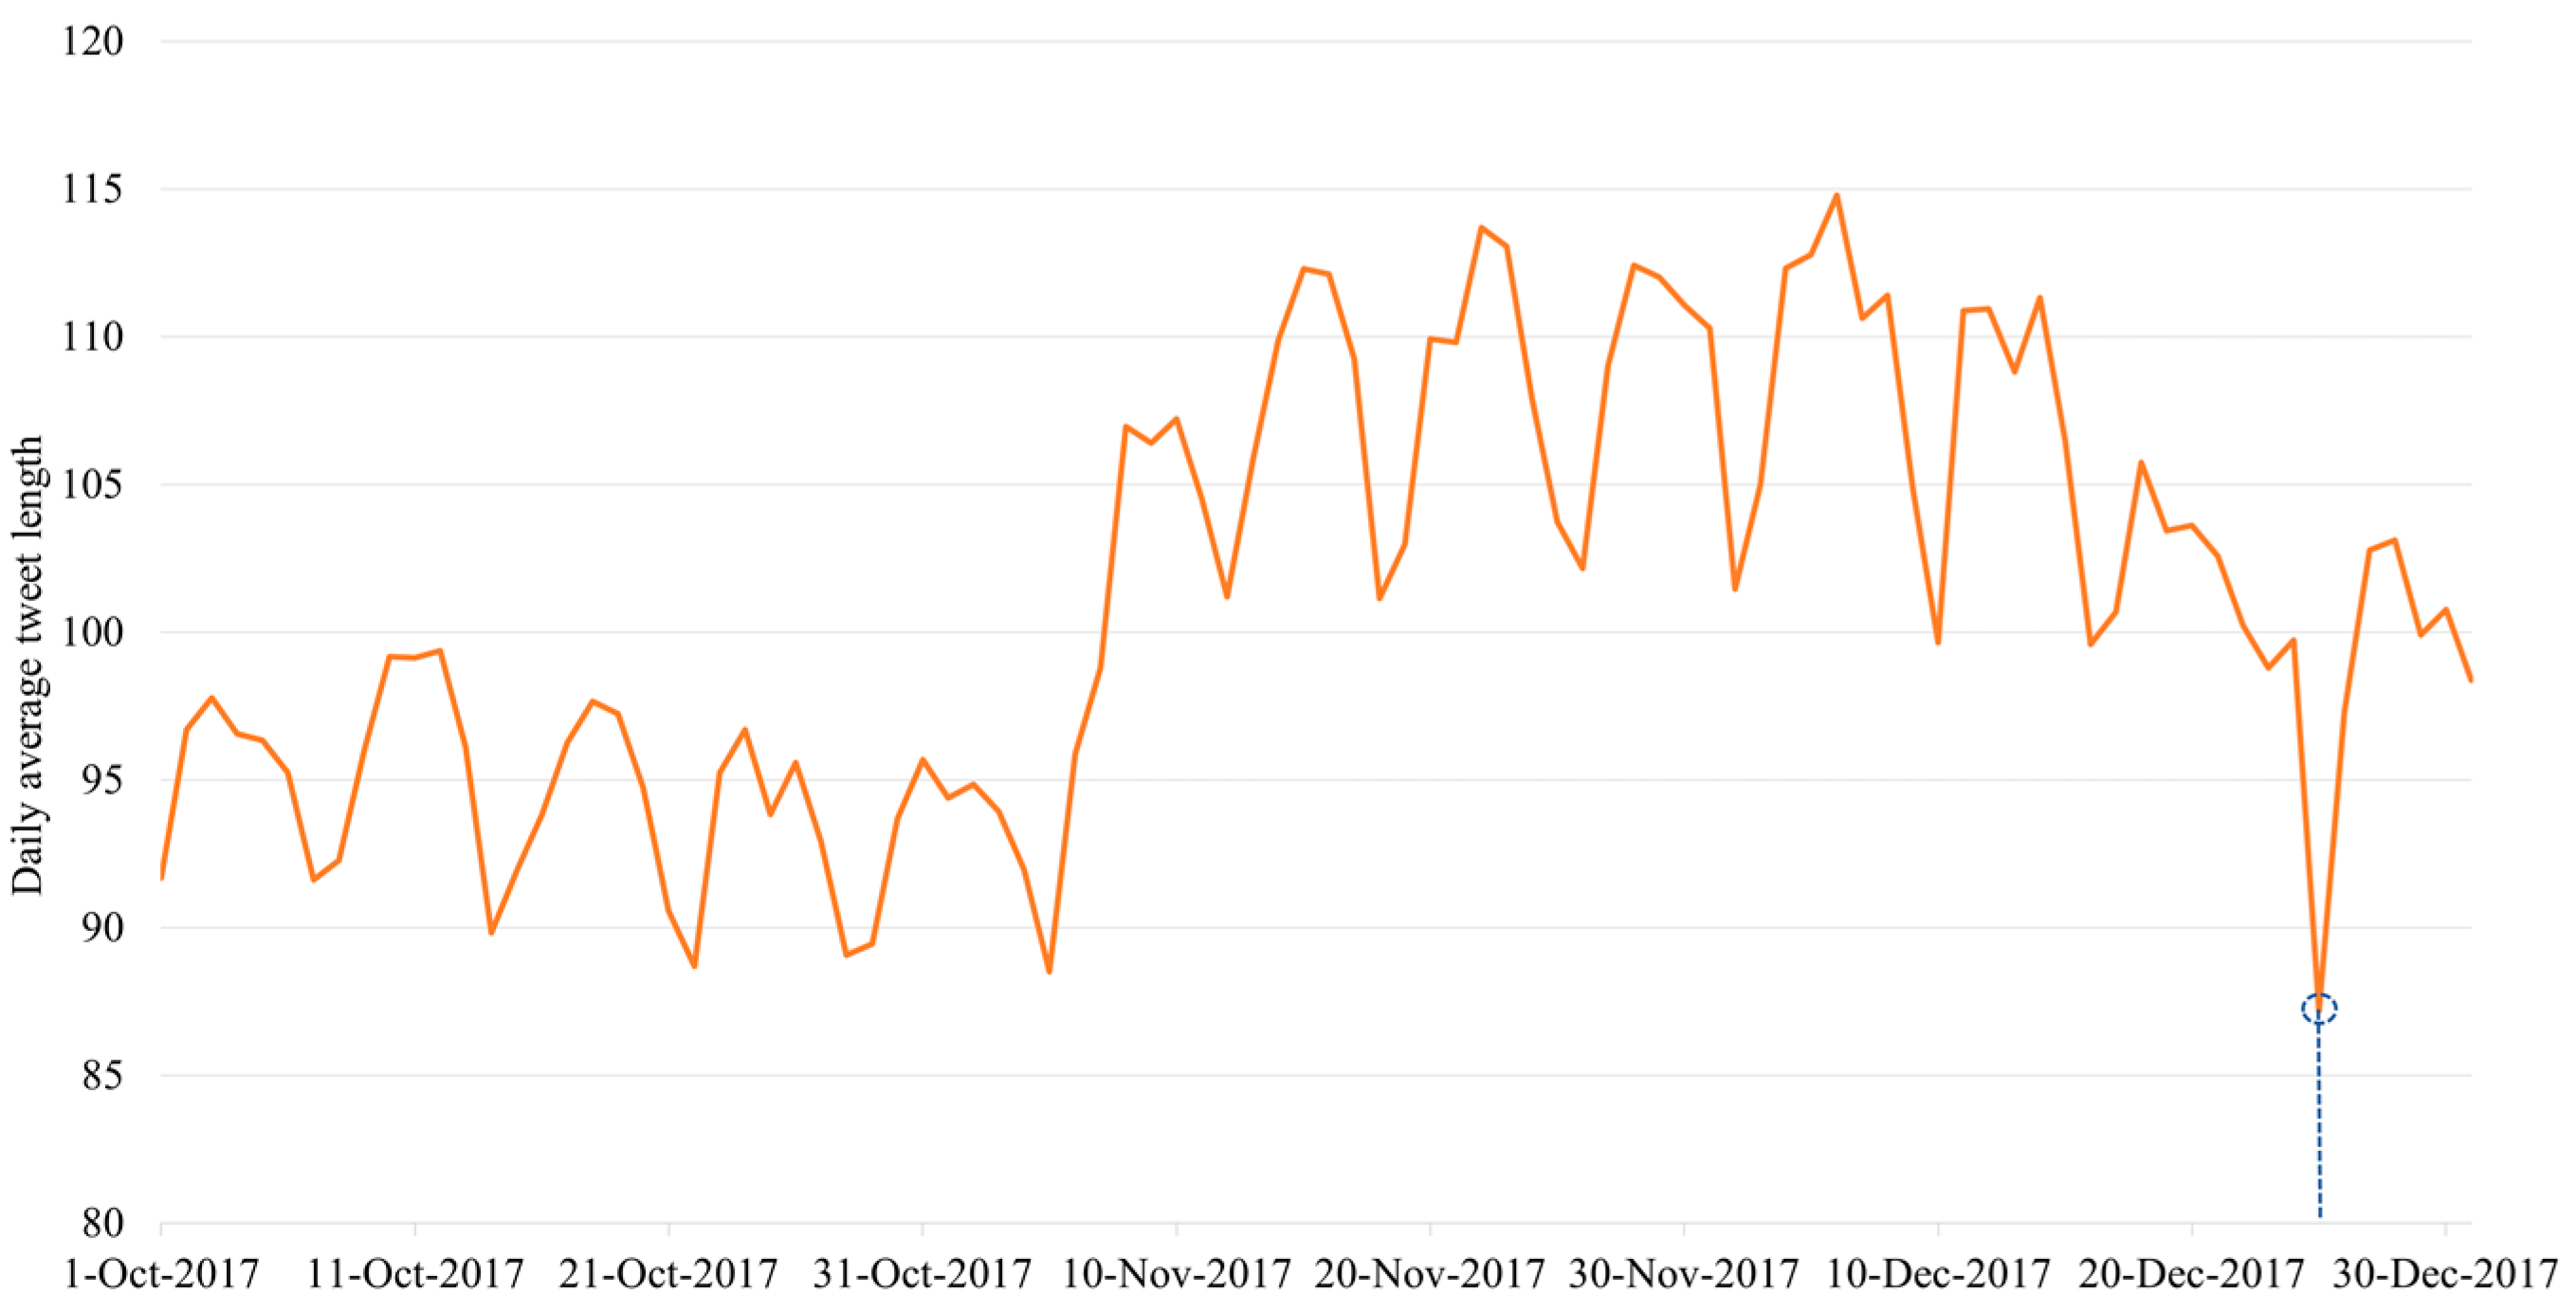
Doubling the number of allowable characters through the 2017 policy led to the expected increase in tweet length (14.0%) but also to a slight increase in the rate of placenames in tweets. This means that more users use the opportunity to specify a location of interest via textual description. The periodic ups and downs in the average length of tweets (Figure 3) suggest that when investigating the twitter length, the analyzed period should be at least one week, where holidays may have additional short-term effects. The increased twitter length in 2017 helped to mitigate the difficulty of sentiment analysis using Twitter data because the 140-character restriction posed a challenge for sentiment information mining [53]. The increase in placenames in tweets after the 2017 policy change also helped to construct placename corpora from tweets where mentioned location entities are identified and geolocated to toponyms in existing geographical gazetteers [54].
The 2019 policy, which restricts sharing of exact coordinates, led to an additional drop in the proportion of tweets with exact coordinates by about 50%, leading to further data scarcity of this type of positional information. As expected, the proportion of tweets with images among tweets with exact coordinates increased, although it did not reach 100%. A possible reason might be the delay of Twitter app updates to the latest version for some users. Whereas the positional accuracy of Twitter images was in the range of multiple kilometers before [55], it can be expected to be much improved through the policy change and the attachment of exact coordinates to images. While the decline in the share of tweets with exact coordinates reduces the possibilities for analysis at a refined spatial level, e.g., that of intra-urban mobility or land use identification [56], it was suspected that a large share of the provided coordinates does not truly correspond to GPS coordinates [43]. This can be the case when a user picks a pre-defined location in an app, such as on Instagram, for a Twitter cross-post, and this information is then represented as exact coordinates in the tweet. On the positive side, the 2019 policy change, which tightens the use of Twitter images and videos with exact coordinates, opened the possibility for advanced analyses, such as AI technologies, to mine the image and location information together, as used in social sensing for policy implementation [57]. The increased use of geonames in hashtags that comes with the 2019 policy change offsets partially for a decline in exact tweets. Geo-hashtags are commonly used to pinpoint the location of events, such as mobile network outages [58], or to infer sentiments between cities mentioned in tweets [59].
Mean comparisons across multiple years and hence covering more than one policy change showed increased differences for some variables, which partially supports the corresponding hypothesis. The increase in the difference over time may be due to the gradual effect of the policy change on some mobile devices where the update of the app lags behind.

5. Conclusions

This study showed that policy updates of the Twitter app contribute to a change in user behavior and in consequence, to data bias. For example, the radius of gyration of users derived from tweets with exact coordinates dropped significantly after the 2015 policy change, whereas there is no reason to believe that users actually changed their travel behavior within these few months. The bias effects become especially relevant when combining Twitter data that were collected before and after a policy change in the analysis since the dataset may become inconsistent between different time periods. Exact coordinates are important for intra-urban movement modeling based on tweets. However, fewer options to share exact coordinates also reduce tweets with exact coordinates and hence tend to lead to an underestimation of a user’s activity space. Different types of biases are not unique to Twitter but were detected in numerous other data sharing and social media platforms. An ongoing challenge, and thus part of future work, is, therefore, to not only identify biases but also to find methods to address and mitigate biases. Possible approaches include the application of bias-corrected statistical models [60], the combination of different types of crowd-sourced data [61], or the use of geographical covariates [62].
A potential direction for future work includes an expansion of this presented research of analyzing policy change effects on user behavior in other metropolitan cities or even other platforms, such as OSM or Facebook. Some methods, such as the analysis of place name mentions, can potentially be automated using natural language processing (NLP) techniques in order to speed up corresponding analyses, which are needed for the analysis of larger datasets in the future.

Author Contributions

Conceptualization, J.C., F.B. and H.H.H.; methodology, J.C., F.B. and H.H.H.; software, J.C.; validation, H.H.H.; formal analysis, J.C.; resources, J.C.; data curation, J.C.; writing—original draft preparation, J.C.; writing—review and editing, H.H.H.; visualization, J.C.; supervision, H.H.H. All authors have read and agreed to the published version of the manuscript.

Funding

We acknowledge financial support through a UF-CALS matching assistantship granted to the first author.

Data Availability Statement

Not applicable.

Conflicts of Interest

The authors declare no conflict of interest.

References

  1. See, L.; Mooney, P.; Foody, G.; Bastin, L.; Comber, A.; Estima, J.; Fritz, S.; Kerle, N.; Jiang, B.; Laakso, M.; et al. Crowdsourcing, Citizen Science or Volunteered Geographic Information? The Current State of Crowdsourced Geographic Information. ISPRS Int. J. Geo-Inf. 2016, 5, 55. [Google Scholar] [CrossRef]
  2. Blanford, J.I.; Huang, Z.; Savelyev, A.; MacEachren, A.M. Geo-Located Tweets. Enhancing Mobility Maps and Capturing Cross-Border Movement. PLoS ONE 2015, 10, e0129202. [Google Scholar] [CrossRef] [PubMed]
  3. Owuor, I.; Hochmair, H.H. An Overview of Social Media Apps and their Potential Role in Geospatial Research. ISPRS Int. J. Geo-Inf. 2020, 9, 526. [Google Scholar] [CrossRef]
  4. Johnson, I.L.; Sengupta, S.; Schöning, J.; Hecht, B. The Geography and Importance of Localness in Geotagged Social Media. In Proceedings of the Proceedings of the 2016 CHI Conference on Human Factors in Computing Systems, San Jose, CA, USA, 7–12 May 2016; pp. 515–526. [Google Scholar]
  5. Huang, Q.; Wong, D.W.S. Activity patterns, socioeconomic status and urban spatial structure: What can social media data tell us? Int. J. Geogr. Inf. Sci. 2016, 30, 1873–1898. [Google Scholar] [CrossRef]
  6. Wu, W.; Li, J.; He, Z.; Ye, X.; Zhang, J.; Cao, X.; Qu, H. Tracking spatio-temporal variation of geo-tagged topics with social media in China: A case study of 2016 hefei rainstorm. Int. J. Disaster Risk Reduct. 2020, 50, 101737. [Google Scholar] [CrossRef]
  7. Chua, F.C.T.; Asur, S. Automatic Summarization of Events From Social Media. In Proceedings of the International AAAI Conference on Weblogs and Social Media, Cambridge, MA, USA, 8–11 July 2013; pp. 81–90. [Google Scholar]
  8. Jenders, M.; Kasneci, G.; Naumann, F. Analyzing and Predicting Viral Tweets. In Proceedings of the International World Wide Web Conference, Rio de Janeiro, Brazil, 13–17 May 2013; pp. 657–664. [Google Scholar]
  9. Crooks, A.; Croitoru, A.; Stefanidis, A.; Radzikowski, J. #Earthquake: Twitter as a Distributed Sensor System. Trans. GIS 2013, 17, 124–147. [Google Scholar] [CrossRef]
  10. Bartlett, C.; Wurtz, R. Twitter and public health. J. Public Health Manag. Pract. 2015, 21, 375–383. [Google Scholar] [CrossRef]
  11. David, C.C.; Ong, J.C.; Legara, E.F. Tweeting Supertyphoon Haiyan: Evolving Functions of Twitter during and after a Disaster Event. PLoS ONE 2016, 11, e0150190. [Google Scholar] [CrossRef]
  12. Li, Y.; Li, Q.; Shan, J. Discover Patterns and Mobility of Twitter Users—A Study of Four US College Cities. ISPRS Int. J. Geo-Inf. 2017, 6, 42. [Google Scholar] [CrossRef]
  13. Tenkanen, H.; Di Minin, E.; Heikinheimo, V.; Hausmann, A.; Herbst, M.; Kajala, L.; Toivonen, T. Instagram, Flickr, or Twitter: Assessing the usability of social media data for visitor monitoring in protected areas. Sci. Rep. 2017, 7, 17615. [Google Scholar] [CrossRef] [Green Version]
  14. Spyratos, S.; Stathakis, D.; Lutz, M.; Tsinaraki, C. Using Foursquare place data for estimating building block use. Environ. Planning B Urban Anal. City Sci. 2016, 44, 693–717. [Google Scholar] [CrossRef]
  15. Atefeh, F.; Khreich, W. A Survey of Techniques for Event Detection in Twitter. Comput. Intell. 2015, 31, 132–164. [Google Scholar] [CrossRef]
  16. Picazo-Vela, S.; Gutiérrez-Martínez, I.; Luna-Reyes, L.F. Understanding risks, benefits, and strategic alternatives of social media applications in the public sector. Gov. Inf. Q. 2012, 29, 504–511. [Google Scholar] [CrossRef]
  17. Haro-de-Rosario, A.; Sáez-Martín, A.; del Carmen Caba-Pérez, M. Using social media to enhance citizen engagement with local government: Twitter or Facebook? New Media Soc. 2016, 20, 29–49. [Google Scholar] [CrossRef]
  18. Ahmouda, A.; Hochmair, H.H.; Cvetojevic, S. Analyzing the effect of earthquakes on OpenStreetMap contribution patterns and tweeting activities. Geo-Spat. Inf. Sci. 2018, 21, 195–212. [Google Scholar] [CrossRef]
  19. Huang, X.; Li, Z.; Jiang, Y.; Li, X.; Porter, D. Twitter reveals human mobility dynamics during the COVID-19 pandemic. PLoS ONE 2020, 15, e0241957. [Google Scholar] [CrossRef]
  20. Stevens, K.I.; Melilli, E.; Diniz, H.; Gillis, K.; Guerrot, D.; Montero, N.; Soler, M.J.; Desai, T. Tweet me: Conferencing in the era of COVID-19 and 280 characters. Clin. Kidney J. 2021, 14, 2142–2150. [Google Scholar] [CrossRef]
  21. Liu, H.; Luo, B.; Lee, D. Location Type Classification Using Tweet Content. In Proceedings of the 2012 11th International Conference on Machine Learning and Applications, Boca Raton, FL, USA, 12–15 December 2012; pp. 232–237. [Google Scholar]
  22. Hochmair, H.H.; Juhász, L.; Cvetojevic, S. Data Quality of Points of Interest in Selected Mapping and Social Media Platforms; Kiefer, P., Huang, H., Van de Weghe, N., Raubal, M., Eds.; Springer International Publishing: Berlin, Germany, 2018; pp. 293–313. [Google Scholar]
  23. Hawelka, B.; Sitko, I.; Beinat, E.; Sobolevsky, S.; Kazakopoulos, P.; Ratti, C. Geo-located Twitter as proxy for global mobility patterns. Cartogr. Geogr. Inf. Sci. 2014, 41, 260–271. [Google Scholar] [CrossRef]
  24. Ghosh, D.D.; Guha, R. What are we ‘tweeting’ about obesity? Mapping tweets with Topic Modeling and Geographic Information System. Cartogr. Geogr. Inf. Sci. 2013, 40, 90–102. [Google Scholar] [CrossRef]
  25. Morstatter, F.; Liu, H. Discovering, assessing, and mitigating data bias in social media. Online Soc. Netw. Media 2017, 1, 1–13. [Google Scholar] [CrossRef]
  26. Zhao, Y.; He, X.; Feng, Z.; Bost, S.; Prosperi, M.; Wu, Y.; Guo, Y.; Bian, J. Biases in using social media data for public health surveillance: A scoping review. Int. J. Med. Inform. 2022, 164, 104804. [Google Scholar] [CrossRef] [PubMed]
  27. Griffin, G.P.; Mulhall, M.; Simek, C.; Riggs, W.W. Mitigating Bias in Big Data for Transportation. J. Big Data Anal. Transp. 2020, 2, 49–59. [Google Scholar] [CrossRef]
  28. Zagidullin, M.; Aziz, N.; Kozhakhmet, S. Government policies and attitudes to social media use among users in Turkey: The role of awareness of policies, political involvement, online trust, and party identification. Technol. Soc. 2021, 67, 101708. [Google Scholar] [CrossRef]
  29. Hawkins, I.; Saleem, M. How social media use, political identity, and racial resentment affect perceptions of reverse racism in the United States. Comput. Hum. Behav. 2022, 134, 107337. [Google Scholar] [CrossRef]
  30. Griffith, D.A.; Chun, Y.; Lee, M. Deeper Spatial Statistical Insights into Small Geographic Area Data Uncertainty. Int. J. Environ. Res. Public Health 2020, 18, 231. [Google Scholar] [CrossRef]
  31. Malik, M.M.; Lamba, H.; Nakos, C.; Pfeffer, J.u. Population Bias in Geotagged Tweets. In Proceedings of the International AAAI Conference on Web and Social Media (ICWSM), Oxford, UK, 26–29 May 2015; pp. 18–27. [Google Scholar]
  32. Heesch, K.C.; Langdon, M. The usefulness of GPS bicycle tracking data for evaluating the impact of infrastructure change on cycling behaviour. Health Promot. J. Aust. 2016, 27, 222–229. [Google Scholar] [CrossRef] [PubMed]
  33. Blanc, B.; Figliozzi, M.; Clifton, K. How Representative of Bicycling Populations Are Smartphone Application Surveys of Travel Behavior? Transp. Res. Rec. J. Transp. Res. Board 2016, 2587, 78–89. [Google Scholar] [CrossRef]
  34. Li, L.; Goodchild, M.F.; Xu, B. Spatial, temporal, and socioeconomic patterns in the use of Twitter and Flickr. Cartogr. Geogr. Inf. Sci. 2013, 40, 61–77. [Google Scholar] [CrossRef]
  35. Juhász, L.; Hochmair, H.H. Where to catch ‘em all?—A geographic analysis of Pokémon Go locations. Geo-Spat. Inf. Sci. 2017, 20, 241–251. [Google Scholar] [CrossRef]
  36. Gardner, Z.; Mooney, P.; De Sabbata, S.; Dowthwaite, L. Quantifying gendered participation in OpenStreetMap: Responding to theories of female (under) representation in crowdsourced mapping. GeoJournal 2019, 85, 1603–1620. [Google Scholar] [CrossRef] [Green Version]
  37. Boot, A.B.; Tjong Kim Sang, E.; Dijkstra, K.; Zwaan, R.A. How character limit affects language usage in tweets. Palgrave Commun. 2019, 5, 76. [Google Scholar] [CrossRef]
  38. Gligorić, K.; Anderson, A.; West, R. How Constraints Affect Content: The Case of Twitter’s Switch from 140 to 280 Characters. In Proceedings of the International AAAI Conference on Web and Social Media (ICWSM), Palo Alto, CA, USA, 25–28 June 2018. [Google Scholar]
  39. Safari, R.M.; Rahmani, A.M.; Alizadeh, S.H. User behavior mining on social media: A systematic literature review. Multimed. Tools Appl. 2019, 78, 33747–33804. [Google Scholar] [CrossRef]
  40. Sadeh, N.; Hong, J.; Cranor, L.; Fette, I.; Kelley, P.; Prabaker, M.; Rao, J. Understanding and capturing people’s privacy policies in a mobile social networking application. Pers. Ubiquitous Comput. 2008, 13, 401–412. [Google Scholar] [CrossRef]
  41. Allcott, H.; Gentzkow, M.; Yu, C. Trends in the diffusion of misinformation on social media. Res. Politics 2019, 6, 205316801984855. [Google Scholar] [CrossRef]
  42. George, D.R.; Rovniak, L.S.; Kraschnewski, J.L. Dangers and opportunities for social media in medicine. Clin. Obstet. Gynecol. 2013, 56, 453–462. [Google Scholar] [CrossRef]
  43. Kruspe, A.M.; Häberle, M.; Hoffmann, E.J.; Rode-Hasinger, S.; Abdulahhad, K.; Zhu, X.X. Changes in Twitter geolocations Insights and suggestions for future usage. In Proceedings of the Seventh Workshop on Noisy User-generated Text (W-NUT 2021), Online, 11 November 2021; pp. 212–221. [Google Scholar]
  44. Wilcox, R.R. Chapter 5—Comparing Two Groups. In Introduction to Robust Estimation and Hypothesis Testing, 5th ed.; Wilcox, R.R., Ed.; Academic Press: Cambridge, MA, USA, 2022; pp. 153–251. [Google Scholar]
  45. Daniulaityte, R.; Nahhas, R.W.; Wijeratne, S.; Carlson, R.G.; Lamy, F.R.; Martins, S.S.; Boyer, E.W.; Smith, G.A.; Sheth, A. “Time for dabs”: Analyzing Twitter data on marijuana concentrates across the U.S. Drug Alcohol Depend. 2015, 155, 307–311. [Google Scholar] [CrossRef]
  46. Kotzias, D.; Lappas, T.; Gunopulos, D. Addressing the Sparsity of Location Information on Twitter. In Proceedings of the EDBT/ICDT 2014 Joint Conference, Athens, Greece, 28 March 2014; pp. 339–346. [Google Scholar]
  47. Provenzano, D.; Hawelka, B.; Baggio, R. The mobility network of European tourists: A longitudinal study and a comparison with geo-located Twitter data. Tour. Rev. 2018, 73, 28–43. [Google Scholar] [CrossRef]
  48. Han, S.Y.; Tsou, M.-H.; Knaap, E.; Rey, S.; Cao, G. How Do Cities Flow in an Emergency? Tracing Human Mobility Patterns during a Natural Disaster with Big Data and Geospatial Data Science. Urban Sci. 2019, 3, 51. [Google Scholar] [CrossRef]
  49. Cebeillac, A.; Daudé, É.; Huraux, T. Where? When? And how often? What can we learn about daily urban mobilities from Twitter data and Google POIs in Bangkok (Thailand) and which perspectives for dengue studies? Netcom 2017, 31, 283–308. [Google Scholar] [CrossRef]
  50. Jurdak, R.; Zhao, K.; Liu, J.; AbouJaoude, M.; Cameron, M.; Newth, D. Understanding Human Mobility from Twitter. PLoS ONE 2015, 10, e0131469. [Google Scholar] [CrossRef]
  51. Liu, Q.; Wang, Z.; Ye, X. Comparing mobility patterns between residents and visitors using geo-tagged social media data. Trans. GIS 2018, 22, 1372–1389. [Google Scholar] [CrossRef]
  52. Xin, Y.; MacEachren, A.M. Characterizing traveling fans: A workflow for event-oriented travel pattern analysis using Twitter data. Int. J. Geogr. Inf. Sci. 2020, 34, 2497–2516. [Google Scholar] [CrossRef]
  53. Giachanou, A.; Crestani, F. Like It or Not. ACM Comput. Surv. 2016, 49, 1–41. [Google Scholar] [CrossRef]
  54. Wallgrün, J.O.; Karimzadeh, M.; MacEachren, A.M.; Pezanowski, S. GeoCorpora: Building a corpus to test and train microblog geoparsers. Int. J. Geogr. Inf. Sci. 2017, 32, 1–29. [Google Scholar] [CrossRef]
  55. Cvetojevic, S.; Juhasz, L.; Hochmair, H.H. Positional Accuracy of Twitter and Instagram Images in Urban Environments. GI_Forum 2016, 4, 191–203. [Google Scholar] [CrossRef]
  56. Frias-Martinez, V.; Frias-Martinez, E. Spectral clustering for sensing urban land use using Twitter activity. Eng. Appl. Artif. Intell. 2014, 35, 237–245. [Google Scholar] [CrossRef]
  57. Negri, V.; Scuratti, D.; Agresti, S.; Rooein, D.; Scalia, G.; Ravi Shankar, A.; Fernandez Marquez, J.L.; Carman, M.J.; Pernici, B. Image-Based Social Sensing: Combining AI and the Crowd to Mine Policy-Adherence Indicators from Twitter. In Proceedings of the 2021 IEEE/ACM 43rd International Conference on Software Engineering: Software Engineering in Society (ICSE-SEIS), Madrid, Spain, 8–25 May 2021; pp. 92–101. [Google Scholar]
  58. Qi, W.; Guo, W.; Procter, R.; Zhang, J. Geo-Tagging Quality-of-Experience Self-Reporting on Twitter to Mobile Network Outage Events. In Proceedings of the 2019 IEEE International Smart Cities Conference (ISC2), Casablanca, Morocco, 14–17 October 2019; pp. 651–657. [Google Scholar]
  59. Cvetojevic, S.; Hochmair, H.H. Modeling interurban mentioning relationships in the U.S. Twitter network using geo-hashtags. Computers. Environ. Urban Syst. 2021, 87, 101621. [Google Scholar] [CrossRef]
  60. Mavragani, A.; Gkillas, K. COVID-19 predictability in the United States using Google Trends time series. Sci. Rep. 2020, 10, 20693. [Google Scholar] [CrossRef]
  61. Hausmann, A.; Toivonen, T.; Slotow, R.; Tenkanen, H.; Moilanen, A.; Heikinheimo, V.; Di Minin, E. Social Media Data Can Be Used to Understand Tourists’ Preferences for Nature-Based Experiences in Protected Areas. Conserv. Lett. 2018, 11, e12343. [Google Scholar] [CrossRef]
  62. Roy, A.; Nelson, T.A.; Fotheringham, A.S.; Winters, M. Correcting Bias in Crowdsourced Data to Map Bicycle Ridership of All Bicyclists. Urban Sci. 2019, 3, 62. [Google Scholar] [CrossRef] [Green Version]
Figure 1. Study area and tweets with exact coordinates in 2015.
Geographies 02 00033 g001
Figure 2. Number of tweets with three types of geotagging around the 2015 policy change.
Geographies 02 00033 g002
Figure 3. Daily average tweet length around the 2017 policy change.
Geographies 02 00033 g003
Table 1. Monthly number of downloaded and filtered tweets.
YearMonthTweets
Raw DataLanguage and Source Filtered
2015March614,657302,269
May685,406346,878
2017October549,109265,485
December455,685258,916
2019May434,944265,457
July440,406273,403
Table 2. Alternative hypotheses of Monte Carlo permutation tests.
VariableAlternative Hypotheses
201520172019
Proportion of tweets with exact coordinates (H1, H7, H13)< < <
Tweet length (H2, H8, H14)> > >
Rate of placename mentions in text (H3, H9, H15)> > >
Rate of placename mentions in hashtags (H4, H10, H16)> > >
Proportion of tweets with images among tweets with exact coordinates (H5, H11, H17)> < >
Radius of gyration (H6, H12, H18)< < <
Table 3. Reasoning for alternative hypotheses related to permutation tests.
YearExplanation
2015H1The proportion of tweets with exact coordinates among geotagged tweets decreases when it is required to confirm for each individual tweet to share exact coordinates.
H2The length of tweets increases since fewer exact coordinates make users use more text to describe location information.
H3, H4The rate of placename mentions in the text (H3) and in hashtags (H4) for geotagged tweets increases since users mention placenames more often to state their position when sharing exact coordinates becomes less convenient.
H5The proportion of tweets with images among tweets with exact coordinates increases because images in the photo app come with exact coordinates, which does not require a user’s individual confirmation of each tweet to share exact coordinates.
H6The radius of gyration decreases since fewer tweets with exact coordinates provide a less complete picture of a user’s traveled region.
2017H7The proportion of tweets with exact coordinates decreases since longer tweets allow for a more detailed textual description of one’s location, which can compensate for the lack of exact location information.
H8The length of tweets increases since users are allowed to use twice the number of characters in their tweets.
H9, H10The rate of placename mentions in the text (H9) and in hashtags (H10) for geotagged tweets increases since longer tweets allow to fit more placename mentions in the text and within hashtags, respectively.
H11The proportion of tweets with images among tweets with exact coordinates among geotagged tweets decreases because longer tweets allow a user to describe a location through text in more detail, which reduces the need for images.
H12The radius of gyration decreases since longer text reduces the need for tweets with exact coordinates, which, in turn, leads to a less complete picture of a user’s traveled region.
2019H13The proportion of tweets with exact coordinates among geotagged tweets decreases because sharing of exact coordinates is limited to the photo app, which will generally not be used if the user does not intend to share a photograph.
H14The length of tweets increases since more text is needed to convey position information as compensation for fewer tweets with exact coordinates.
H15, H16The rate of placename mentions in the text (H15) and in hashtags (H16) for geotagged tweets increases because these mentions provide an alternative way to describe one’s location as compensation for fewer tweets with exact coordinates.
H17The proportion of tweets with images among tweets with exact coordinates increases because the policy change allows users to share exact location information only through the photo app.
H18The radius of gyration decreases because fewer tweets with exact coordinates provide a less complete picture of a user’s traveled region.
Table 4. Permutation test results of the 2015 Twitter coordinate policy change.
VariableUser NumberMean (SD)p
MarchMayMarchMay
Proportion of tweets with exact coordinates13,91513,9150.973 (0.161)0.175 (0.371)<0.001 (H1)
Tweet length13,91513,91584.8 (28.7)83.9 (28.5)1.000 (H2)
Rate of placename mentions in text13,91513,9150.080 (0.234)0.077 (0.224)0.889 (H3)
Rate of placename mentions in hashtags13,91513,9150.012 (0.084)0.011 (0.080)0.899 (H4)
Proportion of tweets with images among tweets with exact coordinates22,68537890.232 (0.292)0.256 (0.363)0.227 (H5)
Radius of gyration (m)22,68537891795.9 (2403.9)1688.6 (2355.2)0.005 (H6)
Note: p-value in boldface indicates that mean differences are statistically significant.
Table 5. Number of tweets with different geotagging in 2015.
Geotag TypeMarchMay
Coordinates168,39427,963
Admin40263
POI011
Country05
City4258203
Table 6. Permutation test results of the 2017 Twitter length policy change.
VariableUser NumberMean (SD)p
OctoberDecemberOctoberDecember
Proportion of tweets with exact coordinates17,85517,8550.003 (0.052)0.003 (0.048)0.118 (H7)
Tweet length17,85517,85597.4 (34.1)110.9 (52.3)0.000 (H8)
Rate of placename mentions in text17,85517,8550.086 (0.242)0.093 (0.266)0.006 (H9)
Rate of placename mentions in hashtags17,85517,8550.011 (0.084)0.013 (0.092)0.084 (H10)
Proportion of tweets with images among tweets with exact coordinates2451950.567 (0.477)0.562 (0.476)0.460 (H11)
Radius of gyration (m)72511512.0 (2619.2)1238.4 (1787.0)0.272 (H12)
Note: p-value in boldface indicates that mean differences are statistically significant.
Table 7. Permutation test results of the 2019 Twitter coordinate policy change.
VariableUser NumberMean (SD)p
MayJulyMayJuly
Proportion of tweets with exact coordinates13,40013,4000.004 (0.053)0.002 (0.042)0.004 (H13)
Tweet length13,40013,400119.5 (61.2)118.3 (62.0)0.942 (H14)
Rate of placename mentions in text13,40013,4000.087 (0.259)0.093 (0.271)0.038 (H15)
Rate of placename mentions in hashtags13,40013,4000.009 (0.072)0.011 (0.084)0.028 (H16)
Proportion of tweets with images among tweets with exact coordinates 4553310.874 (0.328)0.925 (0.264)0.010 (H17)
Radius of gyration (m)4330438.9 (1031.0)806.6 (1575.0)0.121 (H18)
Note: p-value in boldface indicates that mean differences are statistically significant.
Table 8. Comparison of user contribution behavior across multiple years.
VariablesMar 2015 vs. Dec 2017Mar 2015 vs. Jul 2019
SD ΔobspSD Δobsp
Proportion of tweets with exact coordinates 0.007−0.970<0.0010.009−0.971<0.001
Tweet length0.52226.2<0.0010.61733.5<0.001
Rate of placename mentions in text0.0030.012<0.0010.0030.012<0.001
Rate of placename mentions in hashtags0.0010.0010.265 0.001−0.0010.920
Proportion of tweets with images among tweets with exact coordinates0.0310.3301.000 0.0300.692<0.001
Radius of gyration (m)334.6−557.50.040443.7−989.40.003
Note: Underlined p-values indicate a more significant change in mean differences across multiple years than for individual policy updates. A p-value in boldface indicates that mean differences are statistically significant.
Publisher’s Note: MDPI stays neutral with regard to jurisdictional claims in published maps and institutional affiliations.

