
Qualitative-Quantitative Assessment of Geodiversity of Western Samoa (SW Pacific) to Identify Places of Interest for Further Geoconservation, Geoeducation, and Geotourism Development


Abstract
1. Introduction
2. Materials and Methods
2.1. Aim
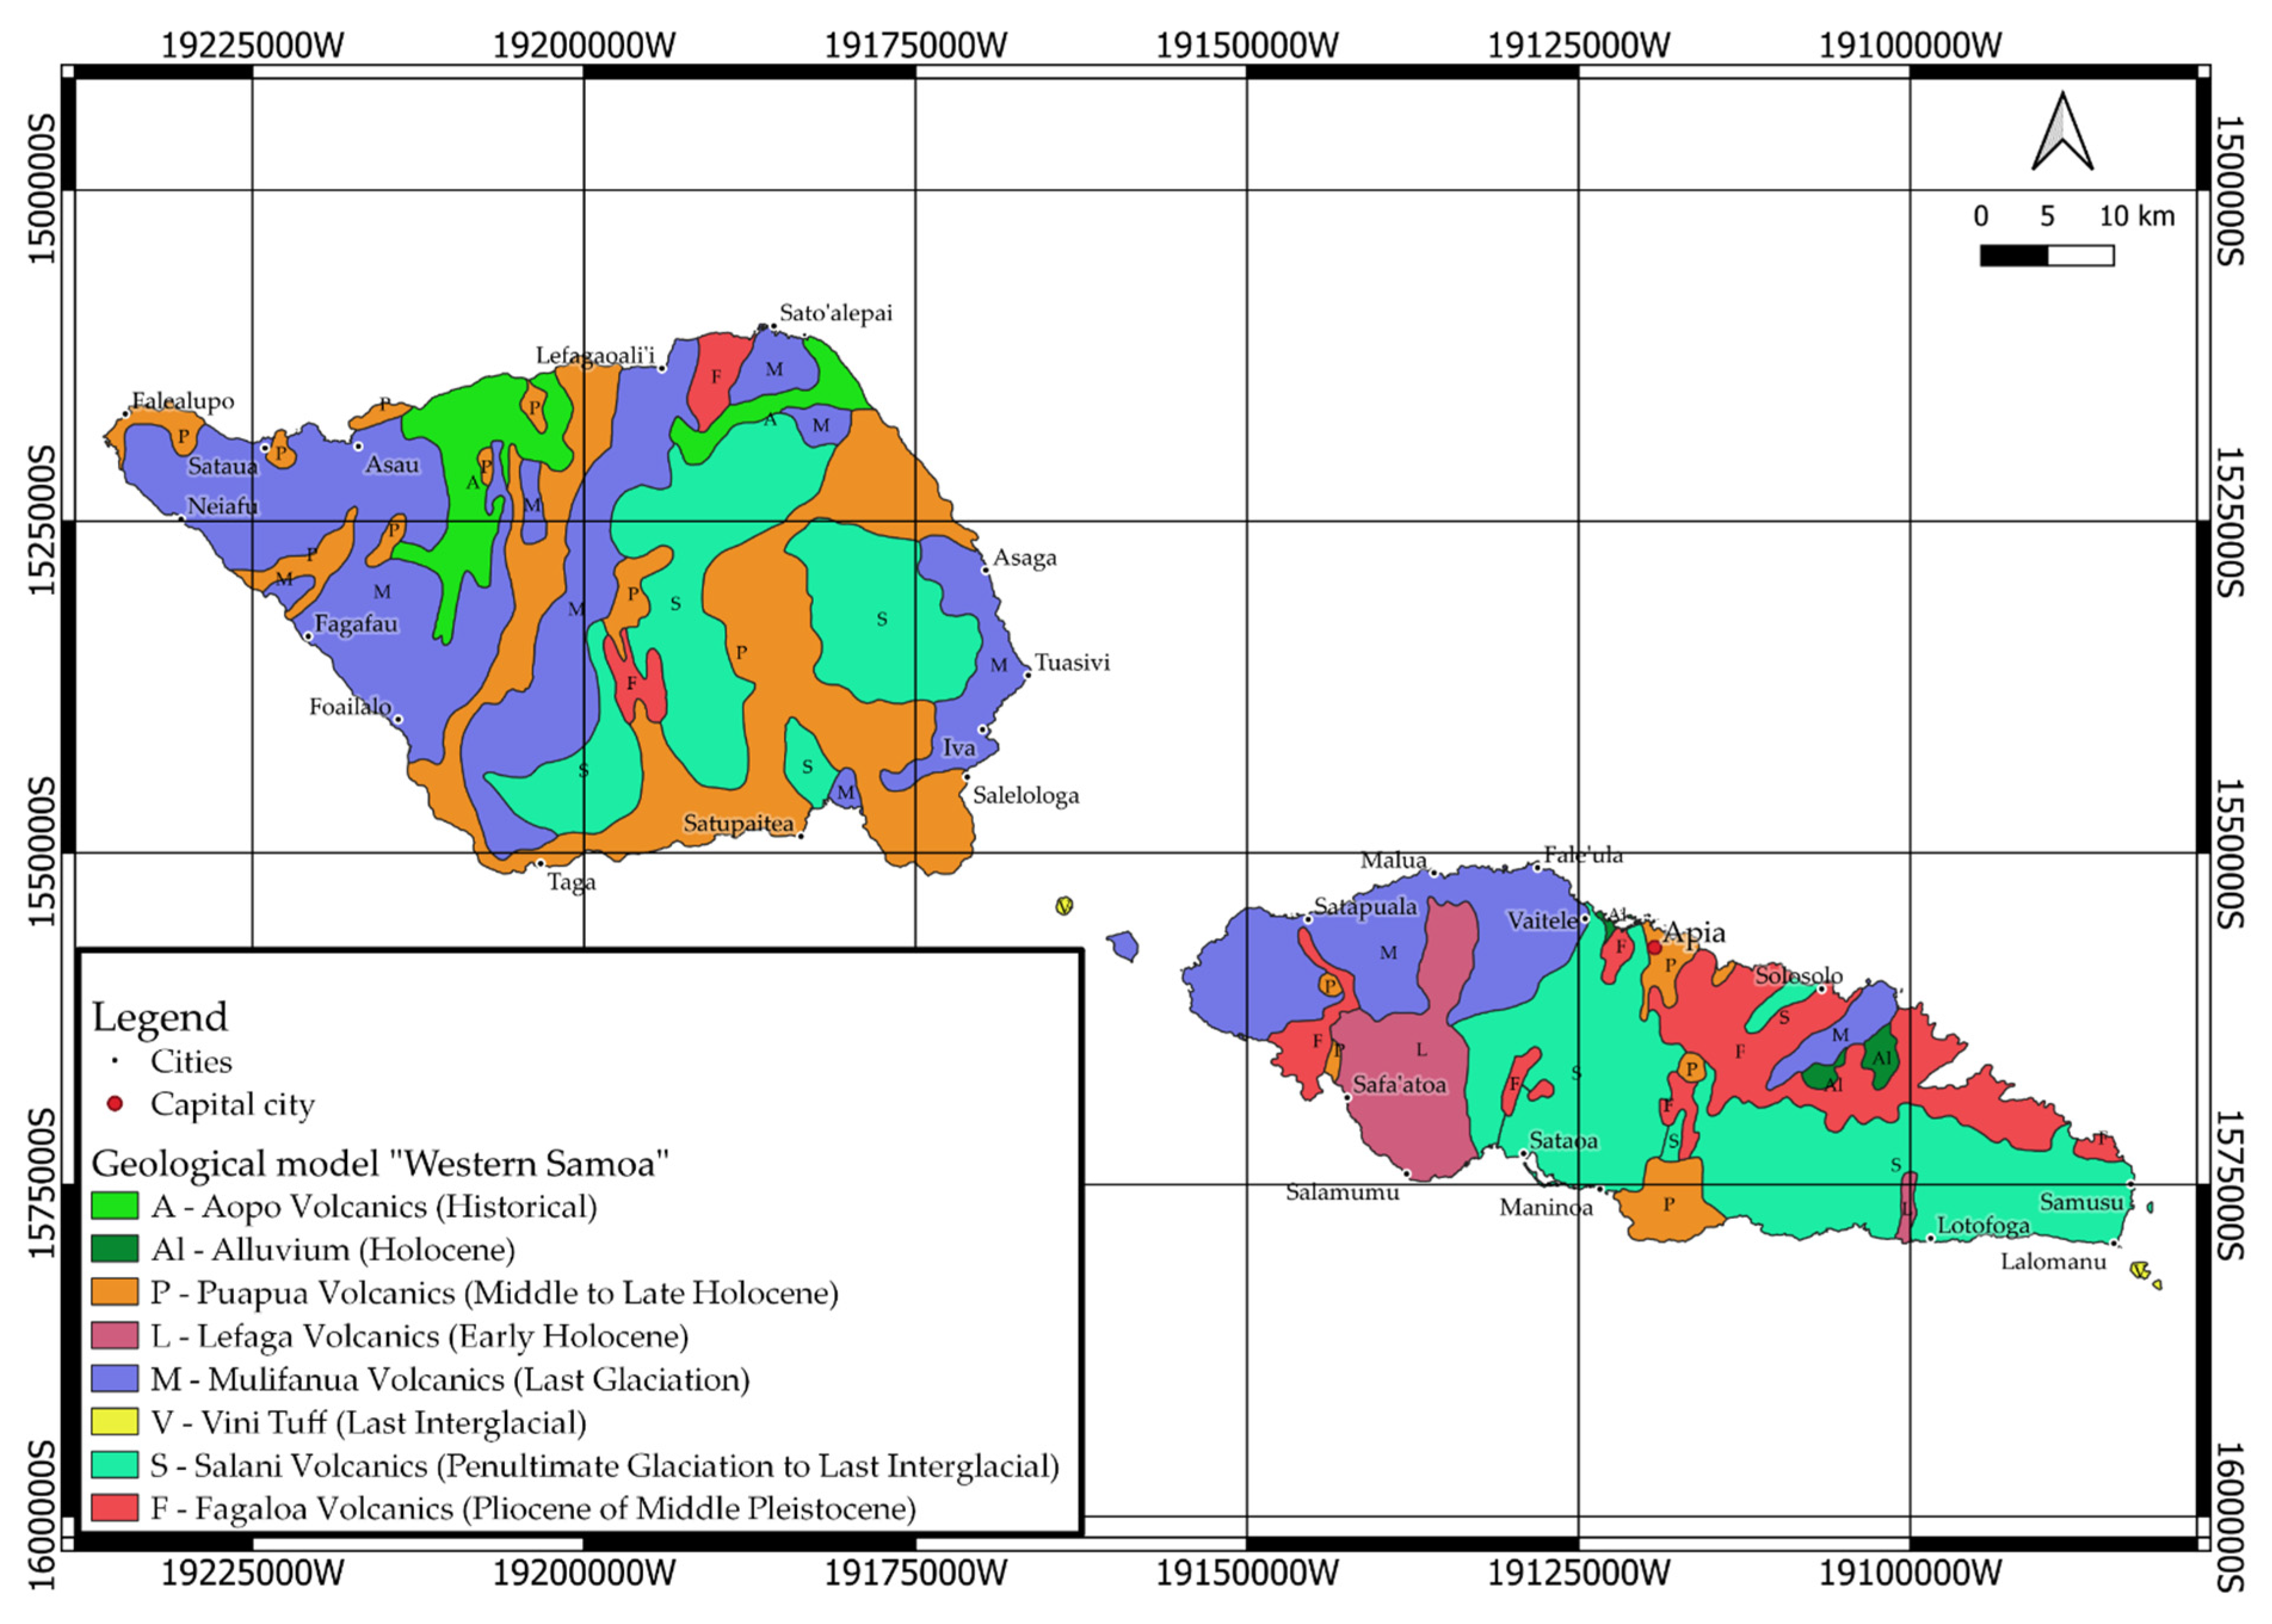
2.2. Volcanic History of the Western Samoa Islands
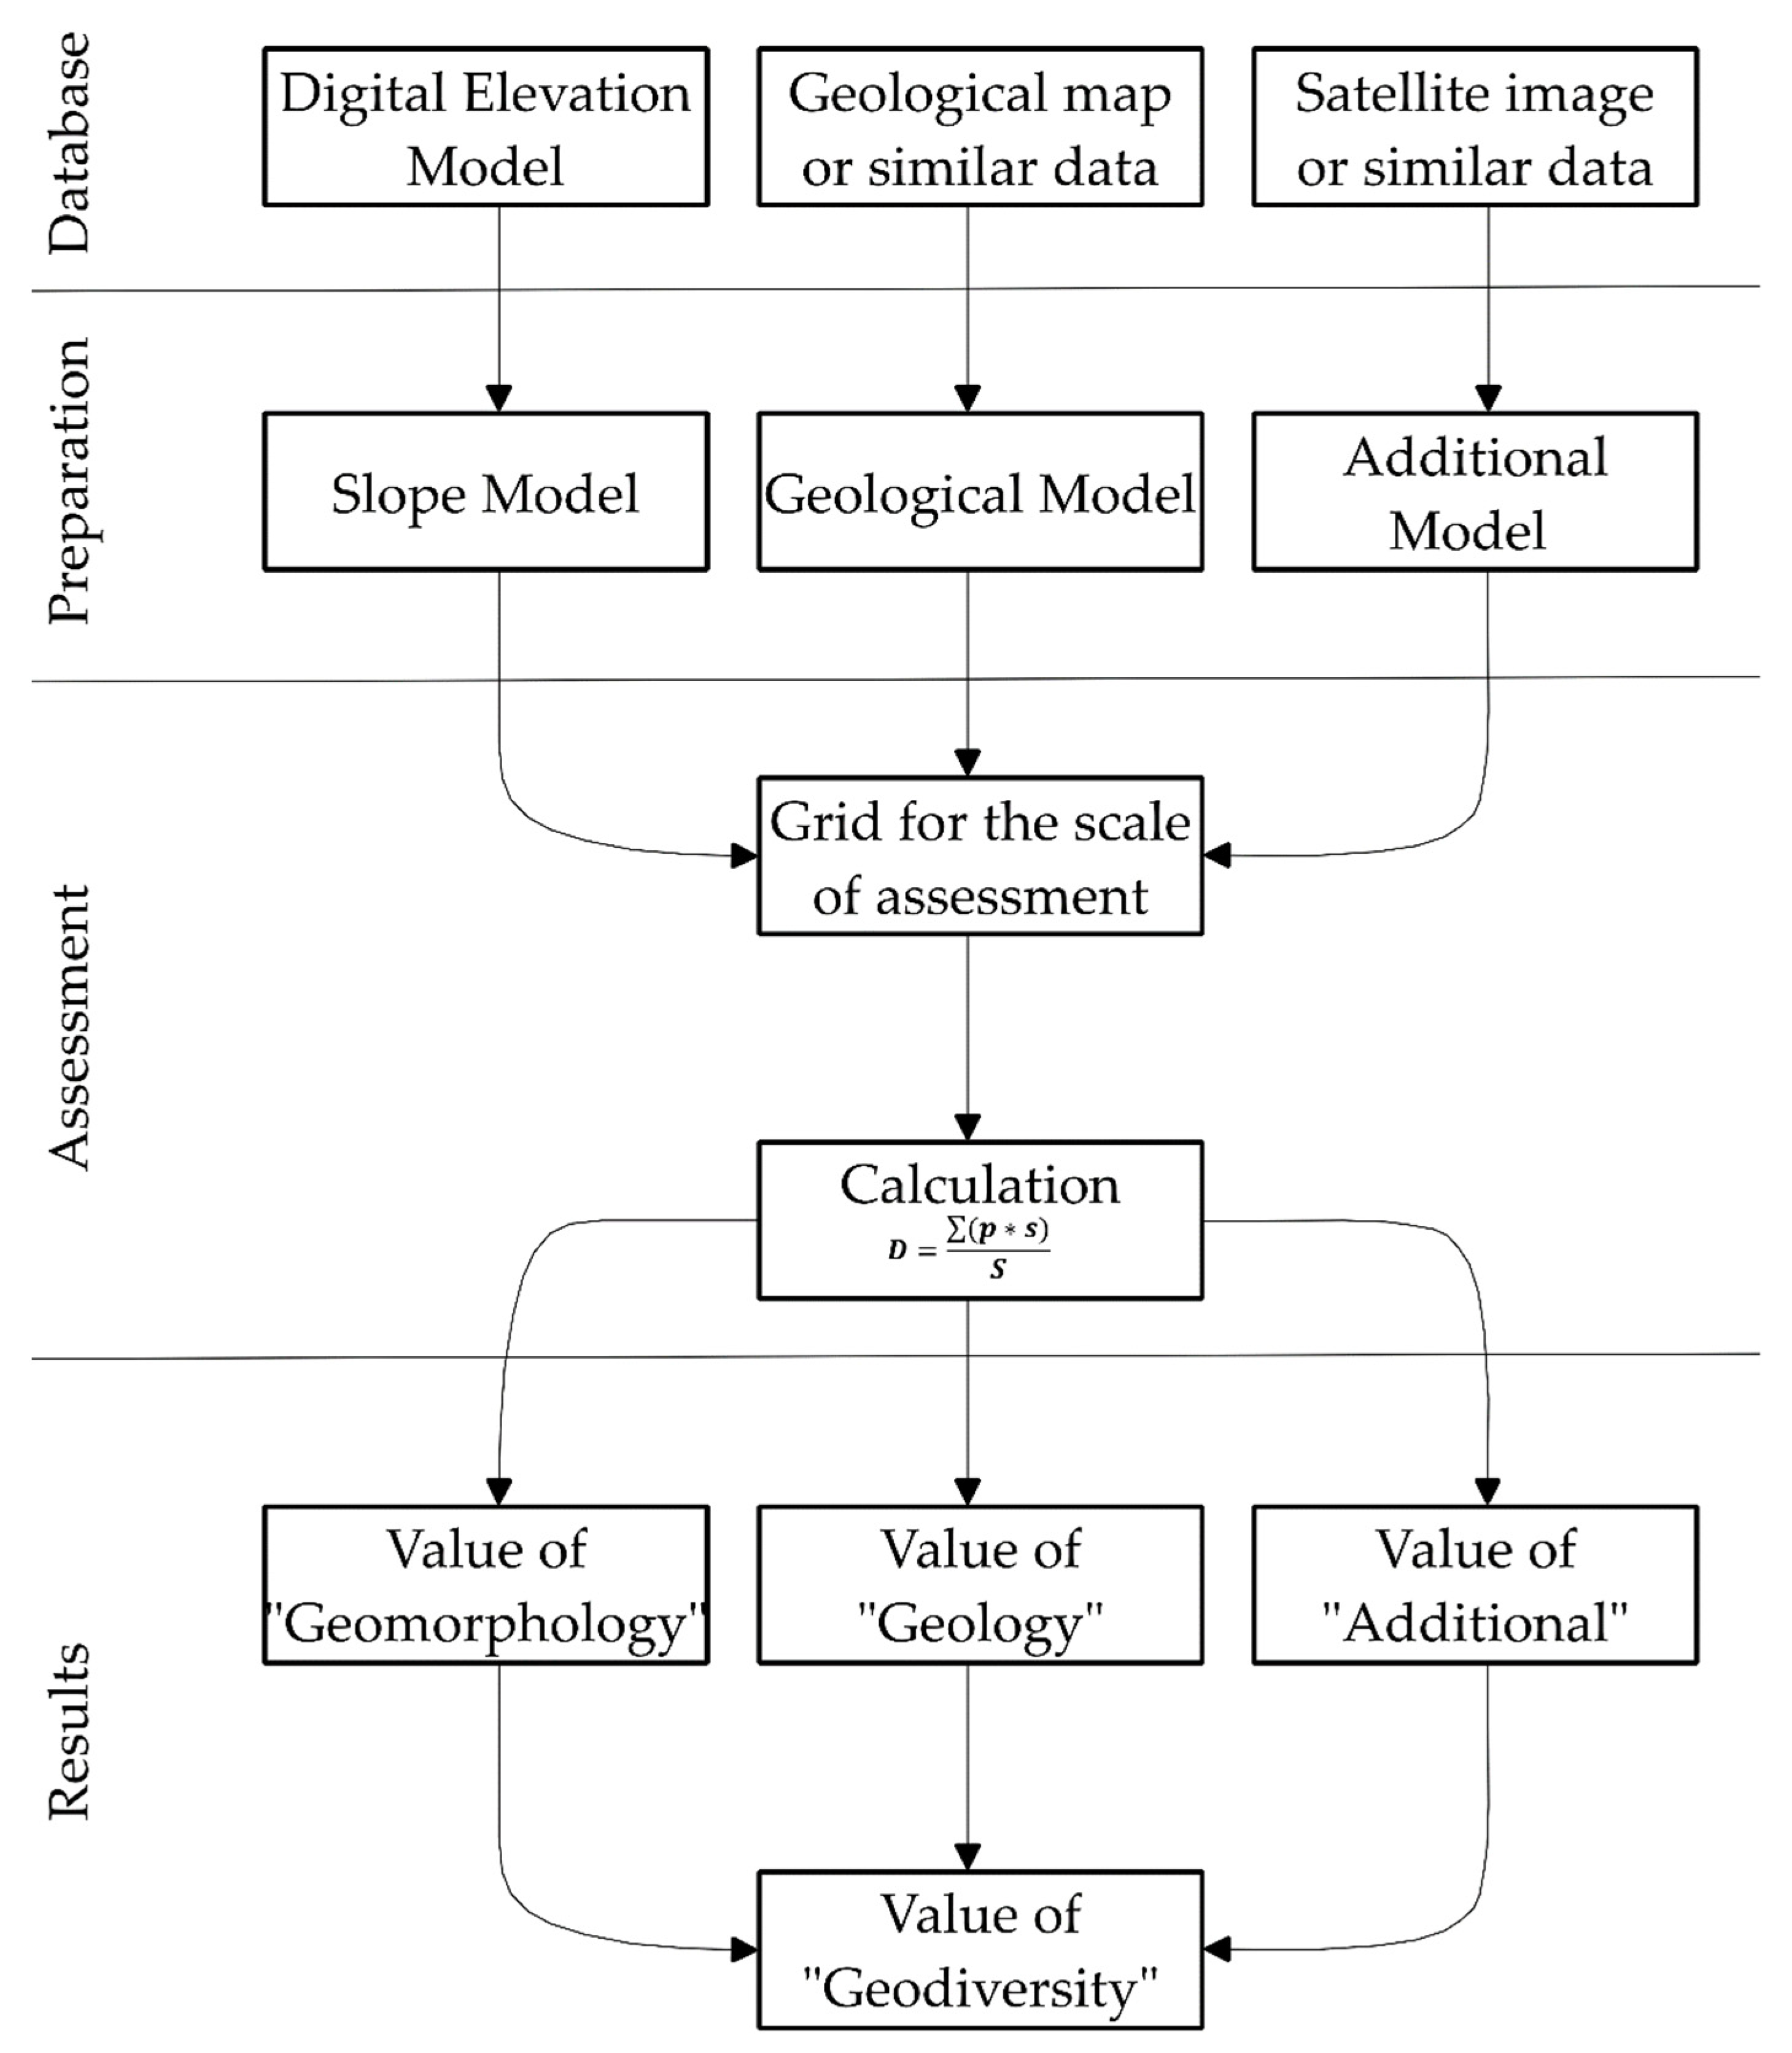
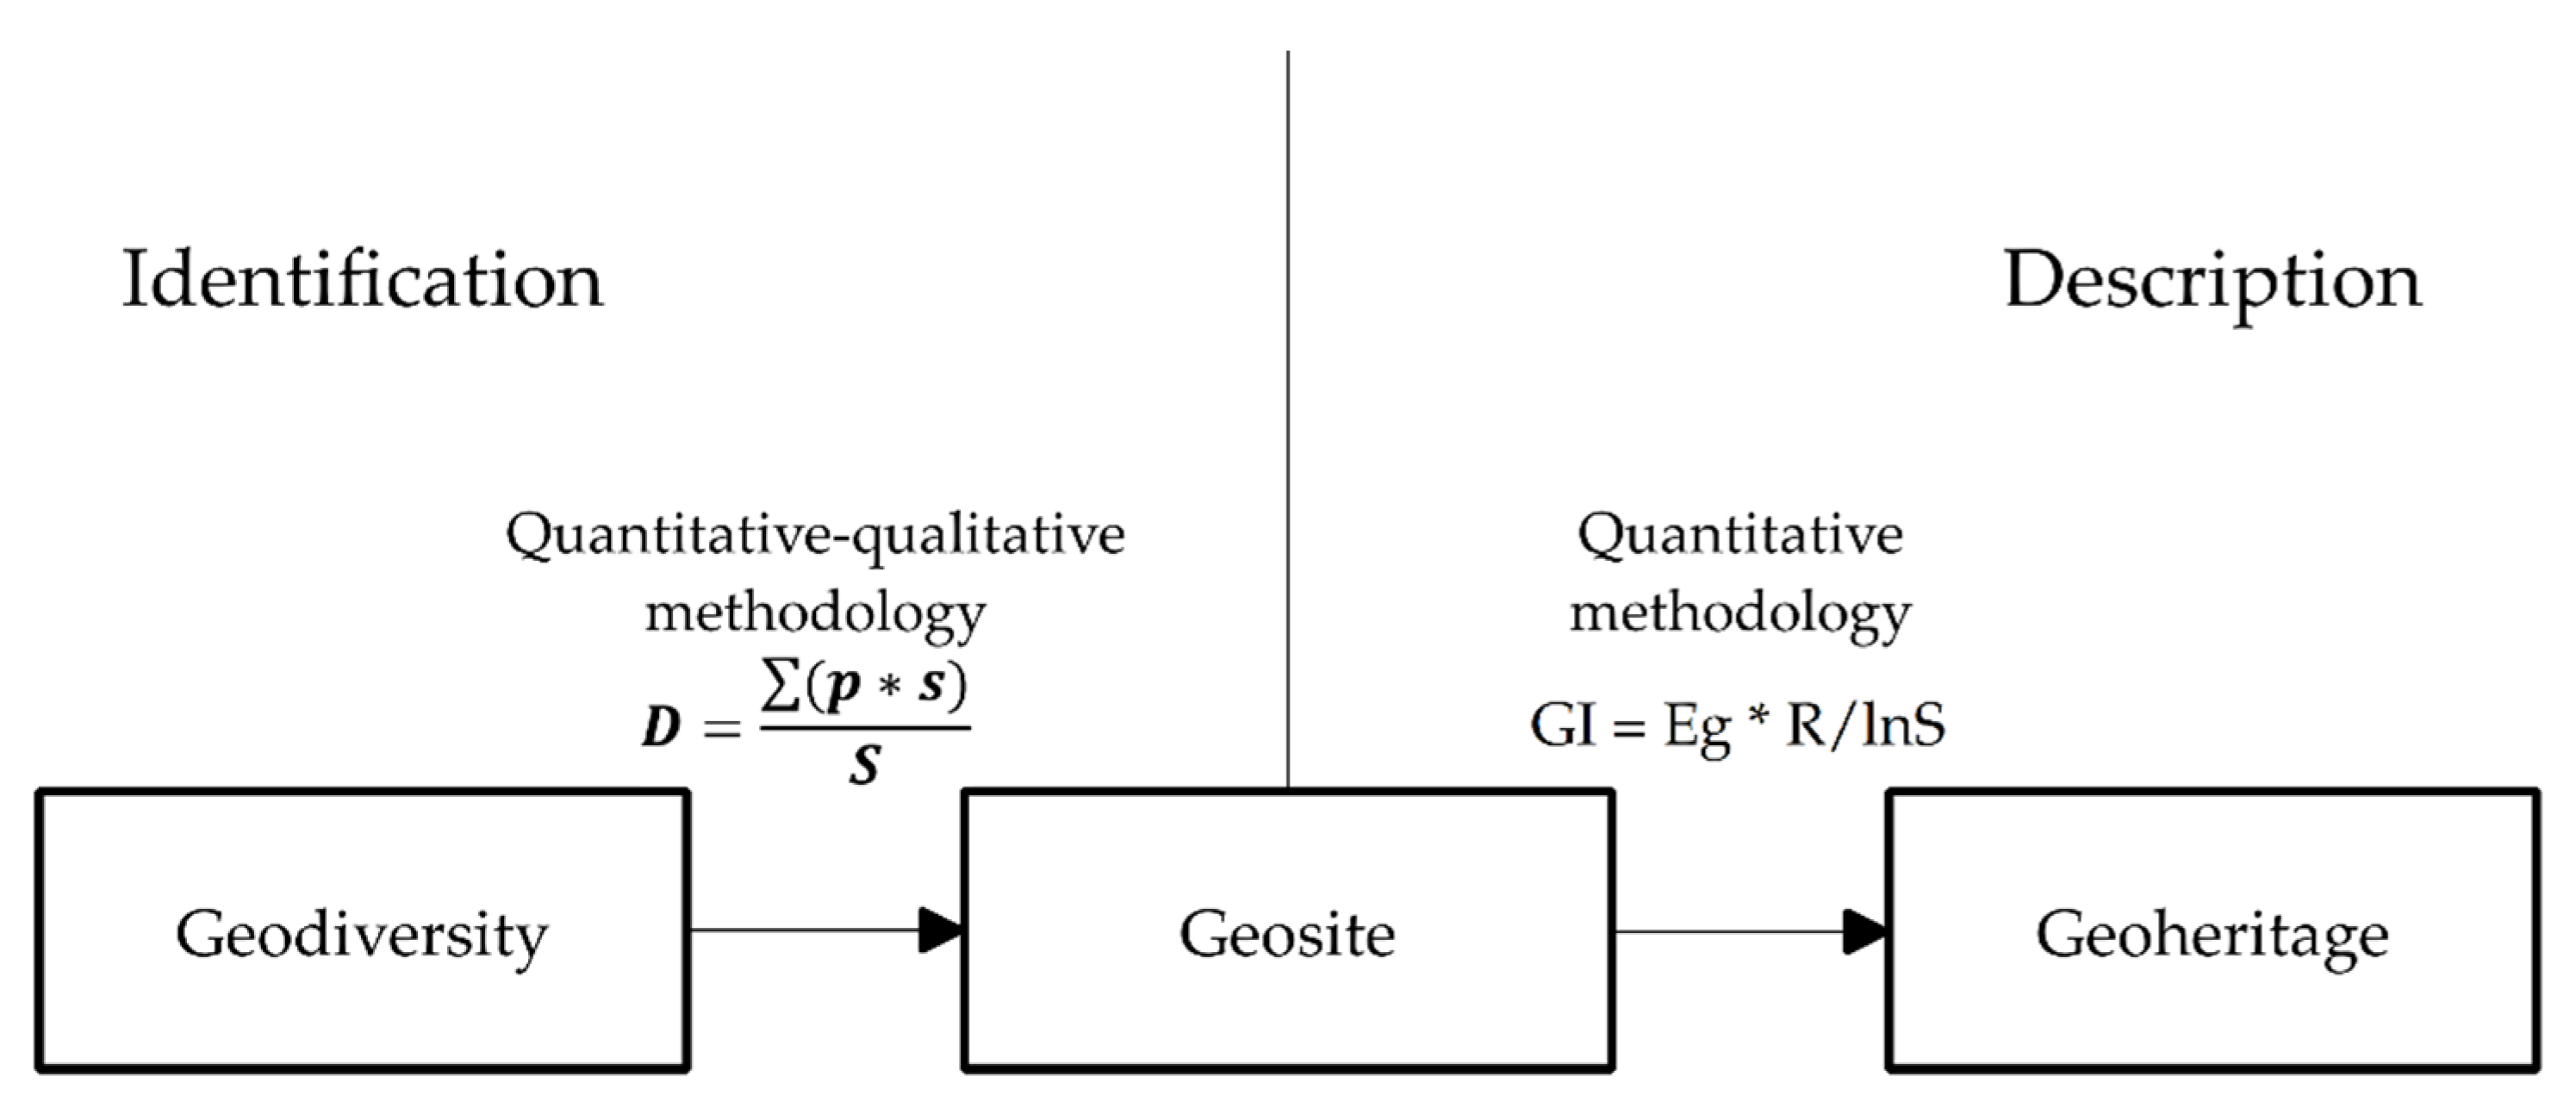
2.3. Methodology
2.4. Equation
2.5. Example of Calculation and Creation
- (1)
- Required data:
- (a)
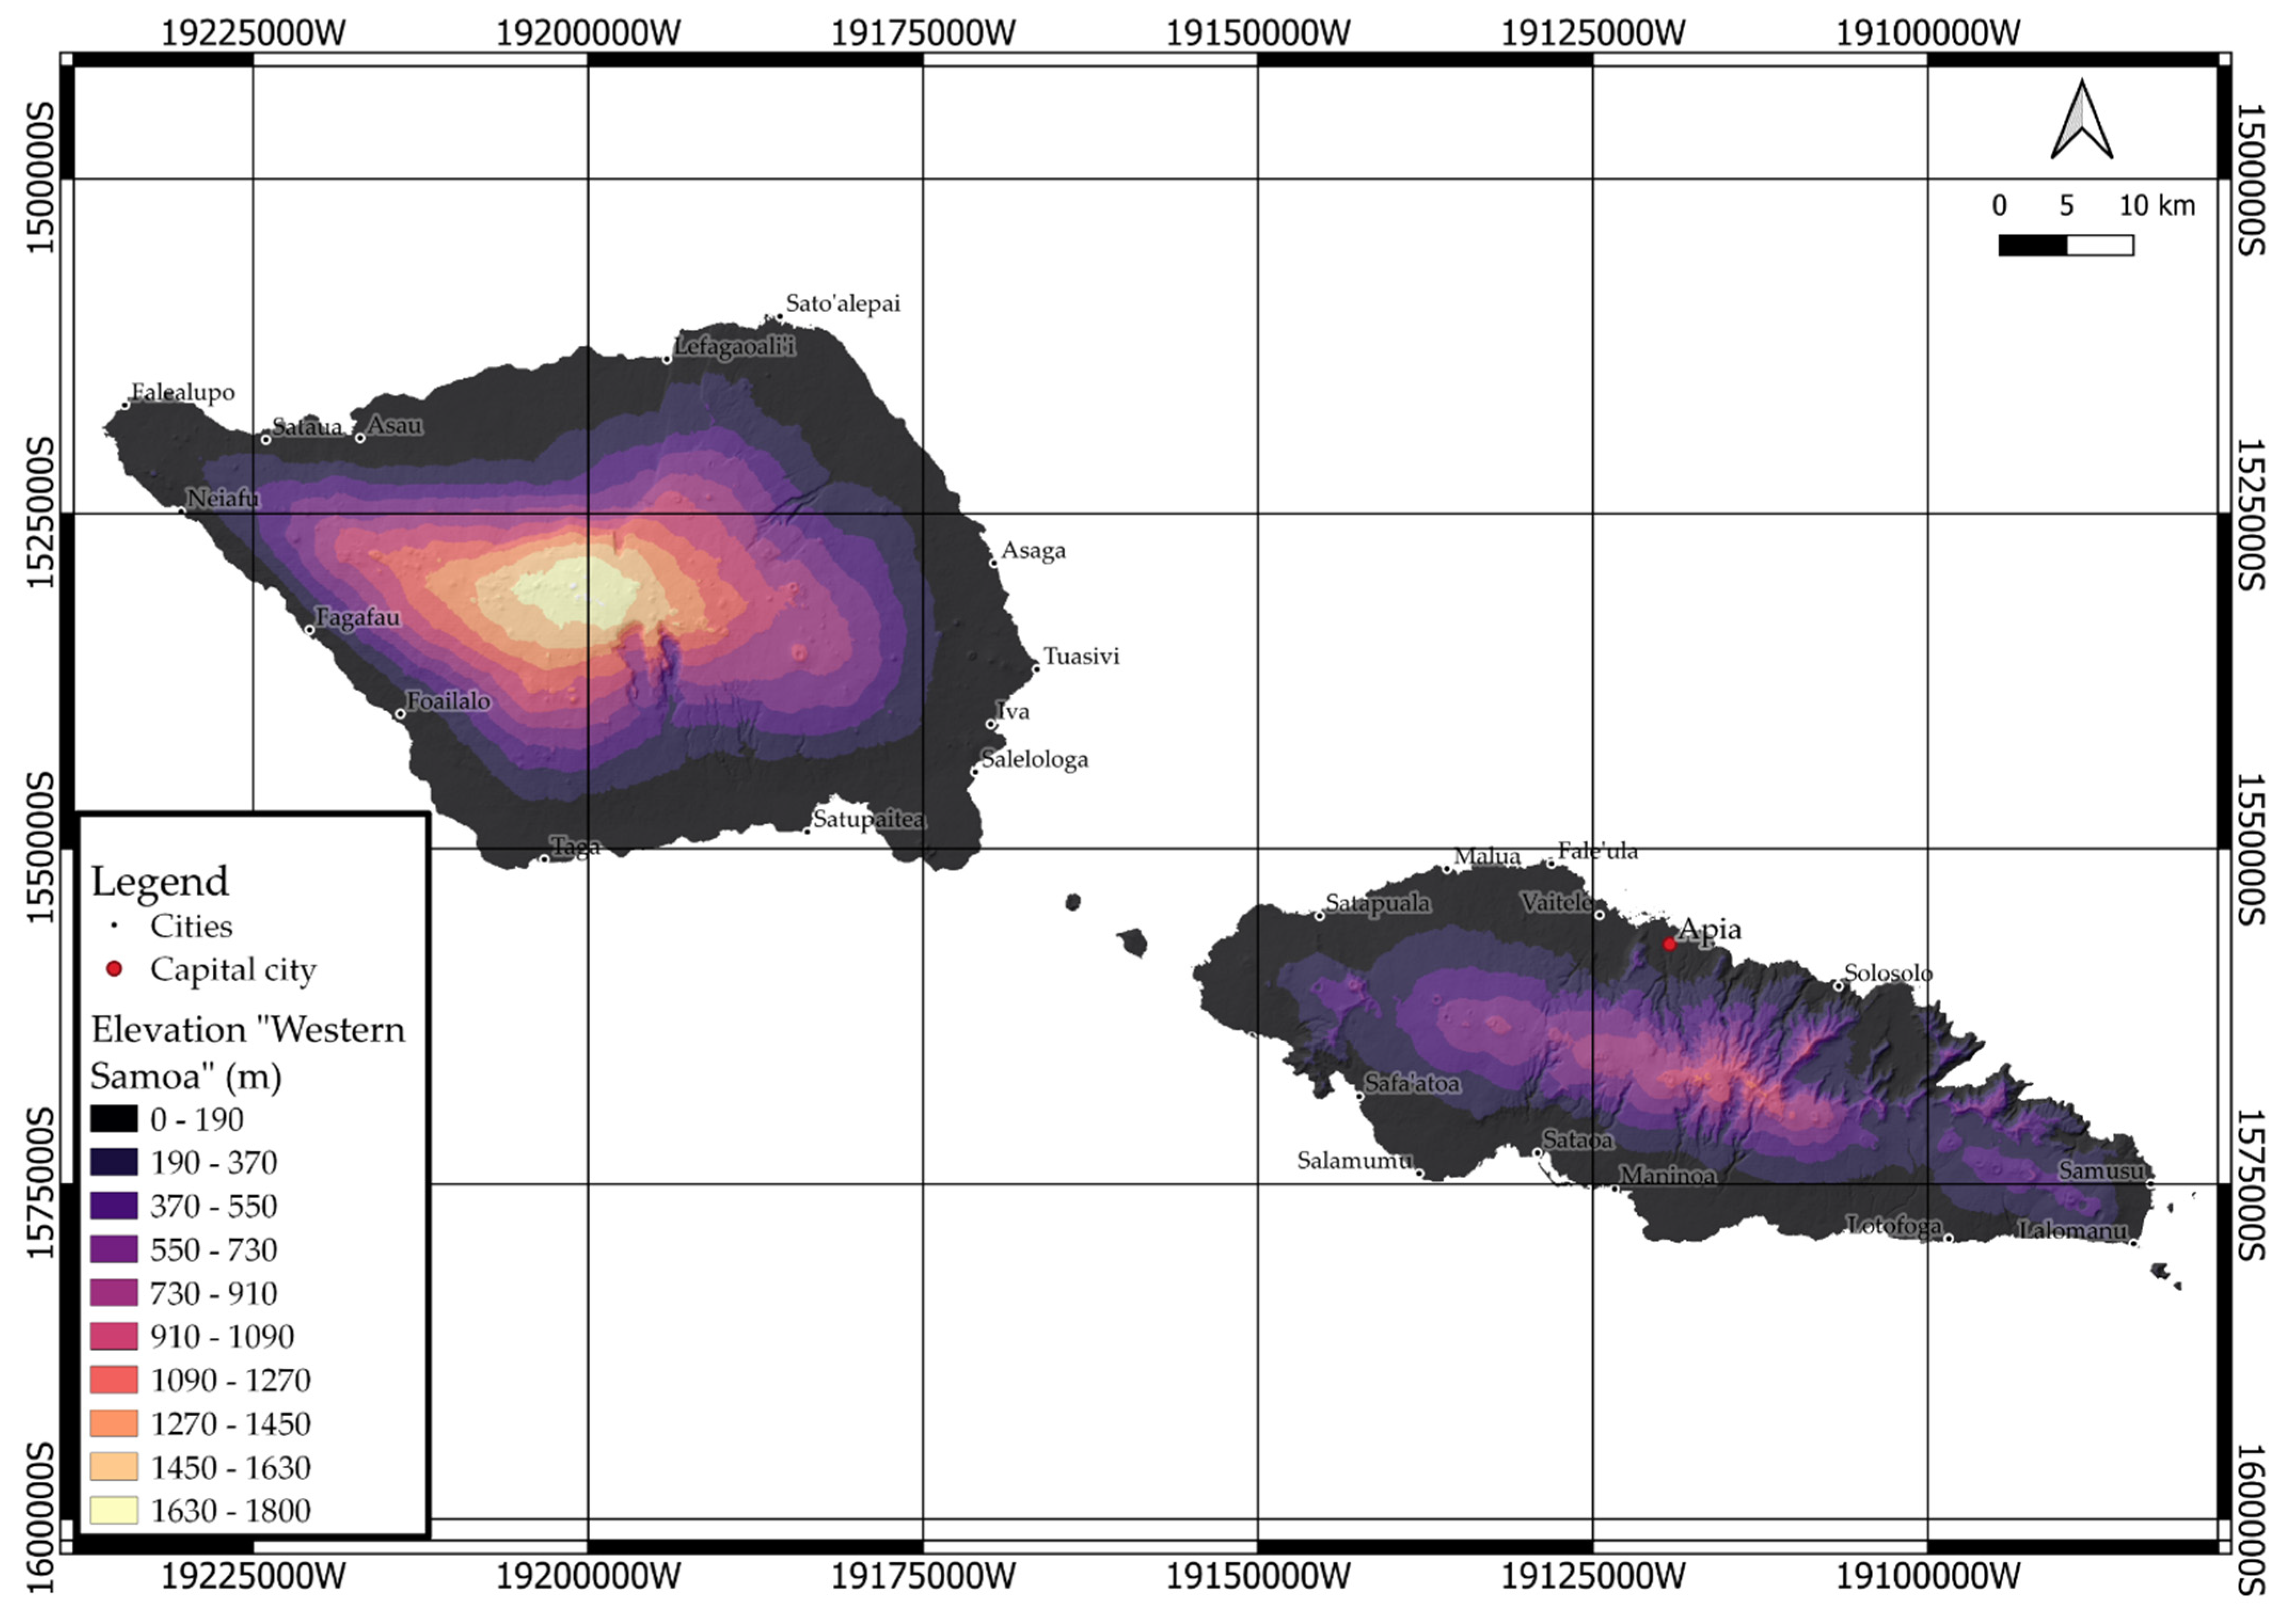
- DEM (Digital Elevation Model) needed for geomorphological assessment. In this project, SRTM 1-Arc-Second Global model [31] was downloaded through SRTM downloader (QGIS plugin).
- (b)
- Geological map of the territory and some additional information (if they are acceptable such as thematic maps).
- (2)
- (3)
- The grid (module in QGIS) was created with parameters 2.5 km horizontal spacing and 2.5 km vertical spacing according to the scale mentioned in previous section [31]. Then, the grid was cut according to the territory of research (clip tool in QGIS).
- (4)
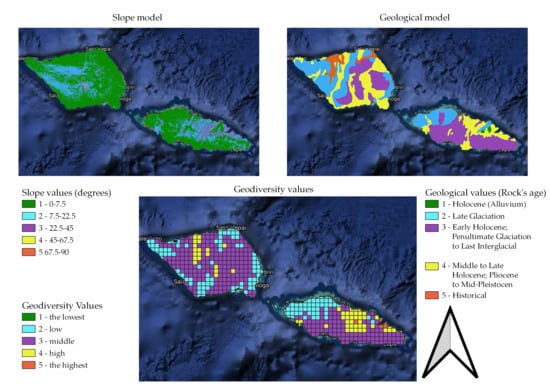
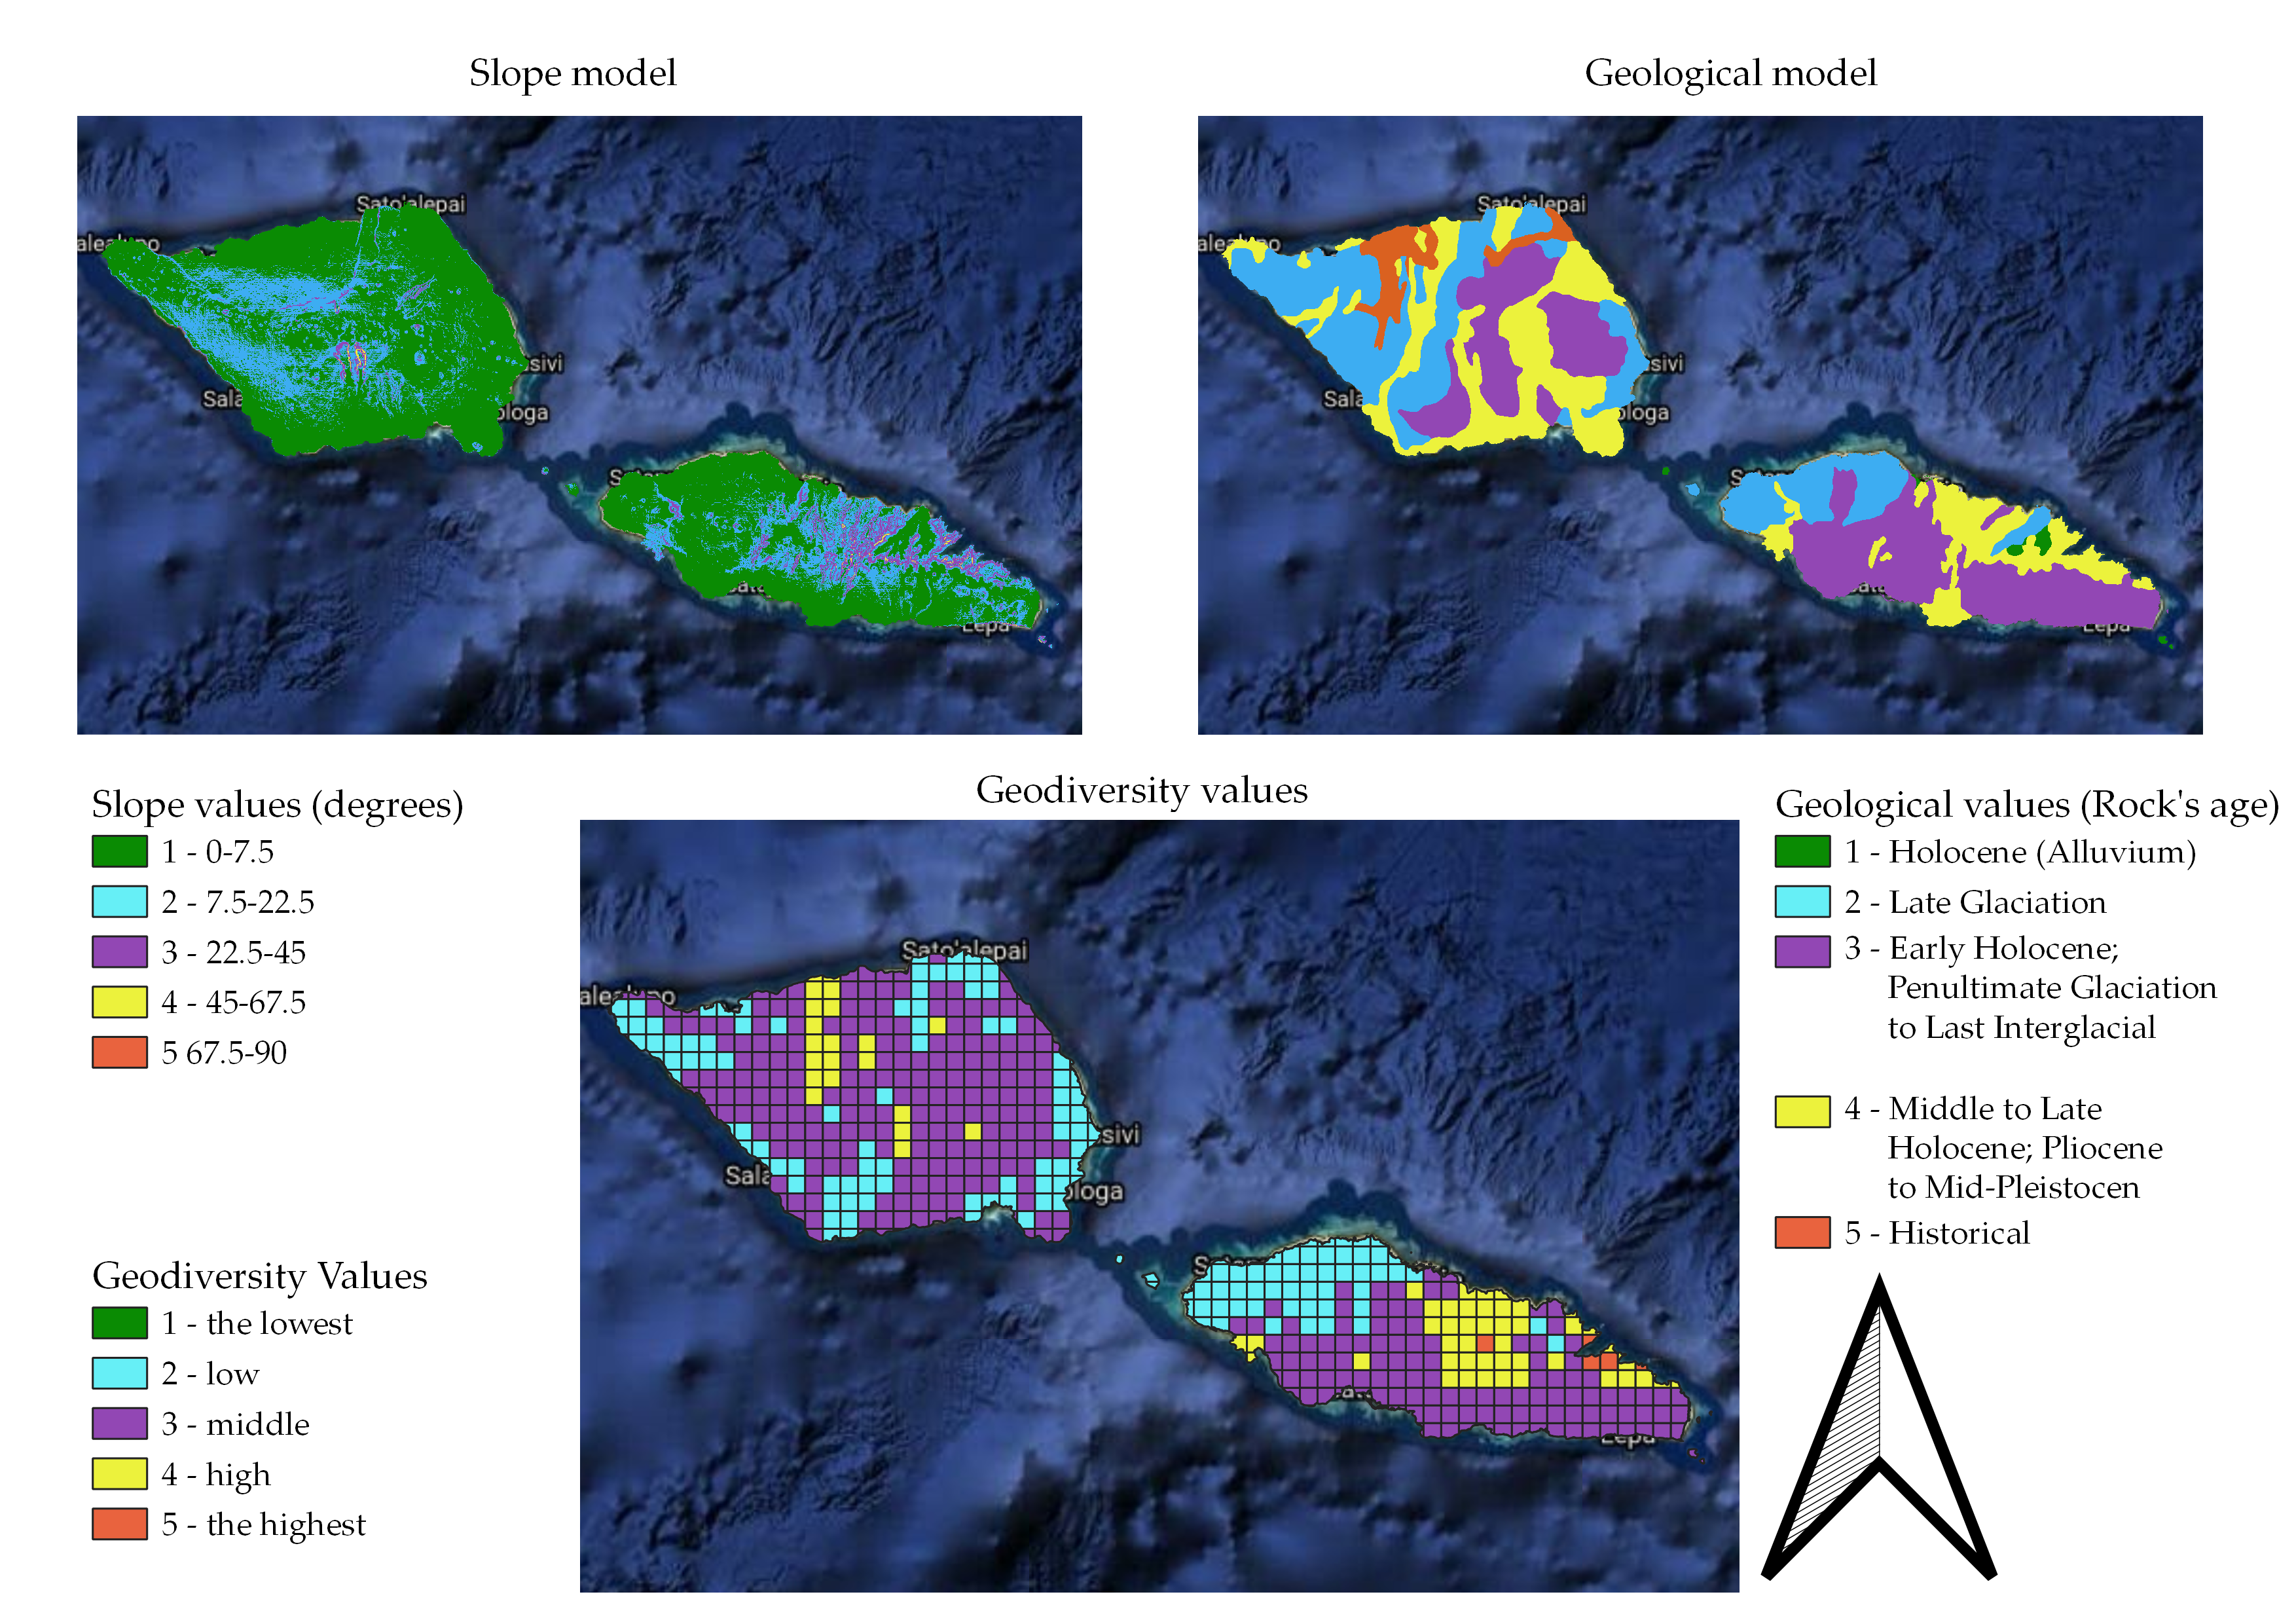
- A slope model was created from SRTM to provide information about steepness measured in degrees, utilized to calculate geomorphological values (Table 1):
- (a)
- Gaussian filter is SAGA (System for Automated Geoscientific Analyses) (http://www.saga-gis.org/en/index.html (accessed on 29 September 2021)) [43] tool acceptable in QGIS, which can be utilized for smoothing the SRTM model.
- (b)
- (c)
- (5)
- The geological map [30] was transferred into QGIS and polygonised into a geological model:
- (a)
- (b)
- Transformation created polygonal files with associated values (Table 1).
- (c)
- (6)
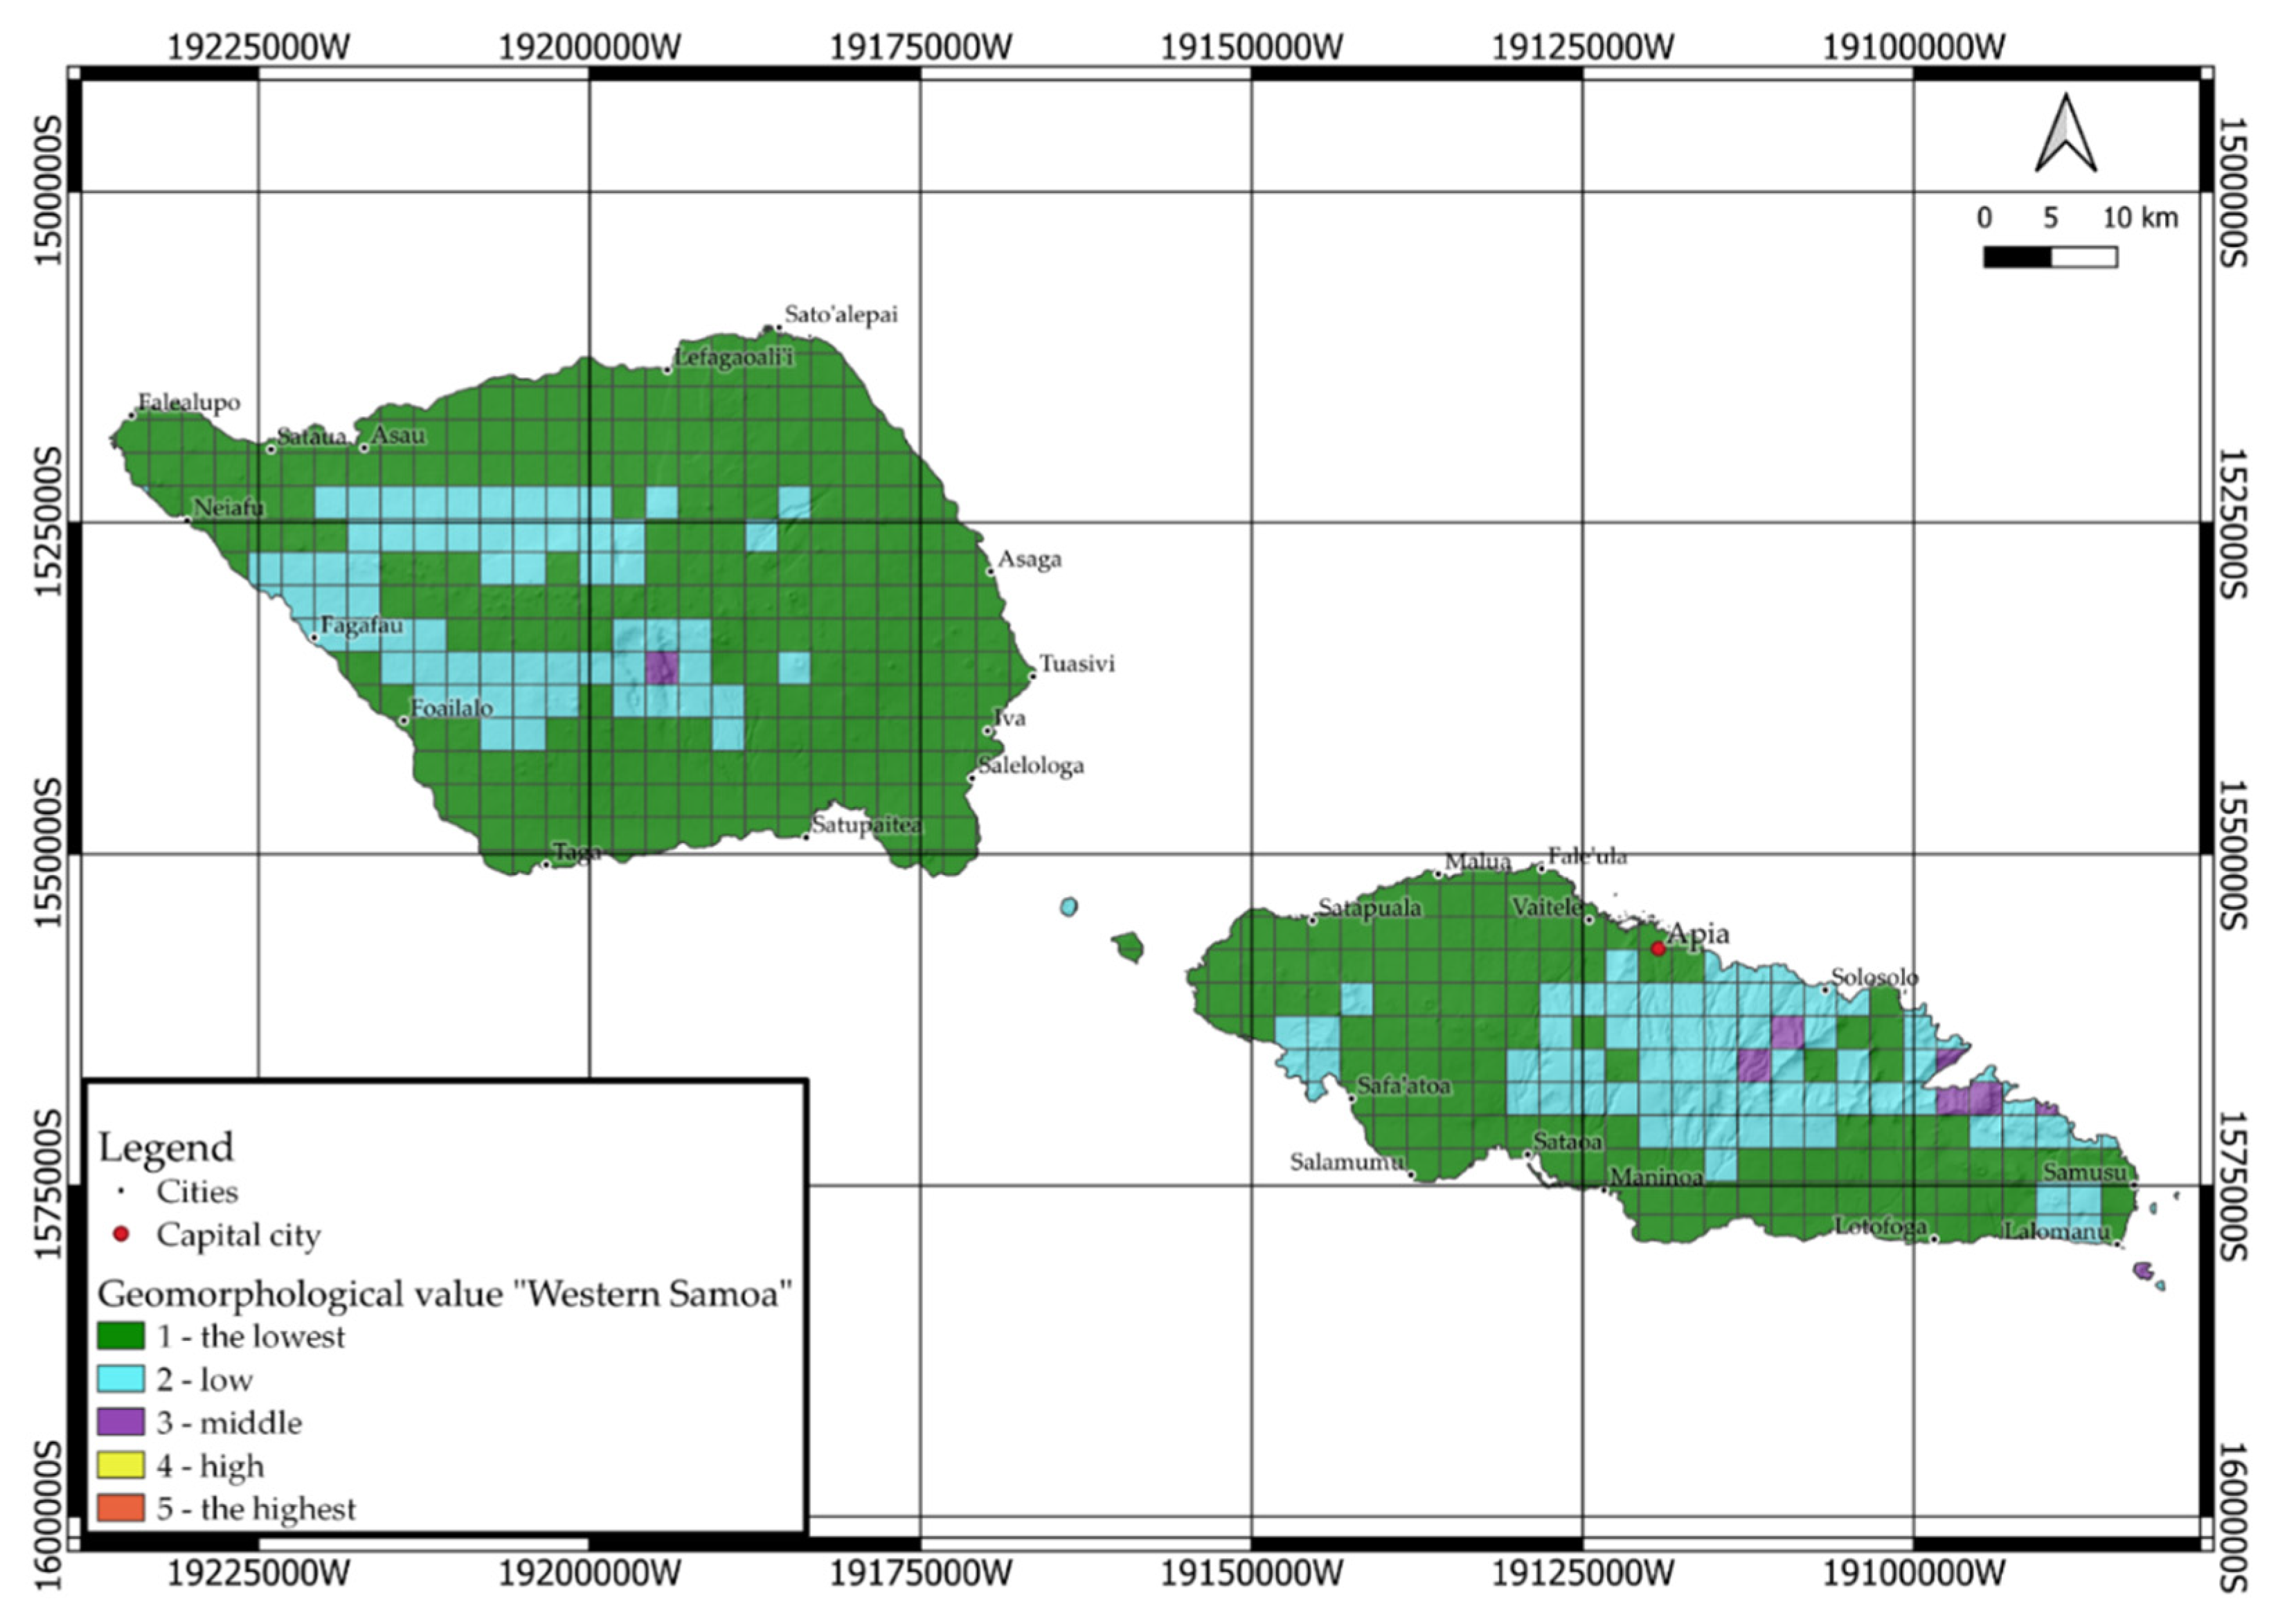
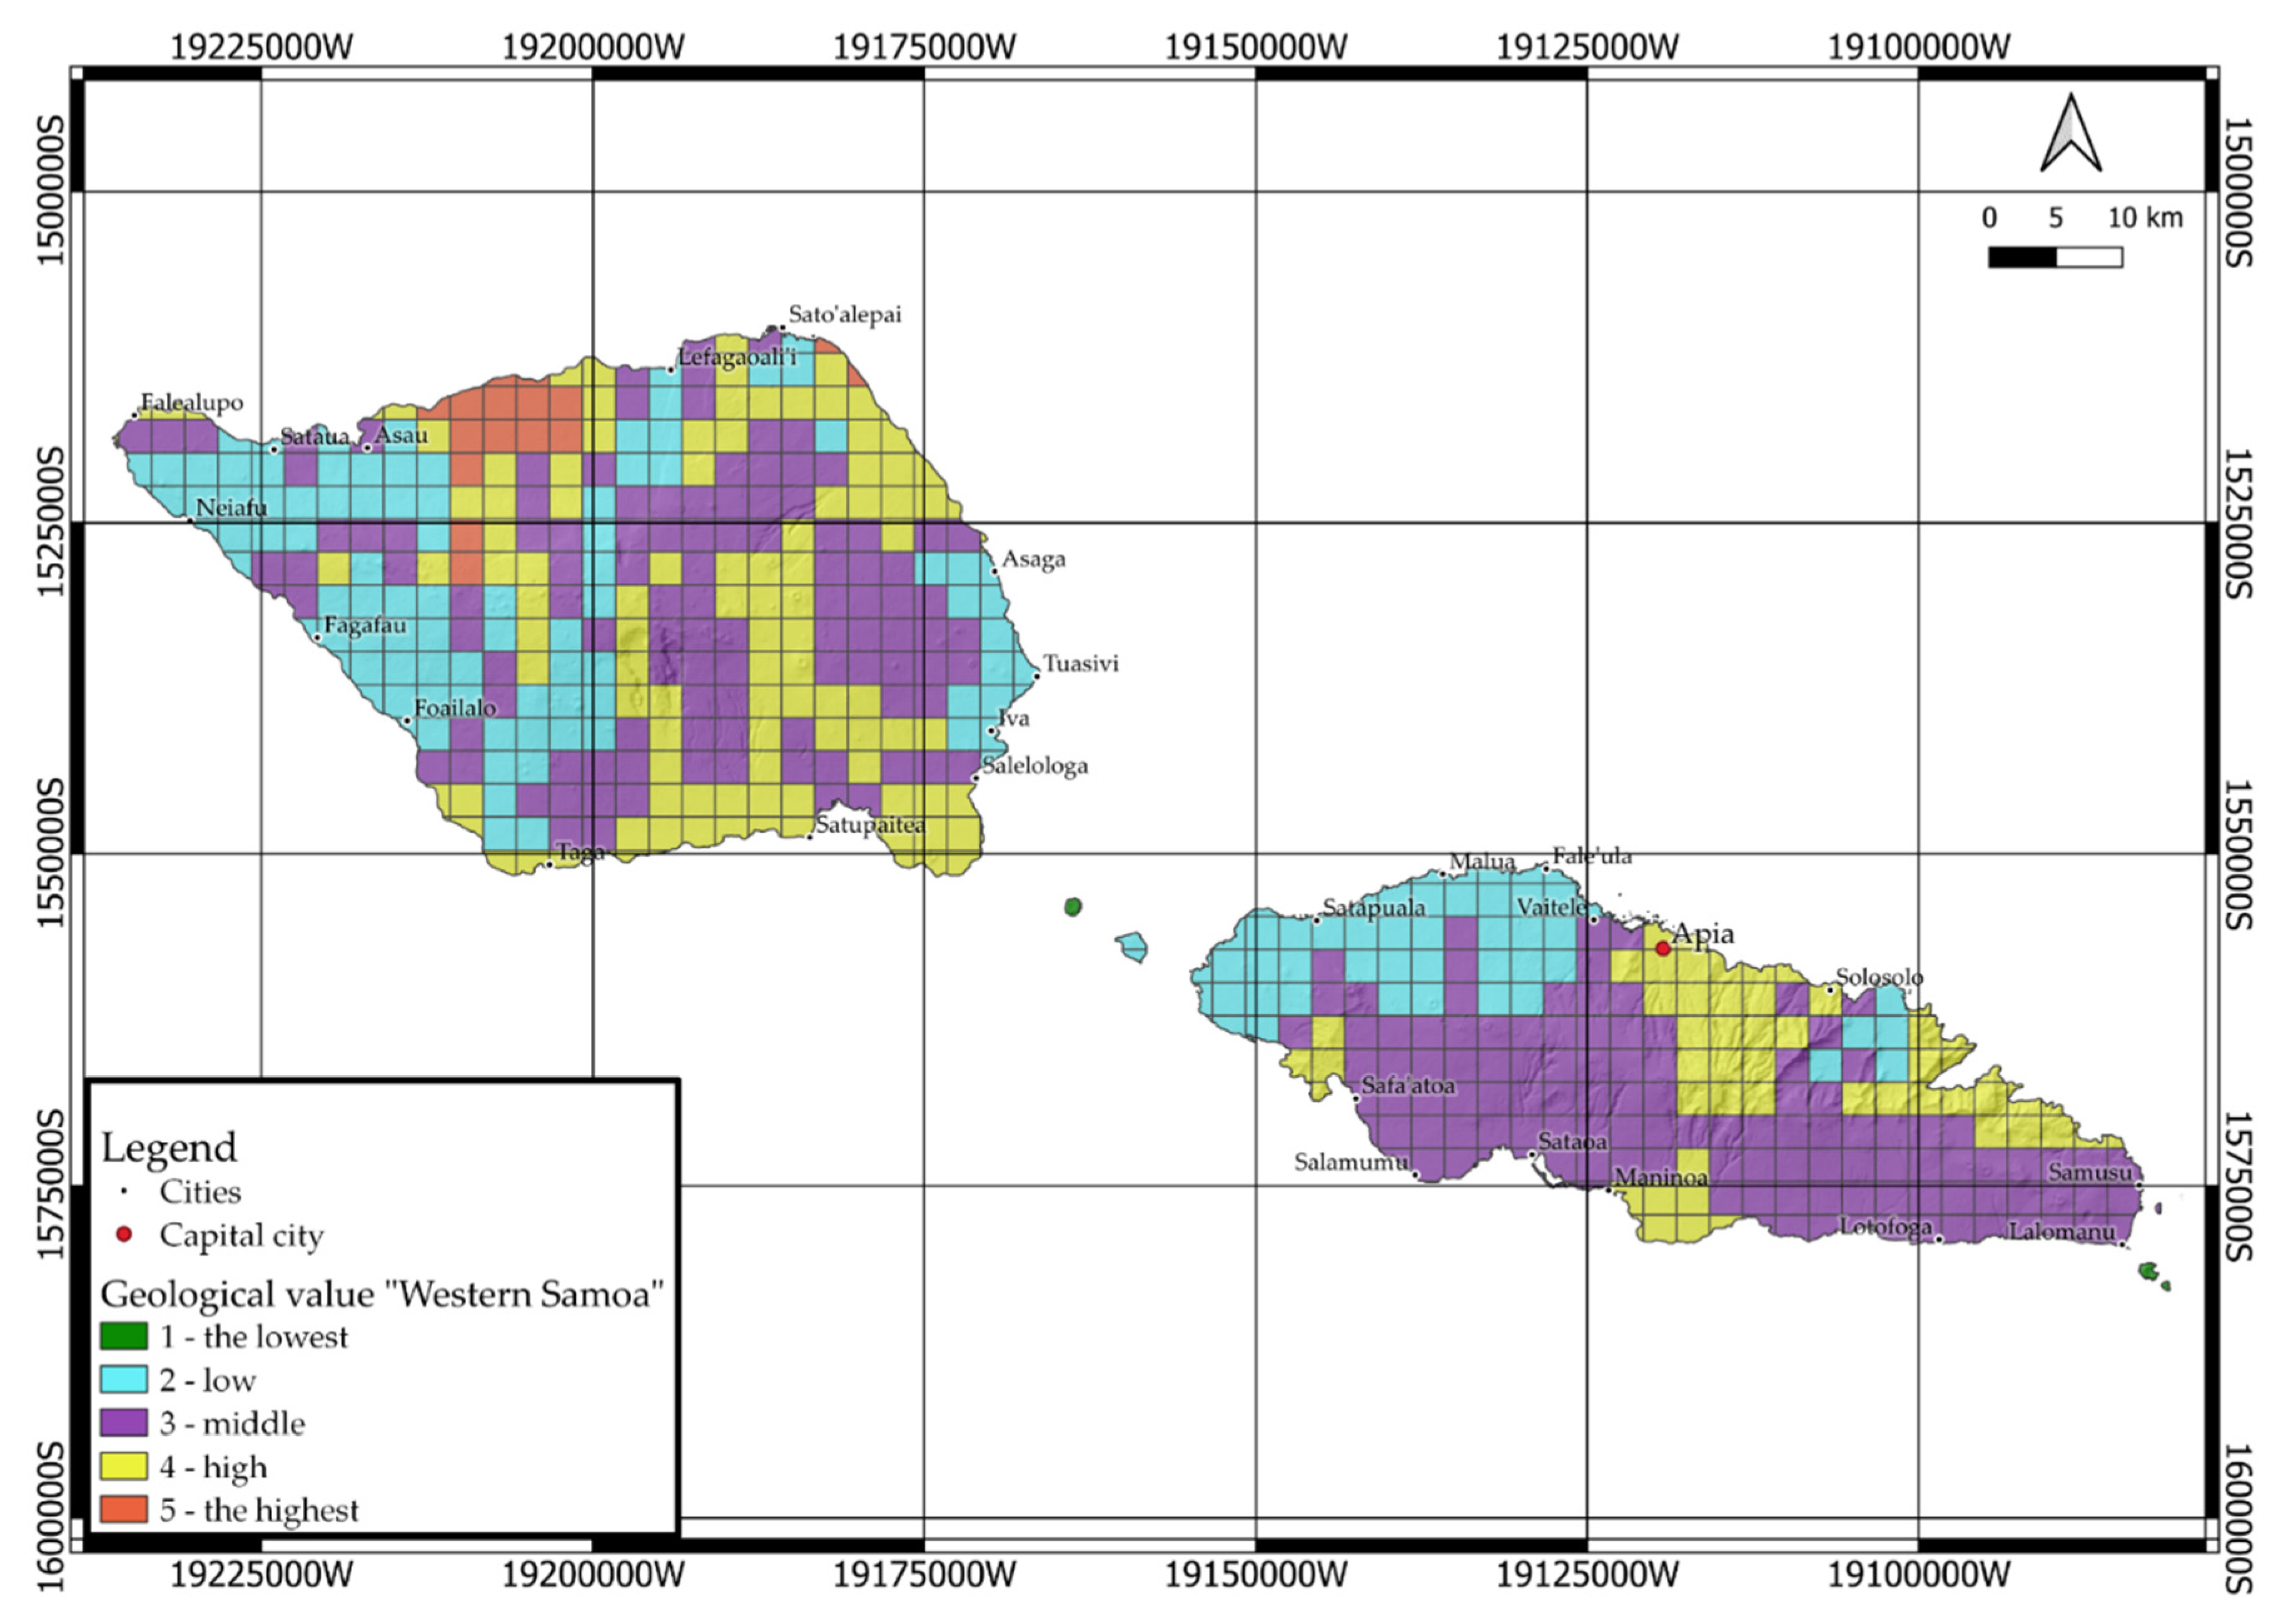
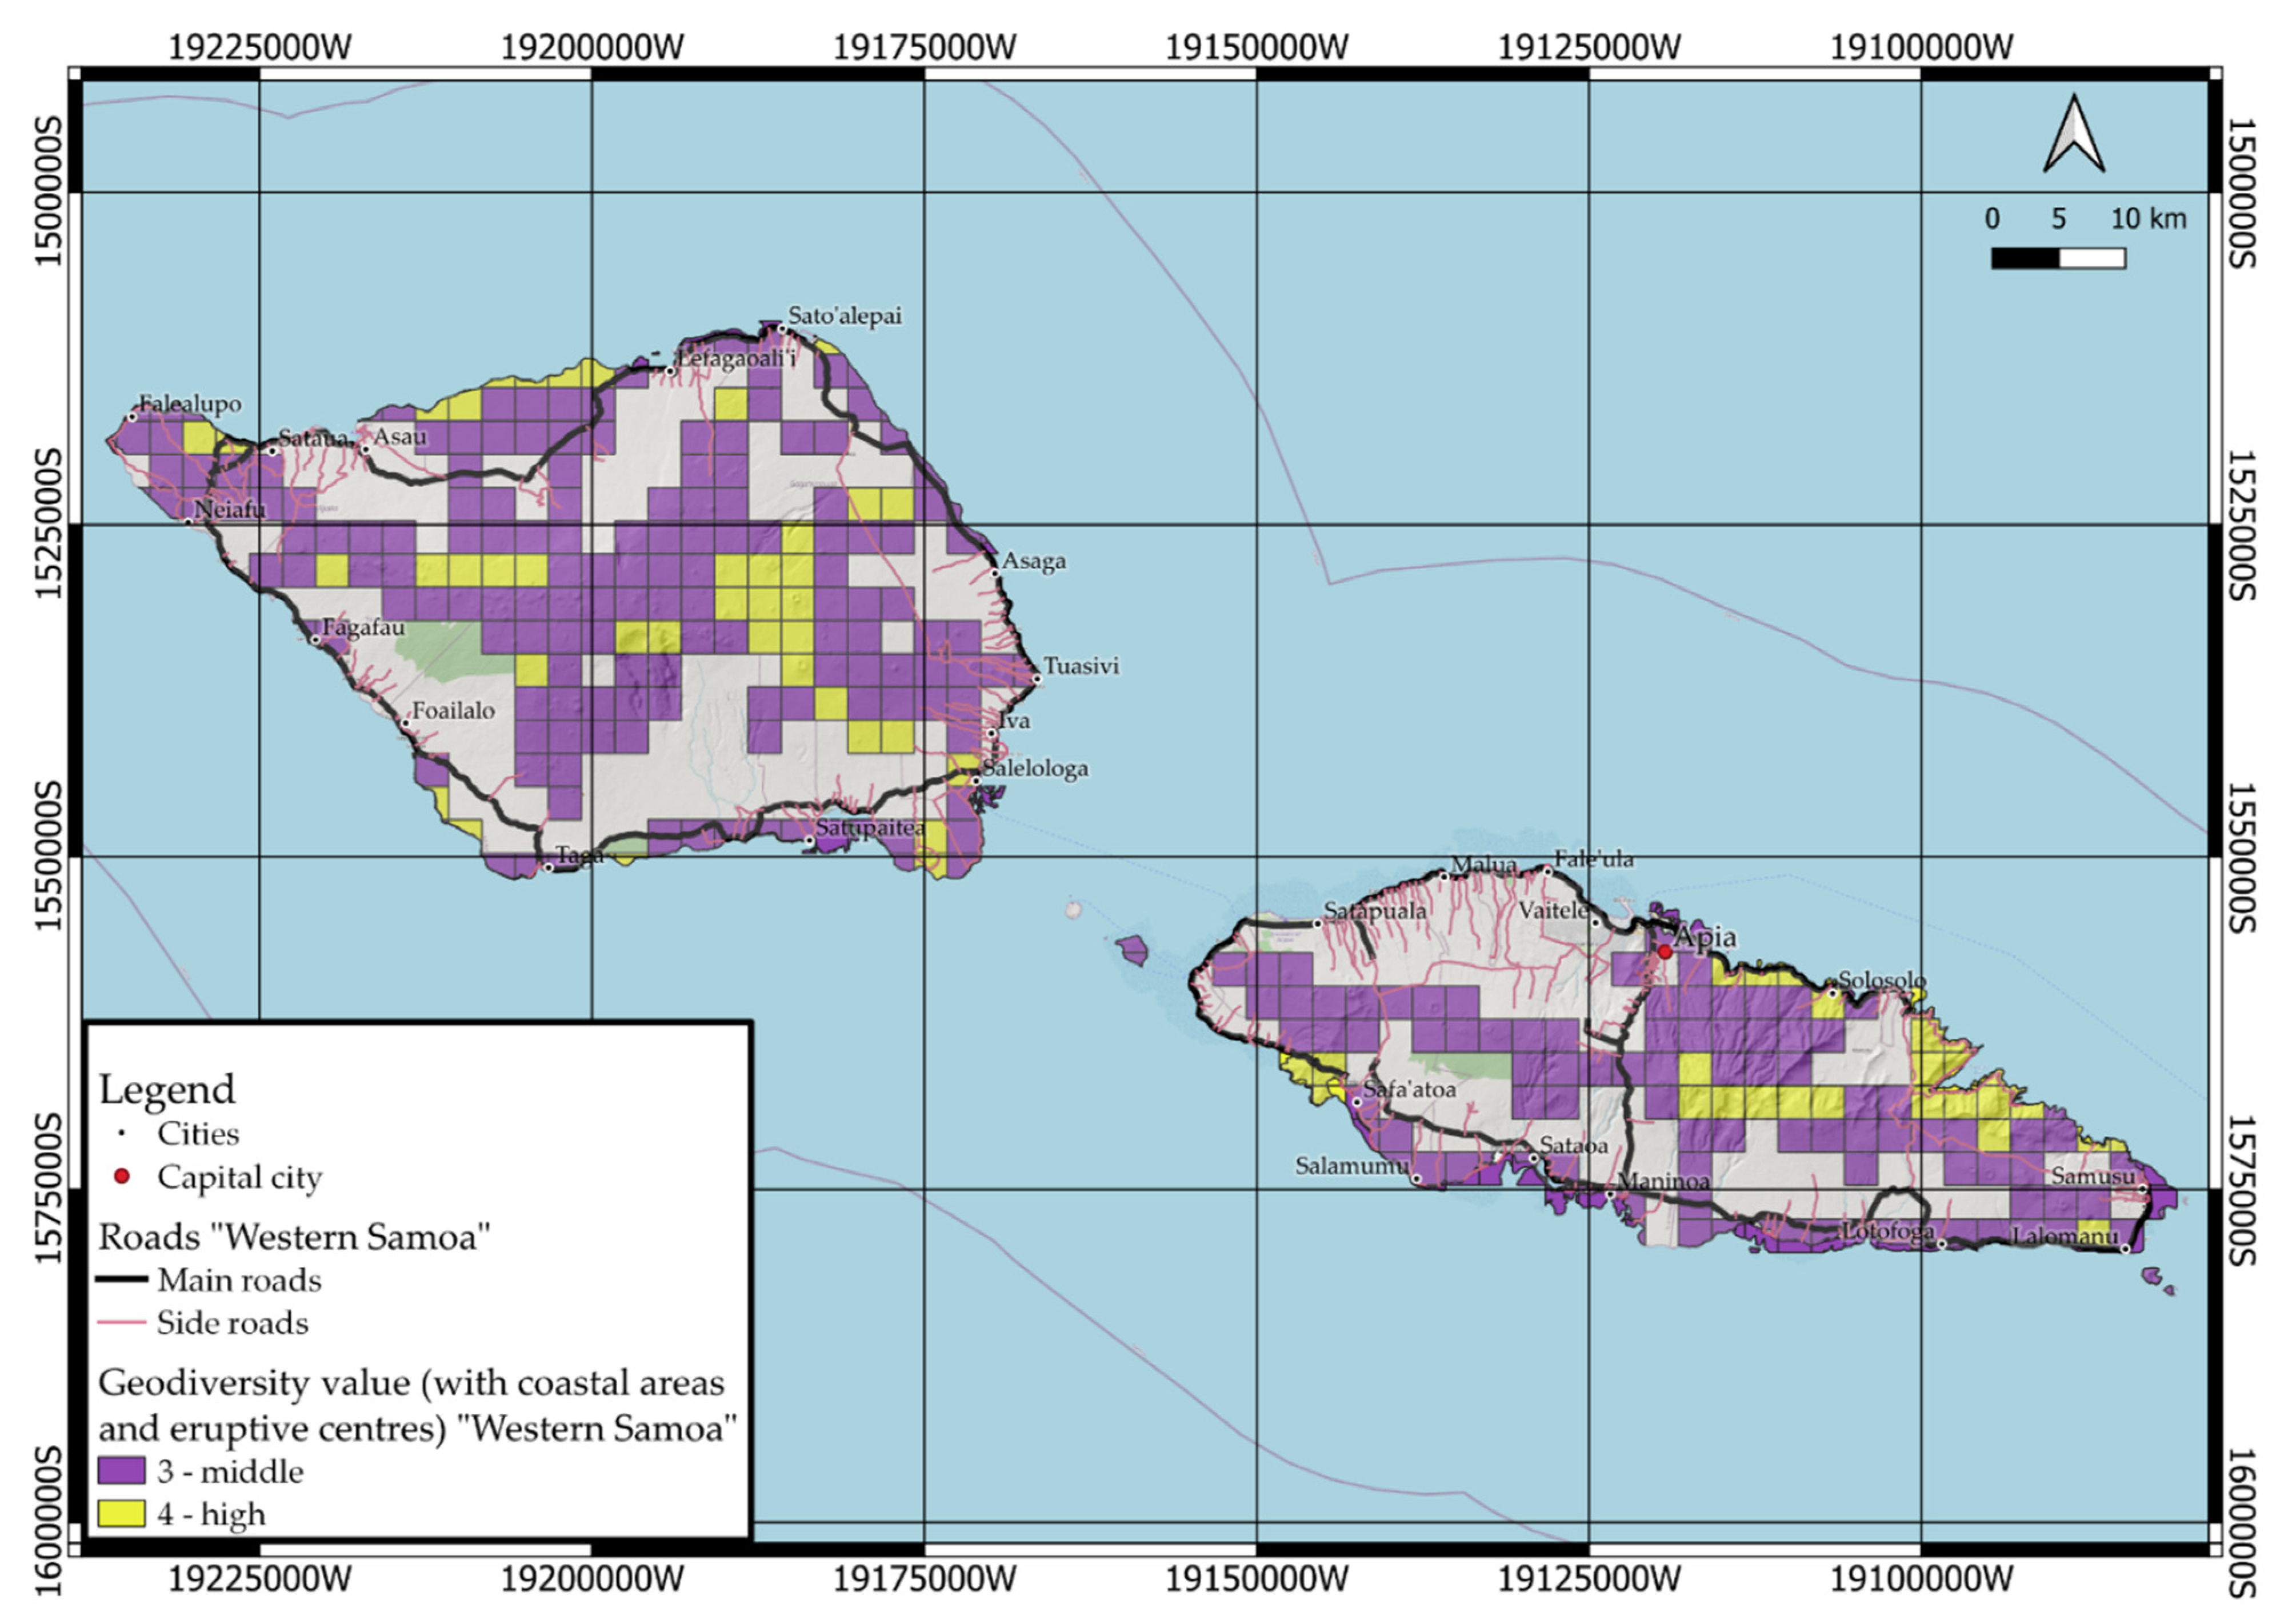
- The equation of arithmetic average (Section 2.4) is acceptable in Zonal Statistic Tool of QGIS [42,48]. Hence, it was applied to the created grid vector file as impute layer and raster of geology (Step 5 (c)) and geomorphology (Step 4 (c)) for calculation of mean value of each region (grid cell). The result is presented in the next section (Figure 6 and Figure 7).
- (7)
- (8)
3. Results
4. Discussion
5. Conclusions
Author Contributions
Funding
Institutional Review Board Statement
Informed Consent Statement
Data Availability Statement
Acknowledgments
Conflicts of Interest
References
- Gray, M. Geodiversity: Developing the paradigm. Proc. Geol. Assoc. 2008, 119, 287–298. [Google Scholar] [CrossRef]
- Gray, M. Geodiversity: The backbone of geoheritage and geoconservation. In Geoheritage; Elsevier: Amsterdam, The Netherland, 2018; pp. 13–25. [Google Scholar]
- Kozłowski, S. Postępy prac nad ochroną georóżnorodności w Polsce. Kosmos 2001, 50, 151–165. [Google Scholar]
- Kozłowski, S. Geodiversity. The concept and scope of geodiversity. Przegląd Geol. 2004, 52, 833–837. [Google Scholar]
- Serrano, E.; Ruiz-Flaño, P. Geodiversity: A theoretical and applied concept. Geogr. Helv. 2007, 62, 140–147. [Google Scholar] [CrossRef]
- Manosso, F.C.; de Nóbrega, M.T. Calculation of geodiversity from landscape units of the Cadeado range region in Paraná, Brazil. Geoheritage 2016, 8, 189–199. [Google Scholar] [CrossRef]
- Brocx, M.; Semeniuk, V. Geoheritage and geoconservation-history, definition, scope and scale. J. R. Soc. West. Aust. 2007, 90, 53–87. [Google Scholar]
- Cengiz, C.; Şahin, Ş.; Cengiz, B.; Başkır, M.B.; Keçecioğlu Dağlı, P. Evaluation of the Visitor Understanding of Coastal Geotourism and Geoheritage Potential Based on Sustainable Regional Development in Western Black Sea Region, Turkey. Sustainability 2021, 13, 11812. [Google Scholar] [CrossRef]
- Williams, M.A.; McHenry, M.T.; Boothroyd, A. Geoconservation and geotourism: Challenges and unifying themes. Geoheritage 2020, 12, 1–14. [Google Scholar] [CrossRef]
- Ólafsdóttir, R.; Dowling, R. Geotourism and geoparks—A tool for geoconservation and rural development in vulnerable environments: A case study from Iceland. Geoheritage 2014, 6, 71–87. [Google Scholar] [CrossRef]
- Bentivenga, M.; Cavalcante, F.; Mastronuzzi, G.; Palladino, G.; Prosser, G. Geoheritage: The foundation for sustainable geotourism. Geoheritage 2019, 11, 1367–1369. [Google Scholar] [CrossRef]
- Zwoliński, Z.; Najwer, A.; Giardino, M. Methods for assessing geodiversity. In Geoheritage; Elsevier: Amsterdam, The Netherlands, 2018; pp. 27–52. [Google Scholar]
- Gray, M. Geodiversity: Valuing and Conserving Abiotic Nature, 2nd ed.; Wiley-Blackwell: Chichester, UK, 2013. [Google Scholar]
- Gordon, J.E.; Barron, H.F. The role of geodiversity in delivering ecosystem services and benefits in Scotland. Scott. J. Geol. 2013, 49, 41–58. [Google Scholar] [CrossRef]
- Cañadas, E.S.; Flaño, P.R. Geodiversidad: Concepto, evaluación y aplicación territorial: El caso de Tiermes Caracena (Soria). Boletín de la asociación de geógrafos españoles 2007, 45, 79–98. [Google Scholar]
- Brilha, J.; Gray, M.; Pereira, D.I.; Pereira, P. Geodiversity: An integrative review as a contribution to the sustainable management of the whole of nature. Environ. Sci. Policy 2018, 86, 19–28. [Google Scholar] [CrossRef]
- Gray, M. Geodiversity and geoconservation: What, why, and how? In The George Wright Forum; George Wright Society: Houghton, MI, USA, 2005; Volume 22, pp. 4–12. ISSN1 0732-4715. Available online: http://www.georgewright.org/223.pdf (accessed on 5 September 2021)ISSN2 0732-4715.
- Zakharovskyi, V.; Németh, K. Quantitative-Qualitative Method for Quick Assessment of Geodiversity. Land 2021, 10, 946. [Google Scholar] [CrossRef]
- da Silva, M.L.N.; do Nascimento, M.A.L.; Mansur, K.L. Quantitative assessments of geodiversity in the area of the Seridó Geopark Project, Northeast Brazil: Grid and centroid analysis. Geoheritage 2019, 11, 1177–1186. [Google Scholar] [CrossRef]
- Dias, M.C.S.S.; Domingos, J.O.; dos Santos Costa, S.S.; do Nascimento, M.A.L.; da Silva, M.L.N.; Granjeiro, L.P.; de Lima Miranda, R.F. Geodiversity Index Map of Rio Grande do Norte State, Northeast Brazil: Cartography and Quantitative Assessment. Geoheritage 2021, 13, 1–15. [Google Scholar] [CrossRef]
- Pál, M.; Albert, G. Refinement Proposals for Geodiversity Assessment—A Case Study in the Bakony–Balaton UNESCO Global Geopark, Hungary. ISPRS Int. J. Geo-Inf. 2021, 10, 566. [Google Scholar] [CrossRef]
- Ferrando, A.; Faccini, F.; Paliaga, G.; Coratza, P. A quantitative GIS and AHP based analysis for geodiversity assessment and mapping. Sustainability 2021, 13, 10376. [Google Scholar] [CrossRef]
- Melelli, L. Geodiversity: A new quantitative index for natural protected areas enhancement. Geoj. Tour. Geosites 2014, 1, 27–37. [Google Scholar]
- Filocamo, F.; Di Paola, G.; Mastrobuono, L.; Rosskopf, C.M. MoGeo, a Mobile Application to Promote Geotourism in Molise Region (Southern Italy). Resources 2020, 9, 31. [Google Scholar] [CrossRef]
- Perotti, L.; Bollati, I.M.; Viani, C.; Zanoletti, E.; Caironi, V.; Pelfini, M.; Giardino, M. Fieldtrips and Virtual Tours as Geotourism Resources: Examples from the Sesia Val Grande UNESCO Global Geopark (NW Italy). Resources 2020, 9, 63. [Google Scholar] [CrossRef]
- Piacentini, T.; Miccadei, E.; Berardini, G.; Aratari, L.; De Ioris, A.; Calista, M.; Carabella, C.; d’Arielli, R.; Mancinelli, V.; Paglia, G. Geological tourist mapping of the mount serrone fault geosite (Gioia dei Marsi, central Apennines, Italy). J. Maps 2019, 15, 298–309. [Google Scholar] [CrossRef]
- Miccadei, E.; Piacentini, T.; Esposito, G. Geomorphosites and geotourism in the parks of the Abruzzo region (Central Italy). Geoheritage 2011, 3, 233–251. [Google Scholar] [CrossRef]
- Bétard, F.; Peulvast, J.-P. Geodiversity hotspots: Concept, method and cartographic application for geoconservation purposes at a regional scale. Environ. Manag. 2019, 63, 822–834. [Google Scholar] [CrossRef] [PubMed]
- McDougall, I. Age of volcanism and its migration in the Samoa Islands. Geol. Mag. 2010, 147, 705–717. [Google Scholar] [CrossRef]
- Kear, D. Geological notes on western Samoa. N. Z. J. Geol. Geophys. 1967, 10, 1446–1451. [Google Scholar] [CrossRef]
- Eros, U. USGS EROS Archive—Digital Elevation—Shuttle Radar Topography Mission (SRTM) 1 Arc-Second Global. 2015. Available online: https://www.usgs.gov/centers/eros/science/usgs-eros-archive-digital-elevation-shuttle-radar-topography-mission-srtm-1 (accessed on 5 September 2021).
- Gray, M. Geodiversity: Valuing and Conserving Abiotic Nature; John Wiley & Sons: Hoboken, NJ, USA, 2004; pp. 1–433. ISBN 978-0-470-74215-0. [Google Scholar]
- Gray, M. Geoheritage 1. Geodiversity: A new paradigm for valuing and conserving geoheritage. Geosci. Can. 2008, 35, 51–59. [Google Scholar]
- Davis, W.M. The geomorphic cycle. Geomorphic J. 1899, 14, 481–504. [Google Scholar] [CrossRef]
- Davis, W.M. Peneplains and the geographical cycle. Bull. Geol. Soc. Am. 1922, 33, 587–598. [Google Scholar] [CrossRef]
- Davis, W.M. The geographical cycle. In Climatic Geomorphology; Springer: Heidelberg, Germany, 1973; pp. 19–50. [Google Scholar]
- Blatt, H.; Jones, R.L. Proportions of exposed igneous, metamorphic, and sedimentary rocks. Geol. Soc. Am. Bull. 1975, 86, 1085–1088. [Google Scholar] [CrossRef]
- Dolan, M.F. Calculation of Slope Angle from Bathymetry Data Using GIS-Effects of Computation Algorithm, Data Resolution and Analysis Scale; NGU Report 2012.041; Geologi for Samfunnet—Geology for Society (Norges geologiske undersøkelse—Geological Survey of Norway): Trondheim, Norway, 2012; p. 45. [Google Scholar]
- Albut, S. Estimation of Slope Length (L) And Slope Steepness Factor (S) of RUSLE Equation by QGIS. Int. J. Res. Eng. Sci. 2020, 8, 43–48. [Google Scholar]
- Kim, K.W. The comparison of visibility measurement between image-based visual range, human eye-based visual range, and meteorological optical range. Atmos. Environ. 2018, 190, 74–86. [Google Scholar] [CrossRef]
- Tobias, M.M.; Mandel, A.I. Literature Mapper: A QGIS Plugin for Georeferencing Citations in Zotero. Air Soil Water Res. 2021, 14, 11786221211009209. [Google Scholar] [CrossRef]
- Baghdadi, N.; Mallet, C.; Zribi, M. QGIS and Generic Tools; John Wiley & Sons hichester: West Sussex, UK, 2018; Volume 1. [Google Scholar]
- Conrad, O.; Bechtel, B.; Bock, M.; Dietrich, H.; Fischer, E.; Gerlitz, L.; Wehberg, J.; Wichmann, V.; Böhner, J. System for automated geoscientific analyses (SAGA) v. 2.1. 4. Geosci. Model Dev. 2015, 8, 1991–2007. [Google Scholar] [CrossRef]
- Schillaci, C.; Braun, A. Terrain Analysis and Landform Recognition; Geomorphological Techniques—Chapter 2, Section 4.2; British Society for Geomorphology: London, UK, 2015; pp. 1–18. ISSN 2047-0371. [Google Scholar]
- Zevenbergen, L.W.; Thorne, C.R. Quantitative analysis of land surface topography. Earth Surf. Process. Landf. 1987, 12, 47–56. [Google Scholar] [CrossRef]
- Reuter, H.; Nelson, A. Geomorphometry in ESRI packages. Dev. Soil Sci. 2009, 33, 269–291. [Google Scholar]
- GRASS GIS 7.2.1svn Reference Manual. Available online: http://wgbis.ces.iisc.ernet.in/grass/grass72/manuals/ (accessed on 31 August 2021).
- Jung, M. LecoS-A QGIS Plugin for Automated Landscape Ecology Analysis; PeerJ PrePrints: San Diego, CA, USA, 2013; p. 10. [Google Scholar] [CrossRef]


| Main Values of Geodiversity | Additional Values of Geodiversity | ||||||
|---|---|---|---|---|---|---|---|
| Values (5-point system) | Elements of Geodiversity | ||||||
| Morphology | Geology | Additional features for assessment | Volcano | Hydrology | |||
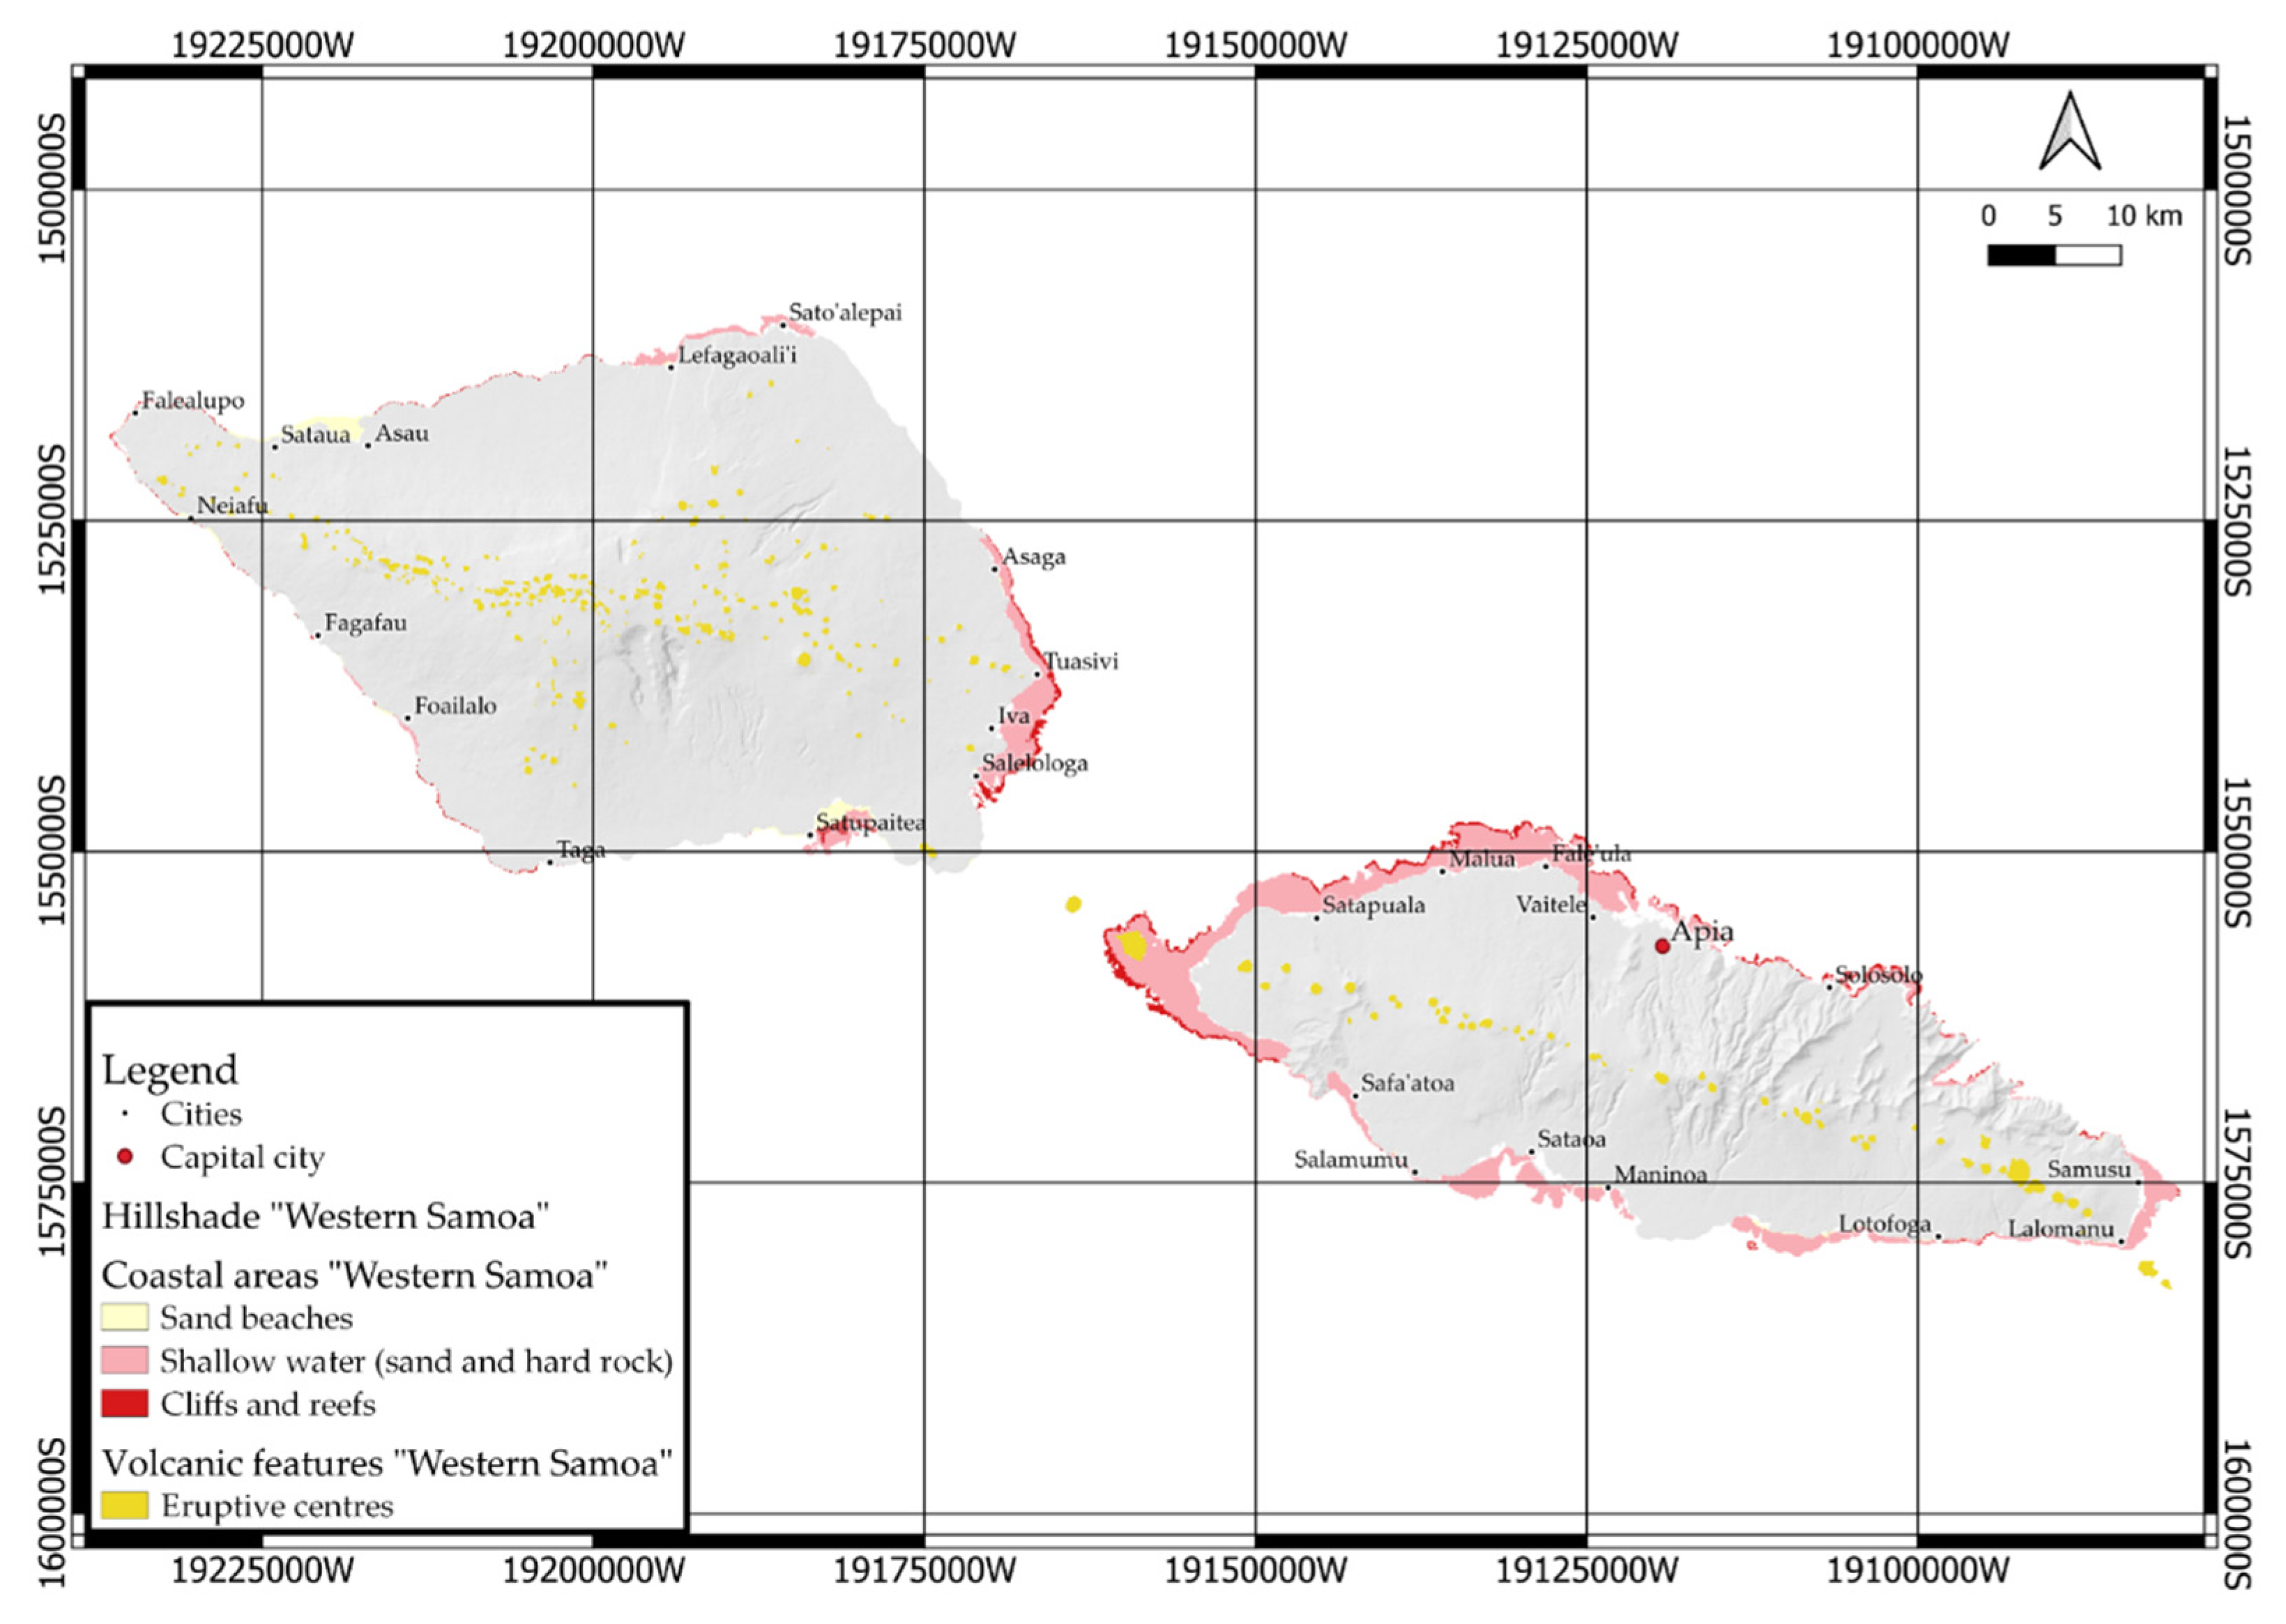
| Slope degree | Rock type and ages (Right column for Samoa) | Eruptive centres | Coastal sections | ||||
| 1 (the lowest) | 0–7.5 | The rock type values are no applicable for the Western Samoa region: all are Extrusive rocks, the highest value—5 | Alluvium (Holocene) | The mark is applicable for the areas of spreading, with the lowest value—1 | Quality system | ||
| 2 (low) | 7.5–22.5 | Mulifanua | 0.5 | Sand beaches | |||
| 3 (middle) | 22.5–45 | Lefaga | 0.75 | Shallow water sand with rocks | |||
| 4 (high) | 45–67.5 | Puapua and Fagaloa | 1 | Hard rock cliffs and reefs | |||
| 5 (the highest) | 67.5–90 | Aopo and Vini Tuff | |||||
| Eras | Crystalline | Sedimentary | No. of Usable Data Points | |||
|---|---|---|---|---|---|---|
| Extrusive | Intrusive | Metamorphic and “Precambrian” | Total | |||
| Cenozoic | 4 | 0 | 0 | 4 | 33 | 290 |
| Mesozoic | 2 | 1 | 1 | 4 | 18 | 177 |
| Palaeozoic | 1 | 1 | <1 | 2 | 13 | 117 |
| Precambrian | 0 | 6 | 15 | 21 | 1 | 173 |
| Age unknown | 1 | 1 | 1 | 3 | 1 | 26 |
| Total | 8 | 9 | 17 | 34 | 66 | 783 |
Publisher’s Note: MDPI stays neutral with regard to jurisdictional claims in published maps and institutional affiliations. |
© 2021 by the authors. Licensee MDPI, Basel, Switzerland. This article is an open access article distributed under the terms and conditions of the Creative Commons Attribution (CC BY) license (https://creativecommons.org/licenses/by/4.0/).
Share and Cite
Zakharovskyi, V.; Németh, K. Qualitative-Quantitative Assessment of Geodiversity of Western Samoa (SW Pacific) to Identify Places of Interest for Further Geoconservation, Geoeducation, and Geotourism Development. Geographies 2021, 1, 362-380. https://doi.org/10.3390/geographies1030020
Zakharovskyi V, Németh K. Qualitative-Quantitative Assessment of Geodiversity of Western Samoa (SW Pacific) to Identify Places of Interest for Further Geoconservation, Geoeducation, and Geotourism Development. Geographies. 2021; 1(3):362-380. https://doi.org/10.3390/geographies1030020
Chicago/Turabian StyleZakharovskyi, Vladyslav, and Károly Németh. 2021. "Qualitative-Quantitative Assessment of Geodiversity of Western Samoa (SW Pacific) to Identify Places of Interest for Further Geoconservation, Geoeducation, and Geotourism Development" Geographies 1, no. 3: 362-380. https://doi.org/10.3390/geographies1030020
APA StyleZakharovskyi, V., & Németh, K. (2021). Qualitative-Quantitative Assessment of Geodiversity of Western Samoa (SW Pacific) to Identify Places of Interest for Further Geoconservation, Geoeducation, and Geotourism Development. Geographies, 1(3), 362-380. https://doi.org/10.3390/geographies1030020