1. Introduction
The ‘2030 Agenda for Sustainable Development’ identifies migration as an important pillar and catalyst for sustainable development, especially in the global south [
1]. In Sub-Saharan Africa (SSA), there has been a long history of international and internal migration, with increasing migration rates from and within most of the countries [
1,
2]. In 2019, 10.4% of the international migrants (272 million) around the globe originated from the region of SSA [
3]. However, a migrant stock of about 763 million people globally (of which 36% were in SSA) moved within their own countries (internal migration), mainly to urban areas [
3]. This indicates that internal rural out-migration is dominant, and this trend in migration is predicted to continue into the future given the rural–urban inequality related to the social and economic aspects of life [
1].
Generally, the origin–destination inequality in relation to—but not limited to—the labor market, work and business opportunities, wages, social services, and lifestyles is crucial in inducing rural out-migration movements [
4]. In spite of people leaving one place for another, migration generally brings the benefits of social and economic development to the origin and destination places alike [
2,
5]. On the one hand, whenever people move, they transfer manpower and skills, fill the labor market’s gaps, and provide knowledge and innovations that contribute to economic growth in the destination places. On the other hand, the migrants send remittances back home, which are used as capital to promote business investments in their communities of origin. In addition, migrants bring cultural diversity to the societies at their destination and, in the case of their return, they take back social remittances in the form of skills and new ideas [
5].
This migration–development nexus has long attracted attention at the international level, with many research and policy agendas focusing on international migration [
1,
6,
7]. However, at the national and sub-national levels, as a development issue, migration is also interconnected with social and economic development [
1,
8]. Noteworthy is that the available data and reports that shape migration policy agendas and practices mostly focus on international migration [
9]. For example, the ‘World Migration Report’ published in series since 2000 by the International Organization for Migration (IOM) and the migrant stock dataset from the United Nations Department of Economics and Social Affairs/Population Division (UN-DESA/PD) largely focus on international migration. Going forward, internal migration should also be given more research and policy attention so as to enhance its social and economic development benefits. This is especially valid for the countries of SSA, where this form of migration is dominant and predicted to continue [
1,
9].
Internal migration can take several forms depending on the direction of the migratory flow: rural to urban, urban to urban, rural to rural, and urban to rural migration [
10]. Regardless of the place of destination, if people are moving away from rural areas, this is referred to as rural out-migration. In Uganda, rural out-migration has been an integral part of the development process by contributing to social and demographic changes [
11]. During the post-colonial period, the establishment of factories and industries in the urban centers, such as in Kampala and Jinja, presented employment opportunities and induced rural out-migration [
12], [
13]. In the mid-1990s, the country achieved political stability and subsequently underwent a progressive social and economic transformation [
14]. This transformation continues to shape the demographic dynamics in terms of population size, distribution, and urbanization [
15].
Growing at an annual average rate of 3% since 2000, Uganda’s total population was estimated to be 44 million in 2020, of which about 76% is living in rural areas [
16]. Although the country is predominantly rural, its urban population is rapidly increasing; it went from 2.9 million in 2002 to 11 million in 2019 [
17]. Since 2002, Uganda’s average annual urbanization rate of 5.9% has consistently been higher than that of the rural population growth rate of 2.7% [
17]. This rapid urban population growth is partly driven by in-migration from rural areas. For example, 66 percent of the 1.4 million internal migrants enumerated during the national census of 2014 had permanently settled in urban areas [
18]. Uganda’s urban centers act as attraction poles for population concentration and distribution, as they offer better social services (education, health, access to clean water and electricity), (potential) business and employment opportunities, and higher wages relative to the rural areas [
19]. This rural–urban divide and the inequality in relation to social and economic infrastructures cause the urban areas to be presented as preferred destination for rural out-migrants. As people continue moving from rural to urban areas, it is imperative to better understand the rural out-migration process with respect to who the migrants are, where they migrate to, and why they are moving. Such an understanding is important for informing policy and practice for integrated economic and social relations between the rural and urban areas [
9].
Additionally, rural out-migration presents development consequences for both the source and the destination areas, which are mostly urban. Although there is no clear-cut definition of what is rural and what is urban, this study adopts the definition of an urban area according to what the Government of Uganda (GoU) lists as a city, municipality, town council, or town board. All of the other localities beyond the administrative boundaries of the listed urban centers are considered rural areas in this study. The rural areas in Uganda are dominated by farming activities, which support the livelihoods of over 89% of the rural population [
20]. Therefore, continued rural out-migration, particularly of the rural youth, would result in a shortage of agricultural labor. This decrease in labor could potentially negatively affect farm productivity [
21], as the management of agricultural production increasingly depends on the aging and elderly population. The youth have a relatively greater capacity to apply innovative farming and production practices [
22,
23]; thus, their rural out-migration would lead rural agricultural households to lose a vital and dynamic share of their workforce. Given this linkage between migration and agriculture in the rural areas of Uganda, it is important to understand the motivations for rural out-migration.
At the destinations, which are mostly urban areas, the influx of rural out-migrants drives urban population growth. When this urbanization process is poorly managed, it contributes to rapid unplanned urban expansion and slum development with the associated negative social, economic, and environmental effects. These effects include crime, congested settlements and traffic, urban poverty, poor sanitation [
24,
25], and degraded natural resources; for example, papyrus wetlands [
26].
Addressing these consequences of rural out-migration requires an evidence-based policy that steers migration towards sustainable forms. This can include promotion of integrated rural and urban development, better-planned and -controlled growth of urban areas, the creation or strengthening of area-based social and economic amenities, and overall integrative rural development in order to empower the social and economic welfare of the rural population. To support such a policy, it is necessary to obtain better insight into the motivations for rural out-migration with an understanding of who out-migrates (or is likely to) and why. The overall objective of this study is, therefore, to gain a better understanding of the motivations for rural out-migration in Uganda. This paper takes the Ankole sub-region in western Uganda as a case study and answers the following research questions.
Who migrates? What type of household sends its member(s) as out-migrants?
What are the preferred destination areas for the rural out-migrants from the study area?
Why rural out-migration? What are the perceived reasons for rural out-migration from the study area?
2. Study Area
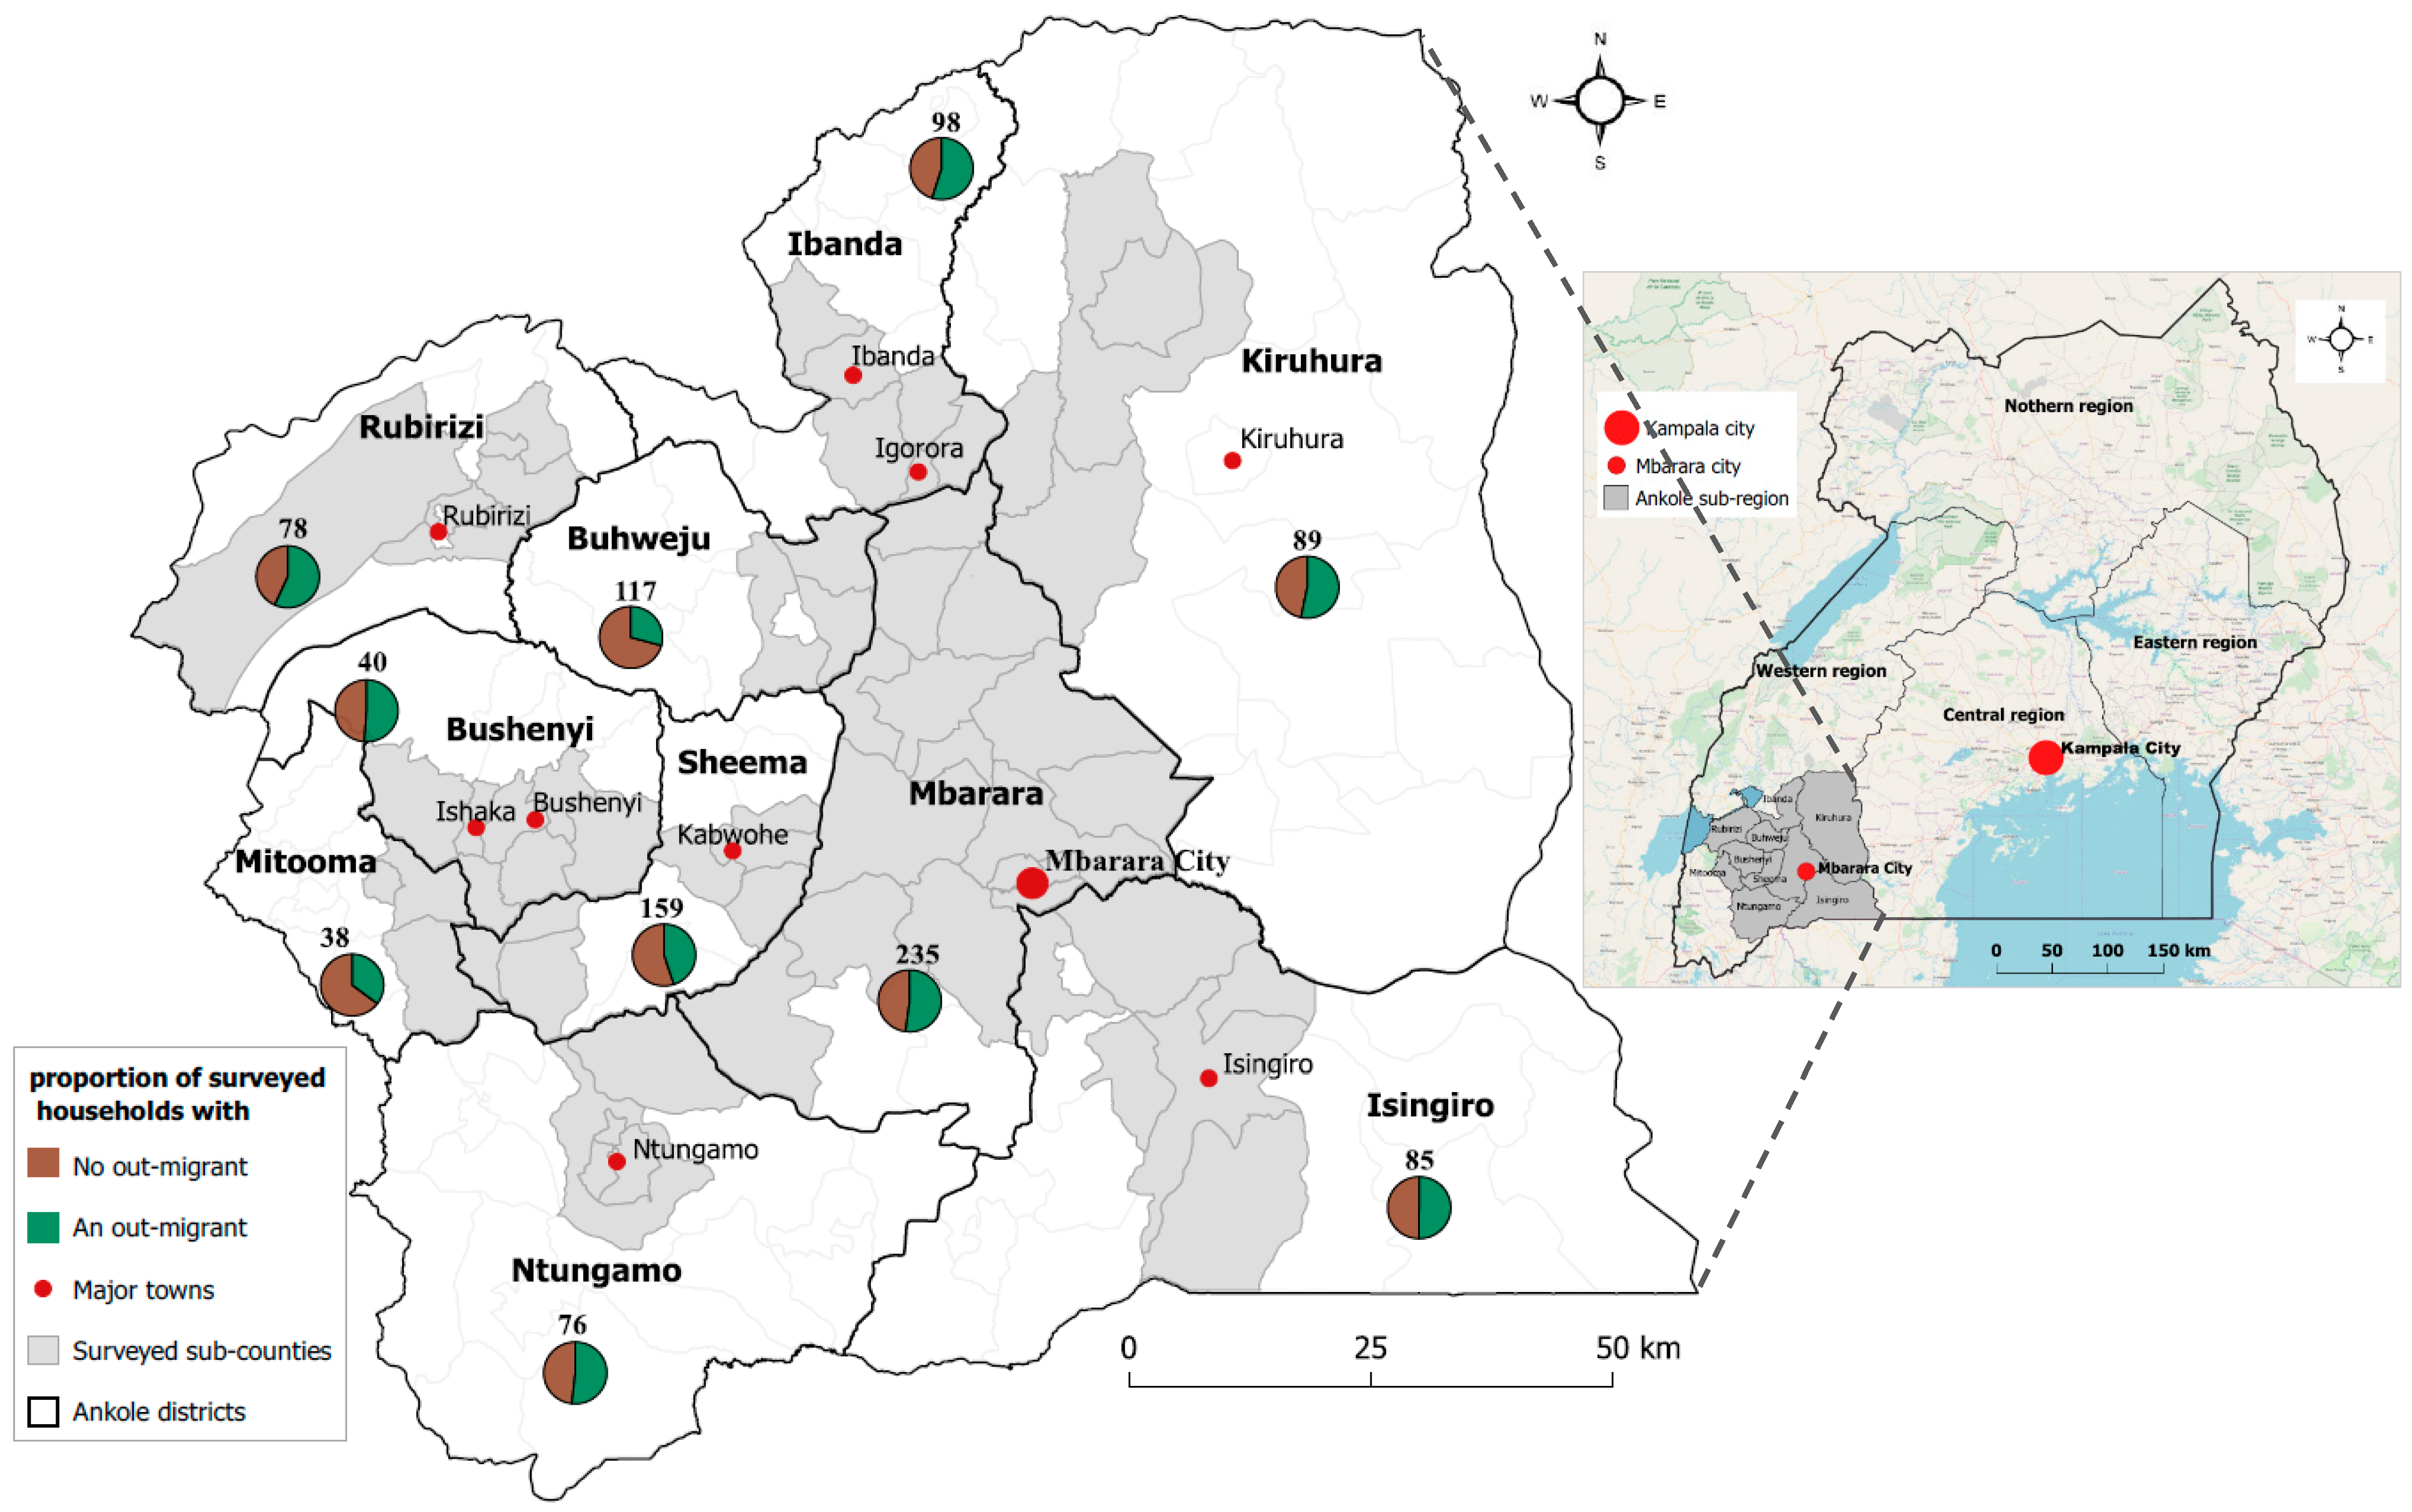
The study was conducted in the Ankole sub-region in western Uganda (
Figure 1). The Ankole sub-region was selected as a case study area because it is representative of many sub-regions in Uganda in terms of out-migration and urbanization rates. During the 2014 national census, the Ankole sub-region had an out-migration rate and urbanization level of 11.2% and 26%, respectively [
18]. This level of urbanization reflects the national average of 25% [
16]. At the time of the survey (i.e., February to August 2019), the sub-region consisted of ten administrative districts (12 in 2020), with an estimated total population of 3.2 million people and a population density of 223 persons/km
2 [
16]. The sub-region is predominantly rural, although it has a fast-growing urban population, which grew from 8.2% in 2014 to 26% in 2019 [
16].
On the one hand, the sub-region’s urban structure consists of one city (Mbarara city) with about 300,000 inhabitants, five fast-growing municipalities with a population size of at least 100,000 inhabitants, and 31 town councils with a population size of at least 5000 inhabitants [
15]. Mbarara city is a major town that serves as the regional city and is located about 267 km west of Kampala city (
Figure 1). The city, municipalities, and town councils serve as centers for administrative, social, and economic services. They host the decentralized and local government administration offices, the health institutions (public and private hospitals), the educational institutions (schools, colleges, and universities), and the economic infrastructures (industries, factories, banks, and markets) [
14]. Relative to the rural areas, these towns offer better opportunities for economic participation in both the formal and informal economic sectors.
On the other hand, the rural areas are dominated by farming activities; over 89% of the households are engaged in subsistence agriculture [
20]. Crop farming—mostly bananas and coffee—dominates the agricultural landscape in all districts, apart from in the Kiruhura district, which is dominated by livestock farming. In the Bushenyi and Buhweju districts, a few farmers are undertaking commercial tea growing. In addition, in these two districts, there are four rural-based tea-processing factories that offer employment opportunities, especially to casual laborers from the host and neighboring communities. The Buhweju district also has mineral deposits (mainly gold, tin, and kaolinite), making artisanal mining one of the economic activities in its rural communities.
3. Materials and Methods
3.1. Data Collection
The household-centered New Economics of Labor Migration (NELM) framework [
27] and an empirical assertion from a migration study [
28] argue that the decision to migrate can be made by all household members together in order to send a member (or members) as migrant(s). Similarly, in this study, we considered the out-migration of a household member to be a collective household decision. Therefore, we collected and analyzed data at the level of a household. We defined a household as a group of people of the same family living together in the same housing unit and sharing meals [
29] for at least the last 12 months. We considered this period to avoid the inflation of membership due to short-term visitors.
A total of 1015 rural households (
Figure 1) located in 61 sub-counties were surveyed between February and August 2019. The sample size per sub-county (a collection of rural villages) was proportional to the corresponding number of households. We preferred sub-counties that were at least connected to the inter-district road network because good road connectivity generally facilitates the movement of people and rural out-migration mobility [
30]. The determination of the total sample size for each sub-county followed a modified Cochran formula (Equation (2)) [
31]. We computed it by applying a 5% margin of error and 95% sampling confidence level to the total households in each sub-county. We used the Cochran formula:
where
n0 is the sample size, z
2 is the z-value for the 95% confidence level, p is the (estimated) proportion of the households with at least one migrant (in this study, p = 50%), q is 1 − p, and e
2 is the margin of error. Because the total number of households per sampled sub-county was small, we modified Equation (1):
where
n is the computed sample size and
N is total number of households per sampled sub-county.
The sampling frame: Within each sub-county, 4 villages were randomly selected and a list of households per village was created, out of which the households to be surveyed were randomly picked. A list of households per village was obtained from the village administration office (the local council one).
With a team of four trained enumerators, we conducted household-based interviews in the 10 districts of the Ankole sub-region. The enumerators were university graduates and natives and were thus able to fluently communicate in the local language in the study area. Using a structured questionnaire, we collected qualitative and quantitative data on the demographic, social, and economic characteristics at the household and community levels, on the migration history, and on the observed and perceived motivations for out-migration. The questionnaire contained both closed- and open-ended questions, including key (in reference to the study objective) questions on migration; for example, ‘If you or any of your household members were to migrate, what would be the reasons, what would be the preferred destination, and, if urban, what category of town would you prefer as your destination?’.
We pre-tested the questionnaire with 40 households in the Mbarara district to ascertain its appropriateness and completeness in capturing the intended survey data. We analyzed the pre-test survey data and accordingly rephrased some questions (particularly on household income) to improve their understandability and clarity. Specifically, we noticed that respondents were sensitive and often uncomfortable about accurately revealing their monthly income. Instead, they could easily provide their consumption expenditures. Moreover, there were no books of records to use to enable the validation of the reported income. Therefore, we considered a household’s daily expenditure as an indirect measure of the household’s income level [
32]. Apart from these data on household income, the rest of the data collected during the pre-test survey were comprehensive and, therefore, considered for analysis in the study.
We traced the sampled households with the guidance of a local guide. We would first explain the study’s purpose, seek the respondent’s oral consent to be interviewed, and then proceed with the interview. In most cases, the respondents were household heads (80% male and 20% female), but in their absence, we interviewed the most senior and knowledgeable household member. For each household, GPS coordinates were taken in the event that future follow-up was required. There were no records of refusal or withdrawal from participation in the interviews. Each household interview lasted, on average, 45 min. Generally, the ethical guidelines were adhered to, including free informed consent, the possibility to withdraw at any point, confidentiality, and data security.
3.2. The Independent Variables Considered in the Study
The variables considered to estimate the likelihood for a household to have an out-migrant were derived from the reviewed literature. These included variables that describe the demographic, social, and economic characteristics of the household and the community in which the household is located, as well as the physical/environmental factors. The demographic variables included the gender of the household head (male), household size (lager in size), household migration history (yes), age of the household head (older), and dependency ratio (lower ratio), which typically contribute to the household’s out-migration likelihood; the status referenced in the parentheses leads to a greater likelihood of a household having an out-migrant [
30,
33,
34]. In the case study area, generally, households are headed by males because of the Ankole cultural norms, and household membership is greater than the national average at 4.7 members [
17]. In most developing countries, including Uganda, households with a member in remunerative occupation are likely to have out-migrant [
35]. Likewise, households with educated members are likely to have out-migrants [
30,
33]. Over 89% of the rural households in the study area depend on agriculture as the source of their livelihood; therefore, land is an important asset. As in other developing countries—for example, in Tanzania [
30], Ethiopia [
33], and Bangladesh [
34]—the size of a household’s farmland can influence whether a household would send its members as out-migrants. Generally, the bigger the farmland is, the less likely it is for the household to have an out-migrant [
30,
33]. At the level of the household or household member, income largely shapes many socioeconomic choices and outcomes, including migration decisions [
36]. On one hand, the desire to migrate declines as income level is increases [
37]. On the other hand, a household with a high income can afford migration costs and is thus likely to have out-migrants [
33]. Therefore, the household income level can either facilitate or hinder out-migration. Community-level characteristics that can contribute to a household’s out-migration likelihood include the level of remoteness (represented by travel distance to the nearest urban center), availability of social services and infrastructures, as well as the quality of social services provided, availability of natural resources that support livelihoods, and the degree of functioning. Generally, close proximity to an attractive urban center enhances migration [
38]. For social services, ready access to and satisfaction with the quality of social services in the community hinder out-migration [
39]. Degraded natural resources that can no longer support dependent livelihoods can induce rural out-migration as households seek to diversify or engage in alternative livelihoods [
39]. These and additional factors computed from the survey data were fitted in a logistic regression to establish the likelihood of rural out-migration from the Ankole sub-region.
3.3. Statistical Analysis
We undertook a descriptive and inferential statistical analysis using the StataMP (version 16) analysis tool. To explore the data descriptively, we computed and compared frequencies, means, and percentages for the surveyed households with a migrant and without a migrant. We undertook cross-tabulation and interpreted the Chi-square statistics to establish the association between the binary variable, ‘a household having an out-migrant or not’, and the independent variables considered. For the variables that were measured on a continuous scale, we calculated Spearman’s correlation statistic. We set the significance level to p = 0.05 for all of the tests.
To assess the likelihood of out-migration at the household level, we undertook a logistic regression analysis [
40]. In this study, the binary dependent variable is whether or not the household has a migrant. The logistic regression function thus takes the form:
where P denotes the probability of a household having an out-migrant,
is the regression coefficient, and
…
are the independent variables describing the demographic, social, and economic characteristics of the surveyed households and the communities where the households are located. We also considered the physical/environmental factors, such as the natural resource degradation status. We acknowledge that the effects of the interactions of some of these predictor variables would contribute to the likelihood of out-migration from a household; however, when we tested for collinearity, there was no perfect multi-collinearity for most variables. In addition, our interest was in establishing the likelihood of out-migration with the effects of all variables considered. The output of this regression function is a probability value between 0 and 1, which is interpreted as the likelihood for a household to have an out-migrant given the independent variables.
We randomly split the surveyed households into two sub-datasets—one consisting of 811 data cases to allow model fitting, calibration, and estimation, and the other consisting of 204 data cases to allow model validation. We then used the calibration dataset and undertook variable selection and model fitting in three steps. First, we undertook a bivariate analysis for all of the variables. Here, we fitted each variable alone and recorded the corresponding regression estimate and level of significance. Second, regardless of the statistical significance at the bivariate analysis level, we fitted all independent variables into a full multivariate logistic model. We further inspected the model for possible collinearity in the variables for which the interpretability of the estimated coefficients and associated significance levels greatly changed in comparison to the bivariate-level analysis. As such, for any two variables that were found to be correlated, one would be dropped and the other further considered for the reduced final logistic model. Our decision to consider a given variable would be based on the theoretical relevance to the prediction of rural out-migration. Third, we fitted all of the remaining independent and statistically significant (p < 0.05) variables into a final reduced logistic model.
The surveyed households were nested within districts; therefore, we expected them to be correlated with each other due to the shared district-level random effects. To account for these district-level random effects, we considered a mixed-effect logistic regression model structure. In addition, to evaluate how well the fitted logistic model estimated the likelihood of a household having an out-migrant, we applied the fitted final reduced logistic model to the validation sub-dataset (204 surveyed households), generated a receiver operating characteristic (ROC) curve, and interpreted the area under the ROC curve (AUC).
4. Results
4.1. Household Demographic Characteristics
In all of the surveyed households, the membership size ranged from 2 to 14, with an average of 6.4 (95% confidence interval (CI), 6.30, 6.57) household members. This household membership reflects the national average of 4.7 members [
17]. The average membership sizes for households with a migrant and those without a migrant were 6.7 (95% CI, 6.65, 6.85) and 6.2 (95% CI, 6.03, 6.40) members, respectively. Regarding the gender of the household head, there were four times as many male-headed households as female-headed households. This ratio was the same among the surveyed households with an out-migrant and those without an out-migrant. A test for the level of association between the gender of the household head and whether the surveyed household had an out-migrant or not indicated that the two variables were independently associated X
2 (1,
N = 811) = 0.015,
p = 0.903. The number of dependents in the surveyed households ranged from 1 to 9, with an average of 6 [95% CI, 5.93, 6.12]. The average number of economically active household members (of working age) was 3 [95% CI, 3.01, 3.22] members. Thus, the average dependency ratio was 2.0 [95% CI, 1.95, 2.09], implying that every household member of working age had at least two dependents to support. The Mitooma and Bushenyi districts had, respectively, the highest average number of dependents (3.6) and the lowest (2.6; 95% CI, 2.35, 3.03).
4.2. Household Social and Economic Characteristics
The average age of the reported out-migrants was 28 years [95% CI, 27.89, 29.01], implying that it was the economically active youths that had out-migrated. Ninety-two percent of the reported out-migrants moved to urban areas within the country, whereas 4% moved to other rural areas, and 4% were reported as international migrants. When asked how the migration decisions were made, 84% of the surveyed households with out-migrants responded that the migration decisions were made collectively by the household. Additionally, when asked if any of the household members were likely to out-migrate in the next 12 months, 44% of the surveyed households indicated that they were likely, 9% were not sure, and 47% were unlikely to send an out-migrant. Interestingly, 83% of the households that already had an out-migrant indicated that they were likely to send another member as an out-migrant.
The most educated members of the majority (74%) of the surveyed households were in the classification category of literate and (un-)semi-skilled. The Mbarara district had the biggest proportion (22%) of surveyed households with literate and (un-)semi-skilled members, whereas the Mitooma district had the smallest proportion (4%). Of the total of 232 households that reported that their most educated member belonged to the literate and skilled category, 62% were from households that had at least one migrant. Sheema had the biggest proportion (23%) of surveyed households with literate and skilled members. A test for the level of association between the education level of the most educated household member and whether the surveyed household had a migrant indicated that there was a significant association between a household having an out-migrant or not and the household’s educational background X2 (2, N = 811) = 22.176, p = 0.001.
Regarding the households’ main occupations and livelihood sources, the majority (67%) of the surveyed households were engaged in farming activities. This observation was the same within all of the districts of Ankole, where farming was reported as the dominant occupation. Formal employment was reported by 11% of the surveyed households as their main occupation type. In this occupation category, twice as many surveyed households had an out-migrant (67%) compared to those without (33%). In contrast, the numbers were almost equal for the other occupation categories (trading and business, formal employment). In addition to the main occupation activities, 63% of the surveyed households reported diversifying their household income sources. Some of the secondary income sources mentioned included artisanal mining (specifically in the Buhweju district), sand mining, stone quarrying, brick making, occasional wage employment, and remittances. Despite the income diversification, only 55% of all of the surveyed households could afford a daily consumption expenditure of above 1.9 USD per person (the World Bank’s international poverty line).
In relation to the farming occupation, 97% of the surveyed households owned their farmland, while 3% were renting. The average land holding per surveyed household was 4.7 [95% CI, 4.45, 5.06] acres. A comparison at the district level revealed that households in Kiruhura had the largest average land holdings of 6.5 [95% CI, 5.05, 8.03] acres, while the Rubirizi district had the smallest with 3.2 [95% CI, 2.39, 3.94] acres. The main land-use types reported were crop fields, pastures, plantation forests, and built-up areas, such as homesteads. There were no reported cases of abandoned land. Regarding the status of land productivity, 69% of the surveyed households reported an observed decrease in land productivity in the last 5 years. The majority (72%) of the respondents in the farming occupation also mentioned that their agriculture-based livelihoods were no longer sustainable due to the declining agricultural productivity and the degradation of natural resources. Because of this, they reported that they engaged in alternative activities to support their livelihoods, including migration.
The house types (used as a proxy indicator of the household’s standard of living) recorded in the study area included temporary, semi-permanent, and permanent houses. About half of the surveyed households were residing in permanent houses, while 38% and 12% were living in semi-permanent and temporary houses, respectively. Temporary houses were commonly observed in the Buhweju and Rubirizi districts, accounting for 15% and 17% of the surveyed households, respectively.
4.3. Social and Physical Characteristics at the Community Level
In response to the question, “If you or any of your household members were to migrate, what would be the preferred destination, and if urban, what category of town would you prefer?”, 94% of the surveyed households preferred an urban center, while 6% mentioned another rural area as their preferred migration destination. Of those that preferred an urban center, 51% indicated the nearest municipality, while 28%, 20%, and 1% preferred the regional city (Mbarara city), the capital city (Kampala), and international city as their destination towns, respectively.
Given that the nearest municipality was the destination town that was most preferred by the respondents, we generated the shortest road travel distance from the location of the surveyed household to the nearest municipality. The nearest surveyed household was located 3 km from the nearest municipality, while the furthest was 128 km away. The average distance to the nearest municipality was 39 km [95% CI, 47.19, 51.28] for the households that reported an out-migrant and 63 km [95% CI, 60.62, 64.71] for the households that reported no out-migrants.
We also generated the distances to the nearest educational and health institutions. Overall, 40% of the surveyed households were within a radius of 5 km from the nearest health center, while 45% and 15% of the surveyed households were within a radius of 5–10 km or greater than 10 km, respectively. In five districts (Sheema, Mbarara, Ibanda, Isingiro, and Rubirizi), over half of the respondents were located within 5 km from a health center. With respect to schools, 22% of the surveyed households were within a radius of 3 km from the nearest school (mostly primary school), while 48% and 30% were within a radius of 3–5 km or greater than 5 km, respectively, from the nearest school. The average distances to the nearest primary, secondary, and tertiary schools in the study area were 2.9 [95% CI, 2.74, 3.03], 8.4 [95% CI, 8.27, 8.63], and 29.7 km [95% CI, 28.97, 30.05], respectively. Comparatively, the surveyed households in Sheema and Bushenyi districts were had the shortest distance to a tertiary institution, with average distances of 22.7 [95% CI, 21.38, 23.01] and 26.1 km [95% CI, 25.98, 27.14], respectively.
All of the surveyed sub-counties were already connected to the national electricity grid. However, only 35% of the surveyed households had an electrical supply in their houses. The majority (65%) of the surveyed households used alternative lighting and energy sources, including solar sources (24%), kerosene (33%), and wood fuel (8%). The proportion of the surveyed households already connected to the national electricity grid was highest in the Sheema district (67%) and lowest in the Mitooma district (8%). Regarding sources of clean water for domestic use, 47% of the surveyed households were already connected to the national piped water system. Again, Mitooma district had the lowest proportion of households (24%) connected to the national piped water supply, while Rubirizi district had the highest proportion (72%) of the surveyed households.
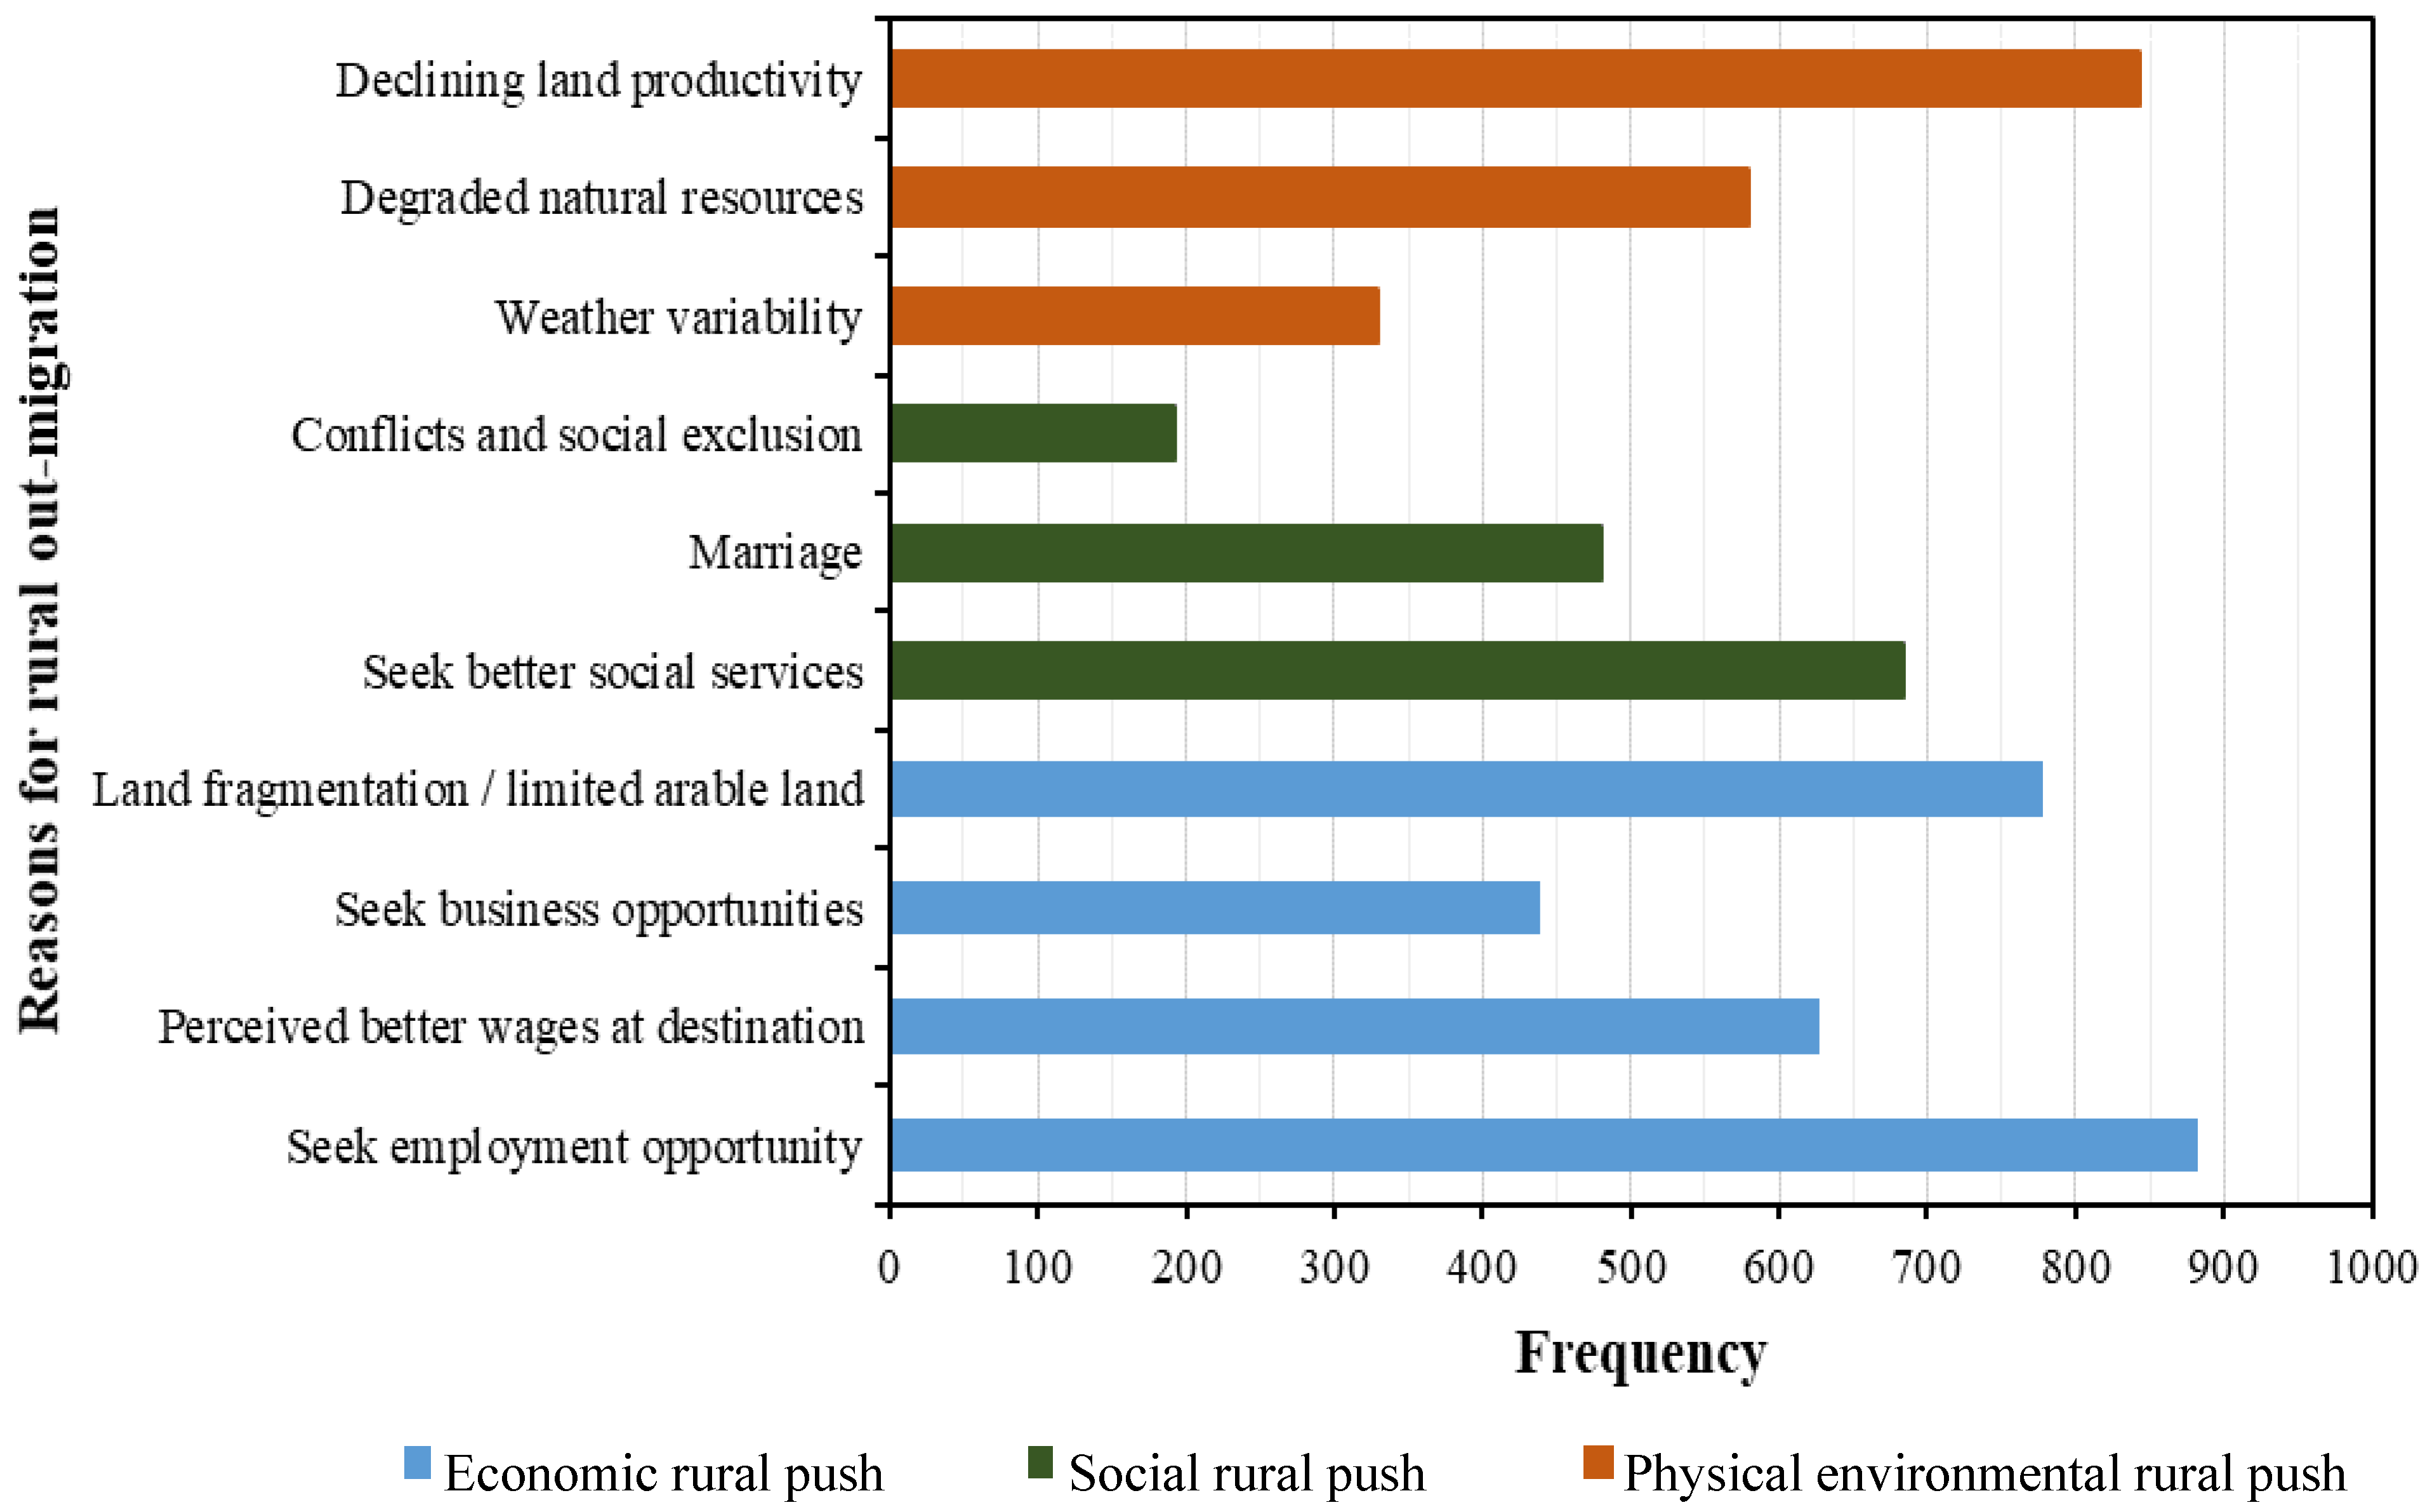
4.4. Reasons for the Rural Out-Migration Push
We categorized the most frequently mentioned reasons for rural out-migration into broad categories: economic, social, and physical/environmental reasons (
Figure 2).
4.4.1. Economic Reasons for the Rural Push
The majority (87%) of the respondents—especially the educated—mentioned that they would migrate away from the community and go to other areas where they could find employment and work opportunities. In addition, they mentioned that there is a rural–urban difference in terms of opportunities for productive employment and work, with urban areas offering better opportunities. Moreover, 71% of the respondents perceived that there were better wages at the migration destinations, which were mostly the urban areas.
Another popular reason mentioned (77%) for rural out-migration was that arable land was becoming limited, making it difficult for households to generate adequate income from farming activities. The respondents attributed the limitation of sizeable farming land to two factors. First, more agricultural land was required to produce food to feed the rapidly growing population. Second, land sizes were shrinking due to the cultural practice of dividing land among household members, leading to land fragmentation and diminutive plots that could no longer support farming at a scale adequate for sustaining a household’s food and financial needs. In addition, 72% of the respondents in the farming occupation mentioned that their agriculture-based livelihoods were no longer sustainable, and therefore, they engaged in alternative income-generating activities, including business and trade. As such, rural out-migration to seek business and trade opportunities, preferably in urban areas, was another reason mentioned (43%) by the surveyed households.
4.4.2. Social Reasons for the Rural Push
The social reasons mentioned for rural out-migration in the Ankole sub-region included seeking better social services, marriage, and freeing from conflicts and social exclusion. About 67% of the surveyed households mentioned the (perceived) easier access to social services and infrastructures as a reason for rural out-migration. Out-migration because of marriage was another social reason for rural out-migration (47%) mentioned by the surveyed households. In addition, social conflicts and exclusion, especially at the household level, were mentioned by 20% of the surveyed households. These respondents further mentioned land disputes (related to ownership rights and user access) over family land as the major form of social conflict. Social disputes over land as a reason for rural out-migration were mostly mentioned in the Rubirizi (52%), Buhweju (47%), and Isingiro (46%) districts.
4.4.3. Physical/Environmental Reasons for the Rural Push
About 57% of the surveyed households mentioned that most of the communities’ natural resources (including land, swamps, forests, and the Rwizi River catchment) were degraded and could no longer sustainably support their natural-resource-dependent livelihoods, leading them to seek alternative means of making a living, including migration. Rural out-migration induced by degraded natural resources was mostly mentioned by the respondents in the Buhweju (23%), Ntungamo (22%), and Isingiro (20%) districts. Relatedly, 83% of the surveyed households reported a declining land productivity on their farmed plots due to soil erosion and variability in the weather. They further reported—mostly (51%) in the Isingiro district—that this declining land productivity contributed to food shortage and reduced income from farming, thereby inducing rural out-migration as a coping strategy.
4.5. Estimation of the Likelihood of Rural Out-Migration
The logistic regression estimates and the associated levels of significance for most of the predictors remained consistent in both the bivariate and multivariate analyses (
Table 1). This implies a low possibility for the presence of inter-correlation among the predictor variables. The demographic, social, and economic factors of household size, dependency ratio, educational background, main occupation and years spent in the occupation, land size, income level, diversification of income sources, and standard of living were significant in estimating the likelihood of an out-migrant in the households, as hypothesized. At the community level, distance to the nearest town (municipality) and level of satisfaction with the quality of public services and infrastructure were the significant predictors for rural out-migration (
Table 1).
4.5.1. Household-Level Factors
We found that an additional household member could result in chances of having an out-migrant that were 1.07 times greater. A unit increase in the dependence ratio decreased the likelihood for out-migration by a factor of about 0.39. Households whose head or most members were in formal employment had 1.83 times greater chances of having an out-migrant compared to those mainly preoccupied by farming activities. Relatedly, an additional year spent undertaking the household’s main occupation increased the likelihood of having an out-migrant by a factor of 1.02. Regarding the households’ educational backgrounds, households with at least one graduate of a tertiary education institution were 1.78 times more likely to have an out-migrant than those with illiterate members.
We used the households’ daily expenditures as an indirect measure of their income levels and found that households that could afford a daily expenditure of more than 1.9 USD per member were 1.60 times more likely to have an out-migrant than households whose daily expenditures was below that threshold. Households who diversified their income sources were 26% more likely to have an out-migrant than those who did not. Households that were characterized as having either medium or poor standards of living had lower chances of sending an out-migrant by 0.33 or 0.45 times, respectively, compared with those with a good standard of living. Regarding the size of the land owned by the households, we estimated that an additional hectare of land increased the likelihood of a household having an out-migrant by a factor of 1.13.
4.5.2. Community-Level Factors
An additional kilometer away from the nearest municipal town lowered (0.95 times) the chances of a household having an out-migrant. Regarding the households’ perceived levels of satisfaction with the quality of public services and the state of public infrastructures in the community, we found that households that were generally satisfied with the quality of the public services were less likely to have an out-migrant. A household with an average perceived level of satisfaction with the quality of public service within the community was 0.32 times less likely to have an out-migrant than a household that expressed dissatisfaction. In addition, a household that expressed satisfaction was 0.10 times less likely to have an out-migrant than a household that was dissatisfied.
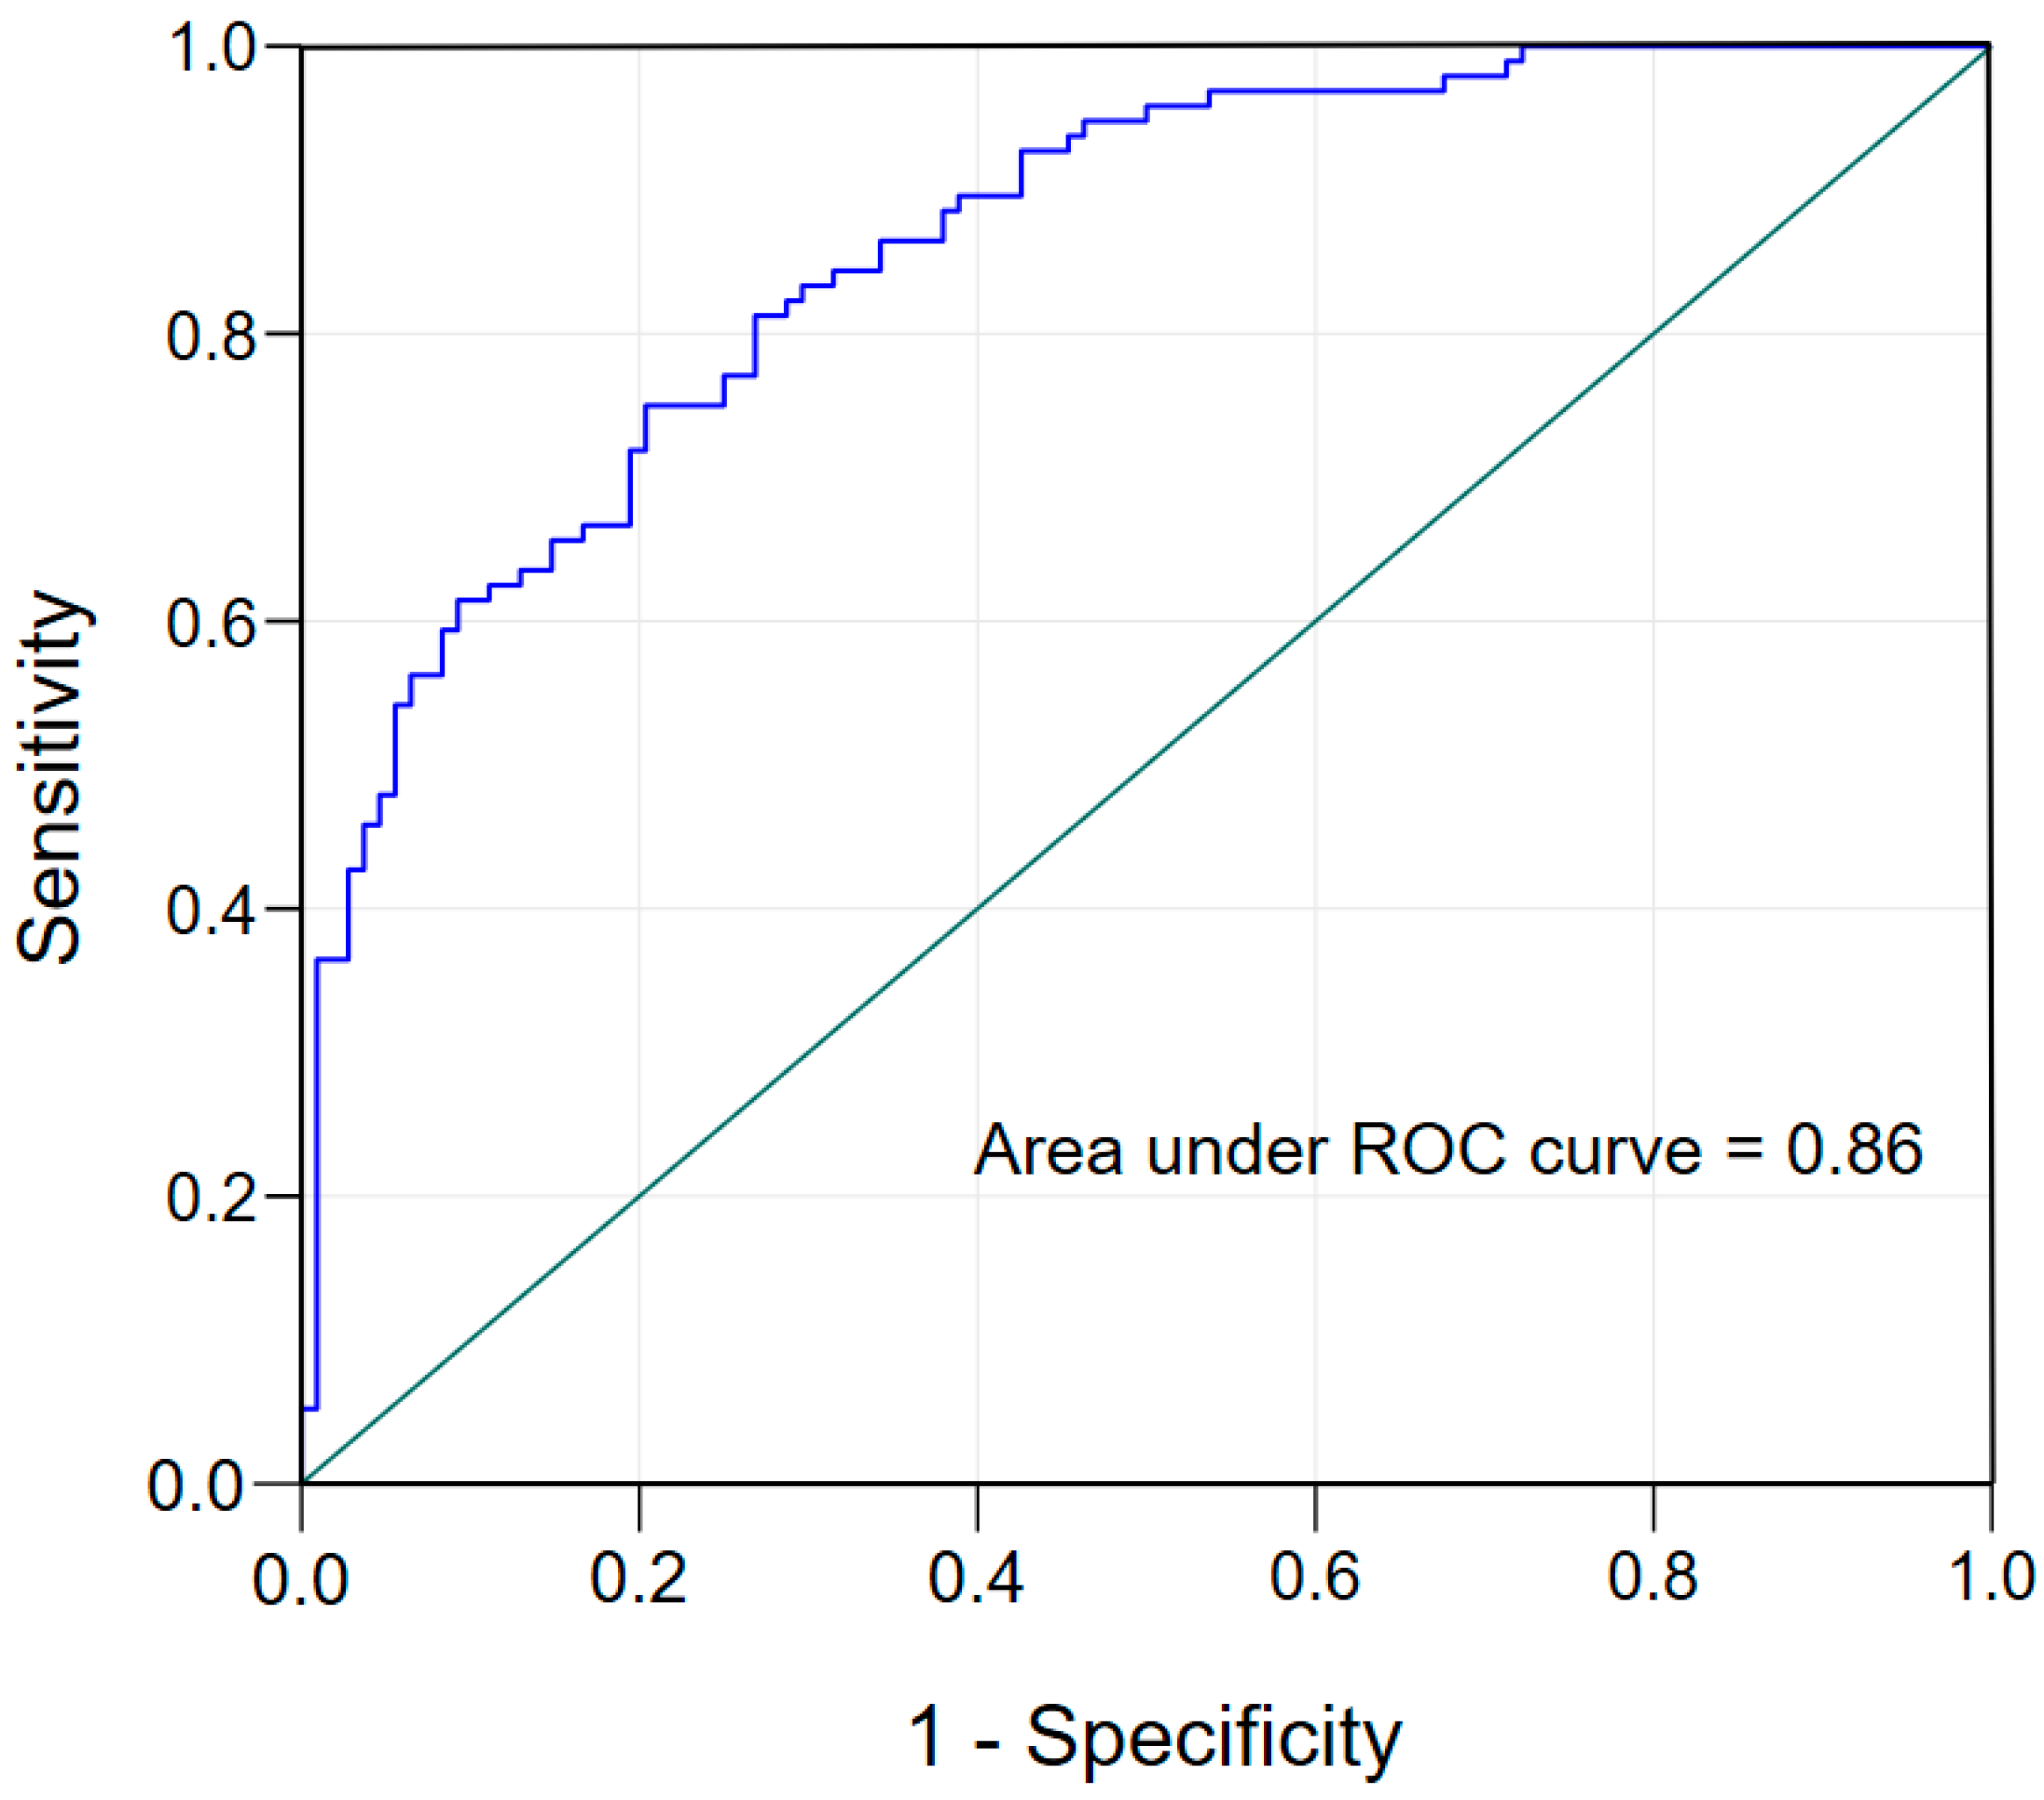
4.6. Performance Evaluation of the Fitted Model
The plot of the coefficients estimated from the application of the fitted logistic model to the validation sub-dataset resulted in an ROC curve with an AUC of 0.86 (
Figure 3). This AUC approached 1, indicating that this was a well-fitted model with overall robust estimation power for household out-migration.
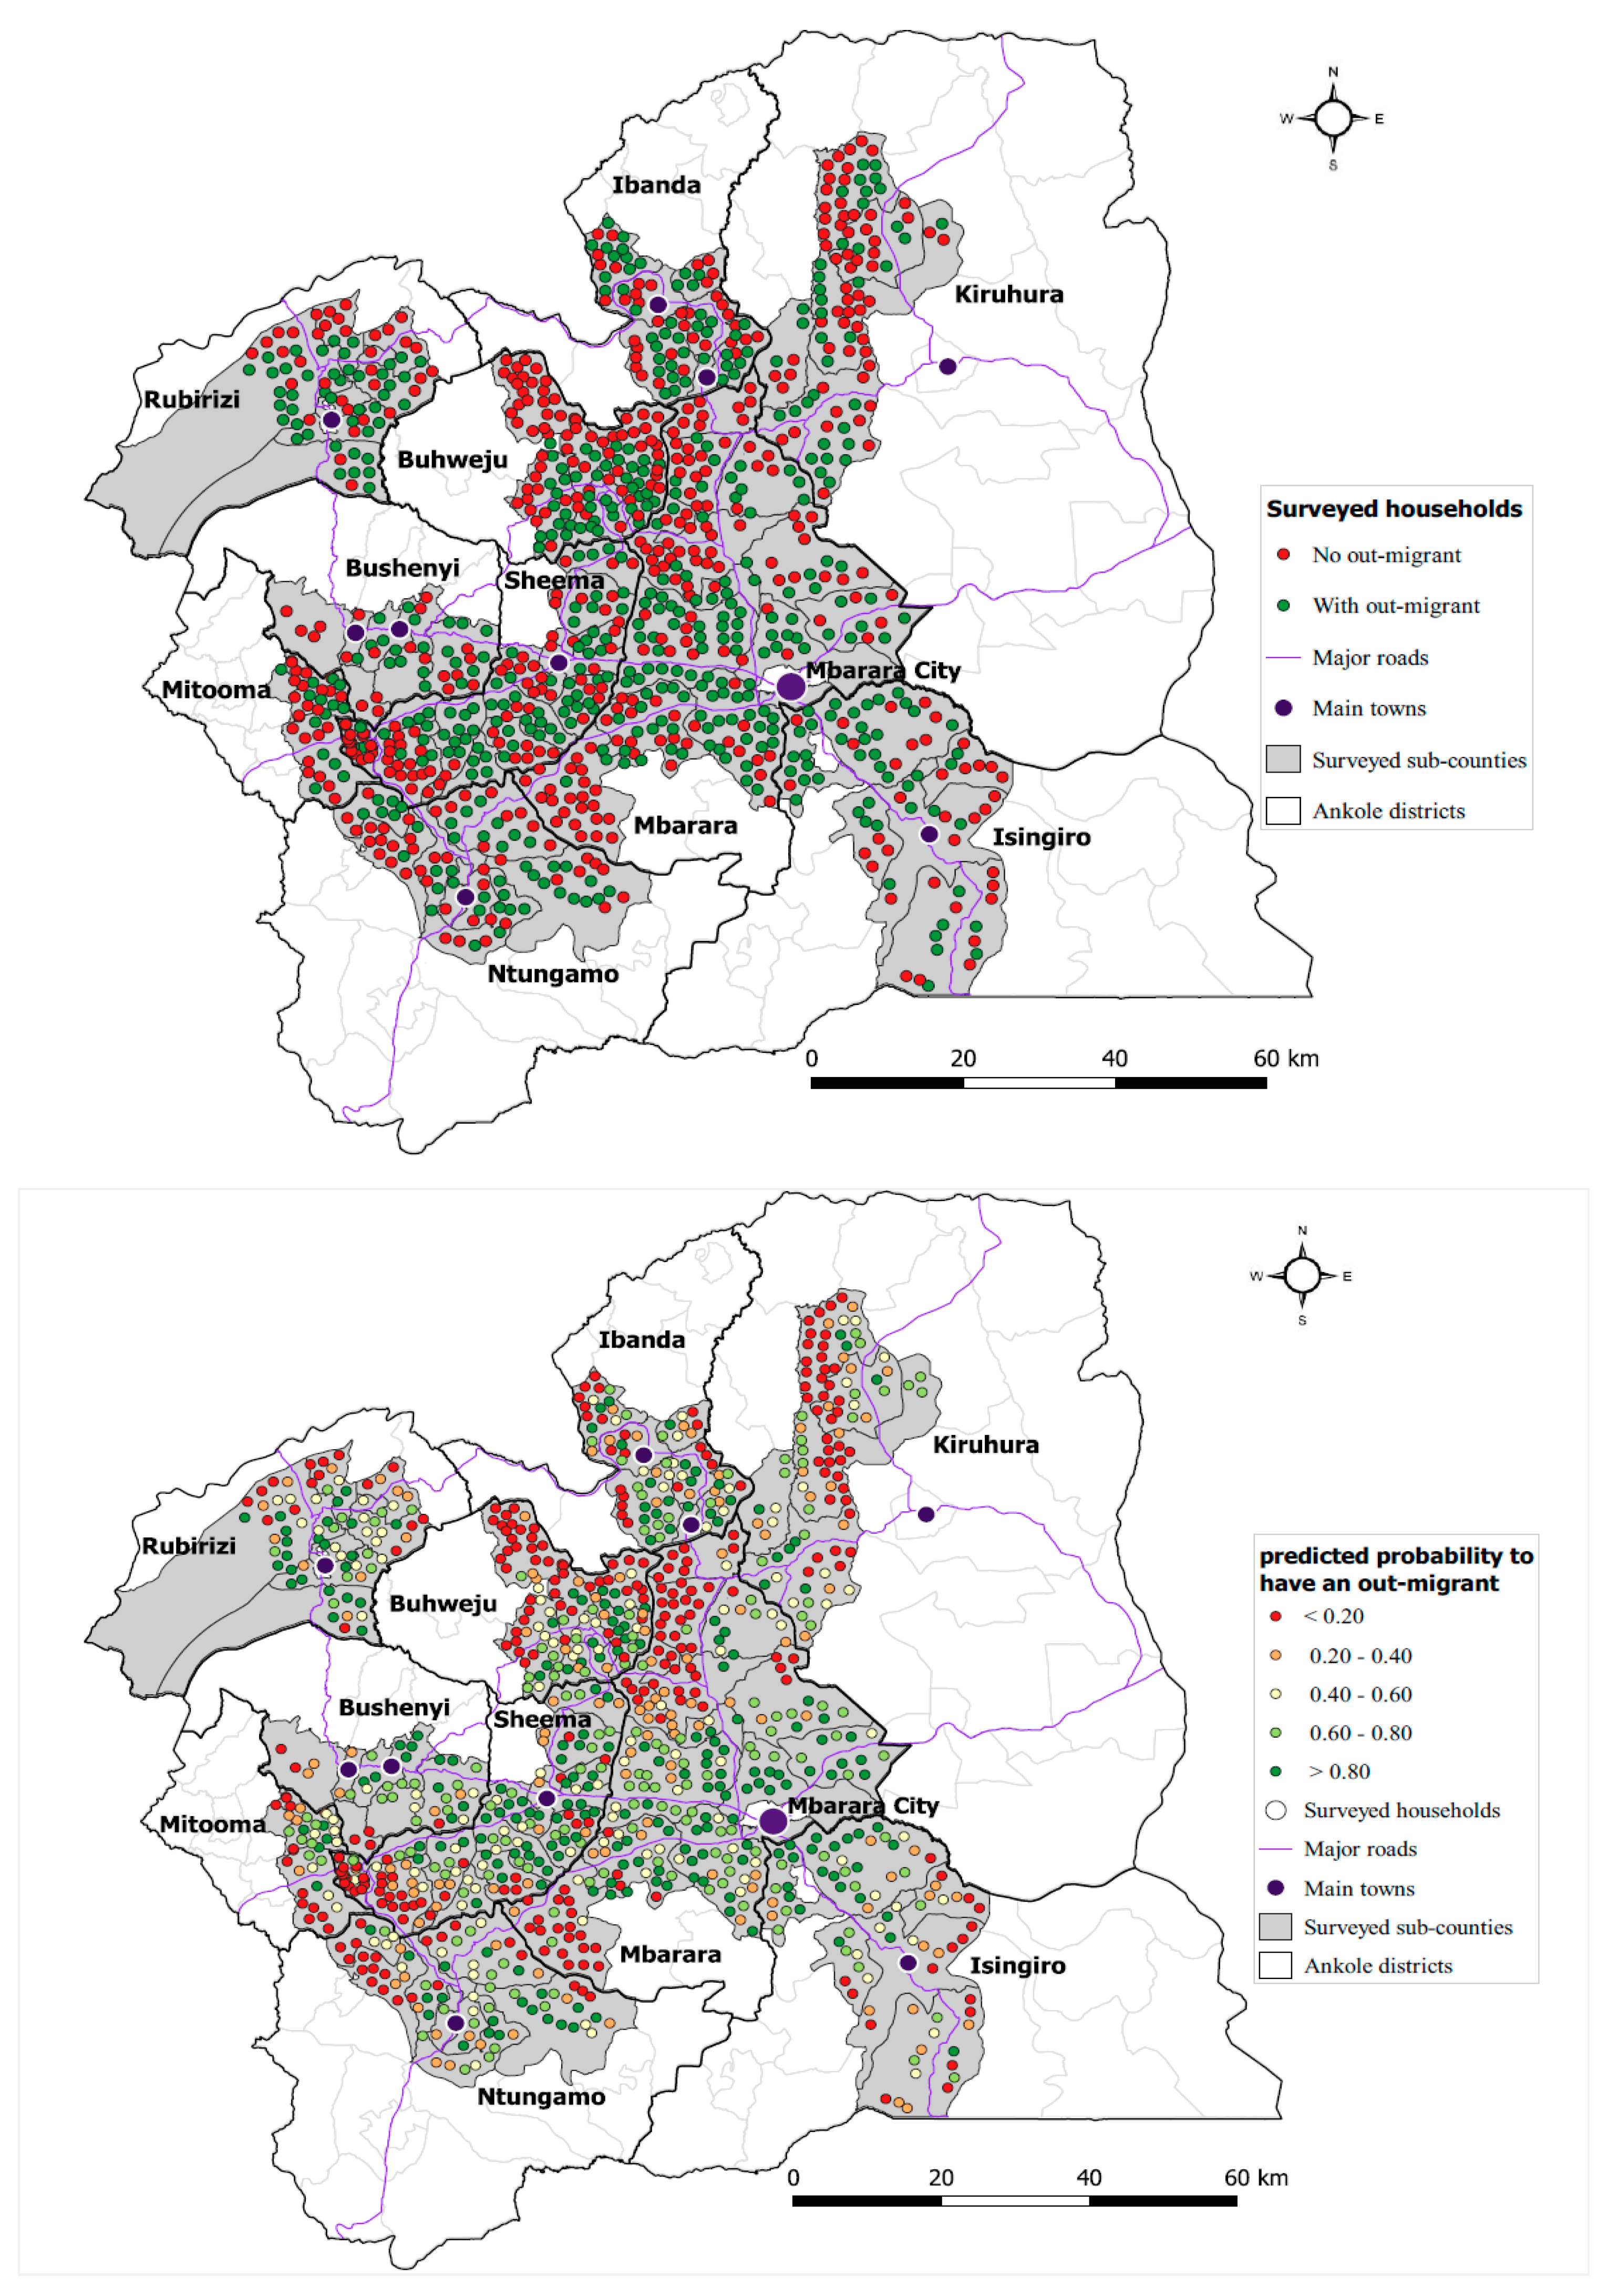
Furthermore, the comparison of the estimated likelihood of out-migration and the observed (during the field survey) occurrence of out-migration showed consistency for the surveyed households (
Figure 4). It is interesting to note that the households that were located in remote rural areas were both observed and predicted to have a low likelihood of having an out-migrant. Close proximity to the municipal town enhanced the likelihood of a household having an out-migrant (
Section 4.5.2). Relative to rural areas, towns generally offer better welfare, social services, and opportunities for work, employment, business, and trade. Therefore, they act as attractive centers for rural dwellers who are searching for better social services and livelihood opportunities. Another observation was that households that were located relatively far away from the main road network were both observed and predicted to have a low likelihood of having an out-migrant. This observation highlights the role of the road network in enhancing local mobility and facilitating the travel of people, thereby promoting rural out-migration.
6. Conclusions
In this study, we estimated the likelihood of a rural household sending an out-migrant and gained insight into who out-migrates from the rural areas in the Ankole sub-region of Uganda. We found that poorer households involved in subsistence farming and those located in remote rural areas were less likely to have an out-migrant. Generally, rural out-migrants were more likely to come from larger, wealthier households with educated and (semi-)skilled members. Households that sent out migrants were located in areas with good road networks, and were also in close proximity to urban centers, especially the municipalities of the sub-region. This study also inquired about the preferred destination places of rural out-migrants and found that the majority preferred the nearest municipality over the capital city, Kampala.
A synthesis of the perceived motivations for rural out-migration revealed the major reasons to be seeking employment and business opportunities, seeking better social services, and diversification of household income sources. These reasons relate to the rural–urban social and economic divide, as well as to the fact that the majority of rural households can no longer sustain their agriculture-based livelihoods due to environmental degradation. We therefore assert that rural out-migration from the Ankole sub-region is primarily a livelihood strategy. Although rural out-migration in developing countries is commonly considered to be a livelihood strategy for the poorest rural dwellers [
9], this study asserts that rural out-migrants are more likely to come from better-off households that can adequately support the migration process. Therefore, rural out-migration from the Ankole sub-region in particular and from rural Uganda in general is not necessarily for the poorest sections of the communities, but also for the better-off households, which seek to diversify their means of making a living/household income generation through rewarding employment and business opportunities. The rural–urban inequality in relation to social services, work, employment, and business opportunities also contributes to the likelihood of rural out-migration.
Therefore, this study points out two policy implications for integrated rural development in Uganda. The first is the enhancement of wellbeing and human capital development in rural areas by extending and improving the infrastructures that provide the basic social services related to health, education, clean water, electricity, transportation, and communication. Second, in order to reduce socially disruptive long-distance migration, which leads to overcrowding and sprawls in the major cities, urban development investments should be oriented towards the upgrading of secondary towns, which are the most preferred migration destinations and offer rewarding employment and business opportunities.


 ,
, 


